Embed Size (px)
Citation preview

March 2017
India’s National Export Credit Agency
Investor Presentation

Investment Proposition
The India Story
The Exim Bank Story
1
2
3
Appendix 4
2
Presentation Outline

Section 1
Investment Proposition

India’s Engine for Growth of
International Trade
Management Strength
India: Strong & Sustained Economic Growth
EXIM: Proxy to Sovereign
Financial Highlights Policy Role in National Level
Investment Proposition
4
1
2
3 4
5

Section 2
The India Story

Resilient GDP Growth(1,4,5)
World’s 7th largest economy based on nominal GDP in 2016 (2)
o Nominal GDP for 2016: ~US$ 2.3 tn(2)
World’s 3rd largest economy based on GDP measured in PPP terms in 2016 (2)
o GDP in PPP terms for 2016: ~US$ 8.7 tn(2)
GDP growth rate for FY 17 estimated at 7.1%(4)
Favorable demographic profile: 66% of the population is between the age of 15 to 64 years (3)
Consumption demand which is driven by basic consumption remained strong
FYxx means financial year ended March 31, 20xx. Source: (1) Institute of International Finance (IIF) (2) IMF World Economic Outlook October 2016 and January 2017 Update. (3) World Bank Database. (4) Union Budget (5) Ministry of Statistics and Programme Implementation
1 India: Strong & Sustained Economic Growth
6
GDP Growth Rate (2)
7.6%
6.6% 7.2%
7.7%
6.9% 6.7% 6.5% 6.0%
2.6%
1.6% 2.3% 2.5%
3.2% 3.1% 3.4% 3.6%
2015 2016 2017(p) 2018(p)
India China United States World
No
min
al G
DP
(U
S$b
n)
18.5 18.2 18.3 17.4 17.0 17.0
32.5 31.7 30.8 30.0 29.7 28.8
49.0 50.0 50.9 52.6 53.2 54.1
1,823 1,829
1,863 2,042 2,074
2,231
6.7%
5.6%
6.6% 7.2%
7.9% 7.1%
FY12 FY13 FY14 FY15 FY16 FY17e
Agriculture (%) Industry (%)
Services (%) Real GDP Growth (%)

1
General Government Debt (% of GDP)(1)
Key Parameters FY2012 FY2016 Change
Gross National Saving (% of GDP)1 34.3 32.0* (230 bps)
Gross Domestic Investment (% of GDP)1 36.5 32.5* (400 bps)
Capital Expenditure (% of Total Expenditure) 3
12.2 14.1 190 bps
Revenue Deficit (% of GDP)3 4.5 2.5 (200 bps)
GNPA as % (Banking Sector) 3.06 7.94 488 bps
Exchange Rate (INR/US$, avg.)2 47.9 65.5 36.7%
Current Account Deficit(2)(3) Currency Movement(4)
CPI Inflation Rate(2)** Key Macroeconomic Metrices
Indian Economy: Key Economic Indicators
Source: (1) Institute of International Finance (IIF) Database.
(2) Reserve Bank of India, Press Release and Online Database (accessed online on 23/01/2017)
(3) Office of the Economic Adviser, Ministry of Commerce and Industry, Government of India.
(4) Reuters
* Data pertains to FY15 (as per latest available data)
** Base year for CPI Inflation for FY 12 is 2001=100; FY13-FY 16 is 2012=100 7
-78.2 -87.8
-32.3 -26.8
-22.1
-3.7
-4.2%
-4.8%
-1.7% -1.3% -1.1%
-0.3%
-6.0%
-5.0%
-4.0%
-3.0%
-2.0%
-1.0%
0.0 %
-100.0
-90.0
-80.0
-70.0
-60.0
-50.0
-40.0
-30.0
-20.0
-10.0
0.0
FY12 FY13 FY14 FY15 FY16FY17
(Apr-Sep)
Current Account Balance (US$ bn) % of GDP
8.3%
10.1% 9.3%
5.8% 4.9% 4.8%
FY1
2
FY1
3
FY1
4
FY1
5
FY1
6
FY1
7 (
Ap
r-D
ec)
CPI
0
100
200
300
Jan-12 Jan-13 Jan-14 Jan-15 Jan-16 Jan-17
Indian Rupee Russian Ruble
Brazilian Real Chinese Yuan
53.5 52.5 51.3 49.6 49.0 47.5
13.9 14.1 14.7 15.7 15.7 17.9
67.4 66.6 65.9 65.3 64.7 65.4
FY12 FY13 FY14 FY15E FY16F FY17FCentre State

India’s Twin Balance Sheet problem
Source: Economic Survey 2016-17, Bloomberg Database 8
Over Leveraged Corporates:
Investment-GDP Ratio soared by 11% points to 38% in four years to FY 2007-08;
Expectations of sustained double digit growth by corporates;
In three years to FY 2008-09, non-food bank credit doubled;
Surge in capital inflows, reaching 9% of GDP in FY 2007-08;
High Leverage for corporates accentuated by cost overruns;
Tightening of monetary policy due to rise in inflation:
Repo rates increased from 4.75% in April 2009 to 8.50% October 2011;
` Depreciation added to the stress in FC debt servicing:
USD/INR depreciated from 52.97 in February 2013 to 68.36 in August 2013;
By 2013, 33% of Debt owed by corporates with ICR < 1; increased to ~ 40% by 2015.
India’s Twin Balance Sheet problem
Source: Economic Survey 2016-17
**PRC 2016 Article IV consultation, IMF. 9
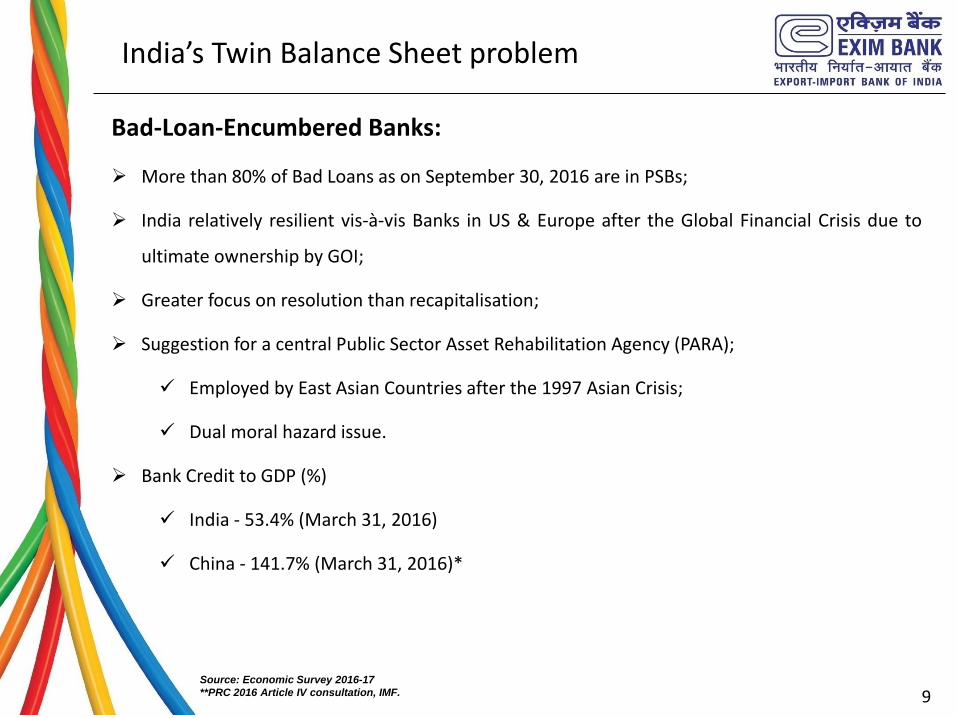
Bad-Loan-Encumbered Banks:
More than 80% of Bad Loans as on September 30, 2016 are in PSBs;
India relatively resilient vis-à-vis Banks in US & Europe after the Global Financial Crisis due to
ultimate ownership by GOI;
Greater focus on resolution than recapitalisation;
Suggestion for a central Public Sector Asset Rehabilitation Agency (PARA);
Employed by East Asian Countries after the 1997 Asian Crisis;
Dual moral hazard issue.
Bank Credit to GDP (%)
India - 53.4% (March 31, 2016)
China - 141.7% (March 31, 2016)*

82.9
155.0
40.0
34.1
36.9
38.9
33.2
38.7
31.7
56.5
24.7
26.6
20.6
14.1
20.4
25.7
90.1
99.7
Petroleum Crude & Products Electronic Items Chemicals
Machinery Gold Base Metals
Agricultural Products Ores & Minerals Others
Trend of Merchandise Trade(1) Trend of Services Trade(2)
Merchandise trade (exports + imports) as percentage of GDP has decreased from 44% in FY12 to 31% in FY16(1). India’s share in global merchandise trade stood at 2.0% (2015)(2)
India emerged as the 19th largest merchandise exporter in 2015; and accounted for 1.6% of global merchandise exports in the same year(2)
India is the 8th largest exporter of services in the world in 2015, accounting for 3.2% of global services exports(2)
1
(USS bn) (USS bn)
India’s Export Pattern(1)
US$306bn
India’s Import Pattern(1)
FY12
FY16
US$489bn
US$381bn
Sound External Sector
Source: (1) MOCI/IIF (2) World Trade Organization (accessed on 23/01/2017)
10
(US$ bn)
FY12
FY16
(US$ bn)
306 300 314 310 262
199
489 491 450 448 381
275
FY12 FY13 FY14 FY15 FY16 FY17(Apr-Dec)Exports Imports
141 146 152 158 154
107 77 81 79 82 85
64
FY12 FY13 FY14 FY15 FY16 FY17(Apr-Nov)Exports Imports
39.4
46.4
36.3
34.1
32.1
27.0
30.4
56.7
24.2
27.9
21.3
20.9
19.0
16.2
18.6
21.2
40.6
55.4
Gems & Jewellery Textiles Chemicals
Petroleum Products Agricultural Products Transport Equipments
Machinery Base Metals Others
US$262bn

88%
9% 3%
93%
6% 1%
1
External Debt 360.8 409.5 446.2 474.7 485.0
External Reserves 294.4 292.0 304.2 341.6 360.2
33%
22%
16%
16%
8%5%
38%
17%
26%
12%5% 2%
External Debt FY12 FY16
External Reserves
FC Assets
Gold
SDRs / Reserve Tranche
Commercial Borrowings
Short Term
Non-Resident
Multilateral (Includes IMF)
Bilateral
Trade Credit
External Debt vis-à-vis External Reserves
(1) ‘Volatile capital flows’ is defined to include cumulative portfolio inflows and short-term debt (RBI) (2) Volatile capital flows to Reserves ratio peaked at 97.4% in September 2013 (3) Source: RBI/Ministry of Finance, Government of India
11
(US$ bn)
(1) (2)
82% 71% 68% 72% 74% 77% 72% 63% 62% 67% 69% 72% 80% 94% 90% 92% 87% 86%
333% 269%
301% 371%
403% 427%
FY12 FY13 FY14 FY15 FY16 FY17 (Apr-Sep)
External Reserves : External Debt FC Assets : External Debt
Volatile Capital Flows: External Reserves (End-March) FCA: Short-term debt

Union Budget - FY 2017-18 “Transform, Energise and Clean India”
12
Key highlights of the Budget may be summarised as follows:
Fiscal deficit target of 3.2% for FY 2017-18 in line with market expectations;
Revenue deficit target reduced to 2.1% for FY 2016-17 vis-à-vis BE of 2.3%;
Revenue deficit target of 1.9% for FY 2017-18 below 2% mandated by FRBM;
Allocation for Capital expenditure increased by 25.4%;
Aggressive disinvestment target of `725 billion for FY 2017-18;
Focus on Agriculture and Rural sectors - Increase in allocation by 11% & 12% to `587 billion &
`1,286 billion respectively;
Allocation to MGNREGA at record high of `480 bn;
Greater focus on Infrastructure, especially transport with increase in allocation by 10% to
`3,961 billion;

Union Budget - FY 2017-18 (contd) “Transform, Energise and Clean India”
13
Proposal to abolish Foreign Investment Promotion Board (FIPB) in FY 2017-18;
Profit (linked deduction) exemption for startups now available for 3 out of 7 years;
Under the ‘Indradhanush’ plan, estimates of `1800 billion required by banks as capital under
Basel-III norms of which `700 billion would be infused by the Government by FY 2018-19
(`100 billion allocated as per the Union Budget - FY 2017-18);
No corporate tax cut for large industries, as budget focused on MSMEs. Reduction in tax
liability for MSMEs;
GST scheduled for implementation by July 01, 2017.

Section 3
The Exim Bank Story

“for providing financial assistance to exporters and importers, and for functioning as the principal financial institution for
coordinating the working of institutions engaged in financing export and import of goods and services with a view to promoting
the country’s international trade…”
“… shall act on business principles with due regard to public interest”
(Export-Import Bank of India Act, 1981)
“To develop commercially viable relationships with a target set of externally oriented companies by offering them a
comprehensive range of products and services, aimed at enhancing their internationalisation efforts”
Objectives
Vision
Set up under a Act of Parliament in 1982 by the Government of India (GoI)
Genesis
EXIM Bank - India’s Export Credit Agency
15

An instrument of Government policy as India’s official export credit agency
100% owned by Government of India (“GoI”)
Proxy to the India Sovereign in international debt markets
Cannot be liquidated without GoI approval
Board of Directors are appointed by GoI
Comprises top officials from key GoI ministries (Commerce & Industry, Finance and External Affairs) and RBI
Guarantees are provided by GoI for lines of credit extended by EXIM which are on behalf of and supported by the GoI
A track record of GoI capital infusions
Ongoing Government Support
2 EXIM – Proxy to Sovereign
16
100% owned by GoI
Directors Appointed by
GoI
Proxy to India Sovereign in International Debt Markets
Equity Capital Infusion
Guarantees on GoI Routed
Lines of Credit

2
EXIM’s credit rating has been on par
with India sovereign rating since its
establishment
Continued GoI support evidenced by capital infusion
Budget allocation of INR 5 Bn in FY 17 from GoI towards capital, received in August 2016
Further Provision of INR 5 bn for FY 18 made in the Budget presented to the Parliament on February 1, 2017.
Government Capital Injection(1)
(INR bn)
EXIM – Proxy to Sovereign (Cont’d)
17
Rating is Baa3 (Positive) on par with sovereign as of
20th July 2016
Rating is BBB- (Stable) on par with sovereign as of
20th July 2016
3
8 7
13 13
5
FY12 FY13 FY14 FY15 FY16 Dec'16

Funded Portfolio
Non-Funded Portfolio
Note: (1) As on December 31, 2016 (2) Includes advances under Production Equipment Finance Program, Long Term Working Capital Loan and staff loans. etc.
INR 114bn (1)
EXIM’s Lines of Business
18
INR 1,083bn (1)
Export Credit
Products
Services
Supplier’s/Buyer’s Credit
Pre-Shipment Credit
Post-Shipment Credit
Lines of Credit
Guarantees & L/Cs
Buyer’s Credit under NEIA
Projects
Finance for Export Capability
Creation
Term Loans
Export Facilitation
Guarantees & L/Cs
Working Capital
Export Product Development
Overseas Investment Finance
Import Finance
Export Finance
50%
Loans to Export
Oriented Units 25%
Overseas Investment
Finance 18%
Import Finance
5%
Export Facilitation
3% Others2 0.01%
Performance Guarantee
29%
Advance Payment Gurantee
20%
Letters of Credit
8%
Financial Guarantee
(Incl. SBLC) 40%
Retention Money
Guarantee 1%
Bid Bond Guarantee
1%

Capital Strength
Total Income
4
(INR bn)
Profitability
Total Assets, Loans and Advances
(INR bn)
(INR bn)
* Includes loans and advances to industrial concerns, scheduled banks foreign governments and other financial institutions and bills of exchange and promissory notes discounted/rediscounted. Amounts
stated are net of provisions for non-performing loans (NPLs). 19
871 984
1,152 1,192
746 849
991 1,001
FY14 FY15 FY16 Dec'16
Total Assets Loans and Advances *
73 76
88
68
FY14 FY15 FY16 Dec'16
7.1 7.3 3.2
(17.8)
22 18
23
14
2.7% 2.1% 2.2%
1.6%
FY14 FY15 FY16 Dec'16
Net Profit Net Interest Income NIM (%)
12.8% 13.8% 13.0% 10.3%
1.5% 1.5% 1.5%
1.5%
14.3% 15.3% 14.6%
11.8%
FY14 FY15 FY16 Dec'16
Tier I Tier II CAR
Financial Highlights

Non Performing Loans(1) Provision Coverage Ratio
4
Current NPA primarily due to reclassification of the restructured legacy assets already recognized till 2014
No significant new accounts becoming NPA
One of the highest provision coverage ratios in the industry
3.2 5.1 8.6 20.5
Net NPA (INR bn)
Source: RBI. Note: (1) Excludes restructured standard assets.
20
Equity at Risk
0.4% 0.6% 0.9% 2.0% 2.1%
2.9% 4.2%
9.5%
FY14 FY15 FY16 Dec'16Net NPL Ratio Gross NPL Ratio
4.2% 3.9% 5.2% 7.4%
20.1%
FY13 FY14 FY15 FY16 Dec'16
81.3% 80.6% 80.4%
80.0%
FY14 FY15 FY16 Dec'16
Asset Quality Position

Fully hedged position on currency and basis risk. Both Assets and Liabilities on floating LIBOR basis.
Exim Bank’s quasi sovereign status enables issuance at benchmark rates
Regular issuer in the International debt markets with 28 issuances under MTN Program since 2004.
Debut 144A issuance for USD 1 bn in July 2016 under GMTN Program.
Variety of borrowing instruments and active liability management
Issuances across currencies including AUD, CHF, CNY, JPY, MXN, SGD, TRY and ZAR
Total Lendable Resources Total Loan Assets
4
21 (1) Data as on 31st December 2016 (2) Excluding short term interbank deposits maintained for Liquidity
Foreign Currency Asset Liability Gaps(1) Total Resources/ Loan Assets(1)(2)
Foreign Currency Assets 71%
Rupee Assets 29%
268
234
191
146
206
240
261
213
141
187
<=1 yr 1–3 yr 3–5 yr 5–7 yr >7 yr
Maturing Assets (INR bn) Maturing Liabilities (INR bn)
FC Resources
73%
Rupee Resources
16%
Share Capital & Reserves
11%
Asset Liability Management

Directors representing Ministries of Commerce, External Affairs & Finance
5
Rita Teaotia
Secretary, Department of Commerce, Ministry of Commerce and Industry
Ramesh Abhishek
Secretary, Department of Industrial Policy & Promotion, Ministry of Commerce and Industry
Amar Sinha
Secretary, ER, Ministry of External Affairs
Rajeev Rishi
Chairman and MD, Central Bank of India
Kishor Kharat
MD and CEO, IDBI Bank
Arvind Subramanian
Chief Economic Advisor, Ministry of Finance, GoI
Pankaj Jain
Joint Secretary, FS, Financial Services Department M D Patra
Executive Director, RBI
Arundhati Bhattacharya
Chairperson, SBI Geetha Muralidhar
Chairman and MD, ECGC Ltd
Usha Ananthasubramanian
MD and CEO, Punjab National Bank
Debasish Mallick
Deputy Managing Director
Directors representing major Indian Public Sector Banks Director representing regulator - RBI
Directors representing India’s Export Credit Insurance Company
22
Whole Time Directors
EXIM Bank – Management & Board of Directors
David Rasquinha
Deputy Managing Director & holds additional charge as Interim Managing Director

5
Mr. David Rasquinha has been appointed by GoI as Deputy Managing Director of Export-Import Bank of India since July 2014
Mr. David Rasquinha has been entrusted with an additional charge as the Interim Managing Director w.e.f. February 20, 2017
He has been with EXIM since 1985 and prior to his current role he has held posts of Executive Director & Chief General Manager. He has handled a wide range of functions including Lines of Credit & Trade Finance and was Representative at EXIM’s Washington DC Rep Office from 1999-2004
Mr. Rasquinha holds a first class graduate degree in Economics from Mumbai University & a post graduate qualification in Business Management from the XLRI, Jamshedpur
Mr. David Rasquinha, Deputy Managing Director & Interim Managing Director (Additional Charge)
Mr. Debasish Mallick, Deputy Managing Director
Mr. Debasish Mallick has been appointed by GoI as Deputy Managing Director of Export-Import Bank of India since July 2014
Mr. Mallick was the Managing Director and CEO of IDBI Asset Management Company Ltd and has nearly three decades of experience in the Banking industry. He has vast experience in the areas of Corporate Banking, International Banking, Resource Mobilisation and Treasury among others
He holds a post-graduate degree in Economics & is a Certified Associate of Indian Institute of Bankers
Highly Experienced Management Team with Government of India (GoI)Sponsorship
23
EXIM Bank – Senior Management

5
24
Officer of the rank of Chief General Manager designated as Chief Risk Officer for credit, market and operational risks
Tasked with risk management into the Bank’s business processes and driving the Bank’s risk management strategy
Risk Management Group
Chaired by Deputy Managing Directors and comprises Group Heads of Business Groups, Treasury and Accounts Group, and Risk Management Group
It addresses issues of asset-liability management, interest and exchange rate risks, liquidity risk etc
Chaired by Deputy Managing Directors and comprises Group Heads of Business Groups, Treasury and Accounts Group, and Risk Management Group
The CRMC addresses rating and pricing standards, prudential limits on various exposure categories (country, sector, single and group borrower and unsecured exposures, program-wise exposures etc.), provisioning, sector-wise outlook etc
Chaired by Deputy Managing Directors and comprises senior executives who do not have direct line responsibilities
Reviews Bank’s risk profile, risk concentrations, compliance with prudential limits and overseeing the operations of CRMC and ALCO
Reviews the Bank’s risk management policies, investment policies and strategy, and regulatory and compliance issues in relation thereto
Constituted by the Board of Directors and conducts internal audit.
Reviews all operations of ALCO , NPA loan accounts, Bank’s currency-wise liquidity position, interest rate sensitivity position and the exceeding of any prudential limits, as well as any corrective actions taken thereto on a quarterly basis
Asset-Liability Management Committee
Credit Risk Management Committee
Integrated Risk Management Committee
Audit Committee
EXIM Bank – Institutionalised Risk Management Culture

About 55% of the Bank’s gross loan assets are located outside India
71% of Bank’s Gross Loan Assets are Foreign Currency (Non-rupee) assets
Branch in London & Representative Offices in 7 countries
Lines of Credit Project Exports Buyer’s Credit Marketing Advisory Services
Overseas Investment Finance Working Capital Direct Equity Investment Overseas Office
Geographic Presence
25

Aggregate Country Exposure(2) Gross Loans o/s by Major Industries(1) (2)
Industry exposure limit set at 15%
Diversified Credit Exposure
Note: (1) Excludes advances under lines of credit, buyer’s credit under NEIA and staff loans which can not be classified under any particular sector totaling to 35% of Gross Loans outstanding (2) As on December 31, 2016
26
Sub-Saharan Africa 39%
South Asia 35%
SEA FE & PAC 7%
North Africa 4%
Europe 4%
Americas 3%
West Asia 3%
East Asia 5% 13%
7%
5%
4%
4%
3%
3%
2%
2%
2%
2%
2%
2%
2%
1%
1%
1%
1%
1%
1%
8%
Financial Services
Ferrous Metals And Metal Processing
Oil And Gas
Textiles And Garments
Drugs And Pharmaceuticals
Mining And Minerals
EPC Services
Ship Building
Renewable Energy
Petrochemicals
Petroleum Products
Ports And Other Infrastructure
Chemicals And Dyes
Auto & Auto Components
Shipping Services
Tyres
Engineering Goods
Construction
Agro & Food Processing
Cement
Others
Standard GNPA

Section 3
Appendix

Figures in INR mn FY14 FY15 FY16 Dec’16
Cash and Bank Balance 51,241 45,119 54,438 60,841
Investments 39,163 49,820 53,555 52,379
Loans and Advances(1) 745,983 849,100 991,168 1,001,015
Fixed Assets 807 1,041 1,002 1,312
Other Assets 34,296 39,169 52,015 76,359
Total Assets 871,490 984,249 1,152,178 1,191,906
Paid up Capital & Reserves(2) 83,097 99,026 114,868 119,868
Deposits 23,728 20,145 20,958 20,963
Notes, Bonds and Debentures 548,868 654,814 758,416 813,483
Borrowings 142,225 112,146 153,792 127,826
Profit and Loss Account - - - (17,784)
Other Liabilities & Provisions 73,572 98,118 104,144 127,550
Total Liabilities 871,490 984,249 1,152,178 1,191,906
Balance Sheet Summary
Financial Highlights (Cont’d)
Note: (1) Includes loans and advances to industrial concerns, scheduled banks foreign governments and other financial institutions and bills of exchange and promissory notes discounted/rediscounted. Amounts stated are net of provisions for non-performing loans (NPLs). (2) Includes paid-up capital and reserves.
28

Figures in INR mn FY14 FY15 FY16 Dec’16
Interest Earned 68,464 71,479 82,938 62,543
Interest Expended 46,840 53,355 60,221 48,697
Net Interest Income 21,624 18,124 22,717 13,846
Non-Interest Income 4,301 4,728 4,873 5,218
Operating Income 25,925 22,852 27,590 19,064
Non-interest Expense 1,826 2,109 2,292 1,916
Provisions and Contingencies 17,001 13,484 22,140 34,932
Net Profit 7,098 7,259 3,158 (17,784)
Profit and Loss Summary
Key Ratios
FY14 FY15 FY16 Dec’16
Net Interest Margin* 2.69% 2.06% 2.21% 1.61%
Gross NPA 2.10% 2.94% 4.17% 9.46%
Net NPA 0.43% 0.60% 0.86% 2.05%
ROAA 0.85% 0.79% 0.29% -
ROAE 9.24% 7.89% 2.93% -
CRAR 14.32% 15.34% 14.55% 11.82%
Financial Highlights (Cont’d)
29
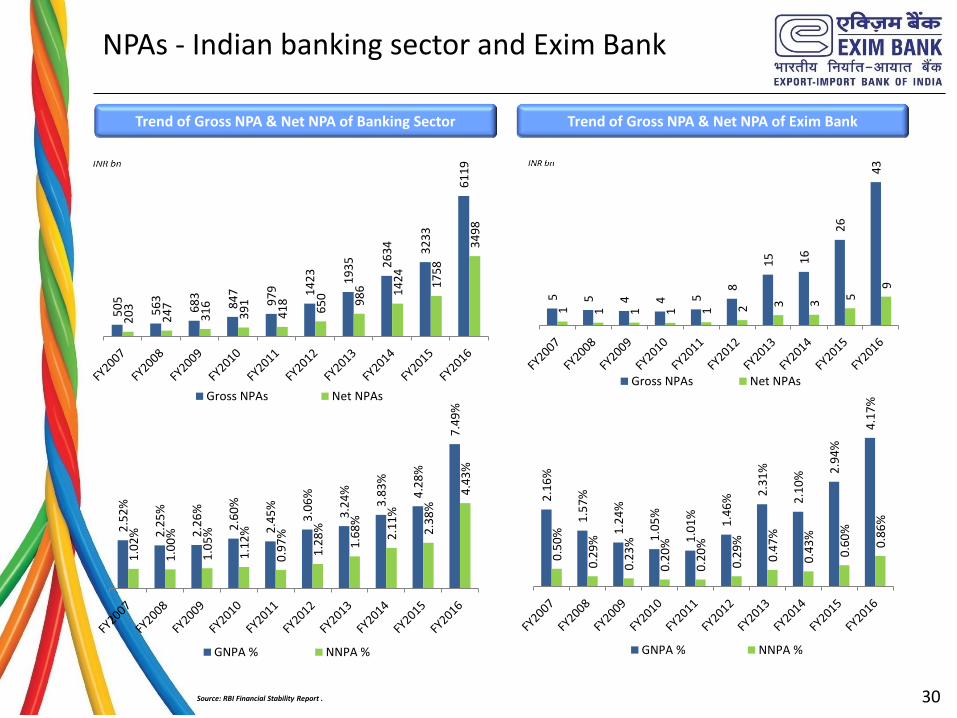
NPAs - Indian banking sector and Exim Bank
Source: RBI Financial Stability Report .
Trend of Gross NPA & Net NPA of Banking Sector 5
05
56
3
68
3
84
7
97
9
14
23
19
35
26
34
32
33
61
19
20
3
24
7
31
6
39
1
41
8
65
0
98
6
14
24
17
58
34
98
Gross NPAs Net NPAs
Trend of Gross NPA & Net NPA of Exim Bank
5
5
4
4 5 8
15
16
26
43
1
1
1
1 1 2 3 3 5
9
Gross NPAs Net NPAs
2.5
2%
2.2
5%
2.2
6%
2.6
0%
2.4
5%
3.0
6%
3.2
4%
3.8
3%
4.2
8%
7.4
9%
1.0
2%
1.0
0%
1.0
5%
1.1
2%
0.9
7%
1.2
8%
1.6
8%
2.1
1%
2.3
8%
4.4
3%
GNPA % NNPA %
2.1
6%
1.5
7%
1.2
4%
1.0
5%
1.0
1%
1.4
6%
2.3
1%
2.1
0%
2.9
4%
4.1
7%
0.5
0%
0.2
9%
0.2
3%
0.2
0%
0.2
0%
0.2
9%
0.4
7%
0.4
3%
0.6
0%
0.8
6%
GNPA % NNPA %
30

Profits - Indian banking sector and Exim Bank
31
Trend of Operating Profit, PAT & Provisions & Contingencies
of Banking Sector
Source: RBI Financial Stability Report .
66
0
83
6 11
09
12
23
14
91
17
37
19
09
20
96
23
33
24
55
31
2
42
7
52
7
57
1
70
3
81
7
91
2
80
9
89
1
34
1
34
8
40
9
58
1
65
2
78
8
92
0
99
8 12
87
14
42
21
13
Operating Profit Profit/Loss (PAT) Provisions and Contingencies
4
8 1
0
8
11
15
17
24
21
25
3 3 5
5 6 7 7
7 7
3
0
2 3
0
3
5 6
14
9
21
Operating Profit Profit/Loss (PAT) Provisions and Contingencies
Trend of Operating Profit, PAT & Provisions & Contingencies
of Exim Bank

Partner
in India’s Globalisation
www.eximbankindia.in