Embed Size (px)
Citation preview
INDIANA OFFICE OF ENERGY AND DEFENSE DEVELOPMENT
Indiana Residential Geothermal
Heat Pump Rebate Program Review
Paul Cummings
6/23/2008
http://www.in.gov/energy/programs/current.html#Geothermal

2
Table of Contents Introduction .................................................................................................................................................. 4
Program Description ..................................................................................................................................... 4
Program Eligibility Requirements ............................................................................................................. 4
Program Report ............................................................................................................................................. 5
Descriptive Statistics ..................................................................................................................................... 5
Geothermal System Sizes .......................................................................................................................... 5
Installation Costs ....................................................................................................................................... 6
Analysis and Recommendations ........................................................................................................... 7
Heating Fuel Replacement ........................................................................................................................ 8
Economics and energy savings.................................................................................................................. 9
Home Heating Costs .............................................................................................................................. 9
Home Energy Savings .......................................................................................................................... 10
Economic Analysis ............................................................................................................................... 11
Rebate Distribution ................................................................................................................................. 12
Statewide distribution......................................................................................................................... 12
Electric Utility Distribution .................................................................................................................. 14
Economic Development .......................................................................................................................... 14
Summary and Recommendations ........................................................................................................... 15
List of Tables and Figures Table 1 Number of systems by size ............................................................................................................... 5
Table 2 Geothermal system and average home sizes................................................................................... 6
Table 3 Cost by system type ......................................................................................................................... 6
Table 4 Rebates for full systems ................................................................................................................... 7
Table 5 Rebates for heat pump only systems .............................................................................................. 7
Table 6 Heating fuels replaced...................................................................................................................... 8
Table 7 2000 Overall Indiana Heating fuels .................................................................................................. 8
Table 8 Electric heating types ....................................................................................................................... 9
Table 9 Fuel cost estimates 2008 .................................................................................................................. 9
Table 10 Heating equipment and fuel use efficiency................................................................................. 10

3
Table 11 Fuel costs per MMBTU of heating required ................................................................................ 10
Table 12 Estimated energy savings by heating fuel ................................................................................... 10
Table 13 Total Estimated Savings by Program in Year 1 ............................................................................. 11
Table 14a Economics of Geothermal with incremental cost of $4500 ....................................................... 11
Table 14b Economics of Geothermal with incremental cost of $7000 ....................................................... 11
Figure 1 Rebates by County ........................................................................................................................ 13
Table 15 Rebates by utility type .................................................................................................................. 14
Table 16 Rebates by manufacturer ............................................................................................................. 15
Appendix 1 Rebate Number and Dollar Amount by County ....................................................................... 16
Appendix 2 Other Rebates .......................................................................................................................... 17
Appendix 3 Simple Heat Load Calculation .................................................................................................. 18

4
Introduction The Indiana Office of Energy & Defense Development (OED) developed the Hoosier Homegrown Energy
Plan in 2006. The plan focuses on using more of Indiana’s indigenous resources to meet its energy
needs. Geothermal heat pumps fit nicely into this plan because they reduce the amount of energy used
to heat and cool homes, which reduces the amount of energy production needed. Geothermal heat
pumps (GHP) are able to be so efficient because they can concentrate and move solar energy stored in
the soil outside the home to the inside of the home to provide heating in winter. In summer the heat
inside of the home can be moved and dumped into the soil to provide cooling.
OED receives funding from the US Department of Energy (DOE) through the State Energy Program (SEP).
OED must create a plan for what programs will be offered to the public using the federal SEP dollars,
which the US DOE must approve. Within the past few years the US DOE has been focusing on market
transformative programs. The goal is to transform a market sector to use a more energy efficient
product to accomplish the same task. The Indiana Residential Geothermal Heat Pump Rebate program
was designed to transform the market for replacement geothermal systems in the residential market.
Geothermal systems reduce energy usage by 25-75% over conventional heating and cooling, making
them the most efficient system on the market. (EERE Publication) While GHPs are the most efficient
heating systems, they are also the most costly system to install. In new home construction, the
increased cost of the geothermal can easily be added to the mortgage and the cost spread over 30
years. This results in a good cash flow for the homeowner since utility bills will be reduced by more than
the mortgage will be increased. The retrofit market is not as easy to penetrate due to shorter and less
desirable financing terms. The monthly payment is much greater in retrofit situations, so the
economics are not as attractive as in new construction. To facilitate a greater penetration into this
market OED decided to offer the rebate program.
Program Description The program was unveiled on October 1, 2007 with a budget of $500,000 to last until May 31, 2008 or
until fully subscribed. Rebates were calculated at $400 per ton of capacity installed with a maximum
rebate of $2,000. Most homes need between three and five tons to provide adequate heating and
cooling. 326 Hoosier homeowners received a rebate using this program.
Program Eligibility Requirements The following is a list of basic eligibility requirements for the program:
The system must be installed in a single family home located within the State of Indiana.
The installed system must be listed on the Energy Star website as an energy star certified
geothermal heat pump system.
The system must be a replacement for an existing heating system (i.e. not for new construction).
The system must be a closed loop system.
All equipment must be new.

5
Program Report This report contains statistics and analysis of the program and of the systems installed. Subjects that
will be covered include size, cost, and location of systems as well as information on what types of
heating fuels were replaced. This report will use the data from the 326 rebate applications that were
approved by the end of the program for fiscal year 2008. The funds have not all been distributed at the
time of writing. There may be some rebates that were approved that do not get reimbursed due to
homeowners changing their minds and not installing the system. This number should be very low.
Descriptive Statistics
Geothermal System Sizes Geothermal systems are classified using a unit of measurement called tons, which is equal to 12,000
btu/hr. This unit is based on the amount of energy that a ton of ice will absorb in order to melt, and is
the industry standard unit for air conditioning. The units most commonly sold for residential
applications range in size from two to six tons. The vast majority of units (92%) that received a rebate
were in the three -5 ton range. This range includes three, three an a half, four and five ton units. The
most common size installed was four tons (40%) followed by three tons (29%). (Table 1)
Table 1 Number of systems by size Size Number % of Total
2 tons 5 2%
2.5 tons 6 2%
3 tons 95 29%
3.5 tons 19 6%
4 tons 129 40%
5 tons 56 17%
6 tons 16 5%
Total 326 100%
The average home size in the program is 2,731 ft2. Unit size seems to increase with increases in home
size. The average home size is1620 ft2 for two ton units, 2,079 ft2 for three ton units, 2,826 ft2 for four
ton units, and 3,755 ft2 for five ton units. This relationship does not apply to the half units as these
homes average nearly the same size as the preceding whole unit. There are only 25 (8%) of these half
sizes in the program. There seems to be a trend away from them in the market as multiple speed units
become more popular, allowing a wider range of capacity out of a single unit. (Table 2)

6
Table 2 Geothermal system and average home sizes size Home size ( sq. ft.)
2 tons 1620
2.5 tons 1621
3 tons 2079
3.5 tons 2147
4 tons 2826
5 tons 3755
6 tons 3777
Total 2731
Installation Costs Installation costs vary to a degree with system size, where larger systems cost more. There are two
main types of installations that are important to separate to accurately describe costs; systems that
require a new loop to be constructed versus those that do not. The systems that do not need a new
loop are existing geothermal users that need to update their heat pump equipment to newer, more
efficient models. These systems account for 25% of rebates. These systems cost on average $4,300 less
than systems needing a loop. The average price for this “heat pump only” rebate is $9,500-$10,000 for
three – four ton units and $11, 188 for five ton units. There is very little difference in the cost of three
and four ton units, with four ton units costing $300 more. The three .5 ton units actually cost more than
three or four ton units.
The average cost of a full system rebate was $14,278. The average cost of a three ton unit is $13,719
and $13,969 for a four ton unit, which is only $250 different. The five ton costs about $3,000 more than
the three -4 ton units. There is no statistically significant trend or difference in cost between two and a
half to four ton units. The two ton unit seems to be less expensive, but there are only five rebates
issued to two ton units, which would not yield a statistically significant difference. The three and four
ton units are the most popular on the market accounting for nearly 70% of the installs and are very
similar in price. (Table 3)
Table 3 Cost by system type Tons Total Systems Heat Pump only
2 $12,285 $8,400
2.5 $13,483 $7,922
3 $13,719 $9,465
3.5 $13,297 $9,959
4 $13,969 $9,765
5 $16,865 $11,188
Total $14,278 $9,990
7
Analysis and Recommendations
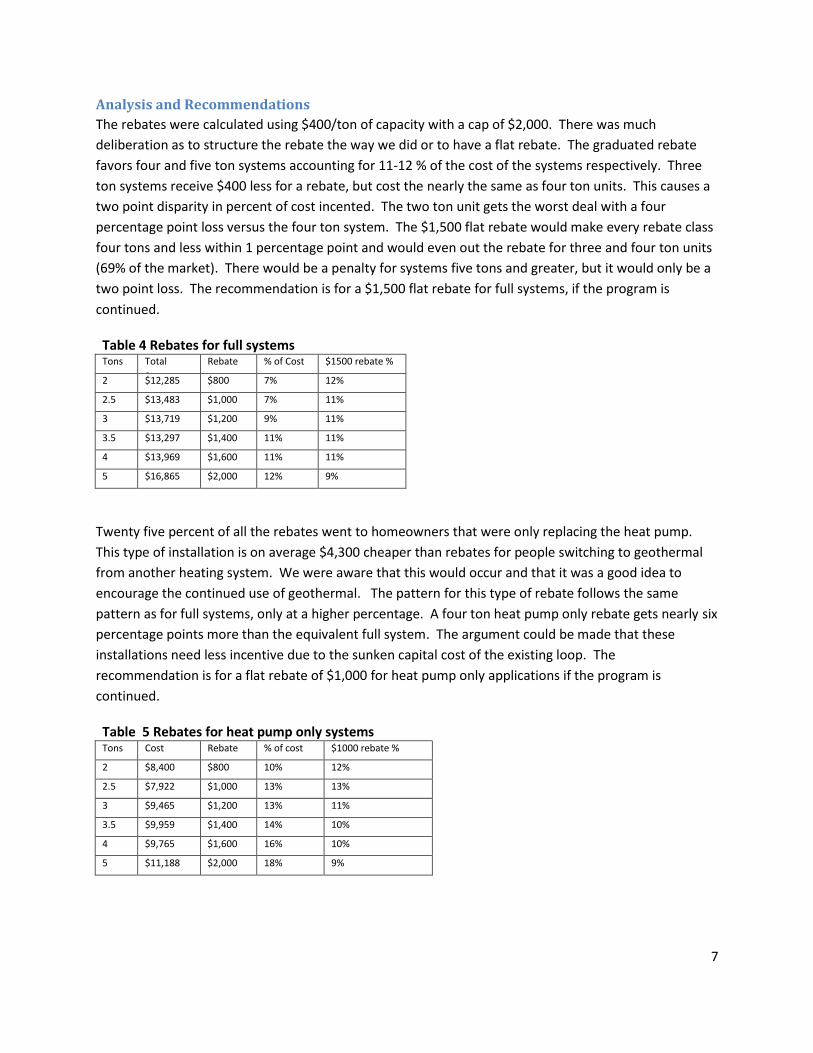
The rebates were calculated using $400/ton of capacity with a cap of $2,000. There was much
deliberation as to structure the rebate the way we did or to have a flat rebate. The graduated rebate
favors four and five ton systems accounting for 11-12 % of the cost of the systems respectively. Three
ton systems receive $400 less for a rebate, but cost the nearly the same as four ton units. This causes a
two point disparity in percent of cost incented. The two ton unit gets the worst deal with a four
percentage point loss versus the four ton system. The $1,500 flat rebate would make every rebate class
four tons and less within 1 percentage point and would even out the rebate for three and four ton units
(69% of the market). There would be a penalty for systems five tons and greater, but it would only be a
two point loss. The recommendation is for a $1,500 flat rebate for full systems, if the program is
continued.
Table 4 Rebates for full systems Tons Total
Systems
Rebate % of Cost $1500 rebate %
2 $12,285 $800 7% 12%
2.5 $13,483 $1,000 7% 11%
3 $13,719 $1,200 9% 11%
3.5 $13,297 $1,400 11% 11%
4 $13,969 $1,600 11% 11%
5 $16,865 $2,000 12% 9%
Twenty five percent of all the rebates went to homeowners that were only replacing the heat pump.
This type of installation is on average $4,300 cheaper than rebates for people switching to geothermal
from another heating system. We were aware that this would occur and that it was a good idea to
encourage the continued use of geothermal. The pattern for this type of rebate follows the same
pattern as for full systems, only at a higher percentage. A four ton heat pump only rebate gets nearly six
percentage points more than the equivalent full system. The argument could be made that these
installations need less incentive due to the sunken capital cost of the existing loop. The
recommendation is for a flat rebate of $1,000 for heat pump only applications if the program is
continued.
Table 5 Rebates for heat pump only systems Tons Cost Rebate % of cost $1000 rebate %
2 $8,400 $800 10% 12%
2.5 $7,922 $1,000 13% 13%
3 $9,465 $1,200 13% 11%
3.5 $9,959 $1,400 14% 10%
4 $9,765 $1,600 16% 10%
5 $11,188 $2,000 18% 9%

8
Heating Fuel Replacement The analysis of heating fuels replaced is a little tricky since existing geothermal units use electricity the
same as an electric furnace. For that reason, geothermal heat pump replacements are treated as a
separate category. Electricity was the most popular fuel (39%) when geothermal was not isolated.
Table 6 illustrates that propane is the most popular fuel to replace followed by geothermal heat pumps
and then natural gas. These three types of installations account for three quarters of the installs. The
remainder is made of miscellaneous electric heating types, heating oil furnaces, and other heating
sources such as wood.
Table 6 Heating fuels replaced Fuel Total %
Geothermal Heat Pump 84 26%
Other Electricity 41 13%
Heating Oil 33 10%
Natural Gas 66 20%
Other 5 2%
Propane 97 30%
Total 326
Propane is an obvious candidate for the top spot as it is relatively expensive and is used in more rural
areas where lot sizes are generally large enough to accommodate installing the ground loop. The 30%
representation of propane is three times higher than the 9% market penetration in the state. (Table 7)
Geothermal heat pumps are the second most popular because the rebate is very lucrative if you already
have a ground loop. The only factor limiting this type of replacement is the number of units installed 15
-30 years ago that needed to be replaced this year. Natural gas is the most popular heating fuel in
Indiana (65% Table 7), but is usually associated with urban areas where lot sizes are not conducive to
geothermal loops. It is also the most inexpensive of the major fuels, which keeps the number of
replacements lower than the other two fuels.
Table 7 2000 Overall Indiana Heating fuels Fuel % of homes
Natural Gas 65%
Fuel Oil 3%
Electricity 22%
Propane 9%
Other/None 1%
Source: EIA

9
The remaining 25 percent of installations replaced primarily heating oil and other electric heating.
Heating oil is a very expensive heating fuel and exceedingly rare in Indiana (3% table 7). The fact that
10% of the rebates used heating oil may attest to the higher cost of this heat source.
Table 8 illustrates the breakdown of electric heating types and the number of systems replaced by
geothermal. Nearly half of the systems replaced were air source heat pumps. Air source heat pumps
are the second most efficient heating method after geothermal. Their downfall is that they work best in
temperatures down to 30 or 40 degrees. Below that temperature a backup heat source is required. This
is often an electric resistance heater. This is basically an electric furnace, which one of the least
economical systems to use. It is surprising that only eight electric furnaces have been switched over
using the program.
Baseboard electric heating is not a popular replacement for a couple of reasons. These systems are
usually in small homes, with small heating loads. Baseboard heating is the lowest cost equipment to
purchase and only moderately expensive to operate since there is no fan or distribution losses normally
associated with furnaces. The rest of the heating types are likely resistive in nature and are going to be
moderately expensive to very expensive to operate.
Table 8 Electric heating types Electric heating types # %
Air Source Heat Pump 20 49%
Electric other 10 24%
Furnace 8 20%
Baseboard electric 3 7%
Total 41 100%
Economics and energy savings The following tables outline fuel costs, fuel use efficiency and heating costs based on fuel use efficiency.
These are estimates and actual costs vary due to differences in efficiency of individual units and seasonal
variations in fuel costs. These three tables will help illustrate the economics of these systems in Indiana.
Home Heating Costs
Table 9 Fuel cost estimates 2008
Fuel Type Unit
Price Per
Unit (dollars)
Heat Content Per
Unit (Btu)
Price Per Million
Btu (dollars)
Fuel Oil (No. 2) Gallon $3.00 138,690 $21.63
Electricity KiloWatt-hour (kWh) $0.080 3,412 $23.45
Natural Gas * Therm ** $1.20 100,000 $12.00
Propane Gallon $2.40 91,333 $26.28
Source: EIA spreadsheet

10
Table 10 Heating equipment and fuel use efficiency Heating System Type Type of Efficiency Rating Approximate
Efficiency (%)
Oil Furnace or Boiler AFUE 78%
Electric Furnace/Baseboard/Space Heater Est. 99%
Electric Air-Source Heat Pump HSPF 199%
Electric Geothermal Heat Pump COP 350%
% Natural Gas Furnace or Boiler AFUE 78%
Propane Furnace or Boiler AFUE 78%
Source: EIA spreadsheet
Table 11 Fuel costs per MMBTU of heating required Fuel and Heating System Type Cost Per MMBtu
Oil - Furnace or Boiler $27.73
Electric - Furnace/Baseboard/Space Heater $23.68
Electric - Air-Source Heat Pump $11.76
Electric - Geothermal Heat Pump $6.70
Natural Gas - Furnace or Boiler $15.38
Propane - Furnace or Boiler $33.68
Source: EIA spreadsheet
Home Energy Savings
Table 12 was constructed using REM/Rate, a home energy modeling software. A 2731 ft2 ranch with 8 foot walls
on crawl space was used as the model. The home had R-13 wall insulation and R-38 ceiling insulation with .53
natural air changes per hour. All of the replaced heating equipment was modeled at the efficiencies specified in
Table 10. Cooling was modeled using a 10 SEER electric AC except for the existing geothermal and air source heat
pumps. The Existing geo had a COP of 3 and an EER of 20. Hot water equipment was electric for all heating
systems except for natural gas and propane which used the same heating fuel for water and home heating. The
new system used a 4.7 COP and 25.1 EER 4 ton unit that was the most common used in the program. Replacement
hot water was modeled using a standard efficiency electric water heater taking advantage of the desuperheater on
the geothermal unit.
All homeowners should take measures to reduce heating and cooling loads. A certified energy rater can perform
a whole house analysis and provide an improvement analysis that would include upgrade costs and savings.
Table 12 Estimated energy savings by heating fuel
orig heat geo heat orig cool geo cool orig dhw geo dhw Total Savings
Existing Heat ($/yr) ($/yr) ($/yr) ($/yr) ($/yr) ($/yr) ($/yr)
Oil Furnace $2,777 $480 $172 $66 $328 $259 $2,472
Electric Furnace $2,596 $480 $172 $66 $328 $259 $2,291
Air Source Heat Pump $1,550 $480 $112 $66 $328 $259 $1,192
Geothermal Heat Pump $695 $480 $85 $66 $328 $259 $303
Natural Gas Furnace $1,567 $480 $172 $66 $266 $259 $1,200
Propane Furnace $3,356 $480 $172 $66 $583 $259 $3,306
11
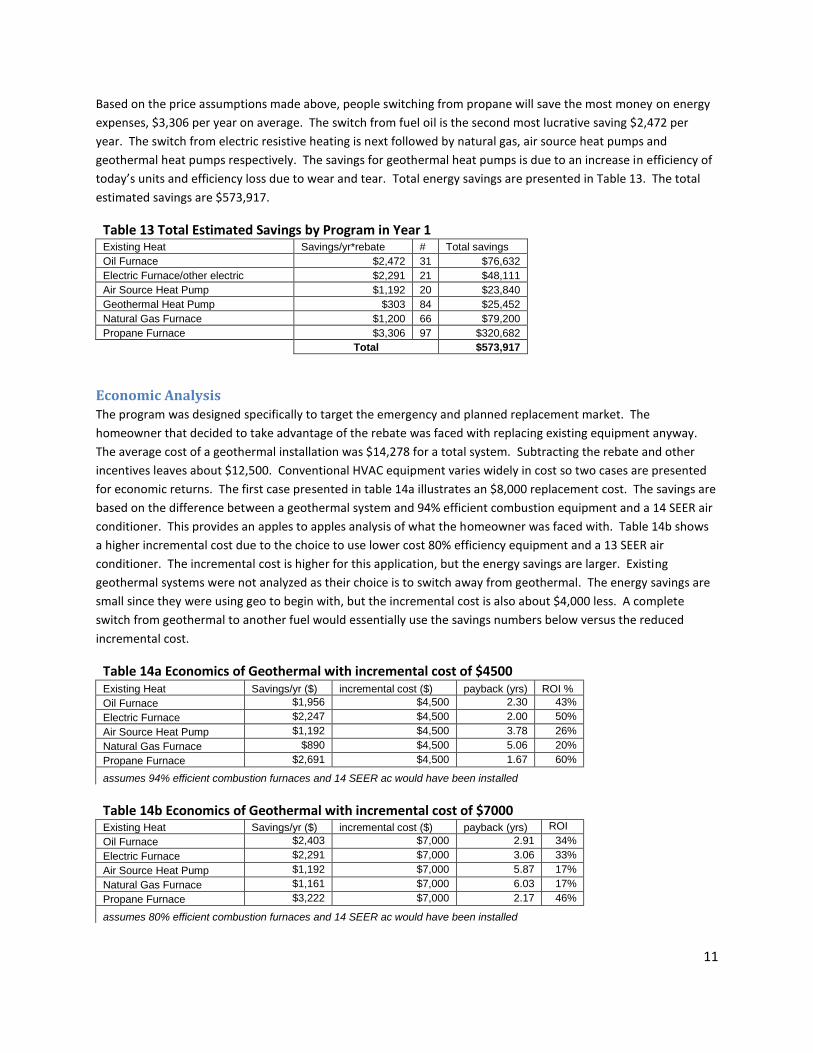
Based on the price assumptions made above, people switching from propane will save the most money on energy
expenses, $3,306 per year on average. The switch from fuel oil is the second most lucrative saving $2,472 per
year. The switch from electric resistive heating is next followed by natural gas, air source heat pumps and
geothermal heat pumps respectively. The savings for geothermal heat pumps is due to an increase in efficiency of
today’s units and efficiency loss due to wear and tear. Total energy savings are presented in Table 13. The total
estimated savings are $573,917.
Table 13 Total Estimated Savings by Program in Year 1 Existing Heat Savings/yr*rebate # Total savings
Oil Furnace $2,472 31 $76,632
Electric Furnace/other electric $2,291 21 $48,111
Air Source Heat Pump $1,192 20 $23,840
Geothermal Heat Pump $303 84 $25,452
Natural Gas Furnace $1,200 66 $79,200
Propane Furnace $3,306 97 $320,682
Total $573,917
Economic Analysis The program was designed specifically to target the emergency and planned replacement market. The
homeowner that decided to take advantage of the rebate was faced with replacing existing equipment anyway.
The average cost of a geothermal installation was $14,278 for a total system. Subtracting the rebate and other
incentives leaves about $12,500. Conventional HVAC equipment varies widely in cost so two cases are presented
for economic returns. The first case presented in table 14a illustrates an $8,000 replacement cost. The savings are
based on the difference between a geothermal system and 94% efficient combustion equipment and a 14 SEER air
conditioner. This provides an apples to apples analysis of what the homeowner was faced with. Table 14b shows
a higher incremental cost due to the choice to use lower cost 80% efficiency equipment and a 13 SEER air
conditioner. The incremental cost is higher for this application, but the energy savings are larger. Existing
geothermal systems were not analyzed as their choice is to switch away from geothermal. The energy savings are
small since they were using geo to begin with, but the incremental cost is also about $4,000 less. A complete
switch from geothermal to another fuel would essentially use the savings numbers below versus the reduced
incremental cost.
Table 14a Economics of Geothermal with incremental cost of $4500 Existing Heat Savings/yr ($) incremental cost ($) payback (yrs) ROI %
Oil Furnace $1,956 $4,500 2.30 43%
Electric Furnace $2,247 $4,500 2.00 50%
Air Source Heat Pump $1,192 $4,500 3.78 26%
Natural Gas Furnace $890 $4,500 5.06 20%
Propane Furnace $2,691 $4,500 1.67 60%
assumes 94% efficient combustion furnaces and 14 SEER ac would have been installed
Table 14b Economics of Geothermal with incremental cost of $7000 Existing Heat Savings/yr ($) incremental cost ($) payback (yrs) ROI
% Oil Furnace $2,403 $7,000 2.91 34%
Electric Furnace $2,291 $7,000 3.06 33%
Air Source Heat Pump $1,192 $7,000 5.87 17%
Natural Gas Furnace $1,161 $7,000 6.03 17%
Propane Furnace $3,222 $7,000 2.17 46%
assumes 80% efficient combustion furnaces and 14 SEER ac would have been installed

12
In all situations the payback on the incremental cost is 6.03 years or less. The return on investment ranges from
17-60%. This makes geothermal one of the most economical forms of renewable energy available today.
The prior assumes that the money is spent up front with no financing. Many systems will be financed over a term
of 5 -20 years. Financing $4500 over five years at 7% interest would yield payments of $1,070 per year. This is less
than the energy savings for all systems except the natural gas system. After five years the entire savings per year
would be realized. Extending the loan term to 20 years reduces the yearly payment to around $500 and creates a
positive cash flow in every instance.
Rebate Distribution
Statewide distribution
Rebates were claimed in 72% (66) of all 92 counties. The distribution is widespread across the state.
(Figure 1) There are three areas of greater concentration. The highest density is near Ft. Wayne. There
were 111 (34%) rebates in the northeastern nine counties. Allen and Huntington counties made up 19%
of all rebates, garnering 63 between the two. The next highest density was in central Indiana. Marion,
Hamilton, Morgan, Hendricks, and Monroe all had six or more installations. Hendricks and Hamilton
each had 18 and 19 respectively and Monroe County had 16. The third area of density was in the
southwest where Dubois County had 17 rebates.
There were virtually no rebates in any of the counties southeast of Bloomington. There were only six
rebates in any county touching the Ohio River. This lack of installations is due in part to geology,
economics, climate and HVAC conventions. This part of the state was not glaciated, so there is often
bedrock near the surface, which can necessitate vertical boring. This type of installation is more
expensive than ground loops. The climate of the south is much milder than the rest of the state.
Evansville has an average of 4400 heating degree days per year, where Fort Wayne has an average of
6200 heating degree days per year. The winter average temperature in Evansville is 45 degrees versus
37 in Fort Wayne. In this climate the return on investment of geothermal is much less than in the north.
A positive return is still likely, but maybe not perceived to be high enough to justify the capital
investment. There are advantages to air source heat pumps in that they are cheaper and do not require
land disturbance. The disadvantage of air source heat pumps is that they are less effective below 30 –
40 degrees and often times use resistance electric heating as backup. These temperatures are less
frequent in this region, and it is less costly to use air source heat pumps than in the north. Anecdotally,
the convention in the Ohio River Valley is to use air to air heat pumps for people desiring high efficiency
heating.
Two other areas of particularly low concentration are the fringes of central Indiana and the northwest.
There are several counties on the Illinois and Ohio Border in central Indiana that have one or no rebates.
The northwest quarter of the state has no county with more than three rebates. All of the hypotheses
for why the south had few installations do not apply for these two areas. The central counties have
similar soils and climate to the Indianapolis region. The northwest has a climate and geology similar to
the northeast. The best argument is that there is a lack of geothermal salespeople in these areas. These

13
areas present the best opportunities for expansion of the geothermal market in the state. Appendix 1
illustrates the number of rebates and the amount of rebate money in each county.
Figure 1 Rebates by County

14
Electric Utility Distribution
Table 15 illustrates the distribution of rebates by the type of electric utility that serves them. The data
for investor owned utilities (IOUs) is further broken down into the five utilities of this type in the state.
There was one rebate in a municipal utility. These are city utilities where lot sizes are smaller. There are
also no known incentives offered by municipal utilities for geothermal in the state. Rural electric
management cooperatives (REMCs) accounted for 60% of all rebates. REMCs serve rural areas where
people tend to have larger yards that can easily accommodate geothermal heat pumps. They are also
areas where natural gas is unavailable; so many people are forced to use more expensive fuels. They
also tend to offer generous rebates for geothermal heat pumps. Of the forty REMCs, thirty one offer
rebates ranging from $100 - $1200, with most in the $200 - $500 range. See Appendix 2 for the entire
list.
Table 15 Rebates by utility type Utility Type Electric utility Total %
Investor Owned 129 39.7%
Duke Energy 64 19.7%
AEP 43 13.2%
Nipsco 12 3.7%
IPL 8 2.5%
Vectren 2 0.6%
Municipal 2 0.6%
REMC 194 59.7%
Total Count* 325 100.0%
*one rebate was missing this data
IOUs account for forty percent of all installations. Duke Energy has the most rebates within its service
territory of all IOUs with 46. Duke offers a rebate of $200 the largest of all the IOUs. IPL is the only
other IOU to offer a rebate ($100). AEP had the second most rebates within its service territory with 34.
AEP happens to serve the Ft. Wayne area which is a hotbed for geothermal due to strong salespeople in
the area. The rest of the IOUs had relatively few rebates. IPL primarily serves Indianapolis, which has a
large population and only had six rebates. This is due to the availability of natural gas and the lack of lot
space to install the geothermal. Nipsco and Vectren’s lack of rebates are explained above as Nipsco
serves the northwest part of the state and Vectren the extreme southwest.
Economic Development The program had a budget of $500,000 which leveraged an additional $4,000,000 of private investment.
Assuming the $4,500 incremental cost for a geothermal system versus a conventional high efficiency
system, nearly $1,500,000 of economic activity happened that would not have without the program.
Almost all of this money stays within the state in wages and profits. The installers and distributors are
almost exclusively residents of Indiana. Table 15 illustrates the manufacturers of the systems installed
in the state. Waterfurnace is the most prevalent with about 75% of all installations using their

15
equipment. The Waterfurnace factory is in Fort Wayne and provides around 200 well paying jobs to
Hoosiers. These factories as well as the installers pay income taxes which add to the state coffers. The
sales tax alone on the incremental revenue of $1,500,000 is around $100,000. It is difficult to assess the
increased revenue to the state, but this program nearly pays for itself in increased corporate income,
private income, and sales taxes.
Table 16 Rebates by manufacturer Manufacturer Number Percent
Waterfurnace 240 73.6%
Climatemaster 29 8.9%
Bryant 6 1.8%
Geoexcel 20 6.1%
FHP 7 2.1%
Carrier 11 3.4%
Geocomfort 11 3.4%
ECR 2 0.6%
Total 326 100%
Summary and Recommendations The following is a list of key points about the program:
The average home size was 2731 ft2.
The most common system sizes were three and four ton units.
The average full system cost was $14,278 and heat pump only replacement cost was $9,990.
People with expensive heating fuels and people replacing heat pumps only were
disproportionately represented in the rebate.
The program will save rebate recipients more money in reduced energy bills in the first year
than the program spent.
The rebate is currently calculated at $400/ton of capacity. The average rebate was around $1,500. The
recommendation is that all rebates for complete systems be $1,500. This makes the percentage of cost
even for three and four ton systems, where the four ton systems are currently getting a higher
percentage. Roughly a quarter of all rebates were for existing geothermal systems. These people
already have a loop, so they are getting a rebate that is an even greater fraction of their costs. The
recommendation is that this type of replacement be given a $1,000 rebate. This rebate puts them on
par with the full systems getting a $1,500 rebate. This would make the average rebate 10-11% of
system costs for three and four ton units in both rebate types.

16
Appendix 1 Rebate Number and Dollar Amount by County County Rebates $ amount County Rebates $ amount
Allen 42 $69,000 Daviess 1 $2,000
Huntington 21 $31,800 Jasper 1 $2,000
Hamilton 19 $28,600 Lake 1 $2,000
Hendricks 18 $27,000 Owen 1 $2,000
Monroe 16 $25,400 Vanderburgh 1 $2,000
Dubois 17 $24,800 Bartholomew 1 $1,600
Wells 15 $24,400 Clinton 1 $1,600
Knox 10 $17,600 Fountain 1 $1,600
Morgan 10 $16,200 Howard 1 $1,600
Boone 10 $15,400 Parke 1 $1,600
Steuben 8 $12,800 Perry 1 $1,600
Dekalb 7 $11,400 Ripley 1 $1,600
Marion 7 $9,000 St Joseph 1 $1,600
Noble 6 $9,000 Fulton 1 $1,400
Lagrange 5 $7,600 Benton 1 $1,200
Franklin 5 $7,400 Dearborn 1 $1,200
Putnam 5 $7,400 Fayette 1 $1,200
Shelby 4 $6,400 Spencer 1 $1,200
Wayne 4 $6,400 Tipton 1 $1,200
Decatur 4 $6,000 Union 1 $1,200
Montgomery 4 $6,000 Carroll 0 $0
Rush 4 $6,000 Cass 0 $0
Greene 4 $5,800 Clark 0 $0
Henry 4 $5,800 Clay 0 $0
Delaware 4 $5,600 Crawford 0 $0
Whitley 4 $5,600 Grant 0 $0
Hancock 4 $5,400 Harrison 0 $0
Blackford 3 $5,200 Jackson 0 $0
Warren 3 $5,200 Jay 0 $0
Pike 3 $4,800 Jefferson 0 $0
Johnson 3 $4,600 Jennings 0 $0
Adams 3 $4,200 Lawrence 0 $0
Sullivan 3 $4,200 Miami 0 $0
Tippecanoe 3 $4,000 Newton 0 $0
Floyd 2 $3,600 Ohio 0 $0
Elkhart 2 $3,200 Orange 0 $0
Vigo 2 $3,200 Posey 0 $0
Wabash 2 $3,200 Pulaski 0 $0
Kosciusko 2 $2,800 Randolph 0 $0
Madison 2 $2,800 Scott 0 $0
Brown 2 $2,400 Starke 0 $0
Gibson 2 $2,400 Switzerland 0 $0
LaPorte 2 $2,400 Vermillion 0 $0
Marshall 2 $2,400 Warrick 0 $0
Martin 2 $2,400 Washington 0 $0
Porter 2 $2,400 White 0 $0

17
Appendix 2 Other Rebates

18
Appendix 3 Simple Heat Load Calculation Heating Degree Days of selected cities Evansville=4355 HDD/yr Indianapolis=5700 HDD/yr South Bend=6499 HDD/yr Fort Wayne=6205 HDD/yr
Simple Heat Load Calculation Formula
MMBTU/yr = (HHI * A * HDD)/1,000,000
Where: HHI = Home Heating Index (btu/ ft
2*yr)
8 is an average value. The more airtight and well insulated a home the lower the HHI and less energy used.
A = Average home size (ft2), 2731 ft
2is the average from the data
HDD=Heating Degree Days/year
Using 8 for HHI and the HDD for Indianapolis, we get ~125 MMBTU/yr heat load. This compares favorably to what
was modeled using the software. Using other climate data will affect the heat load.