Embed Size (px)
Citation preview
Terms of Reference
• Indian Maritime perspective 2020
• India’s Bunkering Prospects•International bunker calls on Indian Ports•Coastal Shipping – bunkering aspects
• Implications of Deadline 2020 on Bunker grades fuels
• Indian Bunkering system changes and its Govt support
• Indian Oil bunkering presence
2
Indian Maritime Perspective 2020
3
• National Maritime Agenda 2010-20- an ambitious plan
• Increase Indian tonnage four fold to 43 million Gross Tonnage
• Enhance port capacity to 3130 MMT by 2020
More than 50 per cent of this capacity to be created in the non-major ports.The projected capacity enhancement at the Major ports in 2017-18 to 1230 MMT ( 22% enhancement)
• Promote Coastal Shipping and facilitate IWT transport route
• For the development of inland waterways, an allocation of Rs.4,200 crore under a new project called Jal Marg Vikas (national waterways-I) on the Ganga river.
• The said project is expected to come up between Allahabad and Haldia to cover a distance of 1,620 km over a period of six years.
Indian Maritime Perspective
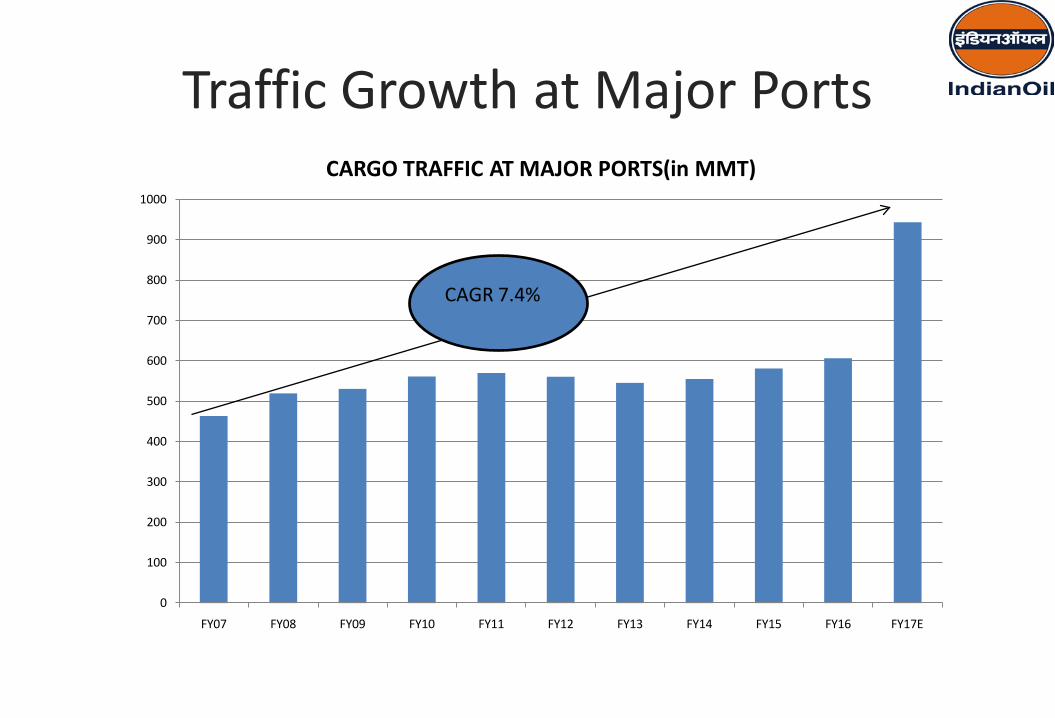
Traffic Growth at Major Ports
0
100
200
300
400
500
600
700
800
900
1000
FY07 FY08 FY09 FY10 FY11 FY12 FY13 FY14 FY15 FY16 FY17E
CARGO TRAFFIC AT MAJOR PORTS(in MMT)
CAGR 7.4%
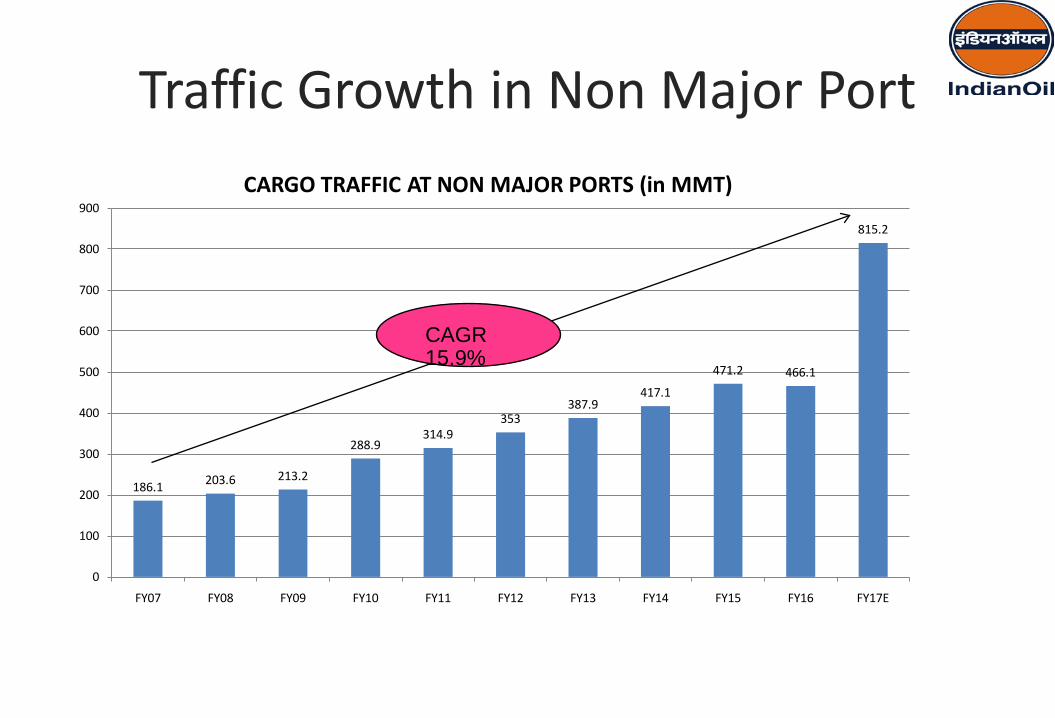
Traffic Growth in Non Major Port
186.1 203.6 213.2
288.9314.9
353387.9
417.1
471.2 466.1
815.2
0
100
200
300
400
500
600
700
800
900
FY07 FY08 FY09 FY10 FY11 FY12 FY13 FY14 FY15 FY16 FY17E
CARGO TRAFFIC AT NON MAJOR PORTS (in MMT)
CAGR 15.9%
6
India’s Bunkering Prospects :
•International bunker calls on Indian Ports
•Coastal Shipping – bunkering aspects
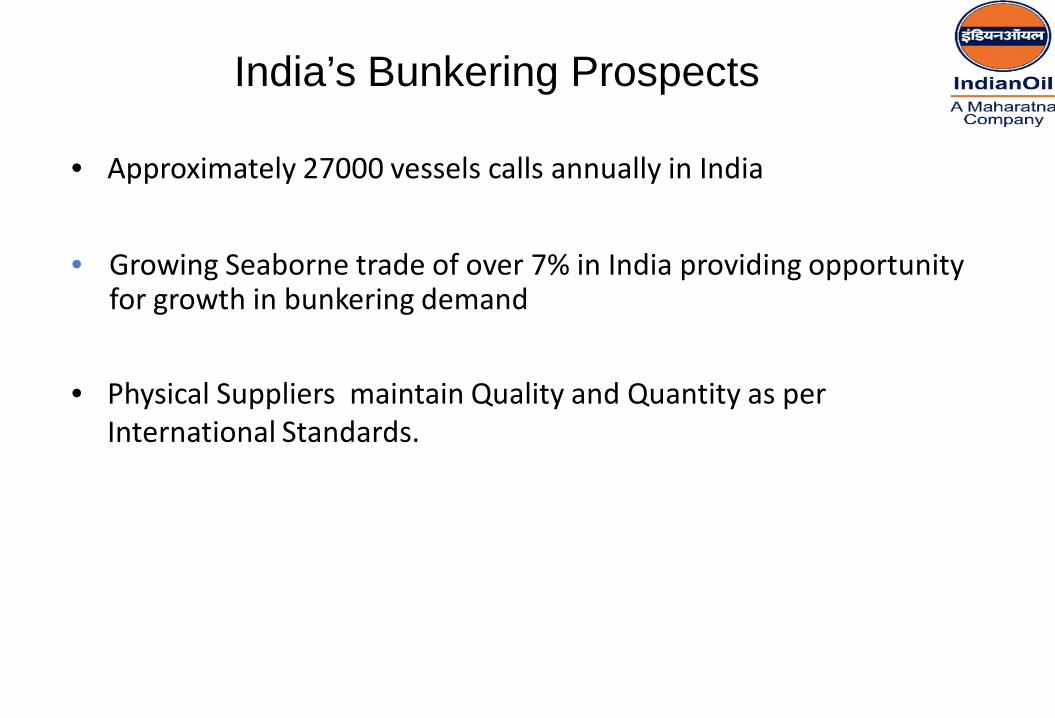
India’s Bunkering Prospects
• Approximately 27000 vessels calls annually in India
• Growing Seaborne trade of over 7% in India providing opportunity for growth in bunkering demand
• Physical Suppliers maintain Quality and Quantity as per International Standards.
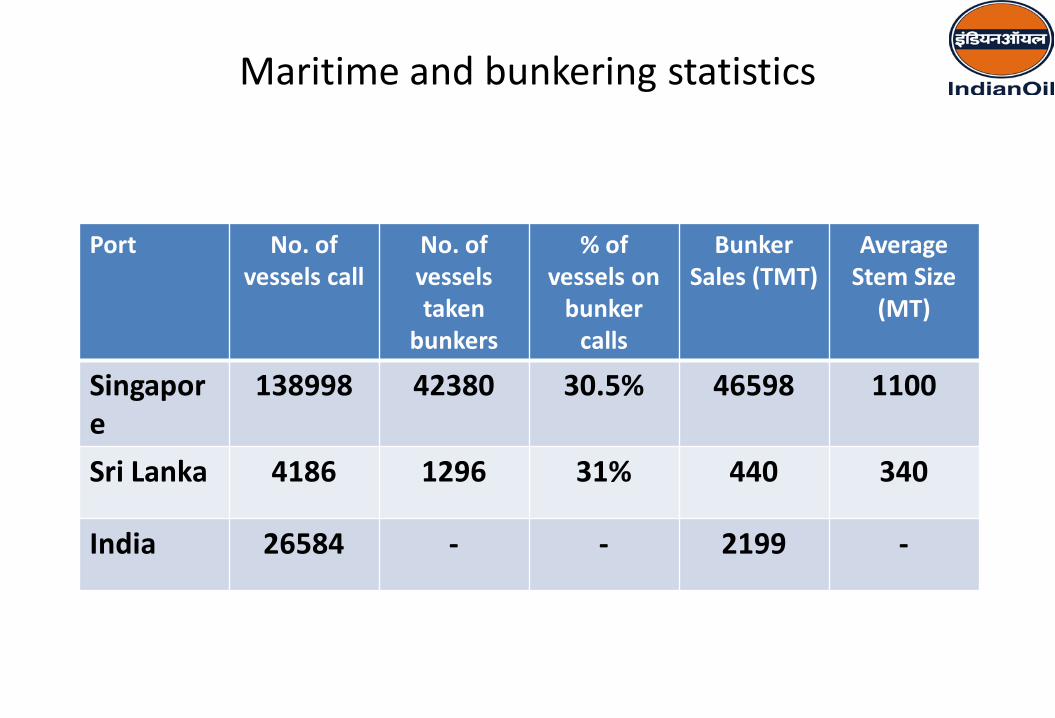
Maritime and bunkering statistics
Port No. of vessels call
No. of vessels taken
bunkers
% of vessels on
bunker calls
Bunker Sales (TMT)
Average Stem Size
(MT)
Singapore
138998 42380 30.5% 46598 1100
Sri Lanka 4186 1296 31% 440 340
India 26584 - - 2199 -

BUNKER POTENTIAL-INDIAN PORTS
PORT Average Annual Call of vessels
Bunker Potential (TMTPA) 2017-18
Bunker Potential (TMTPA) 2021-22
MUMBAI (INCL. JNPT) 5013 602 1220
KANDLA 3269 392 796
VIZAG 2166 260 527
CHENNAI 1840 221 448
TUTICORIN 1680 202 409
PARADIP 1519 182 370
HALDIA 1889 227 460
NEW MANGALORE 1236 148 301
KOLKATA 1175 141 286
ENNORE 456 55 111
GOA 168 20 41
KOCHI 1666 119 242
OTHER PORTS ( Like Mundra, Sikka,Vadinar,
Karaikal, Krishnapatnam, Dhamra etc.)
5180 622 2783
9
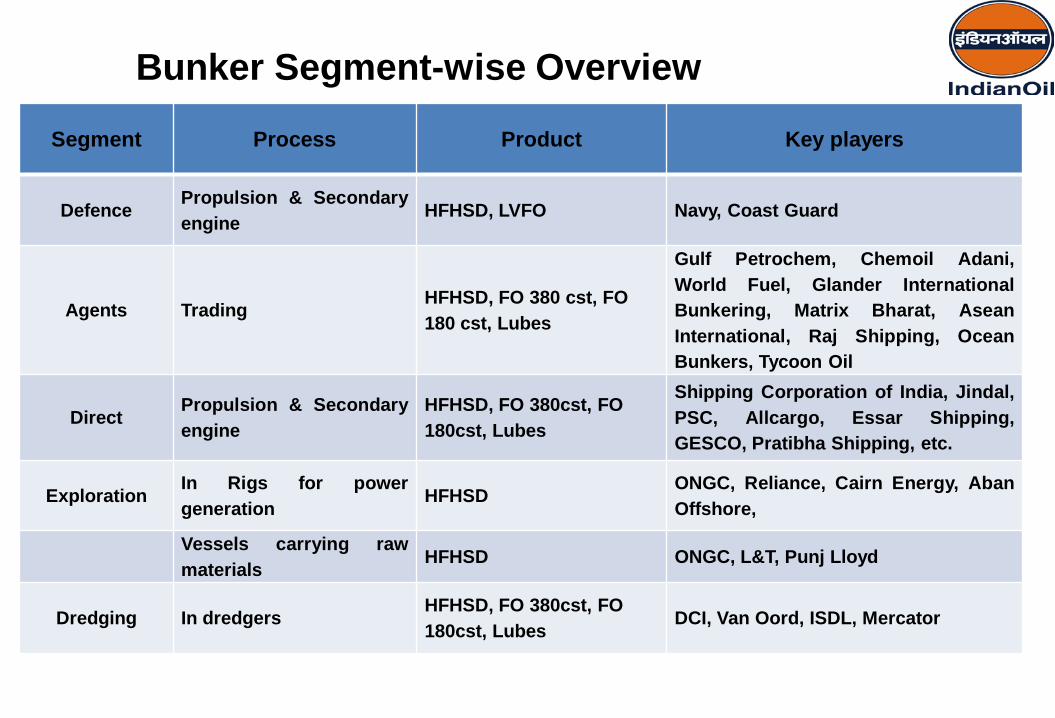
Bunker Segment-wise Overview
Segment Process Product Key players
DefencePropulsion & Secondaryengine
HFHSD, LVFO Navy, Coast Guard
Agents TradingHFHSD, FO 380 cst, FO 180 cst, Lubes
Gulf Petrochem, Chemoil Adani,World Fuel, Glander InternationalBunkering, Matrix Bharat, AseanInternational, Raj Shipping, OceanBunkers, Tycoon Oil
DirectPropulsion & Secondaryengine
HFHSD, FO 380cst, FO 180cst, Lubes
Shipping Corporation of India, Jindal,PSC, Allcargo, Essar Shipping,GESCO, Pratibha Shipping, etc.
ExplorationIn Rigs for powergeneration
HFHSDONGC, Reliance, Cairn Energy, AbanOffshore,
Vessels carrying rawmaterials
HFHSD ONGC, L&T, Punj Lloyd
Dredging In dredgersHFHSD, FO 380cst, FO 180cst, Lubes
DCI, Van Oord, ISDL, Mercator
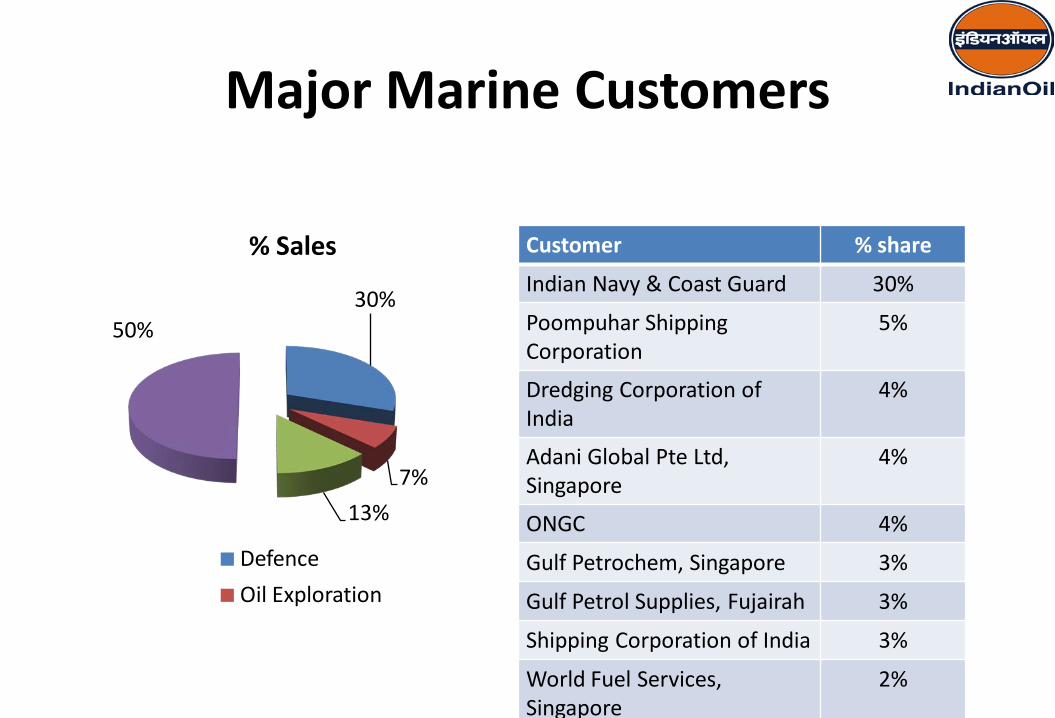
Major Marine Customers
30%
7%13%
50%
% Sales
DefenceOil Exploration
Customer % share
Indian Navy & Coast Guard 30%
Poompuhar Shipping Corporation
5%
Dredging Corporation of India
4%
Adani Global Pte Ltd, Singapore
4%
ONGC 4%
Gulf Petrochem, Singapore 3%
Gulf Petrol Supplies, Fujairah 3%
Shipping Corporation of India 3%
World Fuel Services, Singapore
2%
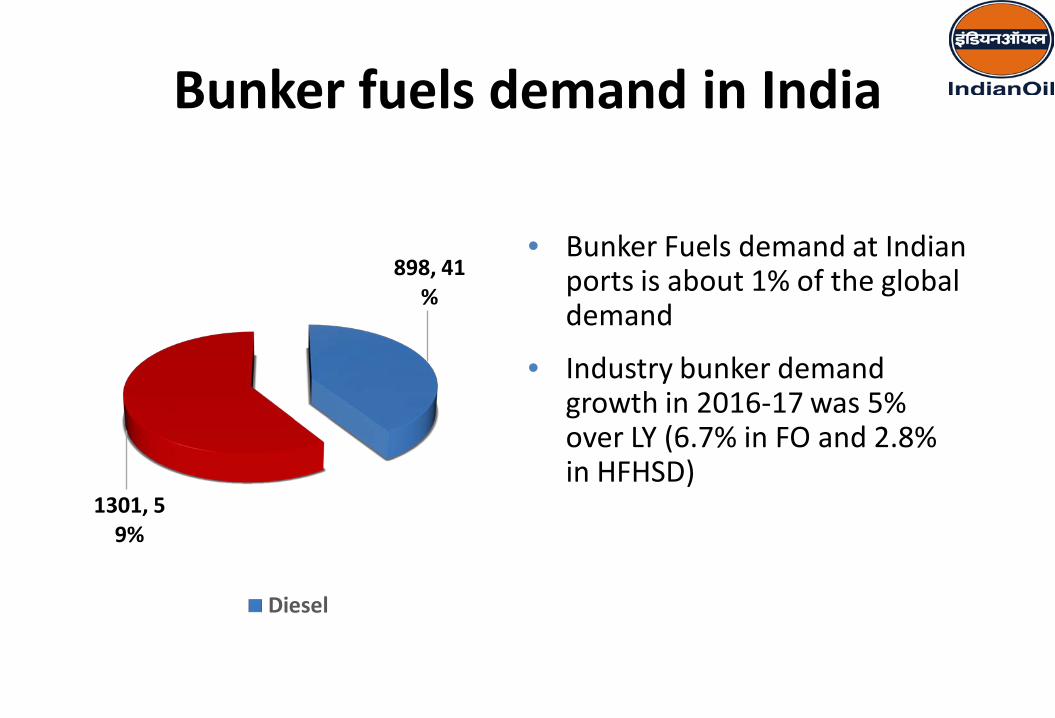
Bunker fuels demand in India
898, 41%
1301, 59%
Diesel
• Bunker Fuels demand at Indian ports is about 1% of the global demand
• Industry bunker demand growth in 2016-17 was 5% over LY (6.7% in FO and 2.8% in HFHSD)
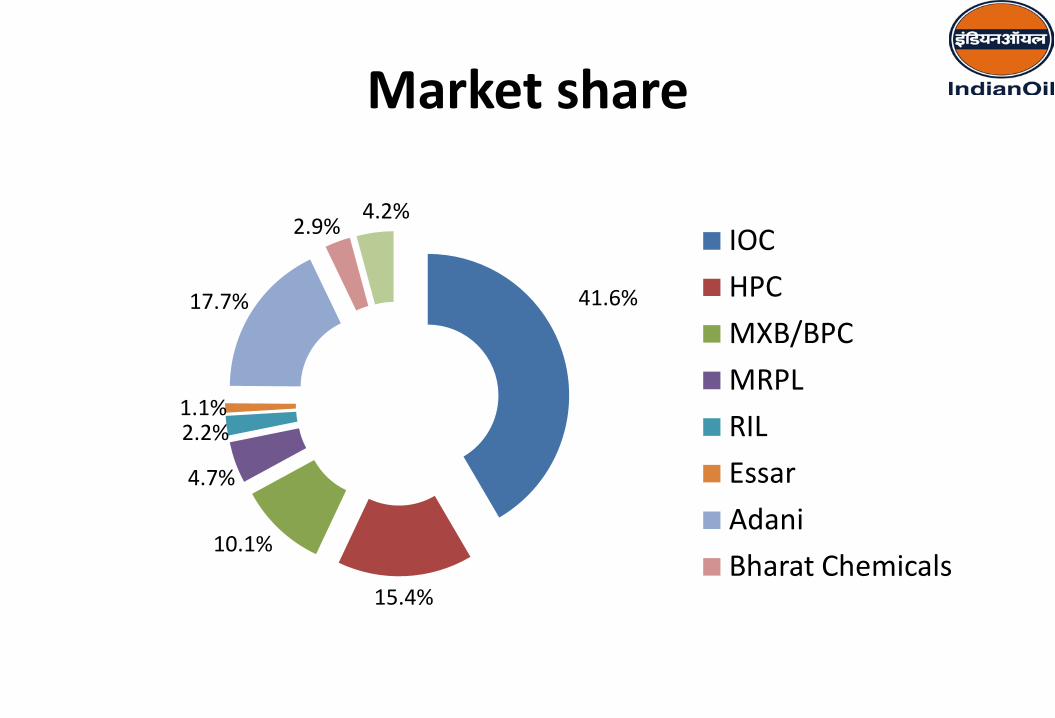
Market share
41.6%
15.4%
10.1%
4.7%
2.2%1.1%
17.7%
2.9%4.2%
IOCHPCMXB/BPCMRPLRILEssarAdaniBharat Chemicals
• India : between two strong bunkering Hubs, Singapore and Fujiarah
• Distributed potential in India leading to multiple expenditure forcreating facilities for much lesser volume, whereas concentricpotential at Singapore & Fujiarah
•14
Indian Bunkering Challenges
IN D IAN OIL
15
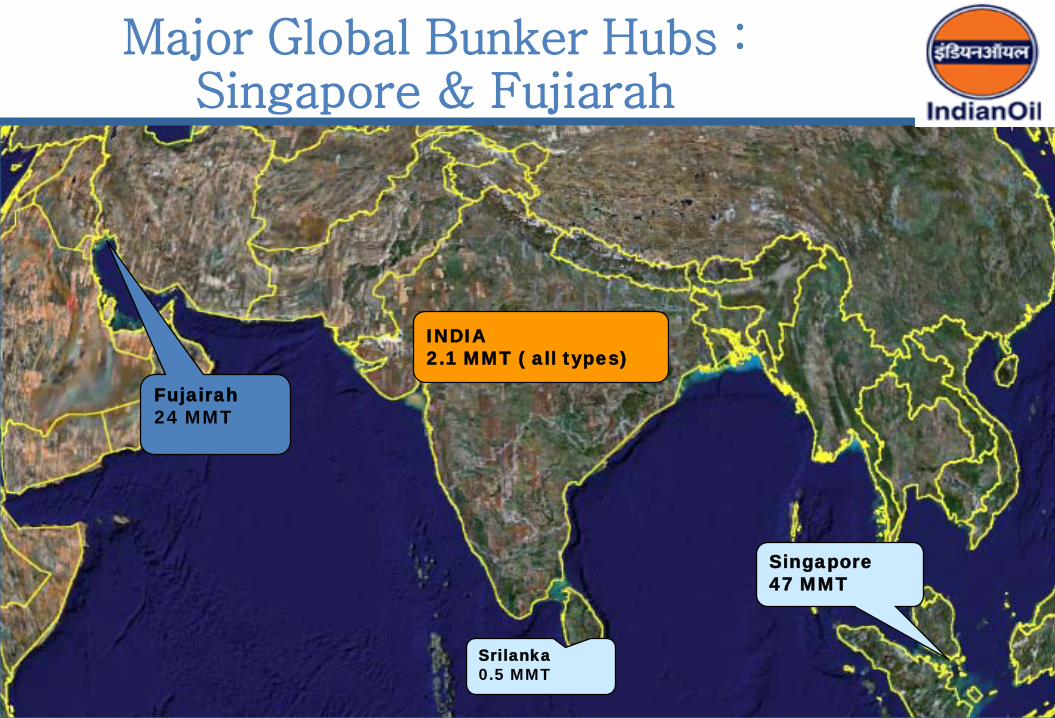
Major Global Bunker Hubs : Singapore & Fujiarah
15Srilanka0.5 MMT
Singapore47 MMT
Fujairah24 MMT
INDIA2.1 MMT ( all types)
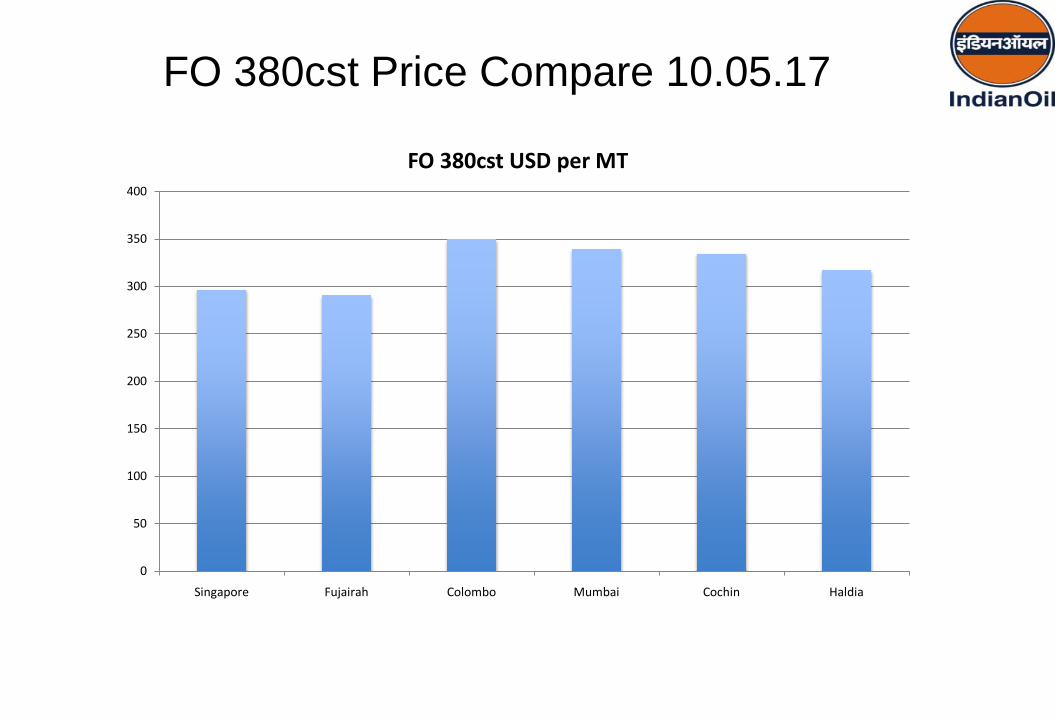
FO 380cst Price Compare 10.05.17
0
50
100
150
200
250
300
350
400
Singapore Fujairah Colombo Mumbai Cochin Haldia
FO 380cst USD per MT
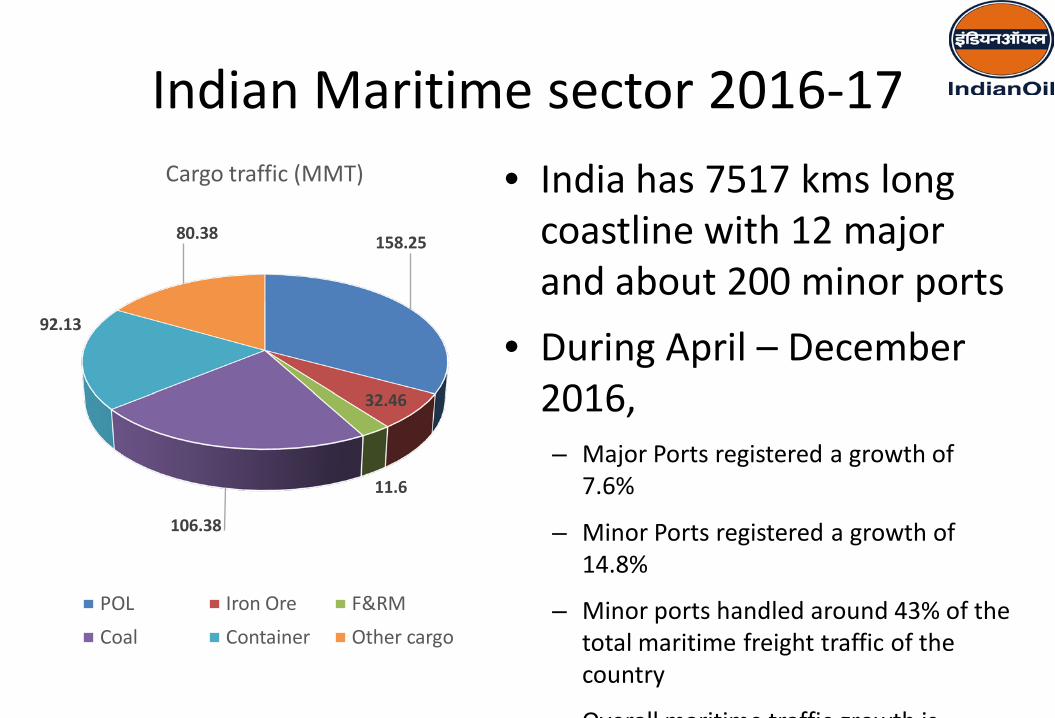
Indian Maritime sector 2016-17• India has 7517 kms long
coastline with 12 major and about 200 minor ports
• During April – December 2016,– Major Ports registered a growth of
7.6%
– Minor Ports registered a growth of 14.8%
– Minor ports handled around 43% of the total maritime freight traffic of the country
Overall maritime traffic growth is
158.25
32.46
11.6
106.38
92.13
80.38
Cargo traffic (MMT)
POL Iron Ore F&RMCoal Container Other cargo
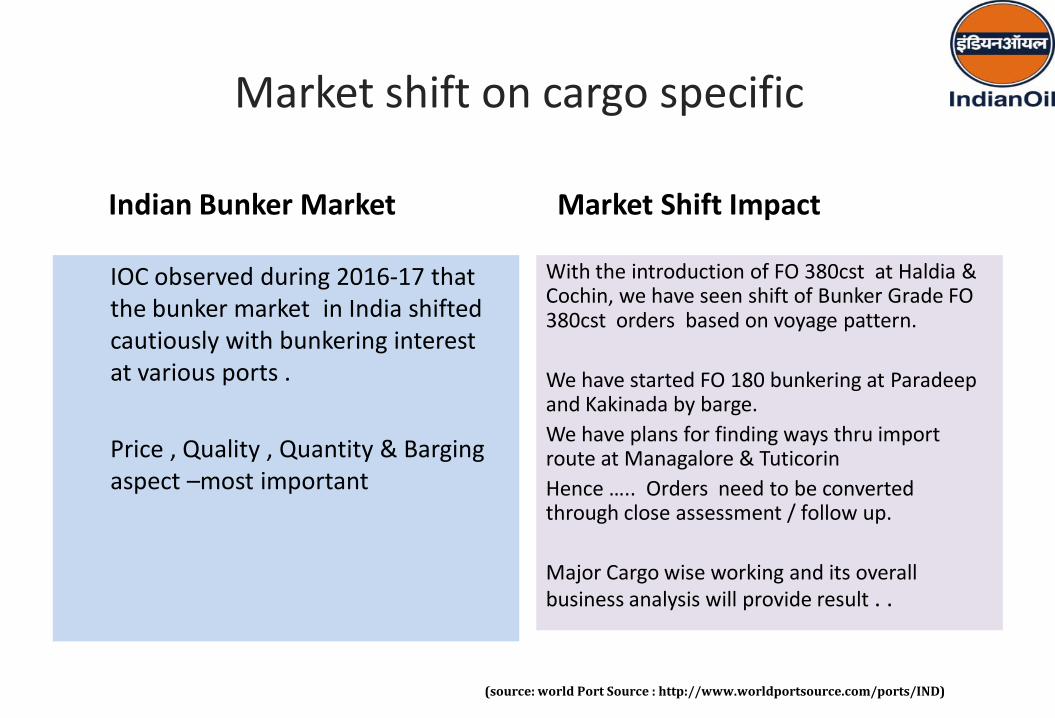
Market shift on cargo specific
IOC observed during 2016-17 that the bunker market in India shifted cautiously with bunkering interest at various ports .
Price , Quality , Quantity & Barging aspect –most important
With the introduction of FO 380cst at Haldia & Cochin, we have seen shift of Bunker Grade FO 380cst orders based on voyage pattern.
We have started FO 180 bunkering at Paradeepand Kakinada by barge.We have plans for finding ways thru import route at Managalore & TuticorinHence ….. Orders need to be converted through close assessment / follow up.
Major Cargo wise working and its overall business analysis will provide result . .
(source: world Port Source : http://www.worldportsource.com/ports/IND)
Indian Bunker Market Market Shift Impact
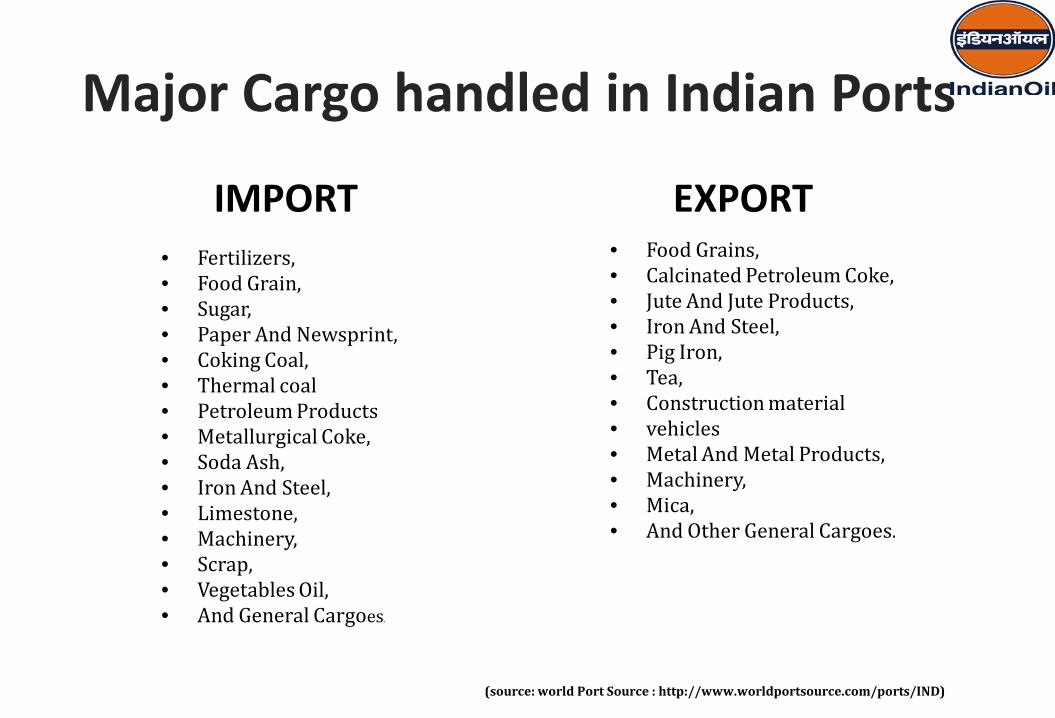
Major Cargo handled in Indian Ports
• Fertilizers, • Food Grain, • Sugar, • Paper And Newsprint, • Coking Coal, • Thermal coal• Petroleum Products• Metallurgical Coke, • Soda Ash, • Iron And Steel, • Limestone, • Machinery, • Scrap, • Vegetables Oil,• And General Cargoes.
• Food Grains, • Calcinated Petroleum Coke, • Jute And Jute Products, • Iron And Steel, • Pig Iron, • Tea,• Construction material• vehicles • Metal And Metal Products, • Machinery, • Mica, • And Other General Cargoes.
(source: world Port Source : http://www.worldportsource.com/ports/IND)
IMPORT EXPORT
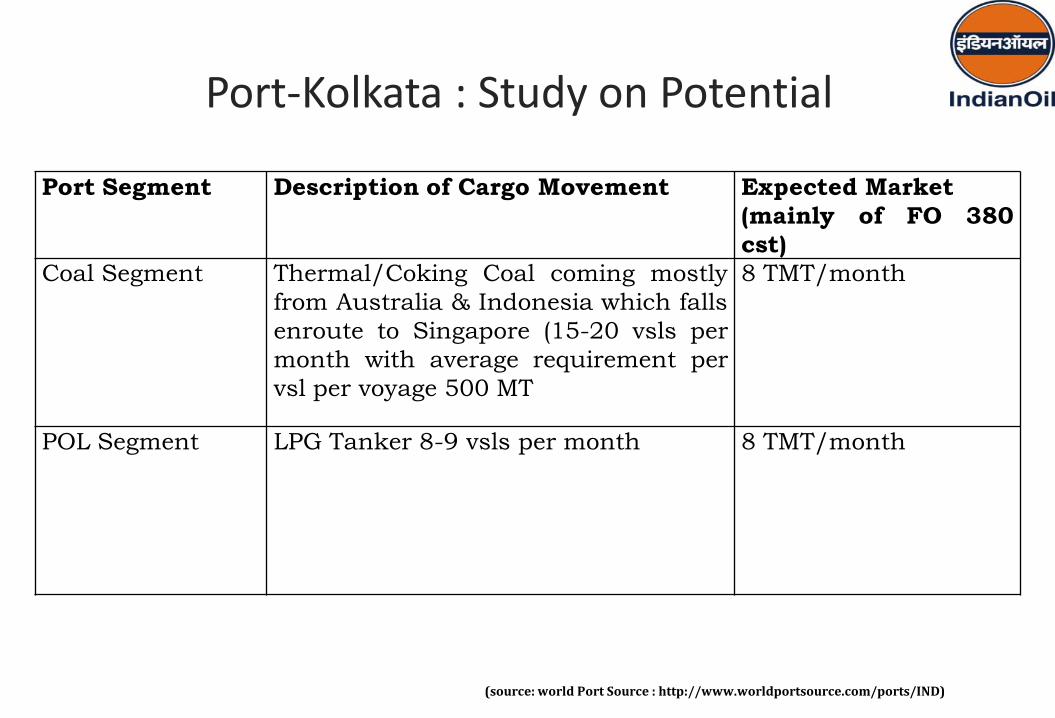
Port-Kolkata : Study on Potential
(source: world Port Source : http://www.worldportsource.com/ports/IND)
Port Segment Description of Cargo Movement Expected Market(mainly of FO 380cst)
Coal Segment Thermal/Coking Coal coming mostlyfrom Australia & Indonesia which fallsenroute to Singapore (15-20 vsls permonth with average requirement pervsl per voyage 500 MT
8 TMT/month
POL Segment LPG Tanker 8-9 vsls per month 8 TMT/month
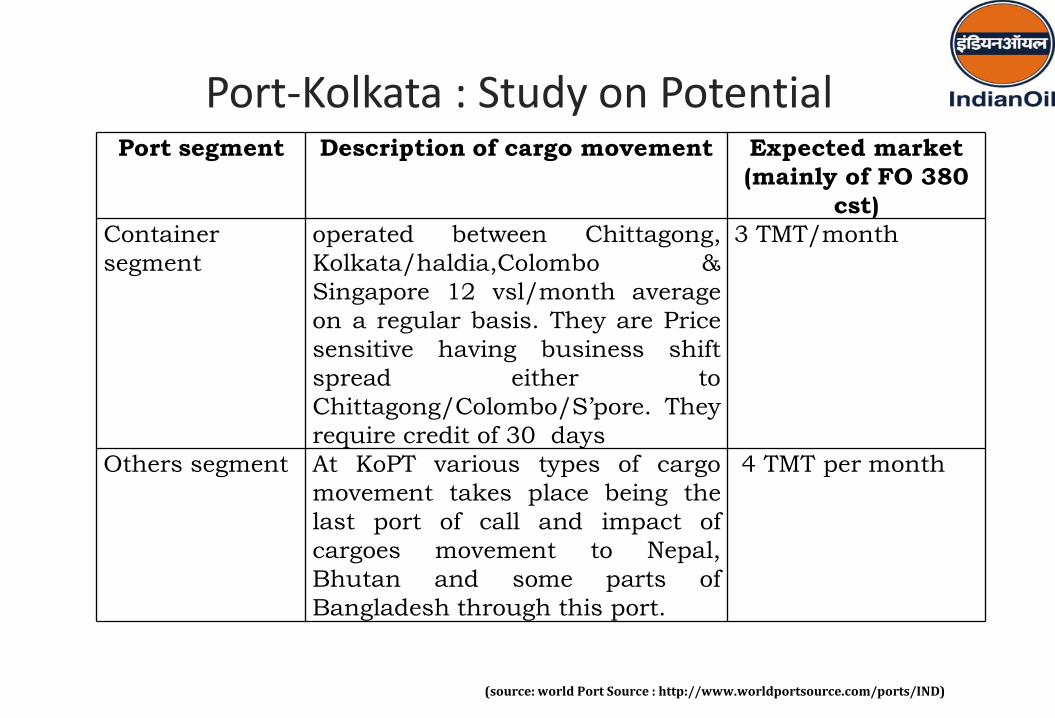
Port-Kolkata : Study on Potential
(source: world Port Source : http://www.worldportsource.com/ports/IND)
Port segment Description of cargo movement Expected market (mainly of FO 380
cst)Containersegment
operated between Chittagong,Kolkata/haldia,Colombo &Singapore 12 vsl/month averageon a regular basis. They are Pricesensitive having business shiftspread either toChittagong/Colombo/S’pore. Theyrequire credit of 30 days
3 TMT/month
Others segment At KoPT various types of cargomovement takes place being thelast port of call and impact ofcargoes movement to Nepal,Bhutan and some parts ofBangladesh through this port.
4 TMT per month
22
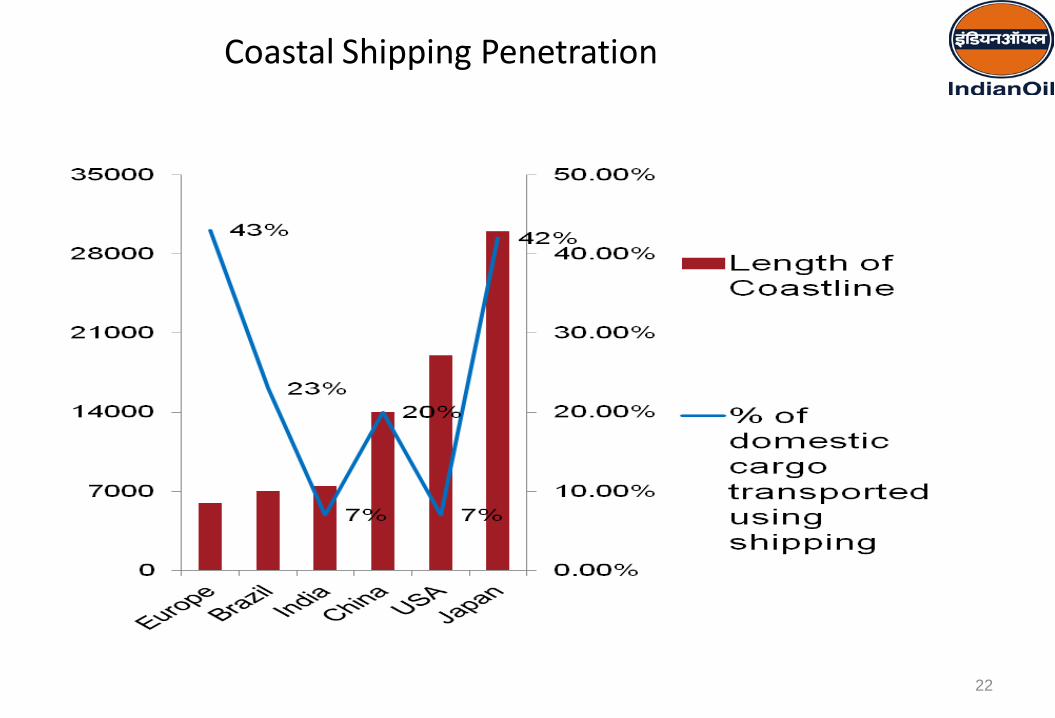
Coastal Shipping Penetration
23
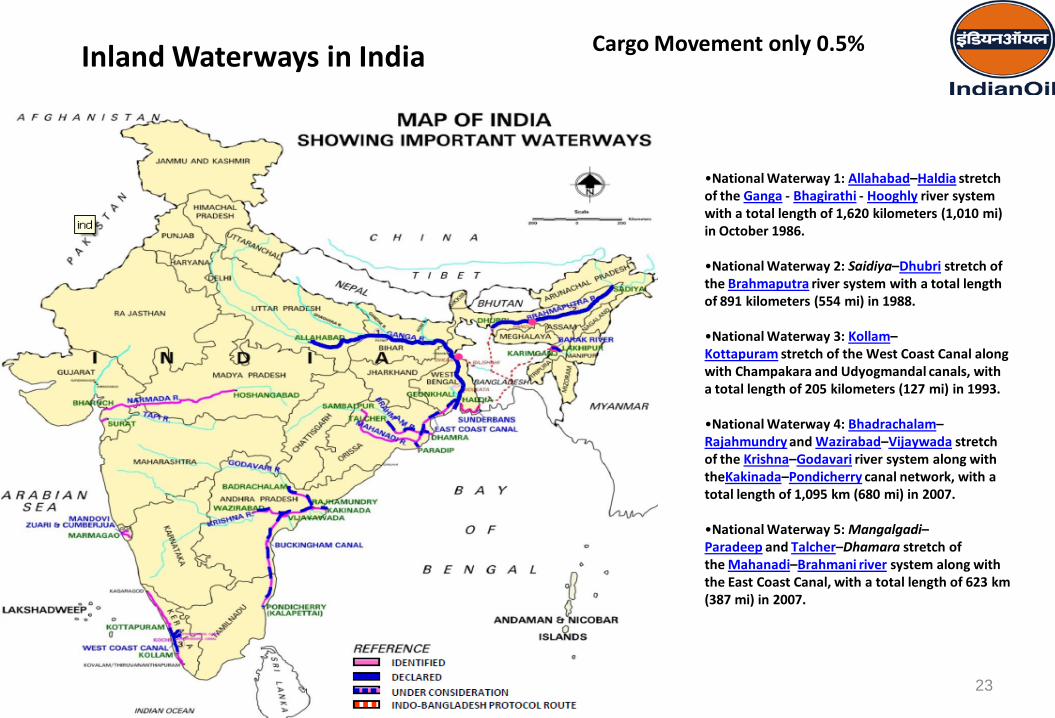
Inland Waterways in India Cargo Movement only 0.5%
•National Waterway 1: Allahabad–Haldia stretch of the Ganga - Bhagirathi - Hooghly river system with a total length of 1,620 kilometers (1,010 mi) in October 1986.
•National Waterway 2: Saidiya–Dhubri stretch of the Brahmaputra river system with a total length of 891 kilometers (554 mi) in 1988.
•National Waterway 3: Kollam–Kottapuram stretch of the West Coast Canal along with Champakara and Udyogmandal canals, with a total length of 205 kilometers (127 mi) in 1993.
•National Waterway 4: Bhadrachalam–Rajahmundry and Wazirabad–Vijaywada stretch of the Krishna–Godavari river system along with theKakinada–Pondicherry canal network, with a total length of 1,095 km (680 mi) in 2007.
•National Waterway 5: Mangalgadi–Paradeep and Talcher–Dhamara stretch of the Mahanadi–Brahmani river system along with the East Coast Canal, with a total length of 623 km (387 mi) in 2007.
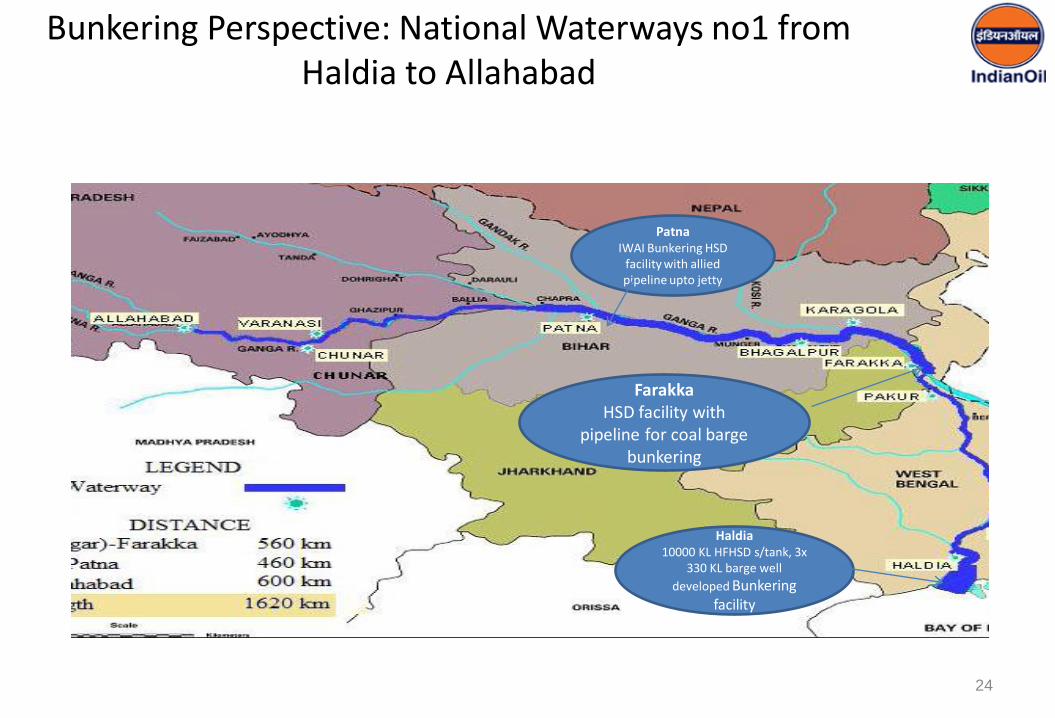
Bunkering Perspective: National Waterways no1 from Haldia to Allahabad
24
FarakkaHSD facility with
pipeline for coal barge bunkering
Haldia10000 KL HFHSD s/tank, 3x
330 KL barge well developed Bunkering
facility
PatnaIWAI Bunkering HSD
facility with allied pipeline upto jetty
25
Implications of Deadline 2020 on Bunkergrades fuels
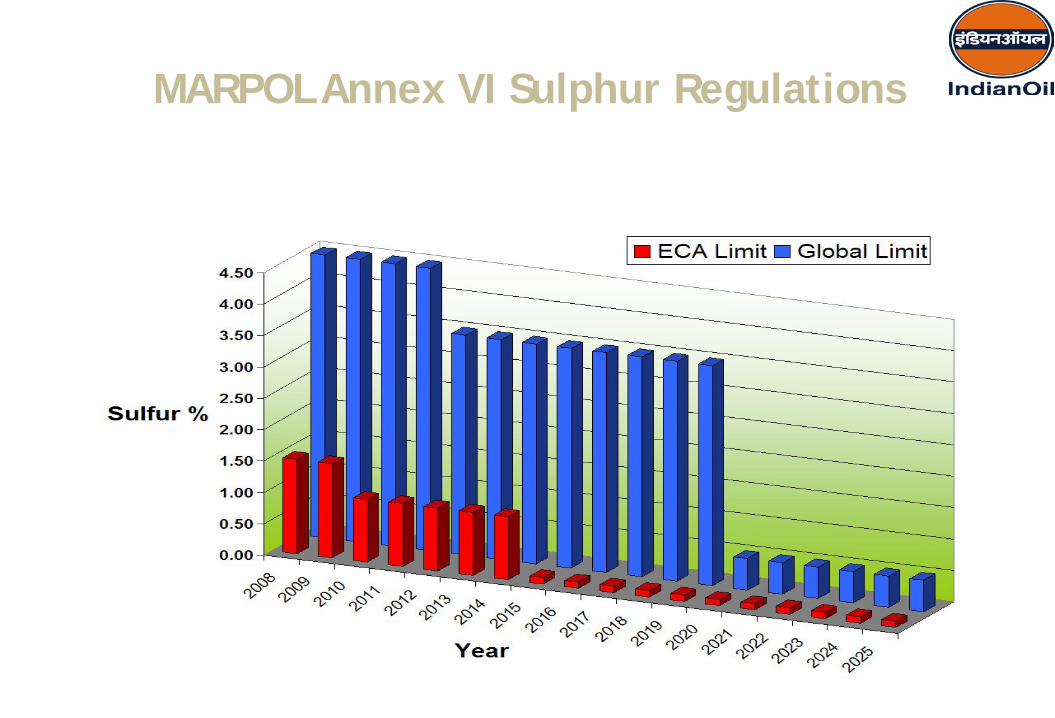
MARPOLAnnex VI Sulphur Regulations
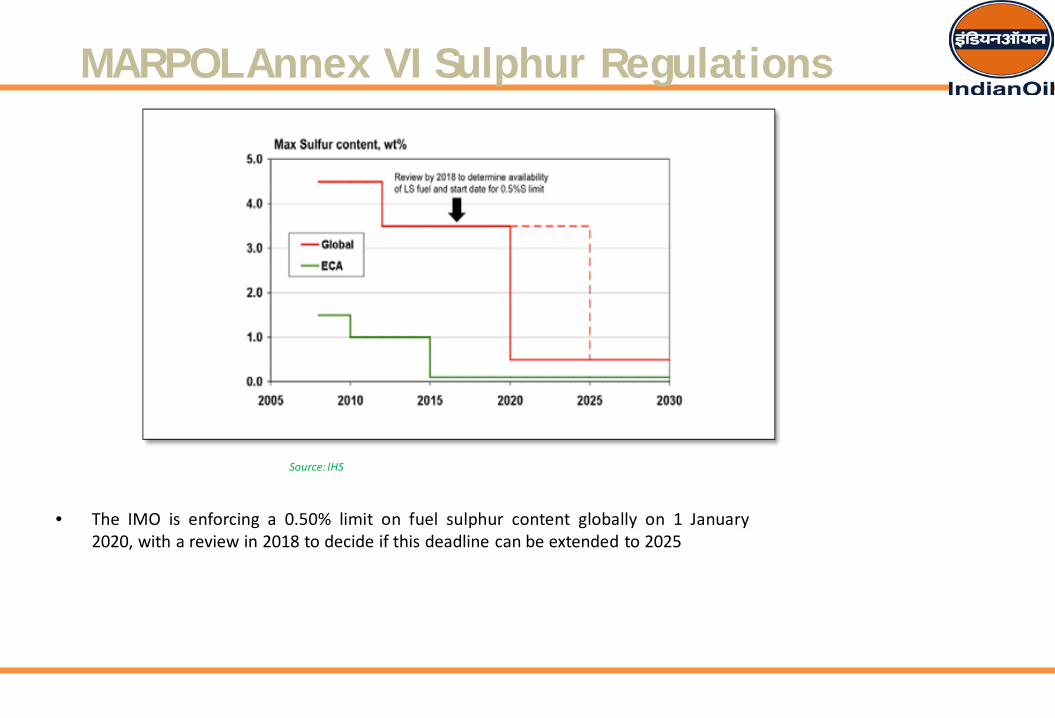
• The IMO is enforcing a 0.50% limit on fuel sulphur content globally on 1 January2020, with a review in 2018 to decide if this deadline can be extended to 2025
Source: IHS
MARPOLAnnex VI Sulphur Regulations
0
50
100
150
200
250
300
350
400
450
500
2004 2005 2006 2007 2008 2009 2010 2011 2012 2013 2014 2015 2016 2017 2018 2019 2020 2021 2022 2023 2024 2025
Residual Max 1.5% Residual Max 1.0% Residual Max 4.5% Residual max 3.5%Distillate Max 0.1% Distillate Max 0.5% Distillate - Other 28
Source : Outlook for Marine Bunkers and Fuel Oil to 2025 by Marine & Energy Consulting and Energy Market Consultants
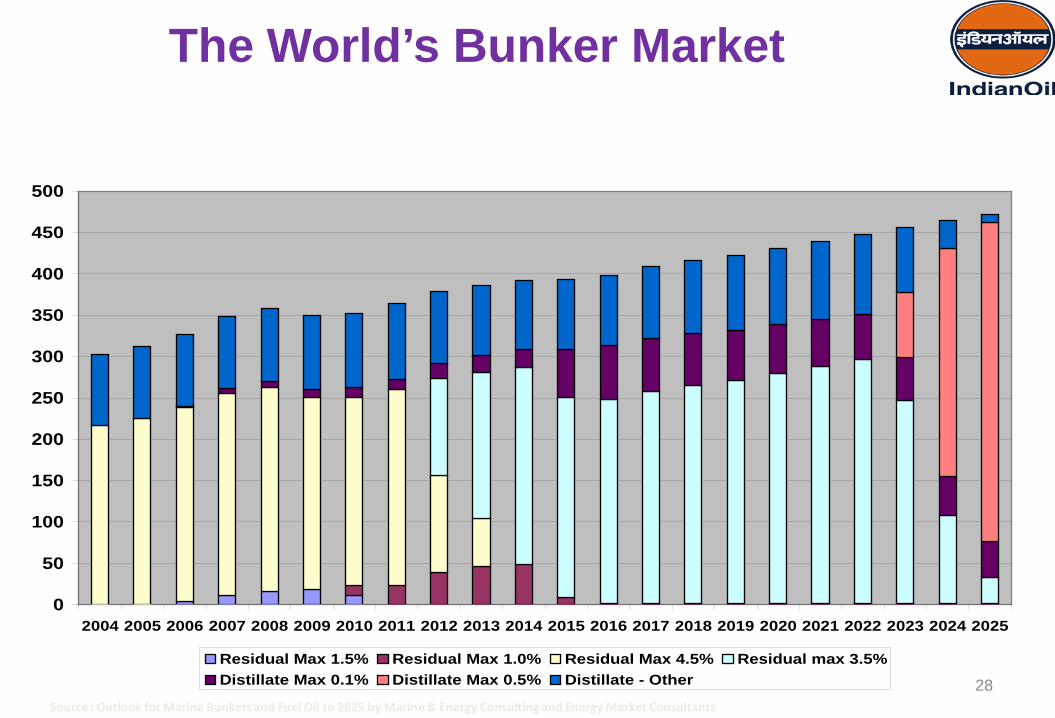
The World’s Bunker Market
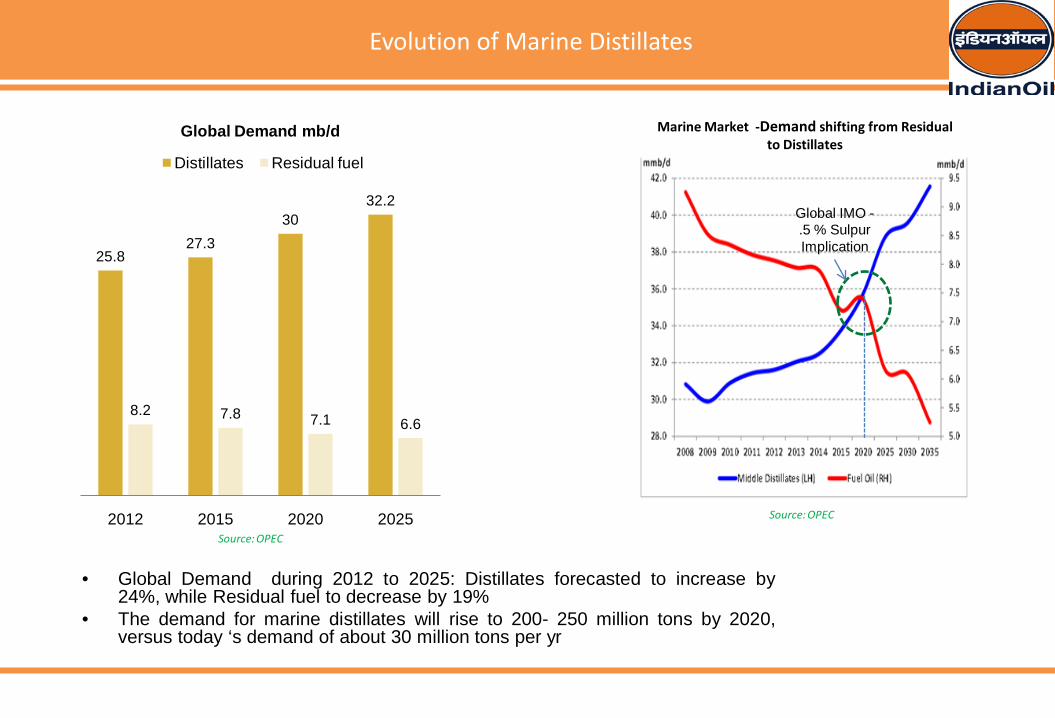
Evolution of Marine Distillates
25.827.3
3032.2
8.2 7.8 7.1 6.6
2012 2015 2020 2025
Global Demand mb/d
Distillates Residual fuel
Marine Market -Demand shifting from Residual to Distillates
• Global Demand during 2012 to 2025: Distillates forecasted to increase by24%, while Residual fuel to decrease by 19%
• The demand for marine distillates will rise to 200- 250 million tons by 2020,versus today ‘s demand of about 30 million tons per yr
Global IMO -.5 % SulpurImplication
Source: OPEC
Source: OPEC
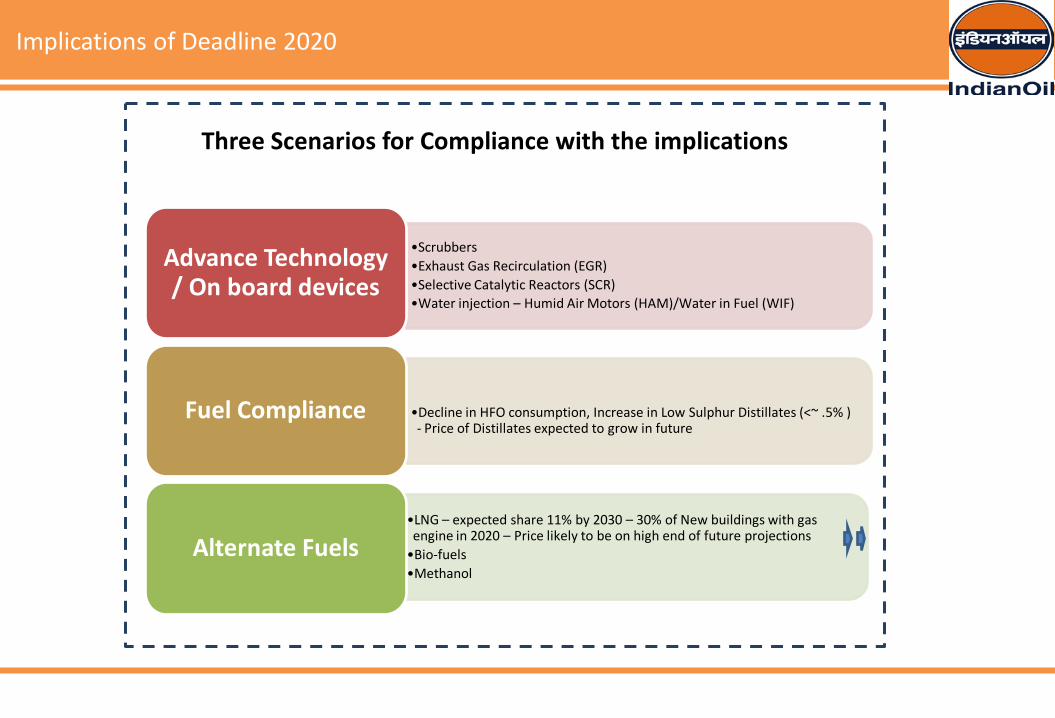
Implications of Deadline 2020
•Scrubbers•Exhaust Gas Recirculation (EGR)•Selective Catalytic Reactors (SCR)•Water injection – Humid Air Motors (HAM)/Water in Fuel (WIF)
Advance Technology / On board devices
•Decline in HFO consumption, Increase in Low Sulphur Distillates (<~ .5% ) - Price of Distillates expected to grow in future
Fuel Compliance
•LNG – expected share 11% by 2030 – 30% of New buildings with gas engine in 2020 – Price likely to be on high end of future projections •Bio-fuels•Methanol
Alternate Fuels
Three Scenarios for Compliance with the implications
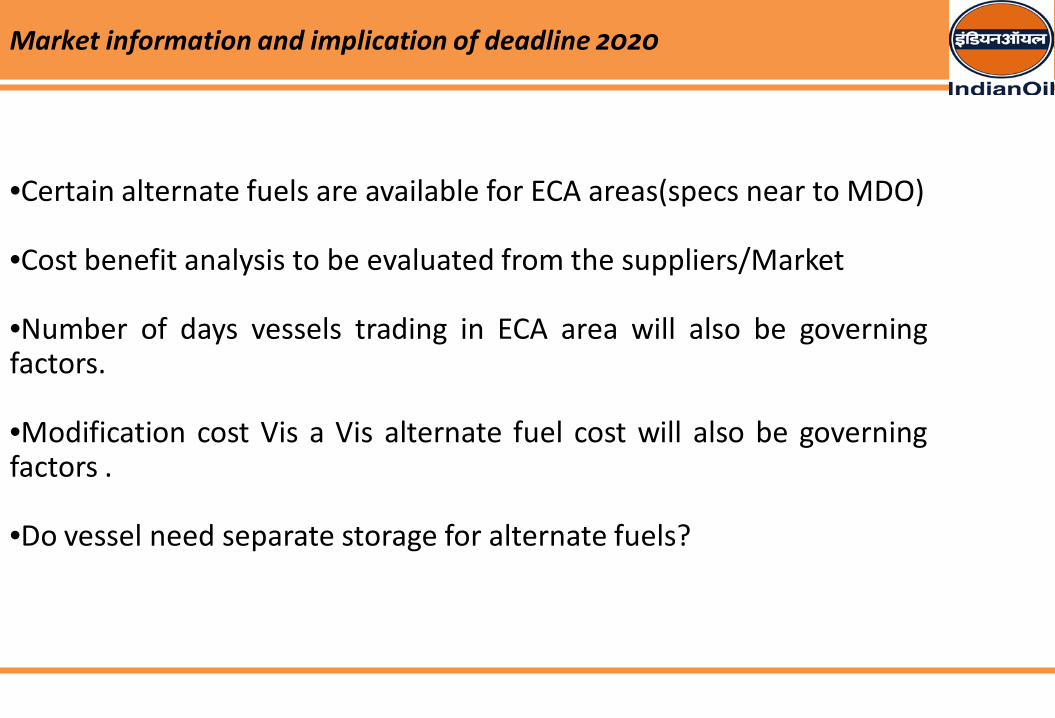
Market information and implication of deadline 2020
•Certain alternate fuels are available for ECA areas(specs near to MDO)
•Cost benefit analysis to be evaluated from the suppliers/Market
•Number of days vessels trading in ECA area will also be governingfactors.
•Modification cost Vis a Vis alternate fuel cost will also be governingfactors .
•Do vessel need separate storage for alternate fuels?
32
Indian Bunkering system changes and itsGovt support
33
SuezHormuz
PanamaMalacca
Bosporus
Magellan
Good Hope
Gibraltar
Bab el-Mandab
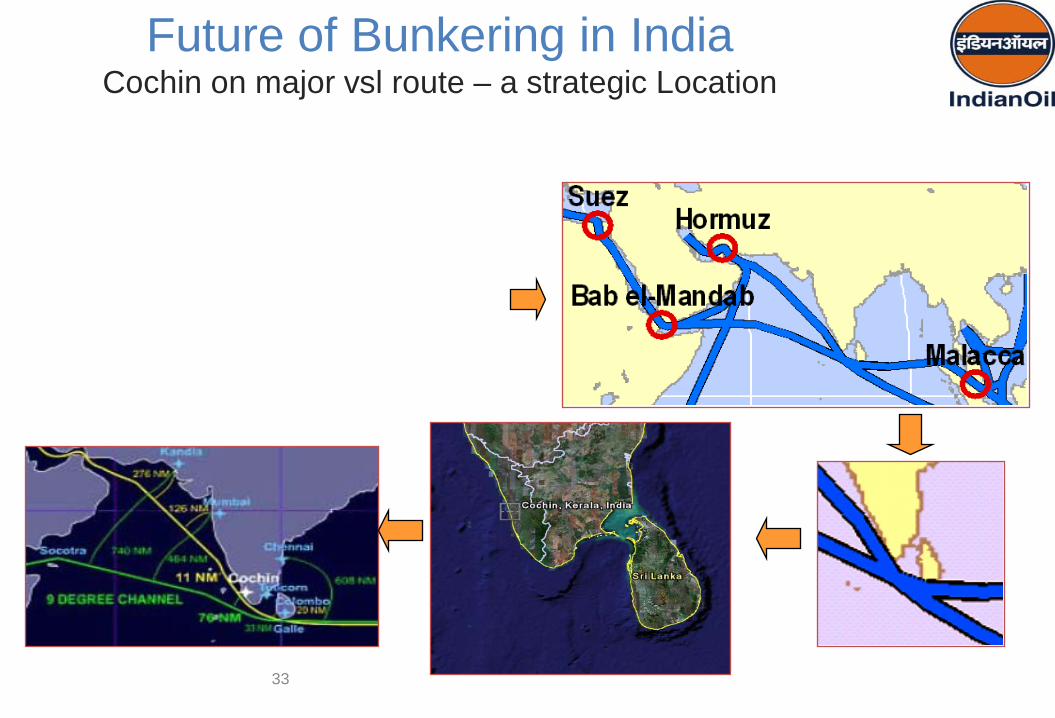
Future of Bunkering in IndiaCochin on major vsl route – a strategic Location
Indian bunkering system –Changes in the concept• OPL bunker supply permission without callings charges –Cochin had
spearheaded and result is known
Floating permissions –an important step.
• Ports of respective State Governments will get additional wharfage on increased volume of supply.
• India will earn more foreign exchange as the payments are normally in term of US dollar.
• Subsidiary industries like barging cos/shipping agencies will increase which will result in more employment generation and more revenue to State Governments.
• Indian Ports will become the bunkering ports in international market, which will help to generate revenue to the port by way sales of fresh water/ship’s stores supplies etc.
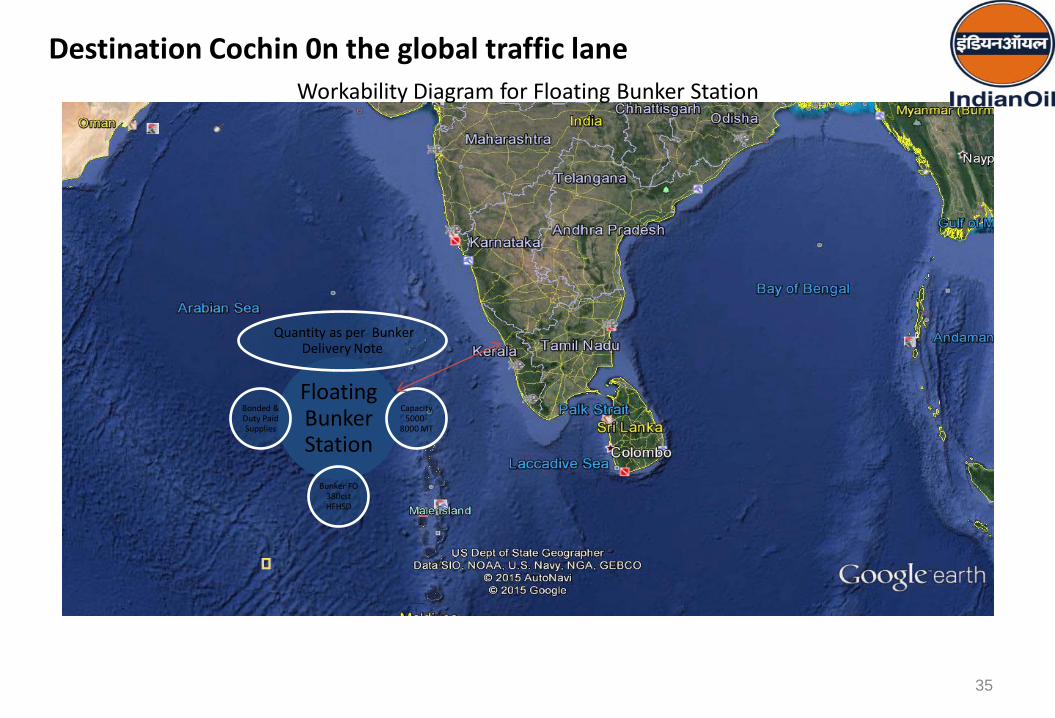
35
Floating Bunker Station
Quantity as per Bunker Delivery Note
Capacity 5000-
8000 MT
Bunker FO 380cst HFHSD
Bonded & Duty Paid Supplies
Destination Cochin 0n the global traffic laneWorkability Diagram for Floating Bunker Station
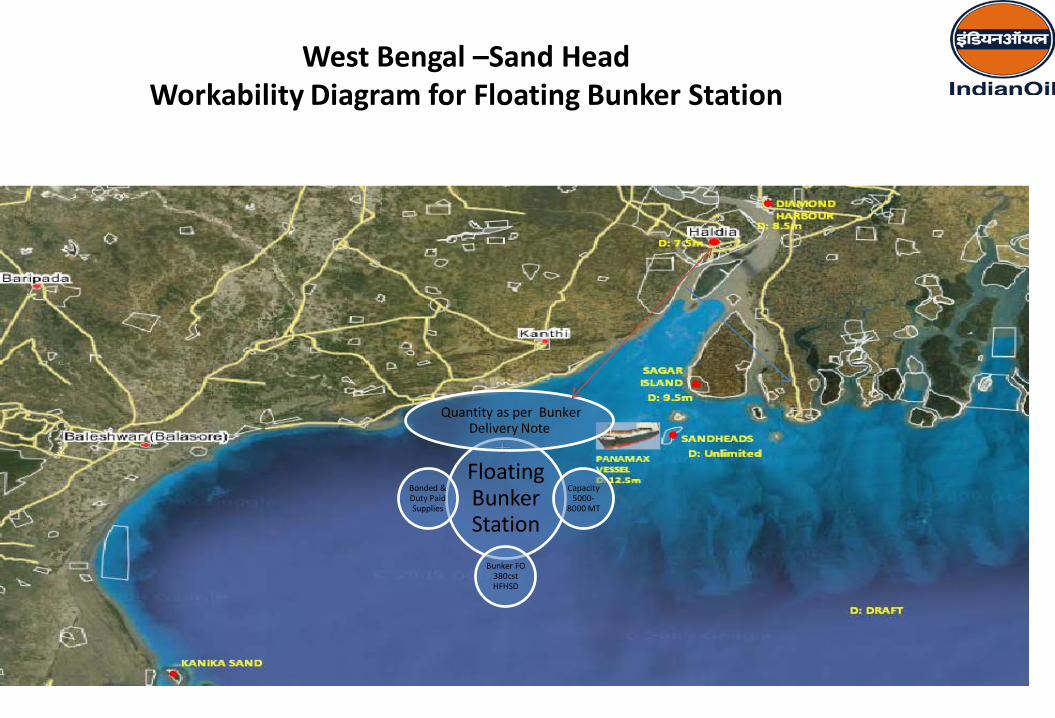
Floating Bunker Station
Quantity as per Bunker Delivery Note
Capacity 5000-
8000 MT
Bunker FO 380cst HFHSD
Bonded & Duty Paid Supplies
West Bengal –Sand HeadWorkability Diagram for Floating Bunker Station
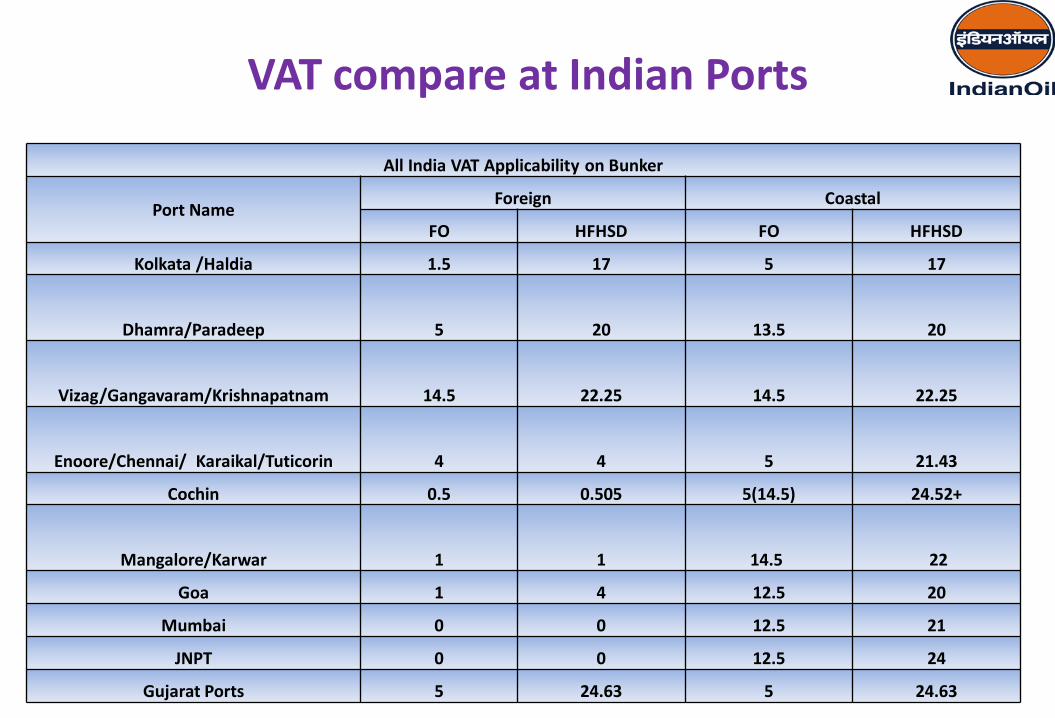
VAT compare at Indian Ports
All India VAT Applicability on Bunker
Port Name Foreign Coastal
FO HFHSD FO HFHSD
Kolkata /Haldia 1.5 17 5 17
Dhamra/Paradeep 5 20 13.5 20
Vizag/Gangavaram/Krishnapatnam 14.5 22.25 14.5 22.25
Enoore/Chennai/ Karaikal/Tuticorin 4 4 5 21.43
Cochin 0.5 0.505 5(14.5) 24.52+
Mangalore/Karwar 1 1 14.5 22
Goa 1 4 12.5 20
Mumbai 0 0 12.5 21
JNPT 0 0 12.5 24
Gujarat Ports 5 24.63 5 24.63
38
A. Continuations of concessional rate under GST
It is essential that bunker sales to foreign run vessels from indigenous production as well as imports –
a. Is treated as Export / Deemed Export under zero rated GST; orb. Provision in GST at a rate equivalent to Zero Excise Duties plus prevailing concessional VAT (i.e. Nil CGST/IGST plus concessional SGST)
B. Input Credit for GST on stock transfer
Stock transfer of products from one location to other, service tax is applicable on 30% of the transport cost. Application of GST rate on full transportation cost of product stock transfers would increase bunker prices considerably, again leading to foreign run vessels opting to take bunkers at other ports enroute in other countries, thus diminishing the marine bunker fuels demand at Indian ports.
Therefore in line with prevailing Service Tax regulations, GST input credit (equivalent to at least prevailing Service Tax rate on transportation) would be necessary on the stock transfer transportation in case of supplies to foreign run vessels.
C. Intermediate bonded storage
Under the present concept of intermediate bonded storage, product stock transfer from Refinery to the 1st transit storage location for onward positioning to various other ports coastally was permitted without payment of Excise Duties. GST implications on such stock transfers would increase bunker prices making them uncompetitive in the region.
Therefore in case of Bunker sale of products to foreign run vessels, 100% GST input credit is required for the products positioned from Refineries to the various port locations through such intermediate storage points.
GST in India -------- Impacts on Bunkering wef 01.07.2017
39
Indian Oil Bunkering Presence
• Indian Oil Corporation Ltd. is India's largest company by sales with a turnover of Rs. 3,99,601 crore (US$ 61 billion) and profits of Rs. 10,399 crore (US$ 1,589 million) for the year 2015-16..
• IndianOil is the highest ranked Indian company in the latest Fortune ‘Global 500’ listings, ranked at the 161th position.
Indian Oil – At a Glance
• The IndianOil Group of companies owns and operates 11 of India's 23 refineries - with a combined refining capacity of 80.7 million metric tonnes per year
• IndianOil and its subsidiaries account for a 49% share in the petroleum products market, 35% share in refining capacity and 71% downstream sector pipelines capacity in India.
IN D IAN OIL
Indian Oil – At a Glance
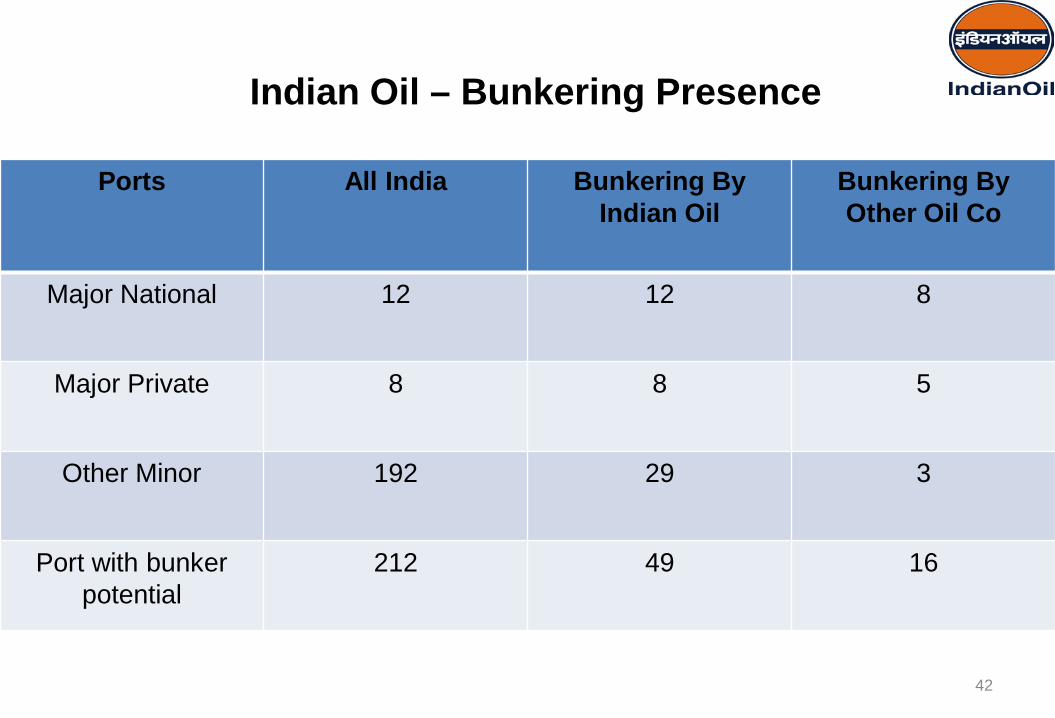
Indian Oil – Bunkering Presence
Ports All India Bunkering ByIndian Oil
Bunkering ByOther Oil Co
Major National 12 12 8
Major Private 8 8 5
Other Minor 192 29 3
Port with bunker potential
212 49 16
42
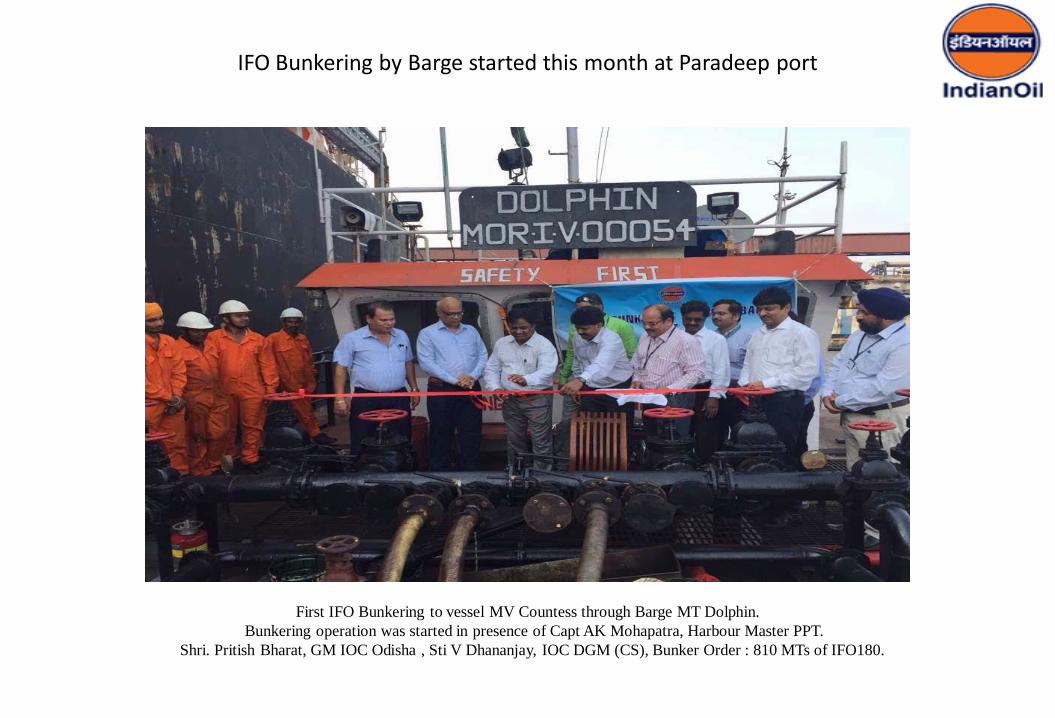
IFO Bunkering by Barge started this month at Paradeep port
First IFO Bunkering to vessel MV Countess through Barge MT Dolphin.Bunkering operation was started in presence of Capt AK Mohapatra, Harbour Master PPT.
Shri. Pritish Bharat, GM IOC Odisha , Sti V Dhananjay, IOC DGM (CS), Bunker Order : 810 MTs of IFO180.
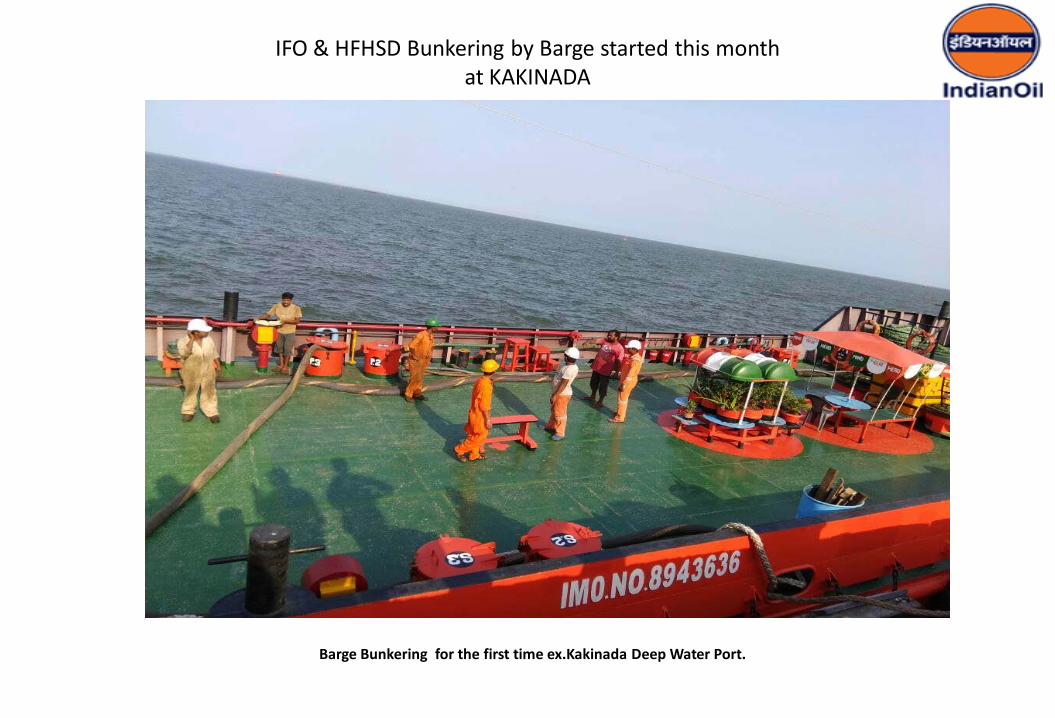
IFO & HFHSD Bunkering by Barge started this month at KAKINADA
Barge Bunkering for the first time ex.Kakinada Deep Water Port.
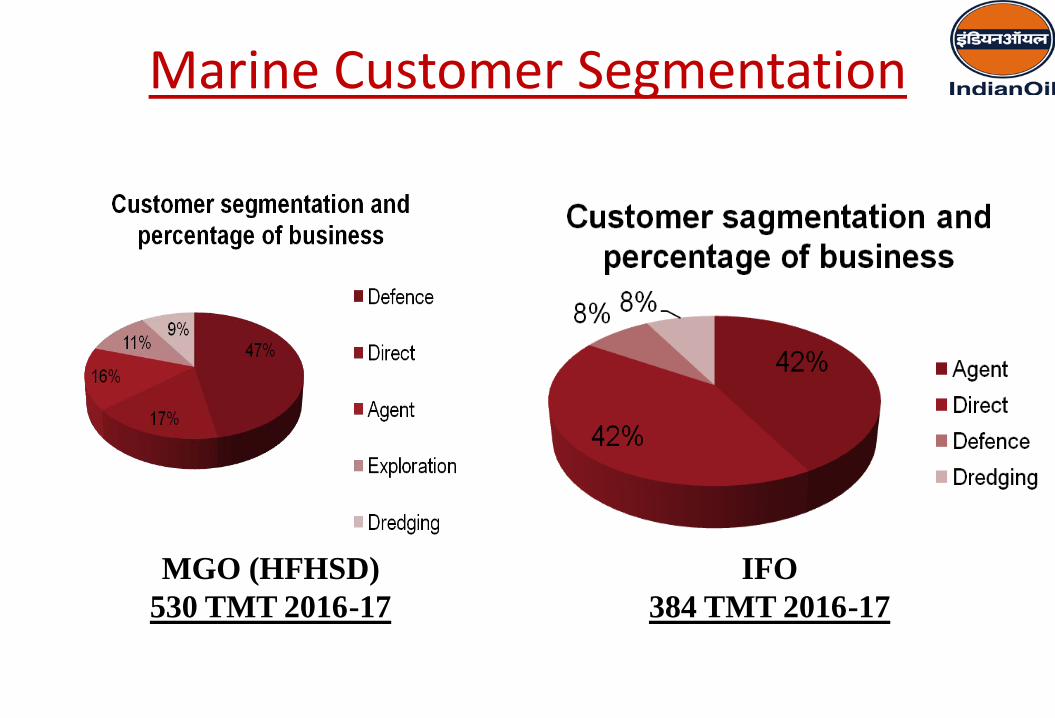
Marine Customer Segmentation
MGO (HFHSD) 530 TMT 2016-17
IFO384 TMT 2016-17
India’s Future
• Indian Refineries will have deficit situation for FO from 2018-19 onwards due to reduced production by Refineries
• Rationalization on product sharing can be carried out amongst Industry.
• Another option may be import of FO for supply to customers. Cost shall be the key deciding factor for the same.
• Indian Refineries will face a stiff challenge for production of 0.5% SulphurFO for Bunker grade as per MARPOL guidelines. Again cost shall be the major issue.
• Marine customers will slowly switch over to HFHSD from FO
Indian Oil aspire to work innovatively to emerge as amarket leader in bunkering, by maintaining highestcustomer service standards and committing to safeoperations to protect the environment through adedicated and empowered team in India
Happy Bunkering with…