Embed Size (px)
Citation preview

Way2WealthWay2Wealthmaking investing simpler, more understandable and profitablemaking investing simpler, more understandable and profitable..
Indian Economy Indian Economy UpdateUpdateApril 2010April 2010

Agenda
Key Characteristics of Indian Economy
Agriculture Sector
Manufacturing Sector
Services Sector
Indicators
Forward Looking Indicators
GDP & Other Variables
India Economy Update
Sector Contribution & Growth

3
Indian economy – Sector Contribution
Over the last 8-9 years the composition of the Indian GDP moving towards manufacturing and services sector
Share of agriculture in total Indian GDP is declining from 25 percent in early 2000-01 to 18 percent 2008-09
Reforms (privatization) amid sustainable internal demand helped manufacturing grow sharply during 2000-2009
Last but not the least, services occupy major portion in GDP, as the share stand more than 50 percent driven by IT and ITES
Despite declining share the agriculture & allied still provided huge employment opportunities and play a pivotal role with strong backward and forward linkages
GDP Contribution - Sectors (%)
20 18
62
15
20
65
0
10
20
30
40
50
60
70
Agriculture & Allied Industry Services & Allied Sector
2002-032009-10 E
Source:RBI

4
Indian economy – Sector Growth
After peaking in Q3-07 Indian agriculture showed relatively slower & negative growth
After bottoming out in Dec’08 Indian Industrial growth gained strong momentum
Unlike the volatile Agri and Industry, Indian Services sector held their forte well
Despite strong rebound in Industry, weaker Agri and Services weigh on Indian Economy going forward
Agriculture Sector Growth Rate (%)
4.0
2.0
0.0
2.0
4.0
6.0
8.0
10.0
Oct'06-Dec'06 Oct'07-Dec'07 Oct'08-Dec'08 Oct'09-Dec'09
Agriculture
Indistrial Sector Growth Rate (%)
4.0
0.0
4.0
8.0
12.0
16.0
Oct'06-Dec'06 Oct'07-Dec'07 Oct'08-Dec'08 Oct'09-Dec'09
Industry
Services Sector Growth Rate (%)
2.0
6.0
10.0
14.0
Oct'06-Dec'06 Oct'07-Dec'07 Oct'08-Dec'08 Oct'09-Dec'09
Services

Agenda
Sector Contribution & Growth
Key Characteristics of Indian Economy
Agriculture Sector
Manufacturing Sector
Services Sector
Indicators
Forward Looking Indicators
GDP & Other Variables
India Economy Update
Key Characteristics of Indian Economy

6
Indian economy – Key Characteristics
Agriculture Though the absolute contribution to GDP is declining but more than 65 percent of population depend on agriculture and allied activities
India stand second in total global Arable & Irrigated land and largely depend upon the monsoon (natural rains) for taking up agricultural activities
Potential improvements include seed technology, improved water management & infra and encouraging allied activities like dairy, poultry and processed food industry
Industry Unlike the rest of the emerging economies Indian industry is skewed to domestic needs than export markets
Few sectors like Gems & jewelry, leather and cotton depend heavily on export markets and face quality restrictions
There is a lot of scope for the industrial activity to pick up especially in automobile, technology and food processing
ServicesAftermath of liberalization saw banking, trade, community and business services to boom on the back of IT & ITES
Increased use of services sector edge in manufacturing can create increased productivity in manufacturing and also create self sustaining demand for services sector

Agenda
Sector Contribution & Growth
Key Characteristics of Indian Economy
Agriculture Sector
Manufacturing Sector
Services Sector
Indicators
Forward Looking Indicators
GDP & Other Variables
India Economy Update
Agriculture sector
8
Indian economy – Agriculture Sector
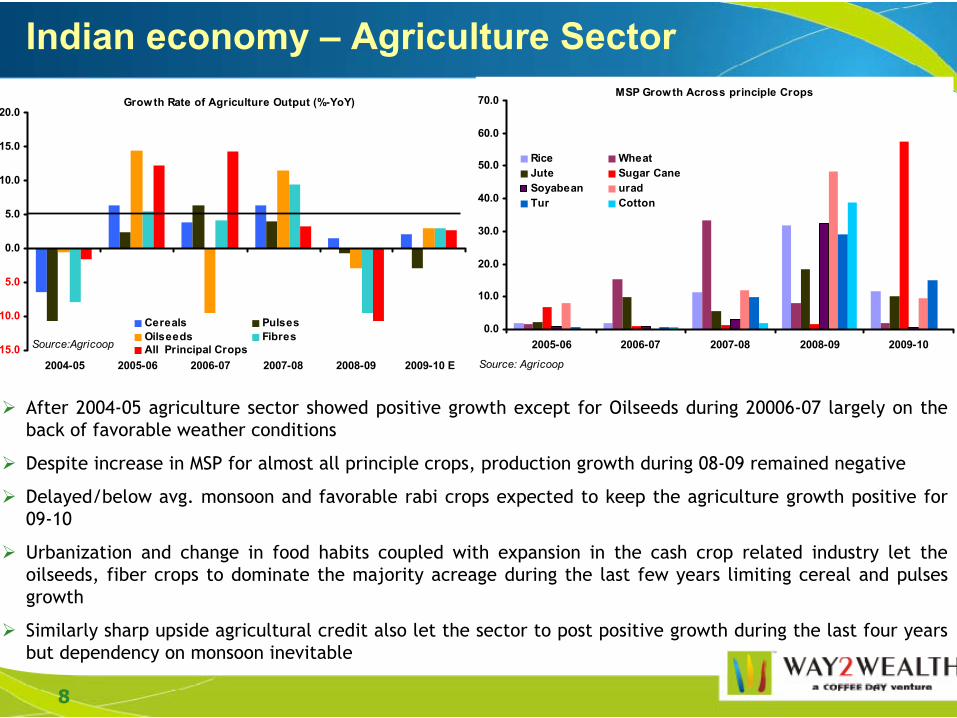
After 2004-05 agriculture sector showed positive growth except for Oilseeds during 20006-07 largely on the back of favorable weather conditions
Despite increase in MSP for almost all principle crops, production growth during 08-09 remained negative
Delayed/below avg. monsoon and favorable rabi crops expected to keep the agriculture growth positive for 09-10
Urbanization and change in food habits coupled with expansion in the cash crop related industry let the oilseeds, fiber crops to dominate the majority acreage during the last few years limiting cereal and pulses growth
Similarly sharp upside agricultural credit also let the sector to post positive growth during the last four years but dependency on monsoon inevitable
Growth Rate of Agriculture Output (%-YoY)
15.0
10.0
5.0
0.0
5.0
10.0
15.0
20.0
2004-05 2005-06 2006-07 2007-08 2008-09 2009-10 E
Cereals PulsesOilseeds FibresAll Principal CropsSource:Agricoop
MSP Growth Across principle Crops
0.0
10.0
20.0
30.0
40.0
50.0
60.0
70.0
2005-06 2006-07 2007-08 2008-09 2009-10
Rice WheatJute Sugar CaneSoyabean uradTur Cotton
Source: Agricoop

Agenda
Sector Contribution & Growth
Key Characteristics of Indian Economy
Agriculture Sector
Manufacturing Sector
Services Sector
Indicators
Forward Looking Indicators
GDP & Other Variables
India Economy Update
Manufacturing Sector

10
Indian economy – Manufacturing Sector
Strong domestic as well as external demand let the Indian manufacturing grow steadily higher during 2002-07
Onset of global credit crisis (preceded by rate hikes) let the sentiments as well as the growth move sharply lower
Driven by the stimulus and steady domestic demand the manufacturing growth surged sharply higher
Mining, key manufacturing and Chemicals continue to post positive growth, while the Food and allied segments show marginal growth
A sharp upswing caught the industry surprised and show strong signs of pressure on the existing capex to add volumes and finally inflation
IIP Index Growth (%-YOY)
2.0
0.0
2.0
4.0
6.0
8.0
10.0
12.0
14.0
16.0
18.0
20.0
Jan-02 Jan-03 Jan-04 Jan-05 Jan-06 Jan-07 Jan-08 Jan-09 Jan-10
IIP Index Growth
Source:MOSPI
IIP Index Growth-Key Components (%-YoY)
40
30
20
10
0
10
20
30
40
Jan-02 Jan-03 Jan-04 Jan-05 Jan-06 Jan-07 Jan-08 Jan-09 Jan-104
2
0
2
4
6
8
10
12
14
Food Prod Mining Electricity
Source:MOSPI

As indicated earlier the Capital goods sectors continue to grow strongly, while consumer goods remain shaky
Forward looking PMI suggest positivism moving ahead but the slower pace of export orders may weigh
Indian economy – Manufacturing Sector
Purchasing Managers Index-India
35
40
45
50
55
60
65
70
75
31/05/2005 28/02/2006 30/11/2006 31/08/2007 31/05/2008 28/02/2009 30/11/2009
PMI Index PMI-Export Orders PMI-New OrdersSource:Mospi
Capital Goods Production Growth (YoY-%)
15
10
5
0
5
10
15
20
25
30
35
40
Jan-96 Jan-98 Jan-00 Jan-02 Jan-04 Jan-06 Jan-08 Jan-10
Source:Mospi
Consumer Goods Production Growth (YoY-%)
5
0
5
10
15
20
Jan-96 Jan-98 Jan-00 Jan-02 Jan-04 Jan-06 Jan-08 Jan-10
Source:Mospi

Agenda
Sector Contribution & Growth
Key Characteristics of Indian Economy
Agriculture Sector
Manufacturing Sector
Services Sector
Indicators
Forward Looking Indicators
GDP & Other Variables
India Economy Update
Services Sector

13
Indian economy – Services Sector
Backed by IT & ITES, services sector contribution to overall GDP grew strongly over 2000-009
In line with the rapid urbanization contribution from Hotel & Restaurant, Transport and Banking sectors continued to grow and dominate the contribution to the total service sector
However, the YoY growth rate show that the community and personal services showed steady growth with rest of the three showing a more cyclical pattern
Demographic advantages, Urbanization along with scope for rapid industrialization the future growth prospects lie strongly in Trade, Communication and Financial Services
Weaker consumerism & business investment at matured economies stabilize overall services sector in the near future
Services Sector Componenets Growth
2
4
6
8
10
12
14
16
18
2004-05 2005-06 2006-07 2007-08 2008-09 2009-10 E
Trade, Hotels & Rest TransP & Commu Banking & Finance Community & Personal ServSource:RBI
Services Sector Contribution to GDP
656967
30
40
50
60
70
80
2004-05 2005-06 2006-07 2007-08 2008-09 2009-10 EServices & Allied SectorSource:RBI

Agenda
Sector Contribution & Growth
Key Characteristics of Indian Economy
Agriculture Sector
Manufacturing Sector
Services Sector
Indicators
Forward Looking Indicators
GDP & Other Variables
India Economy Update
Indicators

15
Indian economy – Trade
After contracting during early 2009 the trade deficit continue to grow as rate of imports outpace exports
Since Q1-09 imports surged faster than the exports with oil imports accounting for 28 percent and the rest with non-oil imports
Higher raw material prices internationally, weaker consumer at matured economies and steady INR let the trade balance remain largely negative despite slowdown in economic activity
Despite no immediate threat, untimely policy (exchange rate intervention & trade tariffs) and global commodity prices may spoil the party in the medium term
Indian Trade Balance (Mln USD)
20000
16000
12000
8000
4000
0
4000
Jun-99 Oct-00 Feb-02 Jun-03 Oct-04 Feb-06 Jun-07 Oct-08 Feb-10
Trade Balance (mln USD)Source:RBI
Deficit
Surplus
Indian Trade Scenario (YoY-%)
60
40
20
0
20
40
60
80
Jun-99 Oct-00 Feb-02 Jun-03 Oct-04 Feb-06 Jun-07 Oct-08 Feb-10
Import Growth (YoY-%) Export Growth (YoY-%)Source:RBI

16
Indian economy – Fiscal Status Balance of payment (Quaterly in USD billion)
30
20
10
0
10
20
30
40
Mar-05 Sep-05 Mar-06 Sep-06 Mar-07 Sep-07 Mar-08 Sep-08 Mar-09 Sep-09
Balance of payment (Quaterly in USD billion)
Current & Capital A/C - India
40.0
20.0
0.0
20.0
40.0
60.0
80.0
100.0
120.0
2004-05 2005-06 2006-07 2007-08 2008-09 2009-10 E
Current A/C (bln USD) Capital A/C (bln USD)
Source: RBI
After contracting during 2008-09, Indian BoP turning positive with capital A/C moving sharply higher (later flows)
Despite weaker economic environment current A/C is not improving similarly as imports remain higher, resulting current A/C balance to GDP remain above 3 percent
Similar to trade A/C though the BoP is neither heartening nor threatening, sharp swings in capital flows may pose a threat to smoother execution of the monetary policy

17
Indian economy – Funds Flow
As indicated earlier the capital flows remained stronger with FDI, FII and ECB turning positive since Q1 - FY09-10
Though FDI and ECB remained below the previous peaks the hot money FII scaled close to the Sep’07 highs
Until the matured economies signal rate hike the capital flow remain intact thereby pushing the benchmark indices higher
Foreign Direct Investments - Monthly
0
500
1000
1500
2000
2500
3000
3500
4000
4500
5000
Jan-06 Nov-06 Sep-07 Jul-08 May-09 Mar-10
FDI (Mln USD)
Source:RBI
Net Foreign Insti Investments Monthly
2000
1500
1000
500
0
500
1000
1500
2000
2500
3000
Jan-06 Nov-06 Sep-07 Jul-08 May-09 Mar-10
Net FII (Mln USD)
Source:RBI
External Commercial Barrowings - Monthly
0
1000
2000
3000
4000
Jan-06 Nov-06 Sep-07 Jul-08 May-09 Mar-10
ECB (M ln USD)
Source:RBI

18
Indian economy – Inflation
Weaker Agri sector performance amid strong upswing in domestic consumption pushed the inflation sharply higher
Both CPI and WPI indices now remain close/above double digit mark leaving pre-emptive monetary action by RBI
From food & primary related price rise recent weeks showed inflation moving to rest of the sub sections like power, fuel etc
Though the fortunes of the monsoon debatable, much of the inflation’s strength lie in narrow gap between potential/actual output or simply capacity constraints
Inflation & Components Growth (YoY) -CPI
0.0
5.0
10.0
15.0
20.0
25.0
31/01/2007 31/10/2007 31/07/2008 30/04/2009 31/01/2010
CPI TotalInd Food CompInd Fuel & light Rural HH Infla
Source:Mospi
Inflation & Components Growth (YoY) - WPI
-15.0
-10.0
-5.0
0.0
5.0
10.0
15.0
20.0
31/01/2007 31/10/2007 31/07/2008 30/04/2009 31/01/2010
WPI TotalWPI Prim ArtiWPI ManfWPI Fuel & power
Source:Mospi

Agenda
Sector Contribution & Growth
Key Characteristics of Indian Economy
Agriculture Sector
Manufacturing Sector
Services Sector
Indicators
Forward Looking Indicators
GDP & Other Variables
India Economy Update
Forward Looking Indicators

20
Indian economy – Forward Looking IndicatorsFixed Capital Formation (%-YoY)
0
10
20
30
40
50
60
2003-04 2004-05 2005-06 2006-07 2007-08 2008-09
Total
Public sector
Private Corporate
Credit Growth (%-MoM)
6
4
2
0
2
4
6
8
Jan-05 Jan-06 Jan-07 Jan-08 Jan-09 Jan-100
1
1
2
2
3
3
4
Total Food Non Food
Unlike the rest of the emerging Asia, India largely depend on domestic economic agents for capital as well as consumption
Gross Fixed capital formation though slowed down in last two years remain strong when compared to rest of Emerging Asia
After moving lower during the crisis, over all credit growth picking up strongly in the recent months suggesting increased activity
Better banking system, education, higher savings etc keep the Indian growth story robust in the medium term

21
Indian economy – Forward Looking Indicators
Highlighting the urgent need to capacity expansion the GoI set an ambitious spend plan during 11th FY
By 2011-12 total infrastructure (road, port and electricity) investments expected to touch ~10 pct of GDP
Power, irrigation and roadways expected to see increased allocation and also private sector participation
Investment in Infrastrucure (as a % of GDP)
4.23
1.2
5.43
6.45
2.89
9.43
0
2
4
6
8
10
Public Sector Private Sector Total
2007-082011-12 E
Source:11 FYP
Planned Expansion of roads (kms)
0
20000
40000
60000
80000
2005-06 2006-07 2007-08 2008-09 2009-10 E 2010-11 FSource:11 FYP
Power Generation (MWh)
0
5000
10000
15000
20000
25000
2008-09 2009-10 E 2010-11 F 2011-12 F
Thermal Hydro
Nuclear Total
Source:11 FYP

Agenda
Sector Contribution & Growth
Key Characteristics of Indian Economy
Agriculture Sector
Manufacturing Sector
Services Sector
Indicators
Forward Looking Indicators
GDP & Other Variables
India Economy Update
GDP & Other Variables

23
Indian economy – GDP
After witnessing steady growth during 2008-10 Indian economy set to grow by 7.9 percent (expecting normal monsoon)
Rebound in agriculture followed by buoyant manufacturing expected to push the economic growth during FY10-11
However, inflation, weaker matured economies and failure of the monsoon remain as greatest risk to the economy in the medium term
Indian GDP
9.69.0
6.7 6.9
7.9
2
4
6
8
10
2004-05 2005-06 2006-07 2007-08 2008-09 2009-10 E 2010-11 FSource:RBI, W2W Estimates
Source: RBI, W2W Estimates
87.27.610 Yr G Sec Yield
4.5-5.53.53-4.337.09-7.1591-181 TB Yield
1311.8412.76PLR
10.2511.858.93CPI
6.903.178.46WPI
9.108.502.75IIP
7.856.856.70Real GDP
2010-11 F2009-102008-09

Thank you
Research Department
Premise A, 15th Floor, Chandramukhi Building, Backbay Reclamation, Nariman Point (near Inox Theatre), MUMBAI : 400021
Phone: 022 4019 2900, Fax: 022 40192939


