Embed Size (px)
Citation preview

CHAPTER 5
INDIAN CAPITAL MARKET
AN OVERVIEW
Introduction
The capital market is the medium through which savings of the people are
channelised for industrial and commercial enterprises. Capital market is an
important constituent of the financial system. Capital market facilitates
economic growth by mobilizing the savings of the economic sectors and
diverting the same towards channels of productive uses. It facilitates sustainable
development of the economy by providing long term funds in exchange for
financial assets to investors. Moreover, it is a perennial and cheap source of
finance. This is facilitated through the following measures.
1. Issue of primary securities in the primary market, i.e., directing cash
flow from the surplus sector to the deficit sectors such as government
and corporate sector.
2. Issue of secondary securities in the primary market, i.e., directing the
cash flow from surplus sector to financial intermediaries such as
banking and non-banking financial institutions.
3. Secondary market transactions in outstanding securities which
facilitates liquidity. The liquidity of the stock market is an important
factor affecting economic growth. A well developed capital market
provides liquidity, marketability and safety of investments to the
investors.
Hence, the existence of an efficient capital market is inevitable for
investment and growth. A well developed stock market can increase GDP to the
tune of minimum 2.5 per cent (Atje and Jovanovic, 1993)1.
151
HISTORY OF INDIAN CAPITAL MARKET
The history of capital market in India can be traced back to eighteenth
century when East India Company securities were traded in the country. Until
the end of nineteenth century securities’ trading was highly unorganized and the
important trading centres were Bombay and Calcutta. Bombay was the main
trading centre where bank shares were the major trading stock. The outbreak of
American civil war (1860 – 61) made share mania in India. During this period,
Bombay was an important source of supply for cotton. This boom, the first time
in the history of Indian capital market, lasted for a half of a decade. But, the civil
war ended in 1865 when there was a tremendous slump in share prices. Trading
during this period was limited to a dozen brokers and they assembled under a
banyan tree in front of the Bombay Town Hall. By 1874, Dalal Street in
Bombay became a prominent place of meeting of these brokers. These stock
brokers organized an informal association in 1875, the Native Shares and Stock
Brokers Association, Bombay. The Bombay stock exchange was recognised in
May 1927 under the Bombay Securities Contract Act, 1925.
During the British rule, the capital market was not well organized. In
the post independence period also, there were less activity in the capital market.
During the first two Five Year Plans, government gave more thrust on agriculture
sector and setting up of public sector undertakings. The public undertakings
were performing better than the private undertakings in terms of paid up capital,
but their shares were not listed on the stock exchanges.
In the 1950s, Century Textiles, Tata Steel, Bombay Dyeing, National
Rayon and Kohinoor Mills were the most active scrips fancied by speculators.
As speculation enhanced, the stock market came to be known as ‘Satta Bazaar’.
The government enacted the Securities Contracts (Regulation) Act in 1956. In
the same year another enactment under the name, the Company Act, 1956 was
also announced. This decade was characterized by the establishment of a
network of financial institutions and state financial corporations.
152
War and drought disturbed the capital market response in 1960s. Badala
system was banned which aggravated the situation. Financial institutions such as
LIC and GIC helped to rejenuate the sentiments. The Unit Trust of India (UTI)
was formed in 1964 for providing facilities of equity investment for small
investors. This was the first mutual fund in India. The Industrial Development
Bank (IDBI) was also formed in 1964 to provide financial assistance to medium
and large scale industries.
In 1970s, badala trading was resumed. This gave momentum in the
capital market. But, another set back took place in July 6, 1974, viz., Dividend
Restriction Ordinance, which restricts the payment of dividend by companies to
12 per cent of the face value or one third of its profits whichever is lower. This
led to a big fall in the market capitalization. Buoyancy in the stock market took
place only when the multinationals (MNCs) were forced to dilute their majority
stock in the Indian venture in favour of the Indian public under the FERA Act,
1973. All the multinational companies holding 100 per cent of their equity were
forced to reduce it to 40 per cent. Indian citizens got a golden opportunity to
procure the shares of blue chip companies of MNCs. About 123 MNCs offered
shares worth Rs. 150 crores creating 1.8 million shareholders within 4 years. For
diluting their shareholdings multinational companies offered shares to public at
attractive rates.
Since the dilution of MNCs got maximum response, many domestic
companies also came out with public issues. Many investors were enthusiastic to
invest in capital market as they found equity market investment as a hedge
against inflation and a source of higher earnings compared to many other
avenues of investments. Process of broadening of the capital market is said to
have begun during this period.
The 1980s witnessed massive growth of the securities market in India.
Initiation of liberalization process by the government started during this period.
Convertible debenture emerged as a powerful device for mobilizing the funds in
153

the primary market. There was impressive growth in the secondary market as ten
stock exchanges were started in the mid 1980s. A number of committees and
working groups were constituted for the smooth functioning of capital market.
Some prominent committees were Patel committee, 1986, for the organization
and management of stock exchanges; Abid Hussain Committee in 1989, for the
development of stock exchanges; Phervani Committee in 1991, for the
establishment of stock exchanges and Nandakarni Committee in 1992 on trading
in public sector bonds and units of Mutual Funds. Also, a number of financial
intermediaries like merchant bankers, underwriters, mutual fund custodian
services etc., came into existence during the period.
The liberalization and globalisaion policies of the government of India
during the 1990s fuelled the growth of equity cult in India. Major capital
markets scam took place during this period. The euphoria in the capital market
led stock market prices to skyrocketing levels. The rise in price was not
corroborated by any macro-economic factors or change in fundamental aspects
of corporate financing. The security scam was unearthed in June 1992. The
scam revealed inadequacy of and inefficiencies in the financial system and it
prompted a drastic reform of the equity market. Investors lost confidence and it
made a paralyzing effect on the operation of stock exchanges. The Parliamentary
Committee which probed into the scam recommended that SEBI should examine
trading practices and systems in stock exchanges and make necessary changes.
In addition, the Narasimham Committee and Estimates Committee of the
Parliament underscored the urgency of sufficient legal and administrative
safeguards to protect small and inexperienced investors so as to minimise the risk
of exploitation by unscrupulous elements and fly-by-night operators. This
necessitated a vigilant regulatory body to control the stock market.
Consequently, SEBI which was formed in 1988 as a non-statutory body was
endowed with statutory powers through the enactment of SEBI Act, 1992.
154

Since then, the Indian stock market witnessed a sea change in terms of
technology and market practices. Technology made radical change in the trading
mechanism. The Over the Counter Exchange of India (OTCEI) set up in 1992
and National Stock Exchange (NSE) was set up in 1994. The National Securities
Clearing Corporation (NSCC) and National Securities Depository Ltd. (NSDL)
were set up in April 1995 and November 1996 respectively. These two
institutions were set up for improved clearing and settlement and dematerialized
trading. The Securities Contracts (Regulation) Act, 1956 was amended in
1995-96 for the introduction of option trading. Rolling settlement was also
introduced in January 1998.
In the 1990s, the Information Technology (IT) scrips were dominant in all
Indian bourses. The scrips included were; Infosys, Wipro and Satyam. They
were part of favourite scrips of the period and known as ‘New Economy’ scrips
along with telecommunications and media scrips. The new economy companies
are knowledge intensive unlike the old economic companies that were asset
intensive.
The Indian capital market entered the 21st century with the Ketan Parekh
scam. As a result of scam, badala was discontinued from July 2001 and rolling
settlement was introduced in all scrips. Trading futures commenced from June
2000, and internet trading was permitted in February 2000. On July 2nd 2002, the
Unit Trust of India announced suspension of the sale and purchases of its
flagship US-64 scheme during the heavy redemption leading to panic on the
bourses. The government decision to privatise PSUs in 2000 fuelled stock
prices. One big disinvestment of international telephony major, VSNL, took
place in the early February 2002. Foreign institutional investors were emerged
as the largest and dominant players in the Indian bourses. NSE has an upper
hand over its rival BSE in terms of volumes not only in equity market but in the
case of derivative market also.
155

Bygone years were a long journey for the Indian capital market. Now, the
capital market is well organized, fairly integrated, matured, more global and
highly modernised. Indian capital market is one of the best in the world in terms
of technology upgradation. Internet trading has become common and Indian
stock market is getting integrated with global markets.
PRIMARY MARKET OPERATIONS
In order to facilitate the corporate sector in raising funds, they enter into
primary market or new issue market and issue new securities to the investors
who opt for it. Primary market is a market for new shares. Fresh funds are
mobilized through this market. There are many types of securities viz., equity
shares, preference shares and debentures. Equity shares have, all along, been the
most preferred instrument for mobilizing resources by the public corporate sector
(Misra, 1997)2. Both the existing and new companies raise funds from the new
issue market.
The primary market is made up of two components; (i) firms go public for
the first time (through initial public offerings of IPOs), and (ii) firms which
are already traded, raise additional capital (through seasoned equity offerings of
SEOs), (Shah and Thomas, 1997)3. Once the new issue process is completed, the
instruments are traded in the secondary market. It is the primary market which
begins with collection of funds and issuance of securities to the general public.
There are various methods by which the companies can raise capital.
They are: a) Issue through prospectus, b) Private placement and c) Right issues.
Bonus shares are issued to the existing share holders. It does not bring any fresh
capital for the company, but it helps to restructure its fresh capital. This is a way
of converting retained earnings into capital.
Issues are offered to public through prospectus and public subscribes
directly. Section 67 of the Companies (Amendment) Act 2000 provides that,
where the offer or invitation to subscribe for shares or debentures is made to 50
156
or more persons, then such an offer or invitation shall be deemed to be a public
offering and shall have to comply with all the provisions of the Act as well as the
SEBI guidelines applicable to such public offerings. Wide publicity is needed.
Earlier brokers were doing this and now merchant bankers are appointed for this
purpose. Rights issue is the issue of new shares to the existing share holders on a
pro-rata basis. The existing share holders have to pay for it or they can renounce
it. Companies which issue right shares have to send a letter of offer to the
existing share holders. Rights issue is another way of raising money from the
market. Companies at times sell securities to select public or institutional
investors, is called private placement. No prospectus is issued in this regard and
it offers access to capital quickly than the public issue and less expensive too.
This type of capital mobilization is ‘in vogue’.
FREE PRICING REGIME
In order to effectively control the activities in the new issue market and
also ensure that the investments in the country are made in a planned manner in
accordance with the priorities laid down in the five year plans, the government
has instituted the Controller of Capital Issues (CCI) under the Capital Issues
(Control) Act, 1947. Companies had to obtain approval from the CCI for raising
funds in the primary market. Since the CCI laid strict rules, most of the public
issues were under priced.
Capital Issues (Control) Act was repealed and free pricing was introduced
by SEBI in 1992 followed by a plethora of issues. There was no restriction of
premiums. Heavy premiums were charged by the issuing companies and many
fly-by-night companies accessed the capital market. Many of the issues were
listed below their offer prices at the stock exchanges. Of the 4000 public issues
which came into the market during the period 1992-96, more than 3000
companies quoted below their offer price. Many investors have lost money
during this period. It is estimated that around 1000 companies which came out
157

with issues and collected about Rs. 3000 crores in 1995 and 1996 have
disappeared completely (Bhole, 1999)4.
The advent of Public Sector Bonds and Partly Convertible Debentures in
the 1980s played an important role in changing the debt equity mix to below 40
per cent on an average. The first half of 1990s witnessed the emergence of mega
issues in the market with a bias for equity compared to earlier similar projects
which had a bias for debt. As a consequence of liberalization many new
instruments were introduced. Financial engineering is getting momentum today.
The process of innovation involved creating new financial instruments and
techniques. The new instruments include Secured Premium Notes with
Detachable Warrants, Non-Convertible Debentures with detachable Equity
Warrants, Zero Interest Fully Convertible Debentures, Equity Shares with
Detachable warrants, Zero Interest Bonds, Deep Discount Bonds and Non
Convertible Debentures with Detachable Warrants.
Book Building
In order to protect the interest of the investors, Malegam Committee
recommended the introduction of book building as an alternative device to the
existing systems of fixed pricing. SEBI adopted this new technique in 1996.
Globally, book building is recognized as a mechanism for capital raising. The
book building was built in the US during 1940s and 1950s. Book building helps
to find a better price for an issue to be made.
The Book building has changed the free pricing era. People had burnt
their fingers because of the free pricing of securities. The new system has helped
for a better price discovery. In this method, the issuing company will mention an
indicative price at which securities will be offered and gives the investors an
opportunity to bid collectively. Then a common derived price will be arrived
and the allotment will be finalised at the agreed price. The people who are
involved in book building are issuing company, book running lead manager,
158
other syndicate members, underwriters, institutional and individual investors.
The book building enables the issuers no devolvement, the cost and time for
making public issue is lowered and the procedures are also simplified. Since the
syndicate members have purchased shares at a premium, the issuer can trust the
rate and, possibility of falling below par at distinct is remote.
Buy back of shares
Buy back of shares allowed to Indian companies through an amendment
ordinance in 1998. But earlier it was prohibited in India by the Companies Act,
1956. Now Indian companies are free to buy its own shares and other securities
up to 25 per cent of their net worth out of free reserves, or securities premium
account or proceeds of an earlier issue other than a fresh issue made specifically
for buy back purposes. By allowing buy back of shares, companies can arrest
wide fluctuations in share prices and paves the way for efficient allocation of
resources.
Trends in Resource Mobilisation in the Primary Market
Public sector undertakings, public limited companies, banks and financial
institutions mobilise resources from the primary market. Moreover, large
organizations mobilise funds from international capital markets. During 1992,
after globalisation, government realized that the private sector would require
large resources for which they allowed companies to raise funds from
international markets. Domestic markets were not in a position to procure large
amount. Hence, Indian companies were allowed to raise funds from global
market through the issue of Global Depository Receipts (GDRs) and American
Depository Receipts (ADRs). The overall picture of resource mobilisation in the
primary market is shown in Table 5.1.
159

Table 5.1
Resource mobilisation from the primary market
(Rs. in crores)
(Note: Figures in parentheses are percentage of total)Source: RBI Handbook of Statistics on Indian Economy, 2005.
Issues 1993-94 1994-95 1995-96 1996-97 1997-98 1998-99 1999-00 2000-01 2001-02 2002-03 2003-04 2004-05Non-Government public limited companies
19330(43.4)
26417(54.9)
16075(43.8)
10410(28.0)
3138(7.4)
5013(8.3)
5153(7.1)
4890(6.2)
5692(7.7)
1878(2.5)
3675(4.9)
13482(12.3)
PSU Bonds5586(12.6)
3070(6.4)
2292(6.2)
3394(9.1)
2982(7.1)
--
--
--
-- -
Government companies
819(1.8)
888(1.8)
1000(2.7)
650(1.7)
43(0.1)
--
--
- 350(0.5)
-100(0.1)
2684(2.5)
Banks and financial institutions
3843(8.6)
425(0.9)
3465(9.4)
4352(11.7)
1476(3.5)
4352(7.2)
2551(3.5)
1472(1.9)
1070(1.4)
2989(4.0)
4076(5.4)
5726(5.2)
Private placement
7466(16.8)
11174(23.2)
13361(36.4)
15066(40.6)
30099(71.4)
49679(82.5)
61259(84.5)
678.36(86.5)
64950(87.3)
66948(89.2
63901(85.4)
84052(76.9)
Total domestic issues
37044(83.2)
41974(87.3)
36193(98.6)
33872(91.2)
37738(89.6)
59044(98.1)
68963(95.2)
74198(94.6)
72062(96.9)
71815(95.7)
71752(95.9)
105944(96.9)
Euro issues7454(16.8)
6110(12.7)
496(1.4)
3275(8.8)
4387(10.4)
1148(1.9)
3487(4.8)
4197(5.4)
2342(3.1)
3226(4.3)
3098(4.1)
3353(3.1)
Total capital issues
44498(100.0)
48084(100.0)
36689(100.0)
37147(100.0)
42125(100.0)
60192(100.0)
72450(100.0)
78395(100.0)
74404(100.0)
75041(100.0)
74850(100.0)
109297(100.0)
160

161

The Table 5.1 reveals that the aggregate mobilization in the primary
market since 1993-94 has been showing an increasing trend except in the initial
years. The aggregate amount during 2004-2005 was Rs. 109297 crores. The
Euro issues showed fluctuating trend. The total domestic issues aggregated
Rs. 37044 crores in 1993-94 but it reached to Rs. 105944 crores in 2004-05. A
major part of domestic capital issues was from non-government public limited
companies. In 1993-94, it amounted to Rs. 19330 crores which increased from
all time high of Rs. 26417 crores in 1994-95, but it declined gradually and
reached to Rs.1878 crores in 2002-03 and increased to 13482 crores in 2004-05.
The most important revelation of the analysis is that the share of private
placement skyrocketed and registered a marked increase. In absolute terms, it
rose from Rs. 7466 crores in 1993-94 to Rs. 84052 crores in 2004-05. The
raison d’tre for the rapid increase in private placement is due to low cost, save
time, and ease of structuring instruments complexed with strict stringent
disclosure norms in public issues.
New Capital Issues by Non-Government Public Limited Companies (1993-
94 to 2004-05)
Though the private placement section increased the mobilisation for their
expansion, the trend was from general public since inception. Non-government
companies used to approach the capital market for their major part of financial
requirements. The companies used instruments like equity shares, preference
shares, debentures and bonds for this purpose. The composition of new capital is
shown in Table 5.2.
162

Table 5.2
New Capital issues by Non-Government Public Limited Companies
(Rupees in crores)
Year
Ordinary shares Preference shares Debentures Total
No. of Issues
AmountNo. of Issues
AmountNo. of Issues
AmountNo. of Issues
Amount
1993-94
983
(86.8)
9959.7
(51.5)
1
(0.1)
0.3
(0.0)
149
(13.1)
9370.3
(48.5)
1133
(100.0)
19330.3
(100.0)
1994-95
1548
(92.3)
17414.4
(65.9)
9
(0.5)
131.4
(0.5)
121
(7.2)
8870.9
(33.6)
1678
(100.0)
26416.7
(100.0)
1995-96
1592
(95.7)
11954.5
(74.4)
9
(0.5)
150.1
(0.9)
63
(3.8)
3970.1
(24.7)
1664
(100.0)
16074.7
(100.0)
1996-97
801
(95.6)
6101.4
(58.6)
5
(0.6)
74.9
(0.7)
32
(3.8)
4233.2
(40.7)
838
(100.0)
10409.5
(100.0)
1997-98
89
(87.3)
1162.4
(37.1)
1
(1.0)
4.3
(0.1)
12
(11.7)
1971.6
(62.8)
102
(100.0)
3138.3
(100.0)
1998-99
33
(68.7)
2562.7
(51.1)
3
(6.3)
59.7
(1.2)
12
(25.0)
2390.7
(47.7)
48
(100.0)
5013.1
(100.0)
1999-00
69
(87.3)
2752.5
(53.4)- -
10
(12.7)
2400.8
(46.6)
79
(100.0)
5153.3
(100.0)
2000-01
128
(92.1)
2607.6
(44.8)
2
(1.44)
142.2
(2.44)
9
(6.5)
3068.3
(52.7)
139
(100.0)
5818.1
(100.0)
2001-02
6
(31.6)
860.4
(15.1)0 0
13
(68.4)
4832.0
(84.9)
19
(100.0)
5692.4
(100.0)
2002-03
5
(55.6)
460.2
(24.6)0 0
4
(44.4)
1417.5
(75.4)
9
(100.0)
1877.7
(100.0)
2003-04
35
(92.1)
2670.9
(66.4)0 0
3
(7.9)
1250.9
(33.6)
38
(100.0)
3721.8
(100.0)
2004-05
51
(94.4)
11451.8
(87.5)0 0
3
(5.6)
1627.4
(12.4)
54
(100.0)
13079.2
(100.0)
(Note: Figures in parentheses are percentage to total.)Source: RBI, Handbook of Statistics on Indian Economy, 2006.
163

Majority of the issues were equity shares. In 1993-94, Rs. 9960 crores
were mobilized from 983 issues and it increased to Rs. 17414 crores in 1994
from 1548 capital issues. Thereafter, it decreased in terms of number and
volume. Mobilisation through this route decreased to Rs. 2752.5 crores through
69 equity issues in 1999-2000. The trend of debenture also showed the same
trend. The amount mobilised through issue of preference shares was
insignificant during the reference period. The overall trend of capital issues
made by non-government public companies showed an increasing trend up to
1994-95 both in volume and number and declined thereafter and showed a rising
trend towards 2004-05.
There is a vast scope of mobilising adequate resources internally through
different instruments. The use of such instruments makes fund mobilization
cheaper and new issue market more sophisticated. Globalisation has made new
issue market more competitive and new companies can procure huge amount
from within the country and across the globe.
Resource Mobilization through Mutual Funds
Mutual funds are institutions for providing small investors with avenues
of investment in the capital market. Many investors do not have the resources,
knowledge, skill, experience and time for directly accessing the capital market.
Mutual funds are financial intermediaries which collect the savings of the
investors and invest them in a large and well diversified portfolio of securities
such as money market instruments, corporate and government bonds and equity
shares of joint stock companies (Machiraju, 1988)5. Mutual fund is the way of
bringing more people into capital market indirectly. Mutual funds have a
professional team having very high caliber and skill. These experts have the
knowledge of selection and supervision of investment portfolios and they will
164

select well balanced and well diversified portfolio of stocks, thereby reducing
risk and earning higher rate of return on their investments.
Mutual funds are of two types. They are open-end funds and close-end
funds. In the case of open-end mutual funds, the investors can buy or sell any
number of units at any point of time with the prevailing net asset value (NAV) of
the unit. But in the case of close-end funds, the corpus of the fund and its
duration are determined in advance. At the time of maturity, the instruments are
realized and proceeds are distributed among the unit holders in proportion to
their holding. The characteristics of each of these vary according to the asset
class in which it invests.
The UTI set up the first mutual fund in India in 1964 under an Act of
Parliament to channel the savings of retail investors into productive assets
and speed up the process of economic development. They introduced Unit
Scheme-64 in 1964 which was the only mutual fund scheme available to
investors until 1970. In 1987, with the expansion of the capital market the
Government of India permitted public sector banks and insurance companies to
start mutual funds. During 1987-92 seven new mutual funds were established in
the private sector. Several schemes were offered to public. In 1992-93, private
and foreign players were given permission to start mutual funds. The acceptance
of mutual funds as valid investment option led the industry to innovate and offer
a wide variety of schemes tailored to meet specific needs. The schemes and
the number of mutual funds have increased tremendously. This is depicted
in Table 5.3.
165

Table 5.3
Resource Mobilisation by Mutual Funds
(Rupees in crores)
Year UTIBank
sponsored mutual funds
Financial institution sponsored
mutual funds
Private sector mutual funds
Total
1993-949297
(7453)148 239 1560 11244
1994-958611
(6800)766 576 1322 11275
1995-96-6314
(-2877)113 236 133 -5833
1996-97 -855 6 137 864 -2037
1997-982875
(2592)237 203 749 4064
1998-99170
(1300)-88 547 2067 2696
1999-004548
(15762)336 296 16937 22117
2000-01322
(1201)248 1273 9292 11135
2001-02-7284.0
(-6119)863 407 16134 10120
2002-03 -9434 1033 862 12122 4583
2003-04 1050 4526 787 41510 47873
2004-05 -2467 706 -3384 7933 2789
Note: Figures in the brackets pertain to net sales at the face value (excluding premium)Source: RBI Handbook of Statistics on Indian Economy, 2006
166

It can be seen from the Table 5.3 that the resource mobilisation declined
from 1993-94 and more sharply in 1995-96 and 1996-97. Even though new
private sector mutual funds entered the market during this time, there was a
decline in resource mobilisation by mutual funds. Subdued stock market
conditions coupled with perceived lack of transparency in the functioning of
mutual funds, delayed refunds, poor accountability, and lack of efficient services
were the cause of poor performance of mutual funds. In 1998-99 private sector
funds accounted for two third of the total resource mobilization. In the next
subsequent years condition improved because of the tax concessions offered in
equity oriented schemes coupled with bullish trend in the secondary market.
Private sector mutual funds are the fancy of investors today because of their
dynamic performance.
SECONDARY MARKET OPERATIONS
The securities which are floated and subscribed in the primary market are
traded in the secondary market or stock market. The most important function of
stock exchange is to provide liquidity of capital and continuous market for
outstanding securities. In India the secondary market consists of recognized
stock exchanges operating under rules, bye-laws and regulations duly approved
by the government. This stock exchange consists of an organized market where
securities issued by the central and state Governments, public bodies and joint
stock companies are traded. Section 2(3) of Securities Contract (Regulation)
Act, 1956 defines a stock exchange “any body of individual whether
incorporated or not constituted for the purpose of assisting, regulating or
controlling the business of buying, selling or dealing in securities”. The stock
exchanges bring about a correct evaluation of securities and set prices for
securities close to their investment worth.
Scream to Screen based trading
Trading on the established stock exchanges in India took place through
open outcry system. The physical transactions retarded the growth and there was
time lag for new information to reflect in prices. Moreover, when the number of
167

transactions enhanced, the problems got aggravated. The automated screen
based system can match buy and sell orders without the intervention of brokers
and real time system is highly useful. This style is faster, highly transparent and
capable of incorporating price sensitive information into share prices and results
in improved liquidity of markets. Over The Counter Exchange of India (OTCEI)
set up in 1992, was the first screen based trading exchange in India to provide
liquidity to scrips of small and medium sized companies. The Table 5.4 shows
the phenomenal growth in the operations of stock market in India till the nineties.
Table 5.4
Pattern of growth of stock exchanges
1946 1961 1971 1975 1980 1985 1990
No. of Stock Exchanges
7 7 8 8 9 14 19
No. of Listed Companies
1125 1203 1599 1852 2265 4314 5968
Market Capitalisation (Rs.in crores)
971 1292 2675 3273 6750 25302 70521
Source: Bombay Stock Exchange
Before 1990s, the Indian secondary market consists of regional stock
exchanges and BSE, as the apex body. The Indian stock market was plagued
with many limitations such as; lack of transparency, club mentality of brokers,
insider trading, kerb trading, private off market deals, absence of risk
management, high transaction cost, uncertain delivery and settlement periods,
systematic failure of the entire market and market closures due to scams, front
running, i.e., trading ahead of a client, based on knowledge of the client order
and uncertainty of execution prices.
168

POST REFORMS STOCK MARKET SCENARIO
After the introduction of economic reforms in 1991, the Indian secondary
market has a three tier form viz., (i) Regional Stock Exchanges (RSEs), (ii)
National Stock Exchange (NSE), and (iii) Over The Counter Exchange of India
(OTCEI).
The NSE was set up in 1994. It was the first modern stock exchange to
bring in new technology, new trade practices, new institutions and new products
and it is a demutilised stock exchange in the country. At present, there are 23
Stock Exchanges in India – 19 regional stock exchanges, BSE, NSE, OTCEI
and the Interconnected Stock Exchange of India (ISE). The ISE is a stock
exchange of stock exchanges. The 19 regional stock exchanges are located at
Ahemedabad, Bangalore, Bhuvaneswar, Culcutta, Cochin, Coimbatore, Delhi,
Guwahati, Hyderabad, Indore, Jaipur, Kanpur, Ludhiana, Chennai, Mangalore,
Pune, Patna, Rajkot and Vadodara. They operate under the rules, bye-laws and
regulations approved by the Government and SEBI.
STOCK MARKET DEVELOPMENT IN INDIA
The stock markets in India which were lying dormant during the first
three decades of independence have undergone metamorphic transformation
since the mid eighties involving multi-dimensional growth. The magnitude of
growth has been rapid in terms of funds mobilized, the turnover of the
exchanges, the amount of market capitalization and expansion of investor
population (Ramasastri, 2000)6. However, the growth took place in an
unbalanced manner leading to uneven distribution of pattern and frequency of
trading, lack of price continuity and liquidity of listed stocks at many of the
exchanges, insufficient spread of investment consciousness and habit in the
country, inadequate mobilisation of semi urban and rural savings, lack of free
flow of information and effective communication and an inadequate number of
169

members without having any working knowledge and background in Finance,
Accountancy, Law and Economics (Balakrishnan and Nartha 1997)7. In addition
to that, most of the members were actively indulging in speculative activities.
Insider trading was very common. Option and kerb trading, large scale price
rigging and the manipulation of market in active connivance with outsiders
leading to frequent and / or closure of markets became a routine issue. Based on
the recommendations of the Patel Committee, Government of India issued
several guidelines and directions with a view to ensuring proper functioning of
the stock markets.
Indian stock market is one of the largest and oldest stock markets in the
world. There are 23 stock exchanges in the country. Out of which Bombay
Stock Exchange (BSE) and National Stock Exchange (NSE) are conferred the
status of national stock exchanges. All stock exchanges in the country have
adopted online screen based trading. At present, there are 8000 trading terminals
for these exchanges which cater the needs of investing public spread across the
country. The growth of stock markets in India in terms of the number of listed
companies, market capitalisation, turnover on stock exchanges, price indices etc.,
are profuse. Table 5.5 reveals the major indicators of stock market development
in India.
170
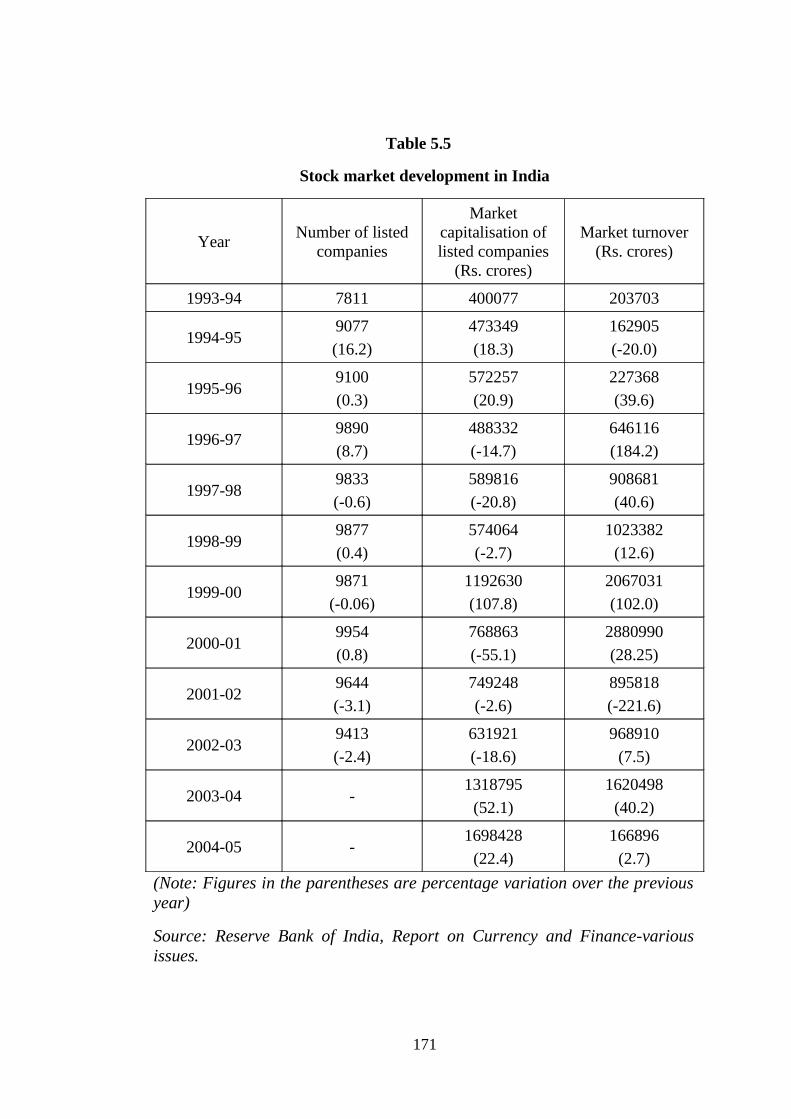
Table 5.5
Stock market development in India
YearNumber of listed
companies
Market capitalisation of listed companies
(Rs. crores)
Market turnover (Rs. crores)
1993-94 7811 400077 203703
1994-959077
(16.2)
473349
(18.3)
162905
(-20.0)
1995-969100
(0.3)
572257
(20.9)
227368
(39.6)
1996-979890
(8.7)
488332
(-14.7)
646116
(184.2)
1997-989833
(-0.6)
589816
(-20.8)
908681
(40.6)
1998-999877
(0.4)
574064
(-2.7)
1023382
(12.6)
1999-009871
(-0.06)
1192630
(107.8)
2067031
(102.0)
2000-019954
(0.8)
768863
(-55.1)
2880990
(28.25)
2001-029644
(-3.1)
749248
(-2.6)
895818
(-221.6)
2002-039413
(-2.4)
631921
(-18.6)
968910
(7.5)
2003-04 -1318795
(52.1)
1620498
(40.2)
2004-05 -1698428
(22.4)
166896
(2.7)
(Note: Figures in the parentheses are percentage variation over the previous year)
Source: Reserve Bank of India, Report on Currency and Finance-various issues.
171

From Table 5.5 it is evident that there were 7811 companies listed in all
stock exchanges in India during 1993-94. It rose to 9413 in 2002-03, an increase
of 20.51 per cent. The all India market capitalisation of listed companies
amounted to Rs.4000
77 crores during 1993-94. There was no significant increase till 1998-99.
However, during 1999-2000 it doubled to Rs. 1192630 crores. Turnover on
various stock exchanges in India was Rs. 203703 crores in 1993-94. Even
though it decreased by 20 per cent in 1994-95, it rose steadily up to 1999-2000
and started fluctuating because of favourable and unfavourable conditions in the
market.
STOCK MARKET INDEX
The stock market index measures overall market sentiment through a set
of stocks that are representatives of the market. It is a barometer of market
behaviour. Stock market index indicates the day to day fluctuations in stock
prices and it also reflects the direction of market. A good stock market index
incorporates a set of scrips which have high market capitalisation and high
liquidity. Market capitalisation is the sum of market value of all the stocks
included in the index. The market value is derived by multiplying the price of
the share by the number of equity shares outstanding.
The index on a day is calculated as the percentage of the aggregate market
value of a set of scrips incorporated in the index on that day to the average
market value of the same scrips during the base period. BSE sensex is a
weighted average of prices of 30 select stocks and S & P CNX Nifty is of 50
select stocks.
Methodologies for Calculating the Stock Market Index
1. Market Capitalisation –Weighted:
a) Full market capitalisation method: In this method, the index is calculated by
the number of shares outstanding multiplied by the market price of a company’s
share. The shares with the highest market capitalisation have a higher weightage
172
and the most influential in this type of index. Some examples are S&P 500
Index in the USA, BSE Sensex and S&P CNX Nifty in India.
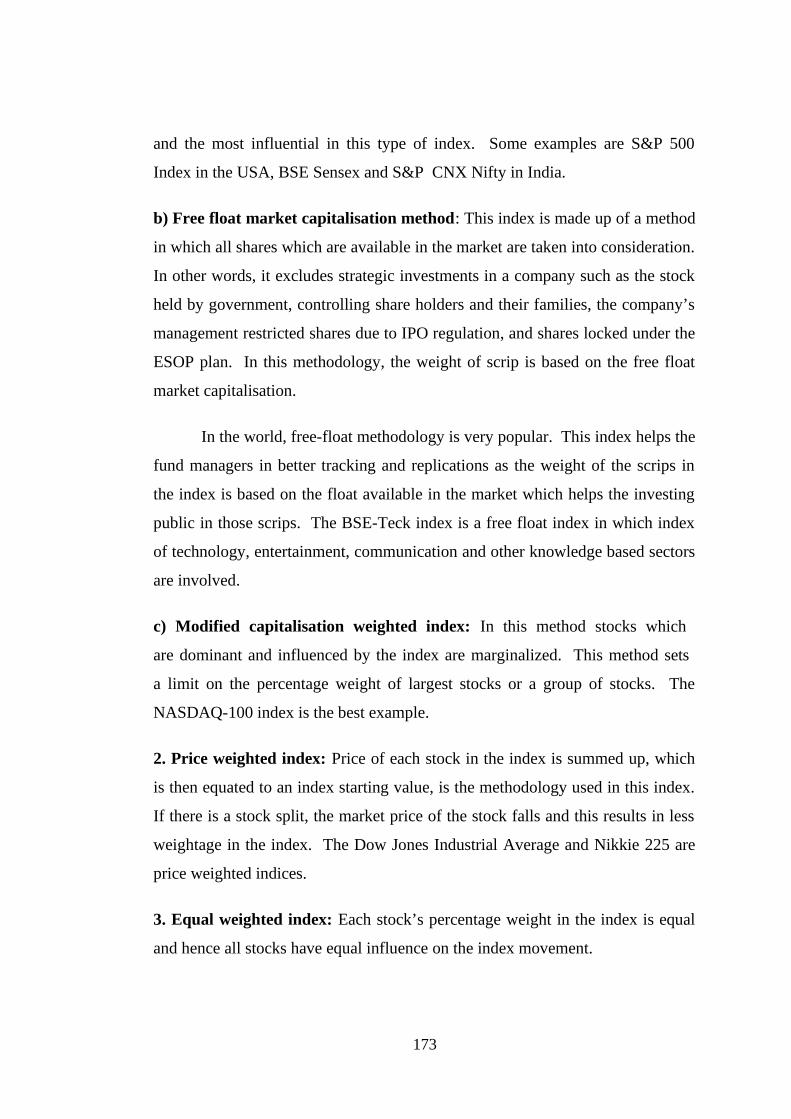
b) Free float market capitalisation method: This index is made up of a method
in which all shares which are available in the market are taken into consideration.
In other words, it excludes strategic investments in a company such as the stock
held by government, controlling share holders and their families, the company’s
management restricted shares due to IPO regulation, and shares locked under the
ESOP plan. In this methodology, the weight of scrip is based on the free float
market capitalisation.
In the world, free-float methodology is very popular. This index helps the
fund managers in better tracking and replications as the weight of the scrips in
the index is based on the float available in the market which helps the investing
public in those scrips. The BSE-Teck index is a free float index in which index
of technology, entertainment, communication and other knowledge based sectors
are involved.
c) Modified capitalisation weighted index: In this method stocks which
are dominant and influenced by the index are marginalized. This method sets
a limit on the percentage weight of largest stocks or a group of stocks. The
NASDAQ-100 index is the best example.
2. Price weighted index: Price of each stock in the index is summed up, which
is then equated to an index starting value, is the methodology used in this index.
If there is a stock split, the market price of the stock falls and this results in less
weightage in the index. The Dow Jones Industrial Average and Nikkie 225 are
price weighted indices.
3. Equal weighted index: Each stock’s percentage weight in the index is equal
and hence all stocks have equal influence on the index movement.
173

Major indices in India
BSE Sensex and NSE Nifty are the two major indices in India. The base
year of BSE Sensex is 1978-79 and it comprises of 30 scrips. In addition to this
criterion, other factors like number of trades, average value of shares traded per
day as a percentage of total number of outstanding shares etc., are considered for
the inclusion of Sensex. Balance representation of industry, leadership position
in the industry, continuous dividend paying record, and track record of promoters
are the selection criterion. Only 11 scrips remain out of 30 scrips and rest have
been selected on the basis of their performance in the market. New economy
scrips are also having enough weightage in the index.
S & P CNX NIFTY
The S & P CNX NIFTY was launched in 8 July 1996, comprising 50
scrips. The scrips are selected on the basis of low impact cost, high liquidity and
market capitalisation. Nifty is the widely used indicator and became popular
within a short span of time (The NSE began equity trading in November 1994
and its volume surpassed that of BSE). A joint venture of NSE and CRISIL, a
specialised organisation to provide stock index services, promoted India Index
services and products. This organisation in collaboration with Standard & Poor
(S & P) made this index to reflect market movement more accurately, provide
fund managers with a benchmark for measuring portfolio performance and
develop reference rate for introducing index based derivative products.
Both the leading stock exchanges viz., BSE and NSE use the weighted
averaging whereby each stock is given weight in proportion to its market
capitalisation. In addition to these indices, other indices are Economic Times
Ordinary share price index (72 scrips), Financial Express Ordinary share price
index (100 scrips) and RBI index of security prices (338 scrips). Major regional
stock exchanges also have their own indices.
174

MAJOR PARTICIPANTS IN THE STOCK MARKET
The increase in turnover took place mostly in large exchanges at the
expense of small ones. Of the 23 exchanges in India, 6 top exchanges account for
99 per cent of turnover with BSE and NSE as the major stock market participants
in the country.
BOMBAY STOCK EXCHANGE
Trading in securities has been ‘in vogue’ in India for a little over 200
years. Since 1793, dealing in securities was like transaction in the loan securities
of East India Company. Hetic speculation was common feature during that
period. The broking community became very prosperous as there was high rise
in stock prices. This led to share mania during 1861-1865. But in 1865,
American Civil war broke out and investors lost their confidence and brokers
realised the importance of a well regulated body with defined rules and
regulations.
The Bombay Stock Exchange established in 1875, as ‘The Native Share
and Stock Brokers Association’, is the oldest in Asia, even older than the Tokyo
stock exchange which founded in 1878 8. Until the establishment of National
Stock Exchange, it was considered the premier stock exchange and trend setter in
the country. Among the 23 stock exchanges recognised by Government of India
under the Securities Control (Regulation) Act, 1956, it was the first one to be
recognised as the one that has granted the privilege of permanent registration9.
Bombay Stock Exchange is a voluntary, non-profit making association of
broker members. BSE emerged as a premier stock exchange after 1960s.
Increased industrialisation after two world wars, protection to domestic industry,
and government's fiscal policies helped the growth of new issues which in turn
helped BSE to prosper. BSE dominated more than 60 per cent of all India
turnover.
175

Until 1992, BSE was functioning like an investors’ club. After the
outbreak of security scam in 1992, SEBI was controlling the ambit of stock
exchanges. In 1994, the Bombay stock exchange faced competition for the first
time when National Stock Exchange was formed as a full fledged automated
trading system. It rose to the challenges of technology and in 1995 put the
automated trading programme and transferred over 5000 scrips from the trading
floor to screen. The Bombay On-Line Trading (BOLT) network has been
extended to centres outside Mumbai and covers 329 cities with 1463 very small
aperture terminals (V-SATs) and 2347 trader work stations (TWS) as of October
200010. BSE later set up a Central Depository System to dematerialise shares and
promote the demat trading.
Carry Forward Deals or Badala
The carry forward system or badala was a special feature of Indian stock
exchanges, particularly of BSE. The badala provided the facility of carrying
forward the transaction from one settlement to another. By bringing in outside
money to fund the carry forward of long positions, badala acted as a bridge
between money market and stock market. This system helped in moderating
extreme movement of stock prices, as it facilitated short selling in a rising market
and long purchases in a declining market. It acted as a risk hedging instrument.
Badala was a vehicle of speculation also.
The badala system was banned in 1993 by SEBI because it had led to
excessive speculation and increased market risk. Modified carry forward system
was followed after the Ketan Parekh scam in March 2001. SEBI banned badala
system and replaced it by a new system called rolling settlement.
BSE Indices
BSE sensitive index (sensex) was the first index launched by BSE in
1986. It has launched 13 more indices. BSE sensex comprises of 30 scrips and a
base year of 1978-79. The BSE sensex index was followed by BSE National in
176

1989. This is a broader index comprising of 100 scrips. In 1993-94 BSE
introduced two new indices; BSE 200 and Dollex. BSE 200 is a list of 200
selected companies from the specified and non-specified group. The Dollex is a
dollar version of the BSE 200 which has 1989-90 as its base year. Five more
sectoral indices are also introduced during August 1999. They are BSE IT index,
BSE capital goods index, BSE FMCG index, BSE health care index, and BSE
consumer durable index.
Trade / Settlement Guarantee Fund
The Trade Guarantee Fund (TGF) of BSE having an initial corpus of
Rs.172.5 crores became operational from May 12, 1997. The fund guarantees
the settlement of bonafide transactions of BSE members and ensures timely
completion of settlement.
Trends in BSE Turnover
The annual turnover, market capitalisation and BSE sensex increased
almost 100 per cent from 1990-91 to 1991-92. Hightend activity and the stock
market were buoyant due to liberalisation measures announced by the
government to attract investors. Some of the important announcements of
1992-93 union budget were, the abolition of wealth tax on financial assets,
abolition of CCI, free pricing of securities, and permission for Indian companies
to raise funds abroad. These announcements triggered the volume of BSE. High
speculation was there because of irregularities in the securities’ transactions of
banks and financial institutions. These irregularities were detected in 1992-93
and turnover depleted drastically. In 1996-97 the turnover at BSE rose by 148
per cent. Badala was relieved and turnover got increased. The extension of
trading terminals outside Bombay in September 1997 led to increase in volume.
Moreover, the demat trading also helped BSE to increase the volume from
1996-97 to 1998-99.
177

Marked by large FII inflows, improved corporate performance, sound
macro-economic fundamentals and upgrading India's credit ratings by credit
rating agencies have led BSE turnover witnessed a sharp increase of 119 per
cent. In 2000-01, increase in turnover was 46 per cent because FIIs slowed down
their activities in the BSE. Large sell offs of new economy stocks in NASDAQ,
increase in international oil prices, payout crisis at some stock exchanges and
liquidity problems with some corporate banks led the slow down of FIIs
activities.
In 1995-96, the number of companies in a group reduced from 94 to 32
but the volume got increased. This is the clear indication of concentration of a
few blue-chip companies trading volume at exchange. So concentration effect is
very much evident here.
On 31 March 1995, BSE Sensex lost 1382 points and the market was
highly depressed. In 1996-97, 1998-99, and 2000-01, even though turnover got
increased, the market capitalisation declined. The decline in the market
capitalisation was a result of decline in the new economy share prices, large sell
offs in the global market, the financial crisis of US-64 payment crisis at different
stock exchanges and the withdrawal of badala system. The BSE Sensex touched
at 2600 mark on 11 September 2001 when terrorists attacked the US. This 2600
mark is all time low since September 8, 1993 (lowest in eight years).
In terms of market capitalisation and turnover, the relative importance of
various manufacturing companies like cement, steel and financial services have
declined, while that of IT, Pharma and FMCG sectors have increased sharply.
This shift was a result of government policy which lifted the controls on the
private sector and the economy was opened for foreign institutional investors.
Even though many capital intensive industries such as steel, fertilisers and
chemicals are preferred well in a closed economy, they could not withstand
international competition. Moreover, the new emerging companies offered
handful gains to share holders as dividend and capital gain. The table 5.6 depicts
the trend in major indicators of Bombay Stock Exchange.
178

Table 5.6
Trends in Bombay Stock Exchange
YearNumber of
listed companies
Market capitalisation
of listed companies (Rs. crores)
Market turnover (Rs.
crores)BSE Sensex
1993-94 3585 368071 84536 3778.99
1994-954802
(33.9)
435481
(18.1)
67748
(-19.9)
3260.96
(-13.7)
1995-965603
(16.7)
526476
(20.9)
50064
(-26.1)
3366.21
(3.2)
1996-975832
(4.1)
463915
(-11.9)
124284
(148.3)
3360.89
(-0.2)
1997-985853
(0.4)
560325
(20.8)
207383
(66.9)
3892.75
(15.8)
1998-995849
(-0.1)
522942
(-2.7)
311999
(50.4)
3739.96
(-3.9)
1999-20005815
(-0.6)
912842
(68.1)
685028
(119.6)
5001.28
(33.7)
2000-015689
(-0.9)
571553
(-37.4)
1000032
(46.0)
4269.69
(-14.6)
2001-025782
(-1.5)
612224
(7.1)
307292
(-69.3)
3331.95
(-22.0)
2002-035650
(-2.3)
572198
(-6.3)
314073
(2.2)
3206.9
(-3.8)
2003-045528
(-2.2)
1201207
(109.9)
503053
(60.2)
4492.1
(40.1)
2004-054731
(-14.4)
1698428
(41.4)
518715
(3.1)
5740.52
(27.8)
Note: Figures in the parentheses are percentage variations over the previous year.Source: Reserve Bank of India, Report on Currency and Finance – various issues.
179

According to the Table 5.6, there were 3585 listed companies in BSE in
1993-94. The number of listed companies showed an upward trend until
1996-97. In 1999-2000 the number of listed companies in Bombay stock
exchange was 5889 and it reduced to 4731 in 2004-05. As regards the market
capitalisation of listed companies in the exchange, it amounted to Rs. 638701
crores in 1993-94. As in the case of all India market capitalisation, it remains idle
up to 1998-99 and rose in the year 1999-2000. It again went down in the
subsequent years and went up in the year 2004-05. Market turnover of the
exchange during the period under review showed a mixed trend.
Market returns on equity shares as well as volatility in prices are
measured through share price indices. In India, Bombay Stock Exchange 30
share sensitive index (BSE Sensex) is one of the popular benchmarks of share
prices. As revealed in Table 5.6, sensex stood at 3779 points in 1993-94. It
hovered around this level up to 1998-99 but rose by one third to 5001 points in
1999-2000. On a review of trend indices from the Table there will be a
misleading impression that the index remained stable between 1993-94 and
1998-99, and that the level of volatility was comparatively low in Bombay Stock
Exchange. But this is not correct. The Indian market is probably more volatile
than the developed markets which is probably why a much higher portion of
saving in developed countries go to equities (Economic Times Knowledge
Series, 2001)11. As given in Table 5.6, sensex stood at 2037 points towards the
end of April 1993 and rose to 3492 points during the middle of October 2000.
However, sensex moved erratically during the intervening period.
THE NATIONAL STOCK EXCHANGE OF INDIA
The National Stock Exchange was set up in November 1992 under the
recommendations of Pherwani committee. The idea was to start a most modern
stock exchange with international standards (best global practices). NSE was set
up to achieve the objectives like;
180
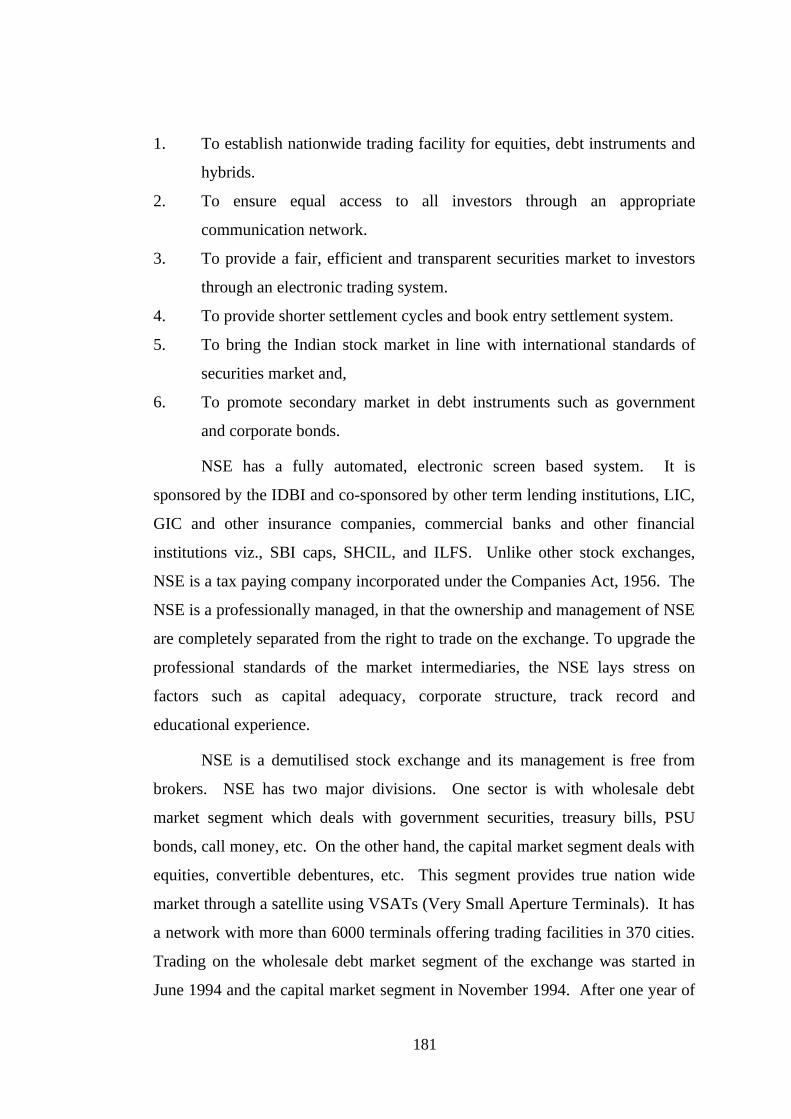
1. To establish nationwide trading facility for equities, debt instruments and
hybrids.
2. To ensure equal access to all investors through an appropriate
communication network.
3. To provide a fair, efficient and transparent securities market to investors
through an electronic trading system.
4. To provide shorter settlement cycles and book entry settlement system.
5. To bring the Indian stock market in line with international standards of
securities market and,
6. To promote secondary market in debt instruments such as government
and corporate bonds.
NSE has a fully automated, electronic screen based system. It is
sponsored by the IDBI and co-sponsored by other term lending institutions, LIC,
GIC and other insurance companies, commercial banks and other financial
institutions viz., SBI caps, SHCIL, and ILFS. Unlike other stock exchanges,
NSE is a tax paying company incorporated under the Companies Act, 1956. The
NSE is a professionally managed, in that the ownership and management of NSE
are completely separated from the right to trade on the exchange. To upgrade the
professional standards of the market intermediaries, the NSE lays stress on
factors such as capital adequacy, corporate structure, track record and
educational experience.
NSE is a demutilised stock exchange and its management is free from
brokers. NSE has two major divisions. One sector is with wholesale debt
market segment which deals with government securities, treasury bills, PSU
bonds, call money, etc. On the other hand, the capital market segment deals with
equities, convertible debentures, etc. This segment provides true nation wide
market through a satellite using VSATs (Very Small Aperture Terminals). It has
a network with more than 6000 terminals offering trading facilities in 370 cities.
Trading on the wholesale debt market segment of the exchange was started in
June 1994 and the capital market segment in November 1994. After one year of
181

NSE's incorporation, its volume surpassed the volume of BSE and now it has
emerged as the largest stock exchange in the country. The trend in the major
indicators of the National Stock Exchange is exhibited in Table 5.7.
Table 5.7
Trends in National Stock Exchange
YearNo. of listed
companies
No. of Companies Available for trading
Market turnover
(Rs. crores)
Average daily
Turnover (Rs.
Crores)
Market capitalisation (Rs. crores)
S&P CNX Nifty
1994-95 135 678 1800 10 363350 -
1995-96 422 1269 67287 2.07 401450 985
1996-97 550 1484 295400 1170 419360 969
1997-98 612 1357 370193 1520 481500 1117
1998-99 648 1254 414470 1650 491170 1078
1999-00 720 1152 839050 3300 1020420 1529
2000-01 785 1029 1339510 5330 657840 1148
2001-02 793 890 513160 2070 636860 1130
2002-03 818 788 617980 24.6 537130 978
2003-04 909 787 1099530 4320 1120970 1772
Source: Reserve Bank of India, Report on Currency and Finance – various issues.
Trading in National Stock Exchange (NSE) started in 1994. Nifty index is
available only from 1995-96. As it is evident from the Table 5.7 that there were
only 135 companies listed in 1994-95 whose market capitalisation amounted to
Rs. 363350 crores. In the case of market capitalisation, there was a sudden spurt
during 1999-2000 to Rs. 1020420 crores making an increase of more than 150
per cent in a single year. The turnover rose nearly 60 per cent during 1999-2000,
the NSE bench mark S&P CNX Nifty rose more than 40 per cent. The
phenomenal rise in Information Technology scrips coupled with the signs of
overall improvement in economic performance, appeared to have significantly
182

contributed to the stock market buoyancy. However, the growth in market
turnover from Rs. 1800 crores in 1994-95 to 1099530 crores in 2003-04 is an
indicator of growth of exchange as achieved with in a short span of time.
National Securities Clearing Corporation Limited (NSCCL)
The National Securities Clearing Corporation Limited (NSCCL) was set
up by NSE in April 1995, a wholly owned subsidiary, to undertake clearing and
settlement at the exchange. It started functioning from April 1996. NSCCL
operates with a well defined settlement cycle, aggregates trades over a trading
period, and nets the position to determine the liabilities of members. It also
ensures movement of funds and securities to meet respective liabilities.
NSCCL guarantees the settlement. It is a guarantee provided by a
clearing corporation for the settlement of all trades even if a party defaults to
deliver securities or pay cash. In this way, NSCCL assumes counter party risk.
NSCCL started settlement guarantee fund for the capital market in June 1996
with an initial corpus of Rs. 300 crores. At the end of August 2002 their funds
stood at Rs. 1651 crores. In addition to the above, a separate Settlement
Guarantee Fund (SGF) is maintained for Future and Options (F&O) segment.
NSCCL also provides Mutual Fund Service System (MFSS) to investors for
transacting dematerialised units of open-ended schemes of mutual funds.
The NSE Indices
The NSE 50 was rechristened as S&P CNX Nifty on 28 July 1998. This
index is widely used as it reflects the state of the stock market sentiments for 50
highly liquid scrips. The CNX Nifty Junior is a midcap index introduced in
January 1997 to cater to the growth companies in the economy. The companies
included in this index are traded with an impact cost of less than 2.5 per cent on
85 per cent of the trading days.
183
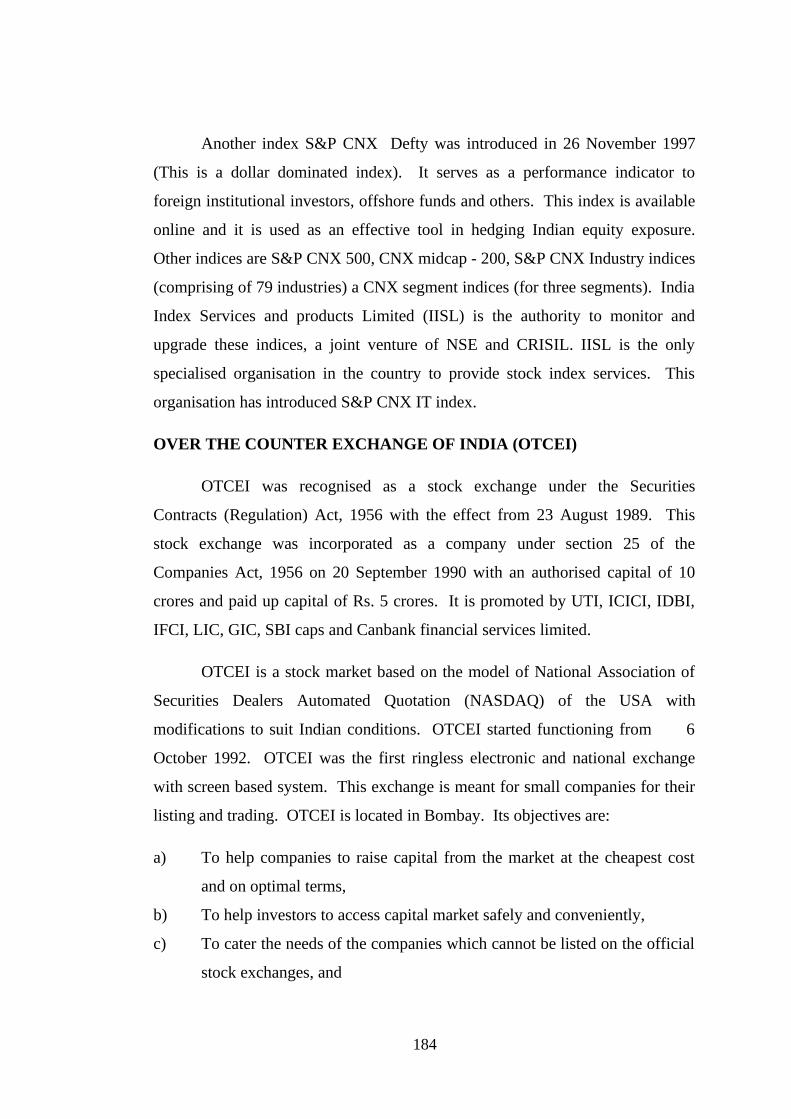
Another index S&P CNX Defty was introduced in 26 November 1997
(This is a dollar dominated index). It serves as a performance indicator to
foreign institutional investors, offshore funds and others. This index is available
online and it is used as an effective tool in hedging Indian equity exposure.
Other indices are S&P CNX 500, CNX midcap - 200, S&P CNX Industry indices
(comprising of 79 industries) a CNX segment indices (for three segments). India
Index Services and products Limited (IISL) is the authority to monitor and
upgrade these indices, a joint venture of NSE and CRISIL. IISL is the only
specialised organisation in the country to provide stock index services. This
organisation has introduced S&P CNX IT index.
OVER THE COUNTER EXCHANGE OF INDIA (OTCEI)
OTCEI was recognised as a stock exchange under the Securities
Contracts (Regulation) Act, 1956 with the effect from 23 August 1989. This
stock exchange was incorporated as a company under section 25 of the
Companies Act, 1956 on 20 September 1990 with an authorised capital of 10
crores and paid up capital of Rs. 5 crores. It is promoted by UTI, ICICI, IDBI,
IFCI, LIC, GIC, SBI caps and Canbank financial services limited.
OTCEI is a stock market based on the model of National Association of
Securities Dealers Automated Quotation (NASDAQ) of the USA with
modifications to suit Indian conditions. OTCEI started functioning from 6
October 1992. OTCEI was the first ringless electronic and national exchange
with screen based system. This exchange is meant for small companies for their
listing and trading. OTCEI is located in Bombay. Its objectives are:
a) To help companies to raise capital from the market at the cheapest cost
and on optimal terms,
b) To help investors to access capital market safely and conveniently,
c) To cater the needs of the companies which cannot be listed on the official
stock exchanges, and
184

d) To eliminate problems of non-liquid securities, delayed settlements and
unfair prices faced by the investors.
Though the purpose of introduction of OTCEI was extremely good, the
turnover of the exchange steadily declined from 1994-95. In order to overcome
the difficulties, SEBI appointed two committees - Malegam and Dave
committees, to review OTCEI working and suggest measures to revamp its
functioning. The reasons for low activity on OTCEI are: a) stringent market
making norms, b) mandatory requirement that the sponsor must offer buy and
sell quotes in all the scrips with the spread not exceeding 10 per cent, c) banks
aversion to finance market making, and d) T + 3 settlement period not permitting
speculators.
INTERCONNECTED STOCK EXCHANGE OF INDIA
With the opening up of the economy and economic reforms, there were
drastic improvements in the Indian stock market. The cutthroat competition of
BSE and NSE threatened the existence of regional stock exchanges. The volume
of business on the RSEs which accounted 9.2 per cent of the total turnover in
1995-96 decreased to 3.5 per cent in 1998-99. Even if electronic trading has
started, certain exchanges like Guwahati, Magadh, Indore, Mangalore and Rajkot
came to a halt. So, the survival was in question. These RSEs have formed the
Federation of Indian Stock Exchanges (FISE) in 1996.
There were two options; either to become a memebr of NSE or BSE. So
the RSEs and Federation of Indian stock exchanges proposed for Inter-
Connected Market System (ICMS), to improve trading and to increase market
efficiency. They have sought technical assistance from the US agency for
international development-Financial Institutions Reforms and Expansion
(USAID–FIRE) project, administered by Price Waterhouse. The Inter-
Connected Stock Exchange (ISE) was set up as the twenty third stock exchanges
in the country, with the help of USAID - FIRE.
185

The ISEs have 15 RSEs granted recognition under the Securities
Contracts (Regulation) Act, 1956 by SEBI in November 1998. ISE commenced
its operation on February 26, 1999. ISE has 4500 members and 3500 securities
listed on them. ISE is a stock exchange of stock exchanges and its participatory
stock exchanges are only traders on NSE. In 1999-2000 ISE had a turnover of
545 crores and in 2000-01 it was Rs. 223 crores. The trading volume got
depleted drastically and its importance is vanishing now.
REGIONAL STOCK EXCHANGES IN INDIA
Indian capital market has 19 regional stock exchanges which is the
highest in the world. In developed countries also, regional stock exchanges
existed but they had to shut down or merge with the principal exchanges. In the
UK, by 1965 all the regional stock exchanges joined together to form the
Federation of Stock Exchanges and amalgamated to become a fully unified stock
exchange in 1973. Australia had six exchanges got united and established the
Australian Associated Stock Exchanges (AASE), a company limited by its
guarantee, to represent them at the national level. The Australian Stock
Exchange (ASX) commenced operation, with the six capital city exchanges as its
wholly owned subsidiaries in 1987. The same is the case with Italy. In Italy, all
securities listed on the Milan stock exchange and nine other RSEs were
transferred to a national computerised order-driven trading system under the
Italian stock exchange in 1991. So, now the Italian stock market is a
computerised system with no specific place as its apex.
In India, the jurisdiction and area of operation of the regional stock
exchanges were specified. The 19 stock exchanges provided investors an access
to big brokers in Bombay. The RSEs served as a link between local companies
and local investors. Reputed local companies could list their companies in
exchanges and RSEs continued trading in these local scrips. But hectic
competition arose among the issuers of companies and they tried to list these
companies in as many exchanges as possible to attract investors from all over the
186

country. The listing fee was the major source of income of stock exchanges and
the listing standards were also diluted. But before 1990s, regional stock
exchanges were working properly.
During 1990, Government of India started OTCEI, NSEI, and Inter-
Connected Stock Exchange and permitted nationwide trading. Since people
could directly access NSE and BSE terminals, the turnover of regional stock
exchanges nosedived. Since many companies decided to delist shares, the listing
income which was the major income of the regional stock exchanges depleted
and the very existence of regional stock exchanges were at stake. The Table 5.8
reveals the growth and distribution of turnover on stock exchanges.
187

Table 5.8
Growth and distribution of turnover on stock exchanges(Rupees in crores)
Sr. No. Stock Exchanges 1993-94 1994-95 1995-96 1996-97 1997-98 1998-99 1999-00 2000-01 2001-02
01. NSE -8,509 (5.01)
80,009 (33.44)
3,36,782 (48.92)
4,81,197 (47.18)
5,19,852 (46.05)
11,43,268 (48.2)
17,70,458 (53.43)
15,62,283 (80.25)
02. Mumbai84,536 (41.50)
67,748 (39.93)
50,064 (20.93)
1,24,284 (18.05)
2,07,383 (20.33)
3,11,999 (27.64)
6,85,028 (28.89)
10,01,619 (30.23)
3,09,316 (15.89)
03. Kolkata57,641 (28.30)
52,872 (37.22)
62,128 (25.87)
1,05,664 (15.35)
1,78,778 (17.53)
1,71,780 (15.22)
3,57,168 (15.06)
3,55,035 (10.72)
27,075 (1.38)
04. Uttar Pradesh6,889 (3.38)
7,283 (4.61)
2,373 (0.99)
16,070 (2.33)
15,390 (1.51)
18,627 (1.65)
24,048 (1.01)
24,747 (0.75)
25,237 (1.30)
05. Ahammadabad23,540 (11.56)
5,651 (3.33)
8786 (3.67)
20,533 (2.98)
30,771 (3.02)
29734 (2.63)
37,566 (1.58)
54,035 (1.63)
14,844 (0.76)
06. Delhi12,098 (5.94)
9083 (5.35)
10,076 (4.21)
48,631 (7.06)
67,840 (6.65)
51,759 (4.58)
93289 (3.93)
83,871 (2.53)
5,828 (0.30)
07. Pune3,459 (1.76)
3672 (2.16)
7,071 (2.86)
9,903 (1.44)
8,624 (0.85) 7,453 (0.66) 6,087 (0.26) 6,171 (0.19) 1171 (0.06)
08. Ludhiana1,620 (0.80)
2,488 (1.47)
4,849 (2.03)
5,274 (0.77)
8,315 (0.82) 5,978 (0.53) 7,741 (0.33) 9,732 (0.29) 857 (0.04)
09. Bangalore2,312 (1.13)
712 (0.42) 880 (0.37)4,398 (0.64)
8,636 (0.85) 6,779 (0.60)11,147 (0.47)
6,033 (0.18) 70 (0.00)
10. ICESEIL - - - - - 1 (0.00) 545 (0.02) 233 (0.01) 55 (0.00)
11. Hyderabad 984 (0.48)1,375 (0.81)
1,285 (0.54)
480 (0.00) 1,860 (0.18) 1,276 (0.11) 1,237 (0.05) 978 (0.03) 41 (0.00)
12. SKSE 302 (0.15) 545 (0.32) 564 (0.24) 398 (0.06) 17 0 0 0 27 (0.00)
13. Chennai2,299 (1.13)
3,033 (1.79)
1,594 (0.67)
2,315 (0.34)
1,228 (0.12) 370 (0.03) 250 (0.01) 109 24 (0.00)
14. Madhya Pradesh 134 (0.07) 118 (0.07) 204 (0.09) 12 1 1 10 2 24 (0.00)
188

Sr. No. Stock Exchanges 1993-94 1994-95 1995-96 1996-97 1997-98 1998-99 1999-00 2000-01 2001-02
15. Vadodara1,621 (0.96)
1,259 (0.53)
4,268 (0.62)
(0.45) 4,576 1,749 (0.15) 159 (0.01) 1 10 (0.00)
16. OTCEI 365 (0.22) 218 (0.09) 221 (0.03) (0.01) 125 142 (0.00) 3,588 (0.15) 126 4 (0.00)
17. Guawahati 452 (0.22) 285 (0.17) 619 (0.76) 484 (0.07) 20 30 0 0 0 (0.00)
18. Bhuvaneshwar 420 (0.21) 143 (0.05) 226 (0.09) 231 (0.03) 202 (0.02) 77 (0.01) 70 0 0
19. Cochin 294 (0.14) 587 (0.35)1803 (0.75)
1,401 (0.20)
1,783 (0.17) 773 (0.07) 0 187 (0.01) 0
20. Magath1,938 (0.95)
797 (0.47)1,629 (0.66)
2,755 (0.40)
323 (0.03) 0 8 2 0
21. Coimbatore1,026 (0.50)
1310 (0.7)2,503 (1.05)
2,398 (0.35)
2,136 (0.21) 395 (0.03) 39 (0) 0 0
22. Jaipur 616 (0.30) 879 (0.52)1,047 (0.44)
1,519 (0.22)
431 (0.04) 65 (0.01) 2 0 0
23. Mangalore 107 (0.05) 62 (0.04) 39 (0.02) 373 (0.05) 306 (0.03) 11 0 0 0
Total 203,702 1,69,686 2,39,236 6,88,334 10,19,944 11,28,851 23,71,247 33,13,338 19,46,865Share of largest stock exchanges
41.50 44.94 54.37 66.98 67.51 73.69 77.10 83.66 96.13
Share of remaining 58.50 55.06 45.63 33.02 32.49 26.31 22.90 16.34 3.87
Note: Figures in brackets indicate percentage share in total turnover. (Turnover means the total value of transactions of securities in all the market segments of an exchange.)Source: SEBI
189

The Fig.5.1 shows the share of BSE, NSE and Regional Stock Exchanges in
2001-02.
Figure 5.1
The Share of BSE, NSE and Regional Stock Exchanges in the total turnover
80.25%
15.89%
3.86%
NSE
BSE
Regional
Causes of Failures of Regional Stock Exchanges
1. The regional stock exchanges (RSEs) have a theoretical basis in the fact
that for a vast country like India, a decentralised development of stock market is
good for the balanced regional development. The decline in RSEs reflects the
crisis and stagnation in the National stock market, which in turn has been the
result of industrial recession and stock market scams which had destroyed the
investor confidence thoroughly. Moreover local, regional, semi-urban people did
not have adequate knowledge or analytical skills and quick information required
for share investment.
2. BSE and NSE did not leave space for RSEs to grow. RSEs could not
compete with BSE and NSE.
190
3. Listing fee was the major income of regional stock exchanges, and when
companies started delisting their shares from RSEs, the very survival of them
was difficult.
In order to revive the regional stock exchanges, Government of India is
planning to set up an organisation called Indonext on par with Euronext of UK.
The idea of Indonext is that all companies with paid up capital of Rs. 20 crores
will be traded in Indonext only. Such companies cannot list in BSE and NSE.
RSEs brokers will become the members of Indonext. Along with that, if SEBI
allows future and options (F&O), the turnover will flourish in regional stock
exchanges and they will be able to survive.
Recent Developments in Indian Stock Market
The last decade was a landmark in the history of Indian stock market.
Vast reform measures have started. Innovative initiatives like screen based
trading and establishment of IT backed National Stock Exchange took place in
the first half of this decade. Such developments placed the Indian stock market
in the forefront of modern well developed capital markets in the world. Now,
Indian stock market is getting a lot of momentum and turnover, market
capitalisation and the number of companies getting listed are increasing heavily.
Resource Mobilisation in the Post Reform Period - Structural Changes
When we initiated the reforms in India in the mid 1980s, people accepted
it half-heartedly. People did not welcome the change. Following the reforms of
1980s, the Structural Adjustment Programmes (SAP) of 1990s was a 'Big Bang'.
Major policy initiatives encompassing all major segments of the economy
transformed the economic environment. Along with internal liberalisation,
external liberalisation and competition were also ushered in, through reduction in
input tariffs and liberalisation of imports. The sudden change in the economic
environment and great expectations about the future potential in India, led to a
sudden boom or euphoria in the Indian capital market. Even though the decade
191
of the nineties witnessed sudden change in economic reforms, followed by two
major stock market scams and high volatility in stock prices, the capital market
as a whole experienced a steady, secular growth trend. It was for the first time in
India, resource mobilisation from primary market exceeded the assistance
disbursed by all financial institutions. The resource mobilisation through the
issue of corporate securities in the primary market rose to Rs. 68963 crores
(excluding Euro issues) during 1990-2000, while during the same period, the
assistance disbursed by all financial institutions rose to Rs. 68478 crores (ISMR,
2002 and RBI Handbook). This clearly shows the structural changes occurred
and India has moved to a more or less market oriented economy. A new idea of
private placement is ‘in vogue’ by corporate sector. Now disinvestment of
public sector units is going on and even the central and state government are
thinking of utilizing equity oriented investment projects.
Reforms in the Indian Capital Market Post 1991-The Globalisation Era
The period of globalisation witnessed tremendous changes in the capital
market of India. It is worth to revisit some of the reforms (after 1991) and
examine their impact on market efficiency.
Market Pricing of Issues
The Controller of Capital Issues (CCI) was abolished and the decision to
leave the pricing of issues to the markets was some of the major steps taken in
1991. Earlier, companies used to issue their IPOs at Rs.10 at par. Now, the
companies can decide what should be the premium of their shares and how much
the company's share is worth. This reform replaced the beaurocratic price
administration with market pricing, thereby facilitating the price discovery.
Later, under the supervision of SEBI, book building mechanism was introduced
and a better price recovery system was established.
Empowering the Regulatory Body - SEBI
192

The capital market regulating body, Securities and Exchange Board of
India (SEBI), was set up in 1989 and started official functioning in 1992 with the
responsibility of protecting the interest of investors and promoting and regulating
the development of securities market. It is mandatory that all intermediaries
have to be registered with SEBI. SEBI is the most powerful body in India to
control the capital market and it is being regulated by the Ministry of Finance.
Disclosure and investor protection (DIP) guidelines are issued by the SEBI to
protect the interests of the investors. After the setting up of SEBI, investors’
grievances reduced substantially and confidence increased.
Open Electronic Limit Order Book and Screen Based Trading
The major paradigm shift in the case of capital market is the replacement
of ‘open outcry’ system with the modern open electronic order book market.
The open outcry system was prevailing in the stock market for more than a
century. It is just like any market where brokers assemble in a trading floor and
trade through shouting and hand signalling. The deficiency of this system is that
its liquidity is limited to the ability of the market intermediaries to hold inventory
of securities. Another deficiency is that all available information is not reflected
in the market all of a sudden. So, some brokers have the advantage of making
more profits than others. In other words, market is in the weak form of
efficiency.
The Open Electronic Limit Order Book (ELOB) system is a countrywide
computer based matching system. The advantage of this system is that it
facilitates discovery of prices that reflect the combined resources and
information of all traders. This system boosts up liquidity substantially.
Moreover, it facilitates transparent screen based trading. The ELOB and screen
based trading started in the National Stock Exchange (NSE) in 1994. This was a
great leap forward in the case of Indian stock market. Bombay Stock Exchange
(BSE) started ELOB and screen based trading in 1995.
Extension of Markets: Country wide Integrated Markets
193

When open-outcry system was dominant in Indian stock market, the
traders and investors had to route their orders to Bombay through many
intermediaries. This multiplication of intermediaries pushed up transaction costs.
There was price variation between Bombay and other parts of the country and
intermediaries used to exploit the investors.
When NSE established satellite communication systems, paving way for a
nationwide connectivity, the major deficiency of the open outcry system was
removed. This led to the emergence of an integrated national market. With this
screen based trading system, an order placed from any part of the country
through computer can be matched with any order from any parts of the country.
The ELOB system and the consequent country-wide integration of markets,
succeeded in introducing the number of intermediaries substantially and thereby
reducing transaction costs. This has removed discrepancies between markets,
thereby contributing to market efficiency. Liquidity has increased tremendously
and the market capitalisation ratio has increased more than one in India which is
comparable with other developed markets.
Clearing House System
In the case of open-outcry system when the trades are not guaranteed by
the stock exchange, there is a possibility of counter-party risk. The counter-party
risk arises when one of the parties to a contract declares bankruptcy and reneges
the contract. High volatility in stock prices adds to the possibility of counter
party risk. The danger of counter party risk is that a default at the level of the
one or few traders can lead to default at the entire market level and a systematic
collapse through cascading effects. The problem of counter-party risk has been
removed through a major reform in Indian stock market, called the Clearing
House Corporation. This corporation guarantees each trading which is taking
place in stock exchanges. It was from July 1996 onwards, the National
Securities Clearing Corporation (NSCC) guarantees each trade and thereby
removing the risk of counter party risk and its cascading consequences.
194
Depository Services
Since inception till 1996, share transfers in the market required physical
movement of shares. This physical movement of shares generate direct back
office cost for handling, transporting and storing certificates. In addition to that,
certificates are vulnerable to theft, counterfeiting and inconsistent signatures.
The back office work consists of filling the transfer deeds, affixing share transfer
stamps, sending certificates to the company through post offices etc. This led to
high transaction cost. Moreover liquidity of the stock was also affected because
a share to get its name transferred, normally took 45 days to get it done.
Moreover, companies also manipulated by making artificial scarcity of shares,
thereby increasing the prices.
Problems which are arising from physical certificates have been solved
through the novel system of depositories. A 'depository' is an institution which
maintains an electronic record of ownership of shares. The storage and handling
of certificates is hence immediately eliminated, which generates a reduction in
cost. Furthermore, possibilities of forgery, counterfeiting and theft of securities
are eliminated. The significance of the depository is that they reduce transaction
cost, improve liquidity and help in better price realisation, thereby contributing to
market efficiency. India has two depositories. India's first depository, the
National Securities Depository Limited (NSDL), started functioning on 8th
November 1996 promoted by the NSE. Later, BSE also started its depository
called Central Depository Services Limited (CDSL).
Rolling Settlement
Before 1991 reforms, the trading cycle in stock exchanges varied from 14
days for specified securities and 30 days for non-specified securities with carry
over facilities under the badala system. Here, actual delivery of securities and
payment of cash after settlement took another 10 days or more after the trading
cycle. Such long periods between entering into a contract and final settlement
195

often caused defaults and settlement problems. In order to overcome these
problems, the settlement cycle was later reduced to one week. This weekly
settlement period also created problems in the stock markets.
In India, after the securities market reforms, on par with international
standards, India also introduced ‘T+n’ rolling settlement. Here ‘T’ denotes the
trading day and ‘n’ refers to the number of days after the trading day, when
actual settlement takes place. All shares were compulsorily moved to rolling
settlement from December 2001. Started with T+5, now we have T+2 in Indian
stock market and T+1 is in the offing. Only five countries in the world have
adopted T+2 settlement system and India is one among them.
Derivatives Trading
Introduction of derivatives trading is one of the most important reforms in
recent times. Derivatives like future and options are financial contracts which
derive their value from 'the underlying'. The underlying refers to the spot market
price of the product concerned. In India, trading in derivatives was introduced in
June 2000. At present, the market offers index future and options and stock
future and options in securities. Index futures and options are more advisable
than the stock future and options. The clearing corporation guarantees all trade
in the derivative market.
The key motivation for such instrument is that they are useful in
reallocating risks either across time or among individuals with different risk
bearing preferences. The advantage of derivatives is that they allow better risk
management. Trading in derivatives enables risk minimisation through hedging
and arbitrage.
Capital from abroad - GDRs and ADRs
Till 1994, Indian companies were allowed to raise resources only from
the domestic market. Because of the financial liberalisation and globalisation in
India, Indian corporate sector could mobilise resources from foreign countries
through the issue of Global Depository Receipts (GDRs) and American
196

Depository Receipts (ADRs) from 1992. Because of this facility, Indian
companies could flourish maximum and they could mobilise enough foreign
savings for the capital formation in India. The Table 5.9 reveals the flow of
ADRs and GDRs.
Table 5.9
ADRs / GDRs
Year ADRs / GDRs (US $ mn)
1992-93 240
1993-94 1597
1994-95 2050
1995-96 683
1996-97 1366
1997-98 645
1998-99 270
1999-00 768
2000-01 831
2001-02 477
2002-03 600
2003-04 459
2004-05 613
Source: RBI
The flow of ADRs and GDRs was only US 240 million dollars in 1992-93
and it increased to US $ 2050 million in 1994-95, an increase of 8.5 times. The
flow of ADRs and GDRs were not uniform. In 2004-05, it was only 613
million US dollars.
Foreign Portfolio Investment
Indian stock market was opened for foreigners since 1993. Foreign
institutional investors (FIIs) were allowed to invest in Indian stock market and it
gave a fillip to the secondary market. FPI played a significant role in boosting
197

India's foreign exchange reserves at a time when the country's reserves position
was precarious. FPI boosted up the support when Indian stock market was
dwindling after the crash of 1992. FPI has a positive effect from the macro-
economic perspective. Increase in capital flows through FPI reduces the interest
rate (via. increase in money supply). Reduction in interest rate has a positive
impact on investment and growth. The Table 5.10 reveals the foreign investment
inflows.
Table 5.10
Trends in FII Investment
YearGross
Purchase (Rs. crore)
Gross Sales (Rs.
crore)
Net Investment (Rs. crore)
Net Investment**
(US $mn.)
Cumulative Net
Investment** (US $ mn.)
1993-94 5593 466 5126 1634 1638
1994-95 7631 2835 4796 1528 3167
1995-96 9694 2752 6942 2036 5202
1996-97 15554 6979 8575 2432 7634
1997-98 18695 12737 5958 1649 9284
1998-99 16115 17699 -1584 -386 8898
1999-00 56856 46734 10122 2339 11237
2000-01 74051 64116 9934 2160 13396
2001-02 49920 41165 8755 1846 15242
2002-03 47060 44371 2689 562 15804
2003-04 144858 99094 45765 9949 25754
2004-05 216953 171072 45881 10172 35926
**Net Investment in US $ mn at monthly exchange rate Source: Securities Market (Annual series, National Stock Exchange Ltd, 2006)
Table 5.10 shows that net FII investment has increased from Rs. 5126
crores to Rs. 45881 crores in 2004-05, a nine fold increase in twelve years.
Since the FPI is hot money, sudden reversal of foreign capital (capital flight) can
disturb the macro-economic policies. Contagion is very common in emerging
198
markets. When the researcher has enquired with top officials in RBI, they have
opined that they are in a position to overcome this kind of shocks, because RBI is
concentrating on fuller convertibility rather than full convertibility. Moreover 48
per cent FII inflows were participatory notes in 2004-05 (Refer EPW, January 1,
2006, p.98). This money is routed through Mauritius.
Book Building
In 1995 book building was introduced in India. In the USA this was
highly successful. Book building is a process of offering securities based on bids
received from investors. Better price discovery can happen with the help of this
process. But, we are of the opinion that a lot of manipulation is being done in
India in the case of book building. Road shows are not conducted and book
builders manipulate the price. SEBI must keep a strict vigil on this issue.
Demutalization of Stock Exchanges
Indian stock exchanges are the institutions of brokers, for the brokers and
by the brokers. India demutalized its National Stock Exchange in 2001.
Normally broker owned, controlled and managed the stock exchanges. Under
the corporatisation of ownership, management and trading membership are
segregated from one another. NSE has a demutilised governance structure. For
other exchanges, government offered many concessions and tax incentives to
facilitate corporatisation. Recently, Government of India decided to offload
major shares of Bombay Stock Exchange and BSE is planning to go for a public
issue shortly.
Risk Management
Stock markets are meant for their natural volatility. According to the
proponents of financial liberalisation hypothesis, they advocate that volatility
will reduce when market becomes mature. In order to avoid market failures and
systematic collapse, market integrity is essential. In order to have market
integrity, it requires comprehensive risk management system. In India, we had
many stock market scams and crashes, and after learning from these lessons,
many comprehensive risk management system has been introduced viz., the
199

capital adequacy of members, adequate margin requirements, limit on exposure
and turnover, indemnity insurance, on-line position monitoring and automatic
disablement, circuit breaks or price bands, etc. And also, there are systems for
efficient market surveillance to curb excessive volatility and to prevent price
manipulations.
Other Measures
In addition to the measures mentioned, a number of other reforms were
also introduced in India. They are: (i) code of take overs / acquisitions and
mergers, (ii) stock buy back facility for companies, (iii) opening up of the mutual
fund industry to private sector, (iv) stock lending, and (v) disclosure and investor
protection guidelines
India and the World Stock Market
Indian capital market is the second largest in the world after the United
States. There are 35 countries which are emerging capital markets and India is
the largest in terms of number of listed companies. In terms of number of
transactions, India's leading stock exchanges NSE and BSE stood fifth and
seventh position respectively among the stock exchanges in the world in 1999.
An estimated 19 million individual investors were in India at the end of 1998-99
(Pratip et al, 2000)12. The Table 5.11 reveals India's corporate position in the
world's stock markets.
Table 5.11
Stock market development-international comparison: December '04
Particulars USA UK JapanGerman
ySingapore
Hong Kong
China India
No. of listed companies
5231 2486 3220 660 489 1086 1384 4730
Market capitalization ($ bn)
16324
2816 3678 1195 172 861 640 388
Market capitalization ratio (%)
148.2167.
684.3 57.3 190.1
488.8
45.2 68.0
200
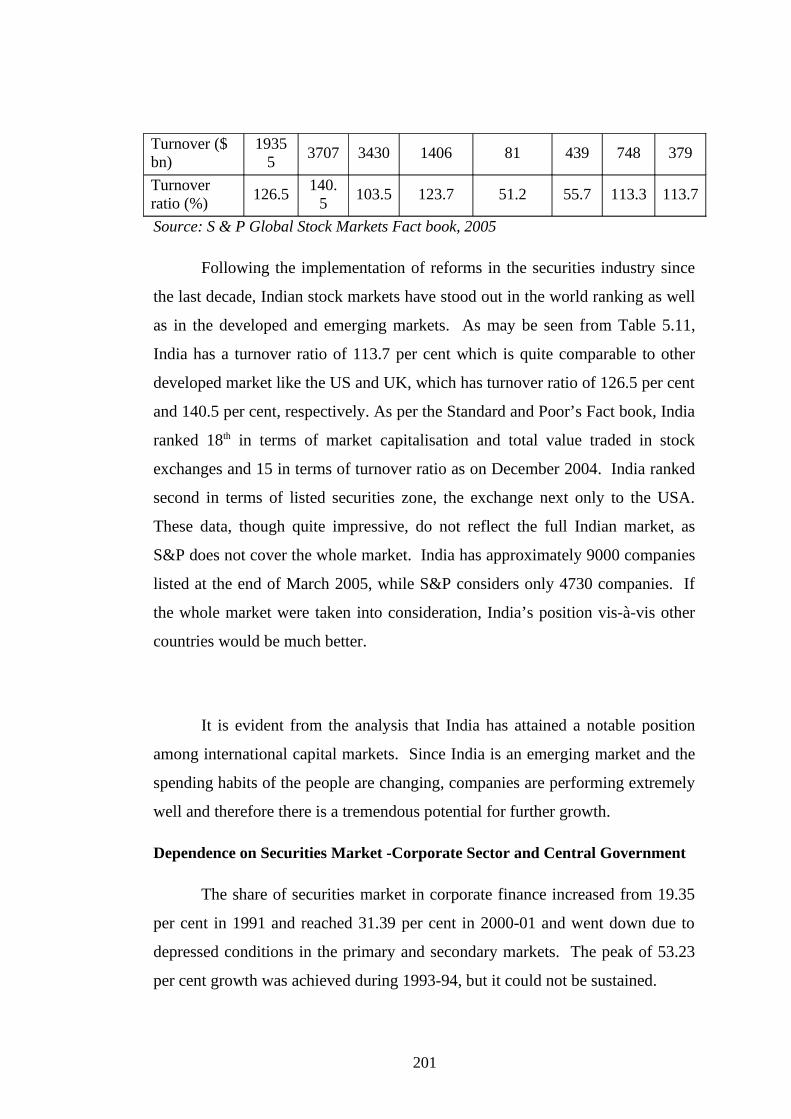
Turnover ($ bn)
19355
3707 3430 1406 81 439 748 379
Turnover ratio (%)
126.5140.
5103.5 123.7 51.2 55.7 113.3 113.7
Source: S & P Global Stock Markets Fact book, 2005
Following the implementation of reforms in the securities industry since
the last decade, Indian stock markets have stood out in the world ranking as well
as in the developed and emerging markets. As may be seen from Table 5.11,
India has a turnover ratio of 113.7 per cent which is quite comparable to other
developed market like the US and UK, which has turnover ratio of 126.5 per cent
and 140.5 per cent, respectively. As per the Standard and Poor’s Fact book, India
ranked 18th in terms of market capitalisation and total value traded in stock
exchanges and 15 in terms of turnover ratio as on December 2004. India ranked
second in terms of listed securities zone, the exchange next only to the USA.
These data, though quite impressive, do not reflect the full Indian market, as
S&P does not cover the whole market. India has approximately 9000 companies
listed at the end of March 2005, while S&P considers only 4730 companies. If
the whole market were taken into consideration, India’s position vis-à-vis other
countries would be much better.
It is evident from the analysis that India has attained a notable position
among international capital markets. Since India is an emerging market and the
spending habits of the people are changing, companies are performing extremely
well and therefore there is a tremendous potential for further growth.
Dependence on Securities Market -Corporate Sector and Central Government
The share of securities market in corporate finance increased from 19.35
per cent in 1991 and reached 31.39 per cent in 2000-01 and went down due to
depressed conditions in the primary and secondary markets. The peak of 53.23
per cent growth was achieved during 1993-94, but it could not be sustained.
201

Due to increase in the fiscal deficits of the Central Government, their
dependence on market borrowings to finance fiscal deficits has increased from
17.9 per cent in 1990-91 to 69.4 per cent in 2001-02 (refer Indian Securities
Market, A Review (ISMR) 2005).
202
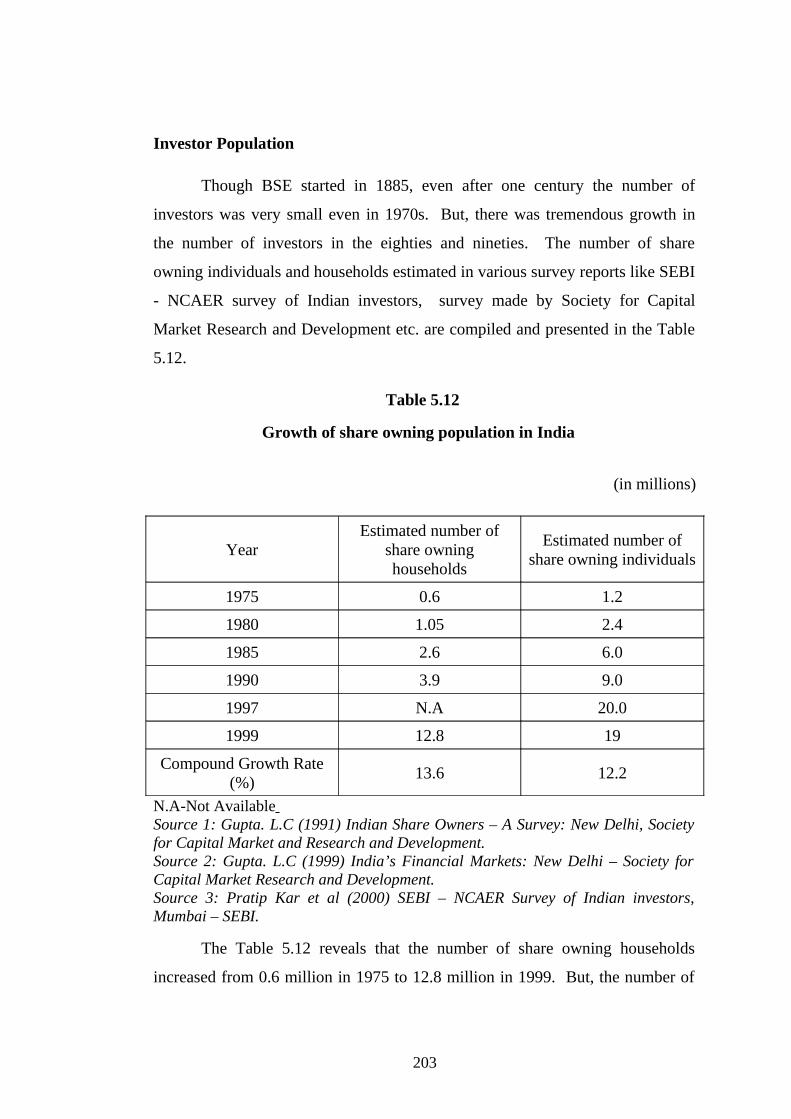
Investor Population
Though BSE started in 1885, even after one century the number of
investors was very small even in 1970s. But, there was tremendous growth in
the number of investors in the eighties and nineties. The number of share
owning individuals and households estimated in various survey reports like SEBI
- NCAER survey of Indian investors, survey made by Society for Capital
Market Research and Development etc. are compiled and presented in the Table
5.12.
Table 5.12
Growth of share owning population in India
(in millions)
YearEstimated number of
share owning households
Estimated number of share owning individuals
1975 0.6 1.2
1980 1.05 2.4
1985 2.6 6.0
1990 3.9 9.0
1997 N.A 20.0
1999 12.8 19
Compound Growth Rate (%)
13.6 12.2
N.A-Not Available Source 1: Gupta. L.C (1991) Indian Share Owners – A Survey: New Delhi, Society for Capital Market and Research and Development.Source 2: Gupta. L.C (1999) India’s Financial Markets: New Delhi – Society for Capital Market Research and Development.Source 3: Pratip Kar et al (2000) SEBI – NCAER Survey of Indian investors, Mumbai – SEBI.
The Table 5.12 reveals that the number of share owning households
increased from 0.6 million in 1975 to 12.8 million in 1999. But, the number of
203

share owning individuals increased from 1.2 million in 1975 to 20 million in
1997. The number of investors declined to 19 million in 1999. The investor
households have increased at a compound growth rate of 13.6 per cent during the
period 1975–99, whereas the corresponding growth in share owning individuals
increased to 12.2 per cent during the same period.
Geographical Distribution of Investors
It is not necessary that the investor population in a country may be
uniformly spread throughout the country. The same is the case with India also.
They may be concentrated in certain geographical areas. Study of geographical
distribution of investors among various places in the country provides a factual
description of its distribution and analyses the trend of changes in this regard.
An earlier study made in India reveals that geographical distribution of investors
is not evenly spread in the country (Gupta et al, 1994)13. About 55.3 per cent of
individual share owners in India belong to five cities. The top ten cities ranked
by their percentage share of total account for nearly two thirds (65.3 per cent) of
India's total number of share holders. The distribution of share ownership by
States and Union Territories showed that just five states accounted for 74.7 per
cent of the countries share ownership population and 71.7 per cent of the
aggregate value of the share holdings of individuals in India. Among the five
states, Maharashtra tops the list with Gujarat, as a distant second followed by
West Bengal, Delhi and Tamilnadu14.
Stock Market Efficiency - Reduction in Transaction Cost
Efficiency of the stock market is measured by its transaction costs.
Bencivenga, Smith and Starr (1996)15 investigated transaction costs in secondary
capital market that represents genuine resource loss and they have examined the
consequences for determining saving, investment, the composition of the capital
stock and asset pricing. Transaction costs involve real resource losses, but
reduction in transaction costs raise steady-state welfare. Liberalisation and
204

globalisation initiatives have drastically reduced transaction cost in Indian capital
market. India's stock market transaction cost now, is on par with international
standards. This is evident from Table 5.13.
Table 5.13
Reduction in transaction cost in India (1994 and 1999)
Transaction cost 1994 1999 Global Best
Trading %
Fees 2.5 0.25 0.25
Impact Cost 0.75 0.25 0.20
Clearing Counter Party Risk
Present Nil Nil
Settlement $%
Paper work0.75 0.10 0
Bad Delivery 0.50 0 0
Stamp Duty 0.25 0 0
Total (%) > 4.75 0.60 0.45
Source: National Stock Exchange
From the Table 5.13 it is clear that transaction costs such as trading fees,
bad delivery, counter-party risk and stamp duty are all on par with rest of the
world. But in the case of impact cost, India lacks the global best parameters.
The impact cost can be found out by the buyers’ quotations and sellers’
quotations. If it is narrow down, we can say that efficiency increases. When
total transaction costs are taken it is evident that, in 1994 it was 4.75 per cent and
it reduced to 0.60 per cent in 1999. This reduction in transaction cost is purely
the globalisation effect and this was possible because of the technological
revolution in Indian stock market. Market efficiency has improved because of
drastic reduction in transaction cost. The Figure 5.2 exhibits the reduction in
transaction cost.
205

Figure 5.2
REDUCTION IN TRANSACTION COST IN INDIA (1994 and 1999)
00.5
11.5
22.5
33.5
44.5
5
Fees
Impa
ct Cos
t
Paper
Wor
k
Bad D
elive
ry
Stam
p Dut
y
Total
Va
lue
Pe
rce
nta
ge
1994
1999
Conclusion
India has witnessed a veritable explosion of capital market growth. The
1990s witnessed a big leap in the quantity as well as the efficiency of resource
mobilisation. The capital market reforms, a part of the Structural Adjustment
Programme of 1991, substantially improved the overall efficiency of the Indian
capital market. The reduction in transaction cost and market capitalisation ratio
reaching more than 100 per cent is worth mentioning. The globalisation has
welcomed the foreign institutional investors (at present more than 1044 FIIs are
registered with SEBI). In terms of number of companies listed, number of
intermediaries and the products available are immense. Indian stock market is
also getting matured and it can be compared with other developed stock markets
in the world in terms of the accepted parameters.
206

References:
1. Raymond Atje and Jovanovic B. (1993): “Stock Market and
Economic Growth” European Economic Review, Vol. 37, pp. 632-640.
2. Misra B.M (1997): Fifty Years Of Indian Capital Market 1947-
1997, Mumbai, Reserve Bank of India, Occasional Papers, Vol. 18, No. 2
& 3.
3. Ajay Shah and Susan Thomas (1997): Securities Markets towards
Greater Efficiency in Parekh Kirit. S. (Ed.) p. 186
4. Bhole L.M (1999): Financial Institutions And Markets, Structure,
Growth and Innovations, Tata-McGraw-Hill Publishing Company
Limited, New Delhi, p. 439.
5. Machiraju H.R (1998): Indian Financial System, Vikas Publishing
House Private Limited, New Delhi, p. 111.
6. Ramasastri A.S (2000): “Market Efficiency in The Nineties:
Testing Through Unit Roots”, Prajan, Vol. XXXVIII, No. 2, p. 155
7. Balakrishnan and Nartha S.S (1997): Security markets in India,
Kanishka Publishers and Distributors, New Delhi, p. 273
8. The Stock Exchange Official Directory, Mumbai (1878): The
Stock Exchange Foundation vol. 29, (1), p. 6
9. Ibid p. 6
10. Investor's Year Book 2000-01, The Economic Times Knowledge
Services, Mumbai, p. 24
11. Ibid p.5
207

12. Pratip Kar et al (2000): Survey of Indian Investors, Mumbai:
Securities and Exchange Board of India, p 23.
13. Gupta L.C et al (1994): Share Owners Geographical Distribution:
City wise, Urban wise, Rural wise and State wise, Society for Capital
Market Research and Development , New Delhi, p. 28
14. Ibid p. 71.
15. Bencivenga, Valeri R, Bruce D. Smith, Ross M. Starr (1996): “Equity
Markets, Transaction Cost, and Capital Accumulation: An Illustration”,
The World Bank Economic Review, Vol.10, No.2,pp.241-265.
208