Embed Size (px)
Citation preview

Indiabulls Real Estate Limited
Unaudited Financial Results – Q2 FY 2016-17
24th October, 2016
2
Safe Harbour Statement
This document contains certain forward‐looking statements based on current expectations of Indiabulls Real Estate Ltd.'s (CIN: L45101DL2006PLC148314) management. Actual results may vary significantly from the forward‐looking statements in this document due to various risks and uncertainties. These risks and uncertainties include the effect of economic and political conditions in India, and outside India, volatility in interest rates and in securities markets, new regulations and government policies that might impact the business of Indiabulls Real Estate Ltd., the general state of the Indian economy and the management’s ability to implement the company’s strategy. Indiabulls Real Estate Ltd. doesn’t undertake any obligation to update these forward‐looking statements.
This document does not constitute an offer or recommendation to buy or sell any securities of Indiabulls Real Estate Ltd. or any of its subsidiaries or associate companies. This document also doesn’t constitute an offer or recommendation to buy or sell any financial products offered by Indiabulls Real Estate Ltd.
Investor Contact :
+91 22 6189 1481
3
Contents
Pg. No.
1. Overview 4
2. Business Segment Performance 8
3. Operations Snapshot 13
4. Corporate Social Responsibility 17
5. Detailed Financials 19
6. Balance Sheet 27
4
Overview

5
• All separately listed companies (no Group Holding Company)
• No equity cross-holdings
Financial Year 2015-16 Indiabulls Group
Total Indiabulls
Housing Finance Indiabulls
Real Estate Indiabulls Ventures
Total Revenue (₹ Cr) 12,422 9,226 2,786 410
EBITDA (₹ Cr) 9,228 8,120 860 248
PBT (₹ Cr) 3,698 3,121 500 77
PAT (₹ Cr) 2,757 2,345 339 73
Indiabulls Group Financials
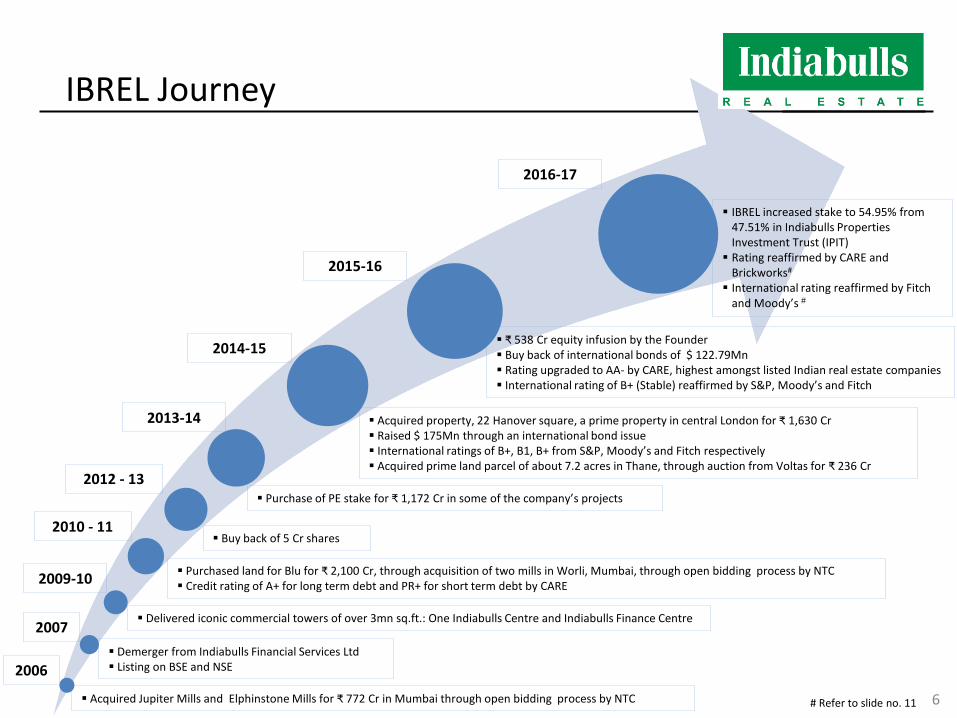
IBREL Journey
2007
Acquired Jupiter Mills and Elphinstone Mills for ₹ 772 Cr in Mumbai through open bidding process by NTC
Demerger from Indiabulls Financial Services Ltd Listing on BSE and NSE
2010 - 11
Purchased land for Blu for ₹ 2,100 Cr, through acquisition of two mills in Worli, Mumbai, through open bidding process by NTC Credit rating of A+ for long term debt and PR+ for short term debt by CARE
2013-14
Purchase of PE stake for ₹ 1,172 Cr in some of the company’s projects
2006
2009-10
Delivered iconic commercial towers of over 3mn sq.ft.: One Indiabulls Centre and Indiabulls Finance Centre
2012 - 13
Buy back of 5 Cr shares
Acquired property, 22 Hanover square, a prime property in central London for ₹ 1,630 Cr Raised $ 175Mn through an international bond issue International ratings of B+, B1, B+ from S&P, Moody’s and Fitch respectively Acquired prime land parcel of about 7.2 acres in Thane, through auction from Voltas for ₹ 236 Cr
2014-15
2015-16
₹ 538 Cr equity infusion by the Founder Buy back of international bonds of $ 122.79Mn Rating upgraded to AA- by CARE, highest amongst listed Indian real estate companies International rating of B+ (Stable) reaffirmed by S&P, Moody’s and Fitch
2016-17
IBREL increased stake to 54.95% from 47.51% in Indiabulls Properties Investment Trust (IPIT) Rating reaffirmed by CARE and
Brickworks# International rating reaffirmed by Fitch
and Moody’s #
# Refer to slide no. 11 6

IBREL – Assets Overview
Property Leasable Area (Mn. sq. ft.)
% Leased FY16 Annuity Revenue
(₹ Cr)
Indiabulls Finance Centre and One Indiabulls Centre
3.3 89% 487
Project Status
Total Saleable
Area (Mn. sq.
ft.)
% Area Sold
Gross Development Value (₹ Cr) Pending Construction
Cost (₹ Cr)
Net Surplus (₹ Cr)
Total Sold
Inventory Unsold
Inventory
Ongoing Projects
35.8 51.2% 33,764 15,400 18,364 7,244 17,663
Planned Projects
8.8 - 12,997 - 12,997 3,894 9,103
Total 44.6 41.1% 46,761 15,400 31,361 11,138 26,766
Rental Business
Development Business
Total annualized annuity revenue based on current leasing agreements starting from 1st April, 2017 is ₹ 595 Cr
7

Business Segment Performance

9
IBREL Consolidated Q2 FY 16-17 Q2 FY 15-16 Growth
Total Revenues (₹ Cr) 911.9 790.6 15%
EBITDA (₹ Cr) 375.7 245.9 53%
PBT (₹ Cr) 212.7 101.7 109%
PAT before minority interest (₹ Cr) 134.7 75.8 78%
PAT after minority interest (₹ Cr) 141.6 70.6 100%
EPS (₹) 3.06 1.72
Key Financial Highlights: Q2 FY 16-17
Financial Performance

10
Net Worth (₹ Cr) 1,589
Gross Debt (₹ Cr) 3,373
Net Debt (₹ Cr) 2,824
Annuity Revenue H1FY17 (₹ Cr) 260
Annualized Annuity Revenue (₹ Cr) 520
Rental and Development Properties: H1 FY17 update
Investment Properties (Rental Properties - IPIT)
Development Properties
Net Worth (₹ Cr) 3,307
Gross Debt (₹ Cr) 5,560
Net Debt (₹ Cr) 4,625
PAT H1FY17* (₹ Cr) 295
Annualized RoE* 17.9%
* Development Properties ROE is calculated after deducting PAT of IPIT

11
Operating Performance for the Quarter
• New sales of ₹ 755 Cr during the quarter
• New Leasing of approximately 0.5 lac sq. ft. during the quarter
• International rating of reaffirmed by Fitch and Moody’s
• Rating reaffirmed AA- for long term debt and A1+ for short term debt by CARE and
Brickworks
Rating Agency Long Term Rating Short Term Rating
Fitch B+
Moody’s B1
CARE Ratings AA- A1+
Brickwork Ratings AA- A1+
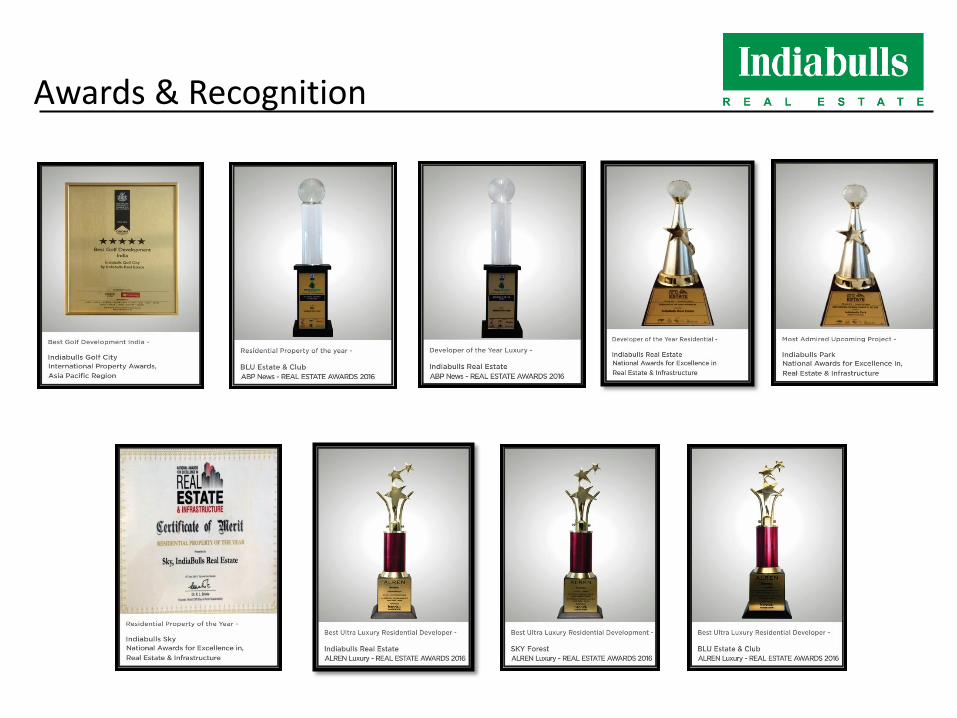
Awards & Recognition

13
Operations Snapshot

Leased Assets Quarterly Performance
14
Property Q2 FY17 Annuity
Revenue (₹ Cr)
Leasable Area (Mn. sq. ft.)
% Leased
Indiabulls Finance Centre and One Indiabulls Centre (Mumbai)
Office 126.9 3.3 89%
Total annualized annuity revenue based on current leasing agreements starting from 1st April, 2017 is ₹ 595 Cr
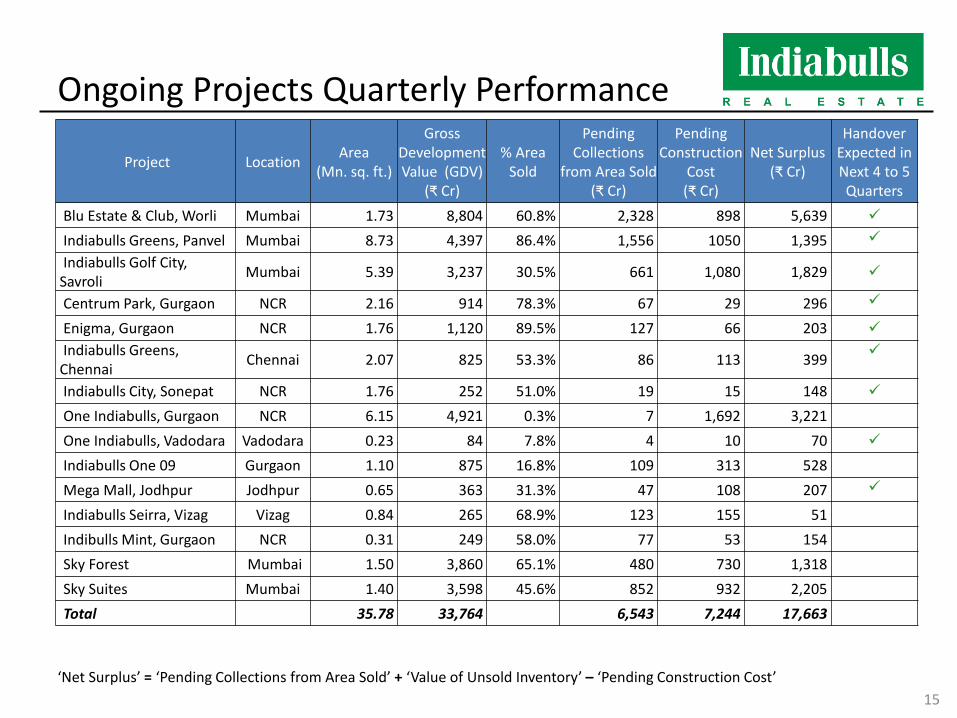
Ongoing Projects Quarterly Performance
15
Project Location Area
(Mn. sq. ft.)
Gross Development Value (GDV)
(₹ Cr)
% Area Sold
Pending Collections
from Area Sold (₹ Cr)
Pending Construction
Cost (₹ Cr)
Net Surplus (₹ Cr)
Handover Expected in Next 4 to 5 Quarters
Blu Estate & Club, Worli Mumbai 1.73 8,804 60.8% 2,328 898 5,639
Indiabulls Greens, Panvel Mumbai 8.73 4,397 86.4% 1,556 1050 1,395
Indiabulls Golf City, Savroli
Mumbai 5.39 3,237 30.5% 661 1,080 1,829
Centrum Park, Gurgaon NCR 2.16 914 78.3% 67 29 296
Enigma, Gurgaon NCR 1.76 1,120 89.5% 127 66 203
Indiabulls Greens, Chennai
Chennai 2.07 825 53.3% 86 113 399
Indiabulls City, Sonepat NCR 1.76 252 51.0% 19 15 148
One Indiabulls, Gurgaon NCR 6.15 4,921 0.3% 7 1,692 3,221
One Indiabulls, Vadodara Vadodara 0.23 84 7.8% 4 10 70
Indiabulls One 09 Gurgaon 1.10 875 16.8% 109 313 528
Mega Mall, Jodhpur Jodhpur 0.65 363 31.3% 47 108 207
Indiabulls Seirra, Vizag Vizag 0.84 265 68.9% 123 155 51
Indibulls Mint, Gurgaon NCR 0.31 249 58.0% 77 53 154
Sky Forest Mumbai 1.50 3,860 65.1% 480 730 1,318
Sky Suites Mumbai 1.40 3,598 45.6% 852 932 2,205
Total 35.78 33,764 6,543 7,244 17,663
‘Net Surplus’ = ‘Pending Collections from Area Sold’ + ‘Value of Unsold Inventory’ – ‘Pending Construction Cost’

Planned projects & Other Fully Paid Land Assets
16
Land Bank Acres
Gurgaon 520
Mumbai Metropolitan Region 312
Chennai 178
A. Land bank for future development:
B. Nashik SEZ
Indiabulls SEZ, spread over 2,588 acres in Nashik, Maharashtra
Project Location Area
(Mn. sq. ft.)
Gross Development Value (GDV)
(₹ Cr)
Pending Construction
Cost (₹ Cr)
Net Surplus (₹ Cr)
Indiabulls Imperial, Gurgaon (Sec 106) NCR 6.98 5,433 1,843 3,590
Silverlake Villas, Alibaug Mumbai 0.26 164 61 103
One Indiabulls Thane Mumbai 1.40 1,680 490 1,190
22 Hanover Square London 0.11 5,720 1,500 4,220
Total 8.75 12,997 3,894 9,103
Land Bank
Planned Projects

Corporate Social Responsibility
17

Paushtik Aahar: - Free nutrition supplements to the underprivileged and malnourished - 5,000 individuals per month - Over 85,000 children to date
Green soles: - Footwear distribution
Kumud: - Sanitary napkin distribution - Hygiene for underprivileged rural
women
Jan Swastha Kalyan Vahika (mobile medical vans): - Free check-up - 13 mobile medical vans - More than 4,50,000 patients
Free Medical Clinic: - 4 free medical clinics - More than 90,000 treated
Cleft / Palate deformation surgery: - 1,500 children across 6 states
Health
Sanitation
Nutrition
Disaster Relief
Rural Empowerment
Renewable Energy
Education
Indiabulls Foundation: Corporate Social Responsibility
Rainwater harvesting: - At schools during the Latur drought
- Benefitted over 350 students
Nutritional Packets Distribution:
- Nepal earthquake : 10,000 packets - Chennai floods : 5kg packets to 1,500
families - Kashmir floods : 10,000 packets
Rahat: - Water project at 3 tribal ashram schools
- Over 2,500 children will benefit every year
Scholarship: - To over 500 meritorious students
Computer Literacy Program:
- 1,000 computers to tribal ashram schools, shelter homes and night schools
Tie-up with ESHA foundation:
- Create awareness about online library of ESHA, helped 35,000 visually challenged
Renewable Energy Plants:
- Free of cost round-the-clock seamless electricity to 5 tribal ashram schools

19
Detailed Financials

Balance Sheet Abstract - Consolidated
20
Particulars H1 FY17 FY16
Non-Current Assets 3,804.92 4,140.03
Current Assets 15,069.79 14,211.53
Total Assets 18,874.71 18,351.56
Shareholders' Funds 4,895.92 4,838.38
Non-Current Liabilities 7,723.60 7,595.06
Current Liabilities 6,255.19 5,918.12
Total Equity and Liabilities 18,874.71 18,351.56
Amount in ₹ Cr

Cash Flow – Abstract (Consolidated)
21
Amount in ₹ Cr
Particulars H1FY17 H1FY16
Opening Cash and Cash Equivalents (incl. short-term Liquid Investments)
1,584.11 1,163.06
Operating Cash Flows 165.00 554.59
Investing Cash Flows 109.19 64.04
Financing Cash Flows (373.70) (985.35)
Closing Cash and Cash Equivalents (incl. short-term Liquid Investments)
1,484.60 796.34
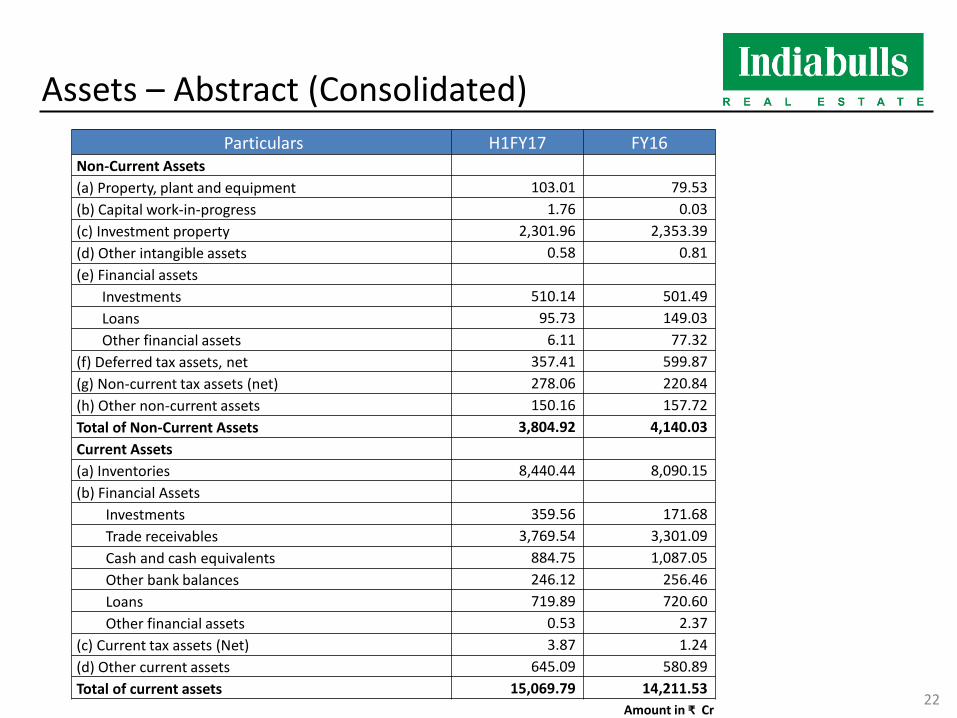
Assets – Abstract (Consolidated)
Amount in ₹ Cr 22
Particulars H1FY17 FY16 Non-Current Assets
(a) Property, plant and equipment 103.01 79.53
(b) Capital work-in-progress 1.76 0.03
(c) Investment property 2,301.96 2,353.39
(d) Other intangible assets 0.58 0.81
(e) Financial assets
Investments 510.14 501.49
Loans 95.73 149.03
Other financial assets 6.11 77.32
(f) Deferred tax assets, net 357.41 599.87
(g) Non-current tax assets (net) 278.06 220.84
(h) Other non-current assets 150.16 157.72
Total of Non-Current Assets 3,804.92 4,140.03
Current Assets
(a) Inventories 8,440.44 8,090.15
(b) Financial Assets
Investments 359.56 171.68
Trade receivables 3,769.54 3,301.09
Cash and cash equivalents 884.75 1,087.05
Other bank balances 246.12 256.46
Loans 719.89 720.60
Other financial assets 0.53 2.37
(c) Current tax assets (Net) 3.87 1.24
(d) Other current assets 645.09 580.89
Total of current assets 15,069.79 14,211.53

Liabilities – Abstract (Consolidated)
23
Amount in ₹ Cr
Particulars H1FY17 FY16
Non-Current Liabilities
(a) Financial liabilities
Borrowings 7,009.06 6,987.01
Trade payables 321.44 1.24
Other financial liabilities 150.65 156.31
(b) Provisions 7.14 5.75
(c) Deferred tax liabilities (net) 0.53 217.12
(d) Other non-current liabilities 234.78 227.63
Total of Non-Current Liabilities 7,723.60 7,595.06
Current Liabilities
(a) Financial liabilities
Borrowings 157.60 733.00
Trade payables 257.60 279.04
Other financial liabilities 2,508.25 1,961.28
(b) Other current liabilities 3,128.13 2,815.48
(c) Provisions 1.24 1.15
(d) Current tax liabilities (net) 202.37 128.17
Total of current liabilities 6,255.19 5,918.12

Profit & Loss Account – Abstract (Consolidated)
24
Amount in ₹ Cr
Particulars Q2FY17 Q2FY16 H1FY17 H1FY16
Revenue from Operations 708.70 715.63 1,469.84 1,528.17
Other Operating Revenues 1.90 6.86 113.21 10.73
Operating Revenues 710.60 722.49 1,583.05 1,538.90
Non Operating Income 201.31 68.09 223.19 86.94
Total Revenues 911.91 790.58 1,806.24 1,625.84
EBITDA (Excluding Non Operating Income)
174.43 177.80 474.07 454.74
Profit Before Tax 212.70 101.68 376.74 243.58
Profit After Tax 134.66 75.78 252.85 175.21
Diluted EPS (₹) 3.01 1.72 5.54 4.05

Key Financial Parameters
25
Particulars Q2 FY17 Q2 FY16 H1 FY17 H1 FY16
EBITDA Margin (Including Non Operating Income/ Total Revenue)
41.20% 31.10% 38.60% 33.32%
EBITDA Margin (Excluding Non Operating Income/ Total Operating Income)
24.55% 24.61% 29.95% 29.55%
Profit After Tax Margin 14.77% 9.59% 14.00% 10.78%

Shareholding Pattern
26
Category 30-Sep-16 30-Jun-16
Founder Holding 39.12% 39.19%
Treasury Stock 8.39% 8.40%
Institutional Investors 21.30% 21.00%
Other Public Shareholders 31.19% 31.41%

27
Balance Sheet

Consolidated Balance Sheet
28
Note: IBREL adopted Indian Accounting Standards (“Ind AS”) from April 1, 2016 as required by the Companies Act 2013 and financials have been prepared in accordance with the recognition and measurement principles laid down in Ind AS. The date of transition is April 1, 2015. The impact of transition has been accounted for in opening reserves and the comparative period results has been restated accordingly.
Statement of Assets and Liabilties (Consolidated) Amount in Rs. Crore
As at September
30, 2016
Unaudited
As at March 31,
2016
Unaudited
ASSETS
Non-current assets
(a) Property, plant and equipment 103.01 79.53
(b) Capital work-in-progress 1.76 0.03
(c) Investment property 2,301.96 2,353.39
(d) Other intangibe assets 0.58 0.81
(e) Financial Assets
Investments 510.14 501.49
Loans 95.73 149.03
Other financial assets 6.11 77.32
(f) Deferred tax assets 357.41 599.87
(g) Non-current Tax Assets 278.06 220.84
(h) Other non-current assets 150.16 157.72
Total of Non-current assets 3,804.92 4,140.03
Current assets
(a) Inventories 8,440.44 8,090.15
(b) Financial Assets
Investments 359.56 171.68
Trade receivables 3,769.54 3,301.09
Cash and cash equivalents 884.75 1,087.05
Other bank balances 246.12 256.46
Loans 719.89 720.60
Other financial assets 0.53 2.37
(c) Current Tax Assets (Net) 3.87 1.24
(d) Other current assets 645.09 580.89
Total of current assets 15,069.79 14,211.53
Total of Assets 18,874.71 18,351.56
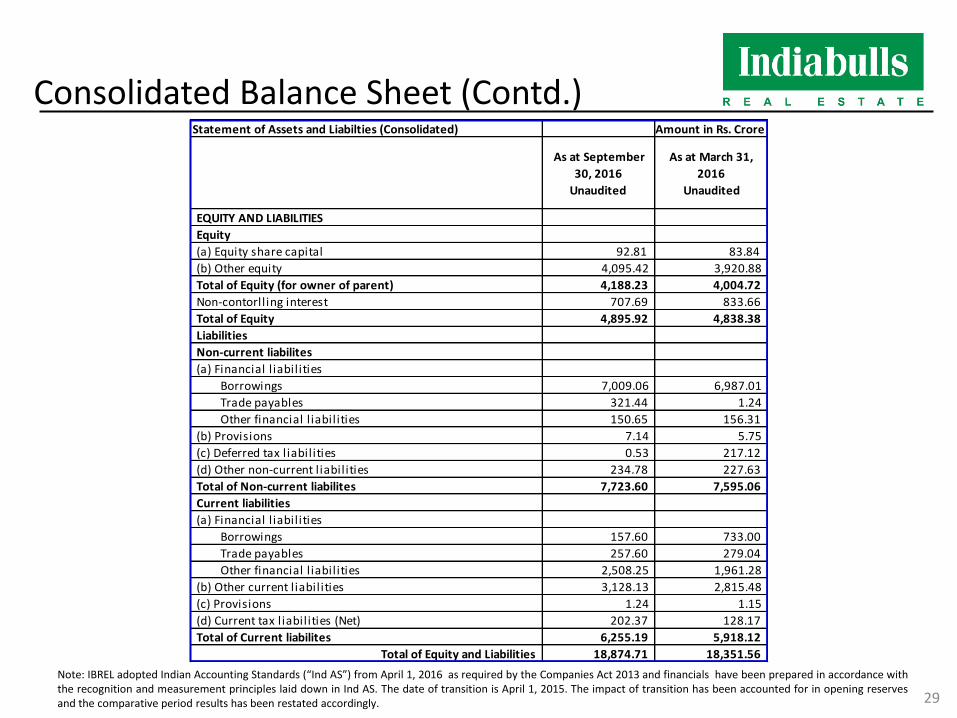
Consolidated Balance Sheet (Contd.)
29
Note: IBREL adopted Indian Accounting Standards (“Ind AS”) from April 1, 2016 as required by the Companies Act 2013 and financials have been prepared in accordance with the recognition and measurement principles laid down in Ind AS. The date of transition is April 1, 2015. The impact of transition has been accounted for in opening reserves and the comparative period results has been restated accordingly.
Statement of Assets and Liabilties (Consolidated) Amount in Rs. Crore
As at September
30, 2016
Unaudited
As at March 31,
2016
Unaudited
EQUITY AND LIABILITIES
Equity
(a) Equity share capital 92.81 83.84
(b) Other equity 4,095.42 3,920.88
Total of Equity (for owner of parent) 4,188.23 4,004.72
Non-contorll ing interest 707.69 833.66
Total of Equity 4,895.92 4,838.38
Liabilities
Non-current liabilites
(a) Financial l iabilities
Borrowings 7,009.06 6,987.01
Trade payables 321.44 1.24
Other financial l iabilities 150.65 156.31
(b) Provisions 7.14 5.75
(c) Deferred tax liabilities 0.53 217.12
(d) Other non-current l iabilities 234.78 227.63
Total of Non-current liabilites 7,723.60 7,595.06
Current liabilities
(a) Financial l iabilities
Borrowings 157.60 733.00
Trade payables 257.60 279.04
Other financial l iabilities 2,508.25 1,961.28
(b) Other current l iabilities 3,128.13 2,815.48
(c) Provisions 1.24 1.15
(d) Current tax l iabilities (Net) 202.37 128.17
Total of Current liabilites 6,255.19 5,918.12
Total of Equity and Liabilities 18,874.71 18,351.56
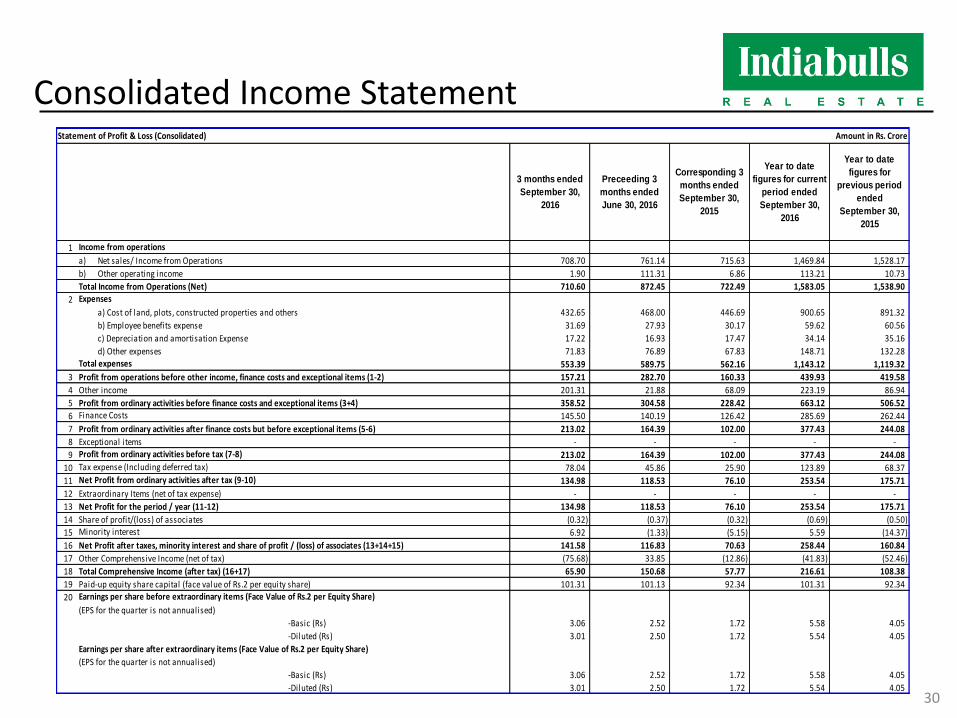
Consolidated Income Statement
30
Statement of Profit & Loss (Consolidated) Amount in Rs. Crore
1
a) Net sales/ Income from Operations 708.70 761.14 715.63 1,469.84 1,528.17
b) Other operating income 1.90 111.31 6.86 113.21 10.73
Total Income from Operations (Net) 710.60 872.45 722.49 1,583.05 1,538.90
2
a) Cost of land, plots, constructed properties and others 432.65 468.00 446.69 900.65 891.32
b) Employee benefits expense 31.69 27.93 30.17 59.62 60.56
c) Depreciation and amortisation Expense 17.22 16.93 17.47 34.14 35.16
d) Other expenses 71.83 76.89 67.83 148.71 132.28
553.39 589.75 562.16 1,143.12 1,119.32
3 Profit from operations before other income, finance costs and exceptional items (1-2) 157.21 282.70 160.33 439.93 419.58
4 Other income 201.31 21.88 68.09 223.19 86.94
5 Profit from ordinary activities before finance costs and exceptional items (3+4) 358.52 304.58 228.42 663.12 506.52
6 145.50 140.19 126.42 285.69 262.44
7 Profit from ordinary activities after finance costs but before exceptional items (5-6) 213.02 164.39 102.00 377.43 244.08
8 Exceptional items - - - - -
9 213.02 164.39 102.00 377.43 244.08
10 78.04 45.86 25.90 123.89 68.37
11 134.98 118.53 76.10 253.54 175.71
12 Extraordinary Items (net of tax expense) - - - - -
13 Net Profit for the period / year (11-12) 134.98 118.53 76.10 253.54 175.71
14 (0.32) (0.37) (0.32) (0.69) (0.50)
15 6.92 (1.33) (5.15) 5.59 (14.37)
16 Net Profit after taxes, minority interest and share of profit / (loss) of associates (13+14+15) 141.58 116.83 70.63 258.44 160.84
17 Other Comprehensive Income (net of tax) (75.68) 33.85 (12.86) (41.83) (52.46)
18 Total Comprehensive Income (after tax) (16+17) 65.90 150.68 57.77 216.61 108.38
19 101.31 101.13 92.34 101.31 92.34
20
(EPS for the quarter is not annualised)
-Basic (Rs) 3.06 2.52 1.72 5.58 4.05
-Diluted (Rs) 3.01 2.50 1.72 5.54 4.05
Earnings per share after extraordinary items (Face Value of Rs.2 per Equity Share)
(EPS for the quarter is not annualised)
-Basic (Rs) 3.06 2.52 1.72 5.58 4.05
-Diluted (Rs) 3.01 2.50 1.72 5.54 4.05
3 months ended
September 30,
2016
Year to date
figures for
previous period
ended
September 30,
2015
Tax expense (Including deferred tax)
Income from operations
Expenses
Total expenses
Finance Costs
Profit from ordinary activities before tax (7-8)
Preceeding 3
months ended
June 30, 2016
Corresponding 3
months ended
September 30,
2015
Year to date
figures for current
period ended
September 30,
2016
Earnings per share before extraordinary items (Face Value of Rs.2 per Equity Share)
Net Profit from ordinary activities after tax (9-10)
Share of profit/(loss) of associatesMinority interest
Paid-up equity share capital (face value of Rs.2 per equity share)
Thank you
31