Embed Size (px)
Citation preview
FMU Rep. No, III-3-5( APRIL 1972 )
INDIA METEOROLOGICAL DEPARTMENT
FORECASTING MANUAL
PART III
DISCUSSION OF TYPICAL SYNOPTIC WEATHER SITUATIONS
3.5: SOUTHWEST MONSOON - T Y P I C A L SITUATIONS
OVER UTTAR PRADESH AND BIHAR
BY
V. SRINIVASAN, S. RAMAN AND S. MUKHERJI
ISSUED BY
THE DEPUTY DIRECTOR GENERAL OF OBSERVATORIES
(FORECASTING)POONA-5

FMU Rep. No. III-3.5(May 1972)
FORECASTING MANUAL
Part III - Discussion of Typical Synoptic Weather Situations
3.5 Southwest Monsoon - Typical Situations over Uttar Pradesh and Bihar State
by
V. Srinivasan, S. Raman and S. Mukherji

Contents:
1. Introduction
2. General Features of Weather over Uttar Pradesh and Bihar during the South-west Monsoon Season
3. Survey of Synoptic Situations associated with monsoon activity overUttar Pradesh and Bihar
4. Weak Monsoon
5. Depression travelling from head Bay of Bengal to northeast Madhya Pradeshacross Bihar Plateau - 10 to 15 August 1968
6. Deep Depression moving in a northerly direction across West Uttar Pradeshcausing strong to vigorous monsoon in Uttar Pradesh - 11 to 17 September1963
7. Deep Depression recurving over Uttar Pradesh and moving eastwards toBihar Plains - 10 to 17 September, 1970
8. Low Pressure Areas
i) Low Pressure area moving westwards from Bangla Desh to West UttarPradesh - 19 to 24 August 1969
ii) Upper air low moving from Bihar to Rajasthan causing rainfall inBihar and Uttar Pradesh - 1 to 4 August 1970
9. Rainfall associated with the shifts in the position of the monsoon troughover Uttar Pradesh and Bihar -
i) Western end of monsoon trough shifting towards foot-hills while easternend remains over north Bay of Bengal - 23 to 27 July 1966
ii) Monsoon trough shifting north at its eastern end first and at thewestern end later - 15 to 18 August 1969
10.Systems in westerlies causing increase in monsoon activity over Uttar Pra-desh and Bihar -
i) Upper air low moving eastwards across Uttar Pradesh and Bihar causingstrong monsoon - 20 to 24 July, 1968
ii) Influence of a westerly trough in enhancing the monsoon activity overBihar and Uttar Pradesh during 'break' monsoon conditions - 7 to 10 July1967
iii) Trough in westerlies which induced a low over West Uttar Pradesh causingactive monsoon in Uttar Pradesh and Bihar - 23 to 27 August 1967
11.Weak Monsoon - Typical situations
12. Conclusions
APPENDIXREFERENCES AND BIBLIOGRAPHYDIAGRAMS
1. Introduction
This part of the Forecasting Manual is concerned with synoptic situations
over Uttar Pradesh and Bihar during the Southwest Monsoon season. The meteoro-
logical sub-divisions considered in this report are Bihar Plateau, Bihar Plains,
East Uttar Pradesh and West Uttar Pradesh*(Plains). The hills of West Uttar
Pradesh have been considered separately in FMU Report No.III-3.3 on Northwest'
India and will not be included here.
2. General Features of Weather over Uttar Pradesh and Biharduring the Southwest Monsoon Season
2.1 Rainfall
2.1.1 The Southwest Monsoon normally advances into Bihar and the extreme
eastern edistricts of East Uttar Pradesh during the second week of June; the
advance into the rest of Uttar Pradesh takes place about a week later in the
second half of June. It withdraws from West Uttar Pradesh and the western
districts of East Uttar Pradesh in the last week of September and from the rest
of Uttar Pradesh and Bihar during the first week of October.
2.1.2 An examination of the actual dates of onset and withdrawal of monsoon
in Uttar Pradesh and Bihar during the past two decades shows that the monsoon
had set in over Bihar State in some years as early as the 6th of June, or as
late as the 1st of July. However, in 10% of the occasions, the onset was in
the 2nd or 3rd week of June. In most years, the advance took place almost on
the same day over the Bihar Plateau and plains of Bihar. In Uttar Pradesh, the
advance of the monsoon also shows large year-to-year fluctuations. The date of
onset varies from June 5 to July 3 in East Uttar Pradesh and from June 10 to
July 9 in West Uttar Pradesh. In general, the onset occurred more frequently
in the second half of June. As mentioned in para 2.1.1 of Forecasting Manual
Report No. III-3.3, the advance of the monsoon takes place a little earlier (by
about a week) in the hills of West Uttar Pradesh than in the plains.
* Unless otherwise specified the term West Uttar Pradesh will refer to the Plainsof West Uttar Pradesh alone in this report.
2
2.1.3 During the past 20 years, the monsoon withdrew from Uttar Pradesh
sometimes during the second fortnight of September or the first fortnight of
October; the dates were rather widely spread out. It withdrew from Bihar
between the last week of September and the second week of October. Generally,
the withdrawal of the monsoon is a gradual process which is not so well
defined as its onset.
2.1.4 The monthly and seasonal rainfall during the southwest monsoon and
the annual rainfall in the four sub-divisions of Bihar and Uttar Pradesh are
given in Table 1. The monthwise rainfall distribution is also shown in
Figs. 2.1 a,b,c and d.TABLE - 1*
Mean Monthly, Seasonal and Annual Rainfall in Uttar Pradesh and Bihar
Month BiharPlateau
BiharPlains
Uttar PradeshEast
Uttar PradeshWest
Rainfall in cm. June 20 17 10 9
Rainfall as % of season'stotal
Ho. of rainy days189.9
177.5
115.0
114.4
July 36 31 30 29
3217.0
3013.1
3413.0
3411.8
August 35 31 30 29
3116.9
3013.4
3413.3
3411.8
September 22 23 49 17
1910.9
239.1
218.1
216.7
Southwest monsoon season as whole
Rainfall in cm.Rainfall as % of annual totalNo. of rainy days
1138354.7
1028543.1
898839.4
8487
34.7
Annual Rainfall in cm.
No. of rainy days13771.2
12054.0
10147.8
9643.8
from "Memoirs of I.Met.D. Vol.XXXI Part III - Monthly and Annual Normalsof Rainfall and of Rainy Days (1962)".
3
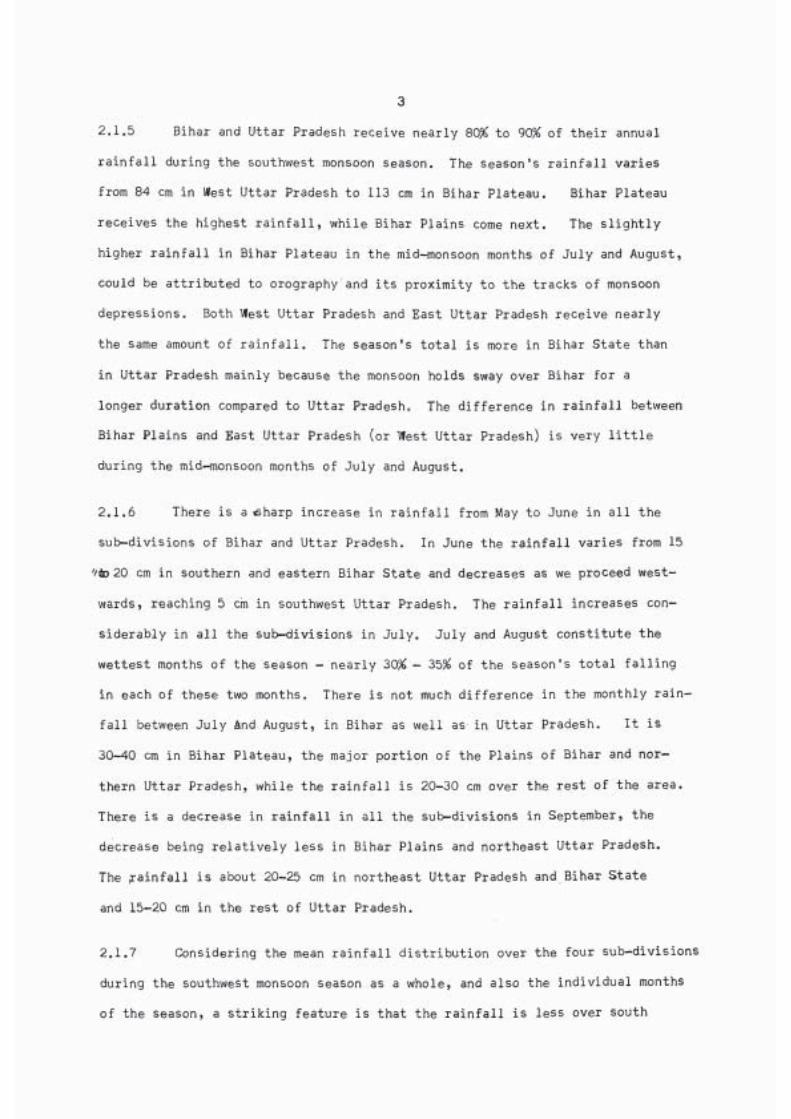
2.1.5 Bihar and Uttar Pradesh receive nearly 80/6 to 90% of their annual
rainfall during the southwest monsoon season. The season's rainfall varies
from 84 cm in West Uttar Pradesh to 113 cm in Bihar Plateau. Bihar Plateau
receives the highest rainfall, while Bihar Plains come next. The slightly
higher rainfall in Bihar Plateau in the mid-monsoon months of July and August,
could be attributed to orography and its proximity to the tracks of monsoon
depressions. Both West Uttar Pradesh and East Uttar Pradesh receive nearly
the same amount of rainfall. The season's total is more in Bihar State than
in Uttar Pradesh mainly because the monsoon holds sway over Bihar for a
longer duration compared to Uttar Pradesh. The difference in rainfall between
Bihar Plains and East Uttar Pradesh (or West Uttar Pradesh) is very little
during the mid-monsoon months of July and August.
2.1.6 There is a sharp increase in rainfall from May to June in all the
sub—divisions of Bihar and Uttar Pradesh. In June the rainfall varies from 15
to 20 cm in southern and eastern Bihar State and decreases as we proceed west-
wards, reaching 5 cm in southwest Uttar Pradesh. The rainfall increases con-
siderably in all the sub—divisions in July. July and August constitute the
wettest months of the season - nearly 30% - 35% of the season's total falling
in each of these two months. There is not much difference in the monthly rain-
fall between July And August, in Bihar as well as in Uttar Pradesh. It is
30-40 cm in Bihar Plateau, the major portion of the Plains of Bihar and nor-
thern Uttar Pradesh, while the rainfall is 20-30 cm over the rest of the area.
There is a decrease in rainfall in all the sub—divisions in September, the
decrease being relatively less in Bihar Plains and northeast Uttar Pradesh.
The rainfall is about 20-25 cm in northeast Uttar Pradesh and Bihar State
and 15-20 cm in the rest of Uttar Pradesh.
2.1.7 Considering the mean rainfall distribution over the four sub-divisions
during the southwest monsoon season as a whole, and also the individual months
of the season, a striking feature is that the rainfall is less over south
4
Uttar Pradesh and central Bihar compared to the region either to the north or
to the south of these areas. When the rainfall distribution is compared with
the mean isobaric pattern for the southwest monsoon season, we observe the
somewhat surprising fact that the region of the seasonal monsoon trough is
also a region of relative minimum in rainfall. It is reasonable to assume
that such a distribution of rainfall is brought about by -
i) the large variations in the daily position of the axis of the monsoon
trough
ii) the tracks of the monsoon depression being well to the south of Uttar
Pradesh with the main rainfall area located in the southern sector,
iii) the excessive rainfall along the southern periphery of the Himalayas
whenever the trough shifts towards the Himalayan foot-hills.
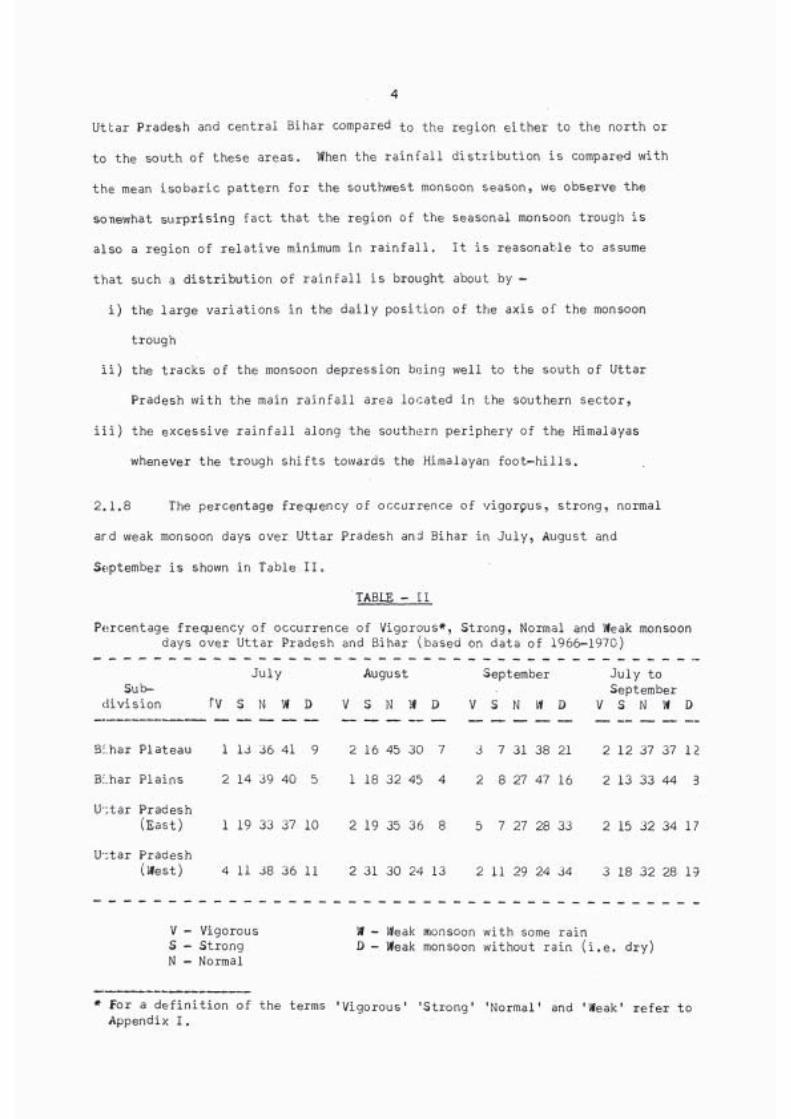
2.1.8 The percentage frequency of occurrence of vigorous, strong, normal
and weak monsoon days over Uttar Pradesh and Bihar in July, August and
September is shown in Table II.
TABLE: - II
Percentage frequency of occurrence of Vigorous*, Strong, Normal and Weak monsoondays over Uttar Pradesh and Bihar (based on data of 1966-1970)
Sub-division
July
V S N W D
August
V S N W D
September
V S N W D
July toSeptember
V S N W D
Bi.har Plateau 1 1J 36 41 9 2 16 45 30 7 3 7 31 38 21 2 12 37 37 12
Bi.har Plains 2 14 39 40 5 1 18 32 45 4 2 8 27 47 16 2 13 33 44 3
U-:tar Pradesh(East) 1 19 33 37 10 2 19 35 36 8 5 7 27 28 33 2 15 32 34 17
U':tar Pradesh(West) 4 11 38 36 11 2 31 30 24 13 2 11 29 24 34 3 18 32 28 19
V -S -N -
VigorousStrongNormal
W - Weak monsoon with some rainD - Weak monsoon without rain (i .e. dry)
* For a definition of the terms 'Vigorous' 'Strong' 'Normal' and 'Weak' refer toAppendix I.

5
The table brings out the following features:-
i) In the mid-monsoon months of July and August, active to vigorous monsoon
conditions prevail in Bihar and Uttar Pradesh on 15% to 20% of the days.
West Uttar Pradesh, however, has a relatively higher percentage (33%) in
August (a similar tendency is noticed over West Uttar Pradesh hills also -
see para 2.1.7 of FMU Rep. No.III-3.3); but the total monthly rainfall is
nearly the same in both the months. There is a sharp decrease in the
activity of the monsoon in Uttar Pradesh as well as in Bihar during
September, when the frequency of active to vigorous monsoon days falls to
about 10%.
ii) The monsoon is weak in all the four sub-divisions on 40% to 50% of the
days. In September, weak monsoon conditions become more frequent (about
60%). Dry days are also considerably more in September than in July or
August in all these sub-divisions.
2.2 Heavy rainfall
2.2.1 Heavy to very heavy rains occur in Uttar Pradesh and Bihar during the
monsoon period; they are very rare outside the monsoon season.
2.2.2 Very heavy rains occur in Bihar and Uttar Pradesh in the months of
July, August and September, the frequency being more in August and September.
It is interesting to note that for the whole of the country, it is only in
these sub-divisions, apart from Punjab and Haryana, that very heavy rains are
just as frequent even towards the end of the monsoon season (September) as
during the height of the monsoon (July or August).
2.2.3 Rainfall amounts even of the order of 30 to 40 cm in 24 hrs have
also occurred in Uttar Pradesh; the amounts being as high as 50 cm in southeast
Uttar Pradesh while amounts of the order of 40 cm to 50 cm have occurred in
Bihar. Very heavy amounts of 25 cm and above are more common in and around
Bihar Plains; the frequency being higher in the north in the sub-montane
districts.

6rainfall in 24 hrs,
2.2.4 Occasions of heaviest that have occurred at some of the obser-
vatory stations in Bihar and Uttar Pradesh are given in India Heather Review
for the quarter October-December 1963.
2.2.5 A feature of the variability of rainfall over the area is that the
co-efficient of variability is only between 20% and
30% Even in this range, the relatively higher co-efficients are over south
Uttar Pradesh and central Bihar, almost coinciding with the area of a minimum
in the mean seasonal rainfall distribution and the mean position of the axis
of the monsoon trough.
2.3 Pressure
2.3.1 The seasonal monsoon trough is a major feature over Uttar Pradesh and
Binar in the climatological charts as well as on individual charts on quite a
large number of days.
2.3.2 A low pressure area develops over Uttar Pradesh, Bihar and northeast
Madhya Pradesh on the sea level chart by April and continues to remain there
in May. But, during the monsoon period the main low shifts to Pakistan and
adjoining West Rajasthan, and a well-marked northwest to southeast oriented
trough runs from the seasonal low over Pakistan towards the head Bay of Bengal,
across south Uttar Pradesh, north Madhya Pradesh and Bihar Plateau (see FMU
Rep. No. I-l). At 0.9 km (i.e. just above the planetary boundary layer), the
axis of the trough passes through Delhi, Allahabad and Asansol. But, there
are large day-to-day variations from the mean position. We shall come to
this aspect later.
2.3.3 The trough is most marked on the mean chart for July. When we con-
sider the mean values of pressure at stations along or near the trough line,
It is found that the pressure values associatéd with the trough axis reach a
minimum of 997-998 mb towards the end of June and beginning of July. The
pressure gradient to the south of the trough axis (as measured by the

7
difference in the surface pressures between Trivandrum and Delhi) also reaches a
maximum of 13.6 mb towards the end of June. End of June and beginning of July
may, therefore, be taken as the epoch when the seasonal trough is most marked.
By September, the monsoon trough becomes less marked, and the gradients to the
south of it also weaken. Towards the end of the monsoon season, as well as
during the withdrawal period, the trough adopts a more northnorthwest to south-
southeast orientation extending from central Uttar Pradesh across northeast
Madhya Pradesh and Orissa to west Central Bay. Even after the withdrawal of
the monsoon, a feeble north-south oriented trough persists over Bihar and its
neighbourhood for sometime during the transition period between the retreat of
the summer monsoon and the onset of the winter (northeast) monsoon.
2.4 Upper Hinds
2.4.1 The normal upper winds over Allahabad and New Delhi from May to
October are given in Fig. 2.2. These stations are representative of conditions
over Uttar Pradesh and to some extent, Bihar Plains as well. The main features
of the upper wind distribution during the mid-monsoon season, over Uttar Pradesh
and Bihar are:-
i) light and unsteady winds in the lower and middle troposphere, though in
the mean they have a small easterly component
ii) easterlies in the upper troposphere, which gradually strengthen with height
and become quite steady, as we go higher up.
2.4.2 It may be mentioned in this connection that in the middle and upper
troposphere, it is warm over the Himalayas and Tibet and cold in the south
towards the equator, resulting in a north-south temperature gradient over the
country. This temperature gradient increases with height upto 200 mb. As a
result, the easterlies in the upper troposphere strengthen with height over the
country. Over Uttar Pradesh and Bihar this strengthening is less than further
south over the central parts of the country and the peninsula where the thermal

8
gradients are stronger. The lower tropospheric winds over Uttar Pradesh and
Eihar are light and unsteady in the mean. This is partly due to the day-to-
cay fluctuations in the axis of the monsoon trough and partly because of the
movement of depressions and low pressure areas close to these areas. However,
there are occasions when the lower tropospheric winds are quite strong. When
the seasonal trough is well-marked and is to the south of the normal position
or When a deep depression moves across Madhya Pradesh, the winds over Uttar
Pradesh and Bihar become strong easterlies which may reach upto 40-50 knots.
When the axis of the monsoon trough shifts to the foot-hills, strong westerlies
to northwesterlies prevail over Uttar Pradesh and Bihar and these winds also
go upto 40-50 knots.
2.5 Upper Air Temperatures
2.5.1 Allahabad and New Delhi radiosonde ascents (Fig. 2 . 3 ) a and b) may be
aken to be representative of the area under study. The mean temperatures and
humidity distribution at these two stations show considerable changes as the
monsoon season sets in. The main features are:-
i) Decrease in temperature below 700 mb
ii) Increase in temperature between 700 mb and 200 mb. The maximum increase
is at 400 mb level, where the rise in temperature from May to July is
7°C at Allahabad and 10°C at New Delhi
iii) No significant change in temperature above 200 mb
iv) Considerable increase in moisture at all levels, progressively from May
to July.
The "decrease in temperature at lower levels and the increase at higher levels
lead to a general decrease in thermodynamic instability. As we proceed from
September to October, the changes in temperature and humidity proceed in the
reverse order.
2.5.2 The mean tephigram of Lucknow on days of vigorous/active, normal and
weak monsoon (as well as completely dry days) in East Uttar Pradesh are given

9
in (Fig. 2.4) . The curves show that on dry days, the atmosphere is
slightly warmer below 800 mb than when there is rain; otherwise the dry bulb
curves differ very little from each other. The main difference can be seen
only in the dew point curves. Progressively decreasing monsoon activities are
associated with progressively decreasing moisture content in the atmosphere.
The changes in the moisture content with monsoon activity is most prominent
in the middle troposphere. For instance, comparing a day of active monsoon
with a day of dry weather, it is noticed that at 500 mb level, while the dry
bulb remains the same, the difference in dew point is 7°C. Individual tephi-
grams of Lucknow for typical days are given in Fig. 2.5 (a,b,c,d).
2.6 Stability Conditions
2.6.1 As mentioned earlier, the seasonal low lies over Pakistan and adjoin-
ing Rajasthan during the southwest monsoon months. The low is a shallow one
and does not extend above 700 mb. At higher levels an anticyclonic circula-
tion overlies the lower tropospheric low. The region of the seasonal monsoon
low is one of high temperatures and low humidity, practically throughout the
entire troposphere.
2.6.2 In the lower tropospheric levels, the maximum temperature gradients
are over the region from Saurashtra and Konkan to West Uttar Pradesh and
Punjab across East Rajasthan. To the east and south of this belt, temperatures
are lower and the gradients are also less. However, in the middle and upper
troposphere, the isotherms run mainly in an east-west direction over India
and are more packed over the peninsula and the adjoining central parts of the
country.
2.6.3 From the distribution of temperature* described above, it will be
seen that Bihar and Uttar Pradesh (except the extreme western parts) is a
* For winds and temperature at standard isobaric levels see FMU ReportNo. I - 2 Fig. 7.3 and 6.3.
10
region where temperature gradient is not generally very large in the
troposphere. However, the wet bulb temperatures are quite high over this area
in the lower levels. In fact, during the southwest monsoon season, the Gange-
tio Plain is the region of highest wet bulb temperatures in the whole of the
Indian sub-continent. The mean precipitable water content is quite large
over these areas. The air over Uttar Pradesh and Bihar is, consequently, a
uniform air mass with high temperatures and high moisture content.
2.5.4 A comparison of mean tephigrams of Allahabad and Lucknow, with
stations like Jodhpur, Nagpur or Bombay shows that the air over Uttar Pradesh
during the monsoon months has a high degree of latent instability. Thus, the
atmosphere over Uttar Pradesh and Bihar is favourable for the development of
convective type of weather. Hence, even feeble disturbances in the low levels,
and associated with convergence in the wind field,are able to provide the
ascent needed to release latent instability. Consequently, convective
phenomena are fairly common over these regions.
2.6.5 This instability is reflected in the pronounced thunderstorm activity
in Uttar Pradesh and Bihar. During the monsoon season, the average number of
thunderstorm days is over 50 in Bihar and about 30-40 in Uttar Pradesh. The
highest frequency of thunderstorms for the whole of India is over Bihar
P]ateau in this season. Even at the height of the monsoon, thunderstorms are
quite frequent over the area - as high as 12 to 16 days in a month. Orography
is an additional factor which helps pronounced thunderstorm activity over Bihar
Plateau. On a large number of occasions, the rainfall over Uttar Pradesh and
B:.har is accompanied by thunderstorm, the feature being most pronounced overPlateau
B:.har/and south Uttar Pradesh, i.e., in the region of the axis of the seasonal
t::ough.

11
3. Survey of Synoptic Situations associated with monsoonactivity over Uttar Pradesh and Bihar
3.1 The common synoptic situations* that produce good rainfall in Bihar and
Uttar Pradesh during the southwest monsoon period are:
i) Depressions
ii) Low pressure areas and upper air circulation
iii) Monsoon troughs across the region, with or without a low or depression
embedded in it, and
iv) North-south oriented trough in the monsoon westerlies or a westerly
trough moving to the north across the Western Himalayas or Tibet in the
upper troposphere
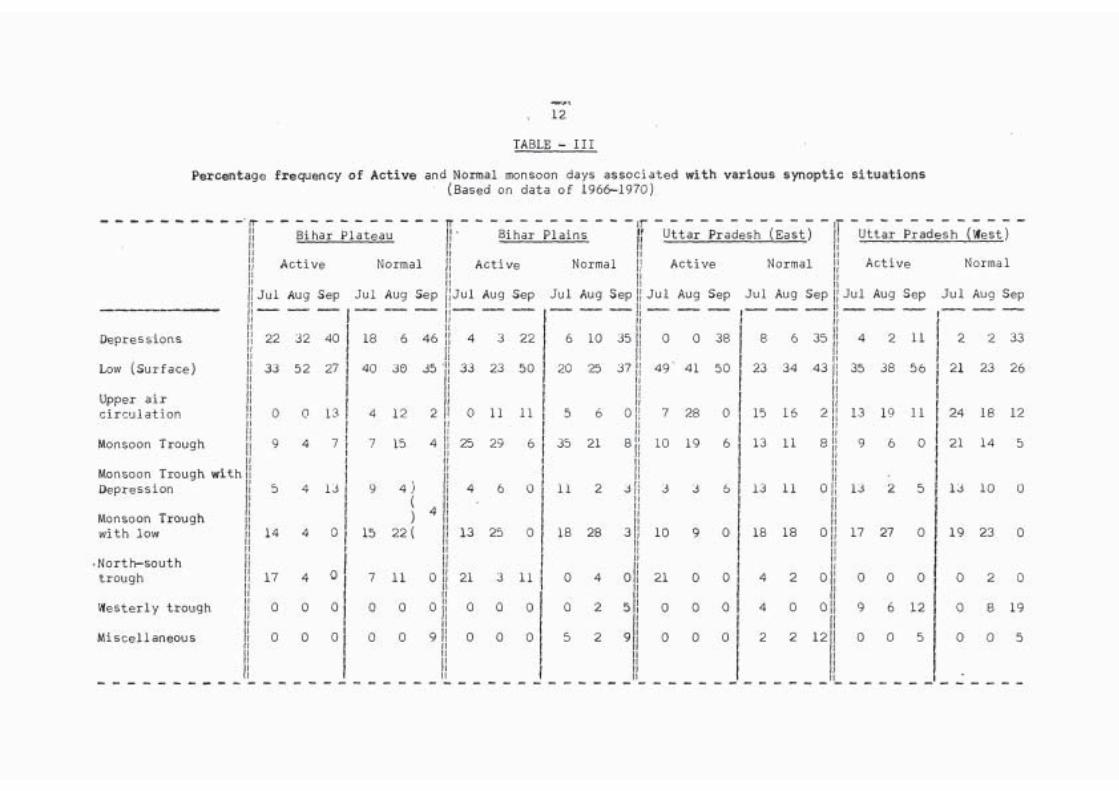
The frequency distribution of active to vigorous monsoon days and normal
monsoon days in the months of July, August and September associated with
different types of synoptic situations is given in Table III. In these
situations, the disturbance was over the concerned sub—division or its immediate
neighbourhood during the 24 hr. period to which the monsoon activity refers.
* What is attempted in these paragraphs is to find out the association ofsynoptic systems with weather. While discussing typical synoptic situations,qualitative reasoning based on convergence or divergence in the wind field orchanges in the pressure field are included wherever possible to explain theoverall rainfall. Table III shows the frequency of different types ofsynoptic systems and rainfall. It could serve as a preliminary guide toforecasters for anticipating rainfall. But, it may be borne in mind that noset of rules can claim more than statistical validity; and there is no cer-tainty that in an individual situation the association will always hold good.In this context, a reference is invited to the Introductory Section of thearticle "The theory and use of upper air thickness patterns in forecasting" byR.C. Sutcliffe and A.G. Forsdyke (QJRMS, Vol. 76 No.328 April 1950,pp. 189-190).
12
TABLE - III
Percentage frequency of Active and Normal monsoon days associated with various synoptic situations- (Based on data of 1966-1970)
Bihar Plateau Bihar Plains Uttar Pradesh (East) Uttar Pradesh (West)
Active Normal Active Norma1 Active Normal ActiveII
Normal
¡Jul
II
!! 2 2II
Aug Sep
32 40
Jul
18
Aug Sep
6 46
Jul
4
Aug Sep
3 22
Jul
6
Aug Sep
10 35
Jul Aug
0 0
Sep Jul Aug Sep Jul Aug Sep
4 2 11
Jul Aug Sep
Depressions
¡Jul
II
!! 2 2II
Aug Sep
32 40
Jul
18
Aug Sep
6 46
Jul
4
Aug Sep
3 22
Jul
6
Aug Sep
10 35
Jul Aug
0 0 38 8 6 35
Jul Aug Sep
4 2 11 2 2 33
Low (Surface) 33 52 27 40 30 35 " II! 33 23 50 20 25 37 | 49" 41 50 23 34 43 35 38 56 21 23 26
Upper aircirculation 0 0 13 4 12 2 ! o 11 11 5 6 0 7 28 0 15 16 2 13 19 11 24 18 12
Monsoon Trough 9 4 7 7 15 4 25 29 6 35 21 8 | 10 19 6 13 11 8 9 6 0 21 14 5
Monsoon Trough withDepression 0 4 13 9 4 )
22 (
4 6 0 11 2 3 ¡ 3 3 5 13 11 0 13 2 5 13 10 0
Monsoon Troughwith low 1 4 4 0 15
4 )
22 ( 13 25 0 18 28 3 | 10 9 0 18 18 0 17 27 0 19 23 0
North-southtrough 17 4 0 7 11 0 21 3 11 0 4 0 21 0 0 4 2 0 0 0 0 0 2 0
Westerly trough 0 0 0 0 0 0 ! o 0 0 0 2 5 0 0 0 4 0 0 | 9 6 12 0 8 19
Miscellaneous 0 0 0 0 0 9 0 0 0 5 2 9 0 0 0 2 2 12 0 0 5 0 0 5

13
3.2 The main conclusions that can be drawn from Table III are the following:
i) Depressions: In July and August, depressions cause active monsoon condi-
tions mainly in Bihar Plateau, the number of occasions in the other sub-
divisions being very small. In September, depressions affect the whole of
Bihar State and Uttar Pradesh more or less to the same extent.
ii) Low pressure areas and upper air circulations: Low pressure areas are seen
on the sea level charts and they generally extend into the lower and mid-
troposphere. Upper air circulations, on the other hand, are seen only in
the lower and/or middle troposphere. By far the largest number of days
of monsoon activity is due to low pressure areas. The occasions of active
monsoon conditions associated with upper air cyclonic circulations are
much less compared to those associated with surface lows.
iii) In all the four sub-divisions, depressions and lows are the only two
synoptic features which affect the monsoon circulation in September; other
types of synoptic situations are less marked.
iv) Monsoon trough: The monsoon trough (whether it has an embedded low or
depression in it or not) constitutes a favourable synoptic situation for
rainfall. An active monsoon, associated with the monsoon trough, is more
frequent in Bihar Plains and West Uttar Pradesh than in the other two
sub-divisions. By September, there is a distinct weakening in the patterns
of pressure and wind distribution over north India, and the monsoon trough
becomes less pronounced. Consequently, the number of occasions of rain-
fall in Uttar Pradesh and Bihar due to the monsoon trough decreases con-
siderably during this month.
v) North-south oriented trough and westerly trough*: North-south oriented
* There are occasions when a monsoon depression or a low may be affecting UttarPradesh or Bihar, with the simultaneous presence of a westerly trough further tothe north or northwest. Such occasions have been classified under "depression"or "low" as appropriate. Similarly, during some "breaks", the monsoon troughlies across north Uttar Pradesh and Bihar Plains, while a westerly trough ismoving further north. Such occasions have been classified under "monsoon trough.Thus, the influence of westerly troughs should be considered to be more frequentover these sub-divisions than the figures in the above table would indicate

14
troughs affect mainly Bihar State and East Uttar Pradesh while westerly
troughs affect only West Uttar Pradesh. It is a point of interest to note
that north-south troughs occur mostly in July; the frequency is compara-
tively less in other months. Westerly troughs affect West Uttar Pradesh
in all the months.
3.3 In the following paragraphs we shall consider in more detail each of
the synoptic systems.
3.4 Depressions
3.4.1 Some of the aspects of monsoon depressions have been discussed in
FMU Rep. No.III-3.3 and III-3.4 (vide Sec. 3.4 in both reports). In this
report, we shall discuss them only briefly in so far as they affect Uttar
Pradesh and Bihar.
3.4.2 The distribution of the average number of depression centres per
clegree square for July, August and September is shown in Fig. 3.1 (a,b,c).
It will be seen from the figures that monsoon depressions affect Bihar
Plateau in all three months, the number being more in the southern parts of
the sub-division . In July and August,only the southern portions of Uttar
Pradesh and of Bihar Plains are affected and the frequency is also very low.
In September, depressions have a more northerly track and also recurve, so
that more depressions reach Uttar Pradesh and Bihar Plains in this month
:han in the earlier two months.
3.4.3 As more depressions move through Bihar Plateau, the number of active
monsoon days associated with depression is a maximum in this sub-division.
The normal tracks of depressions are from the head Bay of Bengal to northwest
Madhya Pradesh; consequently, Bihar Plains and Uttar Pradesh (except the
extreme southern parts) are located to the north of depression track and do
not receive much rainfall during the passage of monsoon depressions.
Satellite pictures (Fig. 3.2 a,b) for 14 and 15 August 1969 of a depression

15
which was moving along a normal track from head Bay to southwest Uttar Pradesh
are given as examples. The pictures show the cumuliform bands to the north and
a heavy overcast area to the south. They clearly illustrate how Uttar Pradesh
and Bihar Plains usually do not get much rainfall even with a depression
passing so closeby. However, towards the end of the season, depressions tend
to take a more northerly track and also recurve* northeastwards. Consequently,
in September, active to vigorous monsoon conditions prevail over Uttar Pradesh
and Bihar Plains in association with depressions. Besides, with depressions of
the late monsoon season, heavy rainfall is not necessarily confined only to the
southwest sector of the depression.
3.4.4 These changes in the pattern of behaviour of depressions in
September can be related to the changes in the circulation pattern during that
month. By September the middle latitude westerly regime tends to shift south,
and reestablishes itself over north India. The sub-tropical ridge line in the
upper troposphere also shifts southwards to Uttar Pradesh and Bihar. These
features in the middle and upper troposphere lead to
i) a more northerly track of monsoon depressions and their subsequent
recurvature to the northeast,
ii) erratic movement of depression at times,
iii) rainfall not necessarily confined to the southwest sector of the depres-
sion and
iv) very heavy rain over relatively small areas; sometimes the spell of
heavy rain continues for a few days.
3.4.5 The troughs in the westerlies that penetrate into north India tend
to cause a northward movement and even recurvature of depressions. When a
depression comes to the forward sector of the trough, very heavy rains occur,
* Details about the recurvature of monsoon depression are discussed in para3.4.4 of FMU Rep. No. III-3.4.

16
and the area of heavy rains need not be then mainly in the southwest sector
of the deprèssion. when the depression comes under the upper ridge line, its
speed may decrease and it may even follow no well defined track. When a well-
defined upper tropospheric anticyclonic vortex in the sub-tropical ridge
pattern over-lies a depression, it creates conditions favourable for excessive
rain and intensification of the low pressure system (even though it. may be
over land). The satellite pictures sometimes reveal very clearly the
intensity of such depressions in September (Example Fig. 3,3 - 5 Sept.1967).
3.5 Low Pressure Areas
3.5.1 Low pressure areas that affect Uttar Pradesh and Bihar during the
southwest monsoon season are seen on the surface charts. They generally
extend into the lower troposphere and sometimes even into the mid-troposphere.
Occasionally, the low may be seen only in the upper air. The low pressure
areas may be divided into the following three types depending upon their
mode of formation:-
i) low pressure areas which are remnants of earlier depressions,
:'.i) low pressure areas, which having formed over north Bay, move in a west-
northwesterly or northwesterly direction over the country,
iii) low pressure areas which have formed in situ over land
Though their modes of formation are different, these three types do not differ
in their structure nor in the weather they produce.
(a) Low pressure areas which are remnants of earlier depressions
i) Depressions weaken and remain as low pressure areas for a day or two before
they become unimportant. Although in rare cases, after weakening a
depression may remain as a low pressure area upto about 4 to 5 days, in a
large majority of cases (nearly 90%) they do not last for more than two
days; on about 75% of occasions, they have a life of only one day as a
low pressure area0.
ii) The number of days when such low pressure areas are found is more in
August and September than in July.

17
iii) In August, these lows have a preferred location over north Madhya Pradesh
and central Uttar Pradesh. In July and September there is no such concen-
tration of the lows over preferred area.
(b) and (c) Low pressure areas which form over north Bay of
Bengal or over land
Some low pressure areas form over the north Bay and without concentrating
into a depression move along a westnorthwesterly to northwesterly track similar
to monsoon depressions. They may also form in situ over land. The percentage
frequency distribution of the centres of low pressure areas in every degree
square during July and August are shown in Fig. 3.4(a,b). The geometric centre
of closed isobar defining the low pressure area has been considered as the centre
of the low pressure area (low pressure areas which are remnants of monsoon
depressions, have been excluded). It will be seen from the figure, that,
i) There is a concentration of the centres over south Uttar Pradesh, extreme
north Madhya Pradesh and central Bihar; this is due to the preponderance of
lows which form in situ in the monsoon trough over these areas
ii) The low pressure areas are usually found at a more northerly latitude than
monsoon depressions
3.5.2 The number of low pressure areas which developed over Bay and over
land during July, August and September during the 20 year period 1950-69, as
well as their average life are given belows:
TABLE - IV
Statistics of number of low pressure areas that formed over Bay and over landand their average life (in days) during the months July, August and September
of the years 1950-1969
i) No. developed over Bayii) Average life of a low (in days)
July145.5
Auqust84.0
September146.5
i) No. developed over landii) Average life of a low (in days)
224.6
284.2
15.0

18
The table shows that the low pressure areas which form over land are quite large
in July and August compared to those which form over north Bay. In August this
feature is pronounced. However, formation of low over land is practically nil
in September. The average life of the low pressure area is about 4 to 6 days.
3.5.3 From Table III, we note that low pressure areas are associated with
active to vigorous monsoon conditions as well as normal monsoon in almost equal
ratio. The rainfall produced by low pressure areas depends on a number of
factors. A further examination of the cases presented in Table III shows that
if the low pressure area is not over the particular sub-division, but only in
the neighbourhood of the sub-division, the monsoon activity over the said sub-
division is only normal. Well-marked low pressure areas lying over the sub-
division associated with moderate to strong winds in the circulation in the
lower tropospheric levels, are usually associated with active or vigorous
monsoon conditions. Thus, whether a sub-division will have vigorous, active
or normal monsoon, will much depend upon the location of the low with refe-
rence to the sub-division, its intensity and the orientation of the zones of
convergence associated with the low. The pressure and wind patterns associa-
ted with the low pressure areas and a few other details are already given in
paras 3.5.4 to 3.5.6 of FMU Rep. No.III-3.4, which may be referred to.
3.6 Monsoon Trough
3.6.1 In the month of July, the monsoon trough is responsible for active
to vigorous monsoon conditions on nearly 40% of the occasions over Bihar
Plains and West Uttar Pradesh and on about 25% of the occasions in Bihar
Plateau and East Uttar Pradesh. In August, however, Bihar Plains gets 60%
of the active to vigorous monsoon conditions due to the monsoon trough.
Over Bihar Plateau the frequency decreases considerably during this month.
In September it is mainly Bihar Plateau and East Uttar Pradesh that are
affected by monsoon trough.
19
3.6.2 In contrast to areas such as Madhya Pradesh, the monsoon trough, when
it is over Bihar and Uttar Pradesh, is associated with rainfall activity whether
there is any depression or low embedded or not in the trough. As already
mentioned in para 2.6.4, on account of the instability conditions over Uttar
Pradesh and Bihar, even feeble disturbances such as a weak trough line is able
to produce weather. Hence, it becomes necessary to look carefully for weak
disturbances also in forecasting weather over Uttar Pradesh and Bihar, particu-
larly when the forecast refers to small areas.
3.6.3 Monsoon trough without an embedded low pressure system is more
common in Bihar Plains and to a less extent in East Uttar Pradesh. When there
is a depression or low over head Bay and neighbourhood, the axis of the
monsoon trough, quite often, takes an orientation from East Uttar Pradesh to
north Bay across northeast Madhya Pradesh, Bihar Plateau and Orissa. Thus,
West Uttar Pradesh and Bihar Plains are not affected by the trough. After the
monsoon trough has shifted northward, there is generally no embedded low in it
and the trough has a tendency to run from West Uttar Pradesh to Bihar Plains
under such conditions. Often active monsoon conditions over West Uttar Pradesh
are associated with the presence of a low pressure system over Punjab, north-
west Rajasthan and adjoining areas, with the axis of the monsoon trough running
from the centre of the low southeastwards across West Uttar Pradesh. On such
occasions the influence of a middle latitude westerly disturbance could also
be noticed.
3.6.4 In the mean chart, the axis of the monsoon trough at 0.9 km a.s.l.
passes close to New Delhi, Allahabad and Asansol (i.e. across the southern
portions of Uttar Pradesh and Bihar Plateau). However, the location on any
particular day varies considerably from the normal position. The following
results based on a study of the daily locations of the trough in July and August
during the nine year period 1961-1969 are of interest.

20
TABLE - V
Percentage frequency of the location of the monsoon trough
MonthLongitudinal
SectionSouth of normal
positionNormalposition
North of normalposition
July 77°E 27 30 43
81°E 27 45 28
87 °E 37 35 28
August 77 °E 20 33 47
81°E 20 47 33
87 °E 34 39 27
(From 'Location of the Monsoon trough over India in the lower troposphereduring July-August'by V. Srinivasan and A.R. Ramakrishnan
3.6.5 The trough is generally to the south of the normal position when a
depression or a low is forming over the head Bay or when it is moving across
:he Indian mainland. In such situations, though Bihar Plateau and the extreme
southern portions of Uttar Pradesh may have monsoon activity, Bihar Plains and
large parts of Uttar Pradesh experience weak monsoon. When the trough is fairly
well to the south, the whole of Uttar Pradesh and Bihar may have very little
rain, particularly if the easterlies to the north of the trough are also quite
strong (sometimes they reach as high as 40-50 kts over Uttar Pradesh and
Bihar). In the other extreme, when the trough shifts to the Himalayas, strong
westerlies/northwesterlies prevail in the lower troposphere over Uttar Pradesh
and Bihar and weather becomes generally dry in these sub-divisions except in
the sub-montane districts.
3.6.6 Though it is commonly said that a shift of the axis of the monsoon
trough to the foot hills of Himalayas leads to 'break' monsoon and decrease in
rainfall in the plains, the statement is not strictly correct. There are a
number of occasions when the axis of the seasonal monsoon trough is towards the
21
foot-hills but still the Gangetic Plains get extensive rainfall. The rainfall
may extend as far south as south Madhya Pradesh or Vidarbha. Such instances
are when a north-south trough in monsoon westerlies move across or when a
middle latitude trough in westerlies extends into Gangetic Plains (for more
details on these types of disturbances see para 3.8 of FMU Rep. No. III-3.4).
3.6.7 It is observed that rainfall is mostly along and to the south of the
axis of the monsoon trough, when the trough is well-marked. However, there
are some occasions when the axis of the trough is seen only in the very low
levels (say below 850 mb) and higher up southerly to southwesterlies prevail
over the area of low level easterlies. In such cases, we find rainfall mainly
to the north of the axis of the trough in the lower troposphere. Effect of
middle latitude westerly trough may be present on some of these occasions.
3.6.8 Another feature is that monsoon is active in Uttar Pradesh and Bihar
Plains when the axis of the trough shifts rapidly through the area. 70% of the
occasions of active to vigorous monsoon associated with monsoon trough (see line
4 of Table III), was noticed when the axis of the trough shifted rapidly across
the area.
3.6.9 The location of the monsoon trough and its association with weather,
was studied using the upper winds over Gaya for July and August of 1966-69.
80% of the occasions of active to vigorous monsoon in Bihar Plains was found to
be associated with westerlies over Gaya (at 0.9 km), while hardly 1% of active
to vigorous monsoon conditions was associated with easterlies. Similarly 60%
of weak monsoon over Bihar Plains was associated with easterlies over Gaya.
The converse, however, does not hold true.
3.6.10 The delineation of the monsoon trough on the daily charts may
present some difficulties" on certain occasions. Some of the difficulties are
as follows:-

22
i) while the trough axis can be drawn on the surface isobaric chart, there
may be no easterly component of the winds over Gangetic Plains even at
0.6 km or 0.9 km and it may not be possible to place the axis in the
lower tropospheric levels.
i:.) On the surface isobaric chart the trough line may be far south of its
position in the lower tropospheric level, resulting in a slope which is
very unrealistic for any pressure or wind system
iii) The trough may extend from Bihar Plateau to Head Bay; but simultaneously
another trough line could also be placed from Bihar Plateau to Assam.
In such a case, one may well ask which one should be called as the
seasonal monsoon trough.
3.6.ll To minimise these difficulties, it is worthwhile to have some
standard procedure at least for purposes of uniformity of description, though
this may not be a complete solution to the problem. At present, there appears
to be no laid down procedure or convention. The following suggestions are
made»
i) The seasonal trough be taken note of, only when it is seen at least upto
0.9 km. A trough seen only in the surface isobaric configuration may not
be of major synoptic significance
ii) The position of the trough line may be described as at 0.9 km i.e. just
above the friction level
iii) When it is possible to place two trough lines, greater weightage may be
paid to the one which is more prominent i.e. with greater cyclonic shift
across the trough line and which is also seen both at the surface as
well as in the lower tropospheric levels.
3.7 Disturbances in westerlies
3.7.1 The disturbances in westerlies form an important class of synoptic
situation that affects Uttar Pradesh and Bihar. These are of two types:

23
i) Troughs in middle latitude westerlies in the middle and upper troposphere:-
This type of disturbances has already been dealt with in detail in Sec. 3
of FMU Rep. No.III-3.3.
ii) North-south oriented troughs in the monsoon westerlies:- They form over
northern India between West Uttar Pradesh and West Madhya Pradesh in the
west and Assam and Bangla Desh in the east. However, they are more frequant
over West Bengal, Orissa, Bihar and the adjoining parts of Uttar Pradesh
and Madhya Pradesh. They may move from west to east, though stagnation and
westward movement are not uncommon. They are mostly in the lower tropos-
phere. Some of these troughs may extend into mid-troposphere also and are
linked with troughs in middle latitude westerlies further to the north.
3.7.2 While north-south oriented troughs affect Bihar and East Uttar Pra-
desh, these are rare in West Uttar Pradesh, as these troughs form mainly to the
east of 80°E. West Uttar Pradesh is mostly affected by westerly troughs. As
has already been discussed in para 3.6.3 of FMU Rep. No.III-3.3, under the
influence of the westerly troughs, feeble cyclonic systems develop over north-
west India which produce an enhancement of monsoon activity in northwest India
and West Uttar Pradesh. It is very often seen that a distinct patch of weather
(with significant amounts of rainfall) occurs in Haryana, Punjab and West Uttar
Pradesh (particularly northern districts), well separated from the weather due
to the monsoon trough/depression/low further to the south, over the central
parts of India. Such occurrence of weather along and over the Western Himalayas
is found to be under the influence of the westerly systems in the middle lati-
tudes. On such occasions, the winds over West Uttar Pradesh and adjoining
northwest India are southeasterlies in the lower troposphere. The results of
an examination of the upper winds over Bareilly at 1.5 km in July and August in
1966-69, and the associated rainfall over the northern districts of West Uttar
Pradesh (hills and plains) indicates the association of predominently south-
easterly winds over Bareilly with good rainfall activity in north Uttar Pradesh.

24
The highest frequency of widespread rainfall as well as heavy falls is associa-of
ted with winds from 110° to 160°, though a low as such to the northwest/Uttar
Pradesh may not be always apparent on the charts. The other significant wind
direction is 290°-340°, which may be associated with the axis of the monsoon
trough close to foot-hills, or an approaching depression or low from the east.
3.7.3 Sometimes westerly troughs move eastwards sequentially from northwestadjacent states and
India to Assam and cause active monsoon not only in West Uttar Pradesh but also
all along the Gangetic Plains as well as in Sub-Himalayan West Bengal andand adjacent States
Assam,,/. In such situations we find the axis of the seasonal monsoon trough (in
the lower troposphere) north of the normal position, towards the foot-hills of
the Himalayas. In spite of this lower troposphere flow patterns, break monsoon
conditions with rainfall confined to the sub-montane districts and dry weather
in the Gangetic Plains, do not obtain when westerly trough (in the middle and
upper troposphere), extending to the south of the Himalayas, moves across
northern India.
4. Synoptic Situations associated with Weak Monsoon
4. Weak monsoon conditions prevail over Uttar Pradesh and Bihar when
none of the synoptic systems listed in para 3.1 is present over the area. Two
typical situations associated with weak monsoon conditions in Uttar Pradesh
and Bihar ares
:'.) When the seasonal monsoon trough is far to the south of the normal
position or a well-marked depression is moving in an almost westerly track
well to the south. On such occasions strong easterlies prevail over Uttar
Pradesh and Bihar and generally monsoon is weak except perhaps over the
Bihar Plateau. However, such dry weather in the easterly regime may not
obtain late in the monsoon season,
ii) During the 'break' period, weak monsoon conditions prevail in Uttar
Pradesh and Bihar except in the sub-montane districts.

25
4.2 On many occasions one or the other part of Uttar Pradesh and Bihar may
get good rainfall while in the remaining portions the monsoon is weak, depending
upon the location of the synoptic systems (discussed in Sec. 3). These will be
referred to in the appropriate places while discussing the typical cases.
4.3 We will now take up, in the following sections, the discussion of typieal
cal synoptic situations leading to activation of monsoon over Uttar Pradesh
and Bihar.
5. Depression travelling from Head Bay of Bengal to northeastMadhya Pradesh across Bihar Plateau
- 10 to 15 August 1968
5.1 On the morning of 10 August 1968, the axis of the seasonal monsoon
trough was passing (on the sea level chart) through Karnal, Mainpuri, Fyzabad,
Gaya and thence southeastwards into the Head Bay of Bengal where a depression
was forming. The axis was seen in the lower troposphere also upto about 1.5 km
over central parts of Bihar State, running northwest-southeast in nearly the
same position as on the sea level chart. There was fairly widespread rainfall
over Orissa, Gangetic West Bengal, Bihar Plateau and East Uttar Pradesh. A few
heavy falls occurred in East Uttar Pradesh. The monsoon was strong over West
Uttar Pradesh where the axis of the monsoon trough was close to the foot-hills
(in the lower troposphere). Westerlies were weakening down stream indicating
convergence over East Uttar Pradesh where also the monsoon was strong. It is
of interest to note that while over Uttar Pradesh the rainfall was close to and
to the north of the axis of the monsoon trough on the surface chart, over Bihar
Plateau, Orissa and the adjoining areas it was to the south of the axis. Such
cases of weather occurring to the north of the trough line is not uncommon in
West Uttar Pradesh.
5.2 On this particular occasion a middle latitude disturbance was over nor-
thern divisionsof Pakistan and adjoining northwest India. This apparently con-
tributed to strong monsoon over West Uttar Pradesh. Comparing the locations of

26
the axis of the monsoon trough at different heights, it is seen that the
western half of the axis of the monsoon trough remained close to foot hills at
all levels in the lower and middle troposphere while the eastern half showed
a slope southwards. Perhaps this may be one of the indications for the dif-
ferences noticed in the distribution of rainfall with reference to trough
line.
5.3 On the morning of 11th the depression was centred near 22°N 90°E
close to Sunderbans coast (Fig. 5.1); the associated cyclonic circulation
covered north Bay, Bangla Desh and the adjoining Gangetic West Bengal and
extended upto about 400 mb (Fig. 5.2). The axis of the monsoon trough at
0.9 km was running from Ambala to Patna and further southeastwards towards
the depression in north Bay. Apparently under the influence of the middle
tropospheric westerly trough, a feeble cyclonic circulation also developed
over Punjab and neighbourhood in the lower troposphere. On this day also the
rainfall in East Uttar Pradesh and Bihar State was to the south of the
trough line. The monsoon was normal in East Uttar Pradesh and Bihar Plateau;
it was weak in Bihar Plains which was mainly to the north of the trough line.
The monsoon continued strong over West Uttar Pradesh, apparently due to the
monsoon trough lying rather close to the foot-hills, the formation of the low
level circulation over Punjab and neighbourhood and the approaching westerly
perturbation. The heavy falls in association with the depression were over
Orissa and the adjoining extreme East Madhya Pradesh.
5.4 The depression moved in an almost westerly direction rather slowly and
was centred close to Calcutta on the morning of 12th. It was well-marked in
the upper air and extended to 400 mb. Pressures were falling by about 1 mb
over Bihar Plateau. In the lower troposphere, the axis of the monsoon trough
was close to the foot-hills of the Himalayas in West Uttar Pradesh; the eas-
tern end was running across East Uttar Pradesh and Bihar Plateau. The cyclonic
circulation over Punjab and neighbourhood, also weakened. The trough in
27
westerlies, however, persisted. Under the influence of the approaching depres-
sion, rainfall increased in Bihar Plateau and the adjoining parts of Bihar
Plains where the monsoon became strong and a number of stations reported rain-
fall amounts varying from 3 cm to 6 cm. The area of heavy rain was further
to the south, over Orissa and East Madhya Pradesh. Monsoon was weak in Uttar
Pradesh. With the weakening of the cyclonic circulation over Punjab and neigh-
bourhood, there was a marked decrease in rainfall in West Uttar Pradesh where
winds veered to northwest in the lower troposphere since the previous day.
5.5 The depression moved westnorthwestwards to Bihar Plateau and adjoining
northeast Madhya Pradesh on 13th with centre midway between Chaibasa and Ambika-
pur (Fig. 5.3). The negative pressure departures at the centre were about 5 mb -
slightly less than on the previous day. The cyclonic circulation extended upto
about 400 mb (Fig. 5.4). Monsoon continued strong over Bihar Plateau with some
stations reporting 4 cm to 8 cm rainfall. Heavy to very heavy falls, however,
occurred over the adjoining northeast Madhya Pradesh.. The monsoon was weak in
Uttar Pradesh and Bihar Plains. The westerly trough was weakening (note the
establishment of a ridge over the extreme north of the country at 300 mb and
compare it with chart of 11th).
5.6 The depression moved slowly westwards and was centred close to Ambikapur
on 14th morning. In the lower troposphere, the winds over Bihar and Uttar Pra-
desh were moderate to strong easterlies, becoming southeasterly over northwest
Uttar Pradesh, replacing the northwesterlies there. As the depression moved
slightly westwards there was a decrease in rainfall over Bihar Plateau where
monsoon activity was only normal. Weather was almost dry over Bihar Plains.
However, there was a belt of rainfall extending northwest to southeast from West
Uttar Pradesh hills to central portion of south Uttar Pradesh - more or less
corresponding to the region of the location of the axis of the monsoon trough in
the lower troposphere during the preceding 24 hrs.

28
5.7 The depression persisted over northeast Madhya Pradesh on 15th morning
with a little westward movement (Fig. 5.5). Pressures were generally rising
all over the area and the maximum negative departure was only about 4 mb at the
cepression centre. However, the associated cyclonic circulation continued to
be well-marked extending to about 400 mb level (Fig. 5.6).
5.8 In the meanwhile, a well-marked cyclonic circulation had developed
ever the central parts of Pakistan and adjoining north Rajasthan in the lower
weretroposphere(upto 2.1 km). Indications of this were available even on 14th
evening. Under the influence of this cyclonic circulation, the easterlies/
southeasterlies over Uttar Pradesh spread further westwards to northeast
Rajasthan and Punjab. There was a well-defined easterly flow over the whole
of Uttar Pradesh and Bihar State and the axis of the monsoon trough was over
north Madhya Pradesh, - to the south of its normal position. The easterlies
ever Bihar and East Uttar Pradesh were strong (20-30 kt) weakening downstream
to 5/10 kts over West Uttar Pradesh. The monsoon on this day, was weak over
Bihar State and East Uttar Pradesh and normal over West Uttar Pradesh.
5.9 The depression weakened into a low pressure area over northeast
Madhya Pradesh on 16th and the low persisted over northeast Madhya Pradesh and
adjoining south Uttar Pradesh on the 17th also. Over East Uttar Pradesh and
Bihar the easterlies decreased in speed compared to 15th. The cyclonic circu-
lation over Punjab and adjoining area also moved eastwards and weakened. The
monsoon was generally weak over Uttar Pradesh and Bihar on 16th and 17th. The
main area of rainfall due to the low pressure area was to the south, over West
Madhya Pradesh. There was isolated rainfall in the plains of West Uttar Pra-
desh and scattered rain in the hills, due to the effect of the moving cyclonic
circulation over the areas.
5.10 A sequence of daily satellite pictures for the period 10 to 15 August,
showing the development, movement and dissipation of the depression is given in

29
Fig. 5.7(a to c). The monsoon trough (at 0.9 km) is also indicated in each
picture, so that the cloudiness in relation to the trough position can be exa-
mined. The salient features brought out by pictures day-by-day are:-
i) 10th: The depression was in the formative stage. Only a rotatory movement
of the cloud mass can be seen in the picture. The cloud mass is to the
south of the surface centre of the depression; to the north there is
hardly any cloud.
ii) 11th: The depression was centred near 22°N and 90°E. The centre is close
to the overcast area; the north is lightly clouded. The heavy overcast
in the south is quite extensive upto Rajasthan and West Uttar Pradesh and
is to the south of the axis of the monsoon trough to the east of Long.80°E.
Such extensive cloudiness and rainfall are characteristic of depressions at
the height of monsoon; in late-season depressions, the cloudiness is very
much restricted in extent.
iii) 12th: The depression has developed well-marked cumuliform bands in the
north, which involute towards the centre which is close to Calcutta, just
at the northern edge of the overcast area.
iv) 13th: Cumuliform bands to the north are not so well-marked as on 12th.an
The heavy overcast to the south covers an extensive area upto 17°N in the
south and 78°E in the west
v) 14th: Picture quality was not good.
vi) 15th: Again the picture shows the cumuliform bands to the north and the
extensive overcast to the south of the centre. Extension of the cloudy
area towards Western Himalayas where a cyclonic circulation had developed,
is also seen.
5.11 This sequence of satellite pictures brings out the development of the
depression as the cumuliform bands begin to appear in the north and the weaken-
ing of the organization of these bands later as the depression moved well into
Madhya Pradesh. The overcast area is seen mostly to the south of the axis of

30
the trough. The nature and the extension of the clouds can be of much help to
the forecasters in anticipating the extension of precipitation areas as the
depression moves. Light to moderate showery type of precipitation, of short
duration, may be anticipated in the area of the cumuliform bands while more
steady precipitation for longer duration can be forecast in the areas of heavy
overcast. Heavy precipitation has been noticed in the area where the curving
cumuliform bands enter the overcast area,
5.12 To sum up, we may note the following salient points:
i) The depression moved across Bihar Plateau to northeast Madhya Pradesh
where it weakened. Since heavy rains occur in association with depres-
sion, close to the track and the south of it, Bihar Plateau alone experi-
enced strong monsoon on two days in association with the depression. Over
Bihar Plains and East Uttar Pradesh there was only an increase in rainfall,
with fairly widespread rainfall on one day in each of the two sub-divisions.
Over West Uttar Pradesh, the weather development was more complex. The
wind field over "West Uttar Pradesh was affected not only by the depression,
but also by the passage of westerly trough to the north and development of
cyclonic circulations over northwest India.
ii) The depression caused a spell of strong monsoon over Bihar Plateau on 12th
and 13th. As the depression came to Gangetic West Bengal on 12th, the
monsoon strengthened in Bihar Plateau; it continued to be strong on 13th
also when the depression moved to Bihar Plateau. Rather heavy to heavy
falls were recorded on these two days. However, when the depression moved
to the west of the sub-division on 14th, rainfall amounts rapidly decreased
over Bihar Plateau and still further on 15th, though the spatial distribu-
tion continued to be fairly widespread on these two days also.
iii) As the depression moved to the south of the sub-division, Bihar Plains did
not get any significant monsoon activity except for a slight increase in
rainfall on 12th when the depression was over Gangetic West Bengal.

31
iv) East Uttar Pradesh also did not get much weather, as the depression was to
the south of the sub-division and strong easterlies prevailed over the area
in the lower troposphere. There was an increase in rainfall on 14th when
the monsoon trough lay northwest/southeast across the sub-division,
v) The depression track was to the south of West Uttar Pradesh. Hence, except
for an increase in rainfall, the depression did not cause strong or vigorous
monsoon over west Uttar Pradesh. The rainfall was fairly widespread to
widespread on 14th and 15th when the trough was over the sub-division.
Strong monsoon conditions on 10th and 11th was not associated with the
depression, but with a middle latitude disturbance.
6. Depression moving in a northerly direction across WestUttar Pradesh causing strong to vigorous monsoon in
Uttar Pradesh - 11 to 17 September 1963
6.1 In this section, we will discuss the case of a monsoon depression
which came up to East Madhya Pradesh from the Bay and thereafter took north-
northwest/northerly track across West Uttar Pradesh under the influence of a
trough in westerlies. In contrast to the case discussed in the earlier Section,
the present depression caused strong to vigorous monsoon in Uttar Pradesh.
6.2 A depression from Northeast and adjoining East Central Bay of Bengal,
moved northwest and lay as a deep depression with centre near 20.5°N 89°E on
the morning of 11 September, 1963. In the lower troposphere below 2.0 km, the
northeast/easterlies around the circulation of the depression penetrated upto
Bihar, while northwesterlies prevailed over Uttar Pradesh. However, in the
middle troposphere, the cyclonic circulation was quite extensive and weak eas-
terlies prevailed over Uttar Pradesh also. The rainfall in association with the
depression was confined to Gangetic West Bengal and Orissa with a few light
showers extending upto the southern portion of Bihar Plateau. Over Uttar Pradesh
and the rest of Bihar State, weather was mainly dry.
6.3 Crossing coast near Balasore, the deep depression was centred near

32
Keonjhar(in OrissaJ on the 12th morning (Fig. 6.1). South Bihar State came
well within the circulation of the deep depression and the easterlies in the
lower troposphere penetrated into East Uttar Pradesh also (Fig. 6.2). With
the movement of the depression towards Bihar Plateau, rainfall increased over
the sub-division and was widespread. Daltonganj reported a rather heavy fall
of 6 cm. Weather continued to be nearly dry over Uttar Pradesh and Bihar
Plains.
6.4 Moving in a westnorthwesterly direction the deep depression was cen-
tred near Champa on 13th morning. The easterlies penetrated further to the
whole of Uttar Pradesh and they also strengthened over Bihar Plateau and East
Uttar Pradesh. At 0.9 km, the axis of the monsoon trough was passing from
Punjab and Haryana t o northwest Madhya Pradesh. The rainfall extended into
Bihar Plains and East Uttar Pradesh; it was fairly widespread in Bihar State
and East Uttar Pradesh. Over West Uttar Pradesh also there was a slight
increase in rainfall. At this stage, a well-marked trough in westerlies came
over Pakistan and was seen on 13th evening extending from Northwest Frontier
Province southwards upto Sind, in the mid- and upper troposphere. 24 hr. pres-
sure changes also were 2-3 mb (negative) over northern divisions of Pakistan
with a rise further to the west.
6.5 By 14th morning, the deep depression was centred near Jabalpur
(Fig. 6.3). The maximum negative pressure departure at the centre was about
10 mb. However, the associated cyclonic circulation was noticeable upto about
500 mb only whereas on the previous day it was seen at 400 mb also (Fig. 6.4).
At 400 mb and 300 mb, it appeared as though the westerly trough extended south-
wards upto West Madhya Pradesh; this was apparently due to the close proximity
of the westerly trough and the weak cyclonic circulation at these levels asso-
cii.ted with the depression. The rainfall now increased in West Uttar Pradesh
and monsoon became strong. Agra and Mainpuri recorded heavy rainfall of 10 cmwest Uttar Pradesh to Jammu and
and 7 cm respectively. This region was just

33
ahead of the westerly trough; in the lower levels also, West Uttar Pradesh was
a region where easterlies were meeting northwesterlies/northerlies in the lower
troposphere. Rainfall decreased, in East Uttar Pradesh and Bihar, as the
depression moved west.
6.6 Under the influence of the westerly trough, the deep depression took a
northnorthwesterly course and moved into southwest Uttar Pradesh and was centred
on the 15th morning about 60 km westsouthwest of Kanpur (Fig. 6.5). The maximum
negative pressure departure at the centre was about 8-9 mb. Rainfall increased
considerably over West Uttar Pradesh where monsoon became vigorous. A number of
heavy tostations reported Very heavy falls ranging from 10 to 20 cm, the highest being
21 cm at Jhansi (in West Uttar Pradesh) and Gwalior (in West Madhya Pradesh).
To the west there was a very sharp decrease in rainfall and East Rajasthan had
hardly any rain. In the middle troposphere, the cyclonic circulation associated
with the deep depression merged into the westerly trough and the two appeared to
form a single trough system (Fig. 6.6).
6.7 The depression moved rather fast in an almost northerly direction towards
the hills of West Uttar Pradesh where it weakened into a low pressure area on the
16th morning (Fig. 6.7). Pressures rose heavily over south Uttar Pradesh. There
was hardly any cyclonic circulation associated with the low, noticeable in the
upper air (Fig. 6.8). The westerly trough in the mid-troposphere was the main
feature of the chart. Monsoon continued vigorous over West Uttar Pradesh and
heavy to very heavy rains continued in the northern portions of Uttar Pradesh;
the highest fall was 22 cm at Nainital. As the depression moved northwards, the
axis of the monsoon trough also progressively shifted northwards and was close
to the foot hills of the Himalayas (at 0.9 km) on 16th. This resulted in increa-
sed rainfall activity and monsoon became strong to vigorous in Bihar Plains and
East Uttar Pradesh on 16th. Nautanwa in East Uttar Pradesh reported 19 cm.
6.8 By 17th, the low became unimportant. Though the axis of the monsoon
34
trough was close to the Himalayas, winds (in the lower troposphere) veered to
northwest over Uttar Pradesh and Bihar (Fig. 6.9). As a result rainfall
rapidly decreased over Uttar Pradesh and Bihar. Monsoon was normal in East
Uttar Pradesh and Bihar Plains and weak in West Uttar Pradesh and Bihar Plateau.
With the breaking up of the depression over the hills and the movement east-
wards of the upper westerly trough, the monsoon withdrew from Uttar Pradesh
after 20th. Fig. 6.10 shows the vertical time-section for New Delhi in which
the eastward passage of the upper trough across the station can be seen.
6.9 The following are the main features brought out in the above
discussion:
i) This was a typical case of a late monsoon depression changing its course
to a northerly direction under the influence of a middle latitude westerly
trough. As a westerly trough came over Pakistan and northwest India, the
depression which was moving in a westnorthwest direction took a turn
towards northnorthwest and moved across West Uttar Pradesh between 15th
and 16th.
ii) So long as the depression was moving in a westnorthwest direction, heavy
rains were confined to Orissa and East Madhya Pradesh in the southern
sector of the depression. Bihar Plains and Uttar Pradesh being in northern
sector had only light to moderate rain. Between 11th and 14th, rainfall
gradually extended from east to west from Bihar to West Uttar Pradesh as
the easterlies penetrated over the area replacing the earlier north-
westerlies. The increase in the humidity over the Uttar Pradesh as the
easterlies penetrated westwards in the lower 'troposphere is depicted in
the tephigrams of Allahabad for 11th and 12th.(Fig. 6.11). Occurrence of
rainfall to the north of the depression also is not uncommon in the late
monsoon season. In this case, there was also some speed convergence as
the easterlies weakened downstream and met the westerlies/northwesterlies.
35
iii) When the depression changed course and started moving in a northnorth-
westerly direction, rainfall increased in West Uttar Pradesh on the 14th.
Weather deteriorated very rapidly on the 15th and 16th when the depression
was moving across the sub—division» Very heavy rains occurred on these
two days with maximum amounts of the order of 20 cm. Monsoon was strong
to vigorous over West Uttar Pradesh during this period. Late monsoon
depressions which move north and break up against the Himalayas usually
produce very heavy rains leading to floods. The decrease in rainfall
over West Uttar Pradesh and the improvement of weather after the depression
broke up over the hills were also equally rapid.
iv) As the depression moved north, the axis of the monsoon trough also shifted
to the foot hills of the Himalayas over East.Uttar Pradesh and Bihar resul-
ting in increased monsoon activity over the sub-divisions. On 16th as the
depression was breaking up against the hills, rainfall extended all over
the area from Punjab and Haryana to Bihar Plains, although the main area
of very heavy rains was over West Uttar Pradesh, Punjab and Haryana. It is
a point of interest to note that East Uttar Pradesh and Bihar Plains had
strong to vigorous monsoon on 16th and there was no active monsoon either
in East Uttar Pradesh or Bihar State when the depression moved westwards
just south of these sub-division between 12th and 13th.
v) Although the axis of the monsoon trough was close to the foot-hills on the
17th the rainfall rapidly decreased over Uttar Pradesh and Bihar as the
lower tropospheric winds over the area veered to the northwest from the
previous southwest to west.
7. Deep Depression recurving over Uttar Pradesh and movingeastwards to Bihar Plains - 10 to 17 September 1970
7.1 In the last section we saw the case of a depression in late monsoon
season which moved in a northerly direction across West Uttar Pradesh. In this
section we will discuss another depression (in September) which recurved over
Uttar Pradesh and moved eastwards upto Bihar Plains. While recurving it also
36
executed a loop, which is rare.
7.2 A low pressure area moving westwards across Burma entered Northeast
Bay of Bengal and concentrated into a depression on the morning of 8 September
1970. Westnorthwesterly/northwesterly winds prevailed over Bihar State and
East Uttar Pradesh in the lower troposphere, while there was a southeast/
southerly flow over West Uttar Pradesh, under the influence of a depression
over southwest Rajasthan. The pressure fall associated with the Bay depres-
sion had just extended upto Bihar State, while over Uttar Pradesh pressures
were generally rising. Except for some rainfall over and near the hills of
West Uttar Pradesh, weather was mainly dry over Uttar Pradesh and Bihar State.
7.3 Moving northwestwards, the depression deepened and was centred close
to Calcutta on 9th morning (Fig. 7.1). 24 hr. pressure changes suggested a
movement towards Bihar Plateau and northeast Madhya Pradesh. The lower tro-
pospheric winds in the region of the deep depression were about 30-35 kt
strong, suggesting that the system was probably reaching the intensity of a
cyclonic storm (Fig. 7.2). ESSA 8 APT pictures also indicated the intensity
of the system as Stage X Cat. 2. In the lower tropospheric levels (for instance
at 0.9 km) the northeasterlies/easterlies penetrated into Bihar and East Uttar
Pradesh during the previous 24 hrs. and a zone of convergence between these
easterlies and the northwesterlies was running through Gonda, Allahabad, Ranchi
and thence southeastwards. Rainfall started in Bihar and East Uttar Pradesh
and the monsoon became active in Bihar Plateau, with rainfall amounts about
4 to 5 cm occurring along and near the convergence zone. There was also
isolated rain in the hills of West Uttar Pradesh. Very heavy falls of the
order of 10 to 16 cm had occurred in Gangetic West Bengal which was close to
the depression centre.
7.4 Crossing coast by the afternoon of 9th, the deep depression came over
Bihar Plateau on 10th morning and was centred near Dhanbad (Fig. 7.3). The

37
cyclonic circulation associated with the deep depression extended upto 400 mb
(Fig. 7.4). The axis of the seasonal trough extended from the depression north-
westwards towards West Uttar Pradesh hills in the lower troposphere. The
maximum negative pressure departures in the depression area were about 8 mb.
Heavy to very heavy rain occurred in Bihar Plateau where monsoon became vigorous.
Rainfall was fairly widespread along and near the trough line in Bihar Plains,
East Uttar Pradesh and in and near the hills of West Uttar Pradesh.
7.5 The deep depression moved slowly across Bihar Plateau and was centred
close to Daltonganj on the morning of 11th. The associated cyclonic circulation
continued to extend upto 400 mb. Except for a pressure fall over a small area
in northeast Madhya Pradesh, close to the depression centre, there was a general
rise of pressure over the whole country, the maximum rise of the order of 4-6 mb
being in the rear of the depression. However, the maximum negative departure
in the depression field was 7 mb. The northeasterlies/easterlies extended
further westwards over the whole of East Uttar Pradesh. The monsoon continued
to be vigorous in Bihar Plateau with Ranchi and Daltonganj reporting 17 cm and
10 cm of rain respectively. Rainfall was also fairly widespread over northwest
Uttar Pradesh where the axis of the monsoon trough was close to the foot-hills
of Himalayas. Over Bihar Plains and the rest of Uttar Pradesh, light to
moderate rain fell.
7.6 The deep depression moved northwest and came over the southern parts of
East Uttar Pradesh on the 12th morning with its centre close to Allahabad
(Fig. 7.5). Simultaneously the depression also intensified further. Pressures
fell by about 6 to 7 mb over southeast Uttar Pradesh. The maximum negative
pressure departure in the depression field was about 8 -cmb. The pressure at
the centre of the depression however remained nearly the same as on the previous

38
day (03Z). Thus the intensification* took place and the pressure gradient
increased in this case not on account of the pressure fall at the centre but
more due to pressure rise at the periphery of the depression. This feature
was brought out by the 24 hr. pressure change charts of 11th and 12th. ESSA 8
APT picture also reported the system as equivalent to Stage X Cat. 2. The
cyclonic circulation extended to 400 mb. In the lower troposphere the winds55
reached a maximum of about 45 kts (Fig. 7.6). while rainfall decreased in
Bihar Plateau, it increased considerably in East Uttar Pradesh where monsoon
became strong. Allahabad reported 10 cm, Varanasi 8 cm, Rewa 9 cm andintensification
Sidhi 20 cm. The of the depression and the heavy rains seem. tobe due to the system coming under an upper tropospheric anticyclonic vortex
(vicie para 7.9 for further discussion on this point).
7.7 The deep depression moved further northwest and was centred between
Lucknow and Kanpur on the morning of 13th (Fig. 7.7). The 24 hr. pressure
fall near the depression centre was about 9 mb and the pressure departure was
- 11 mb. The cyclonic circulation extended to 400 mb. The monsoon became
vigorous in East Uttar Pradesh with very heavy falls of the order 11 to 16 cm
at some places. Rainfall was also widespread over southwest Uttar Pradesh
where isolated rather heavy rains occurred. Monsoon was weak in Bihar State
and the rest of Uttar Pradesh.
7.8 After this, the deep depression made a loop and moved eastwards very
slowly; at the same time it was also gradually weakening. On 17th it came
to Bihar Plains and adjoining East Uttar Pradesh as a depression. By 18th it
* The terms 'intensification' (and its opposite 'weakening') and 'deepening'(and its opposite 'filling') though often used synonymously, have distinctlydifferent meanings. The former set of terms refers to the changes in thegradient, while the latter set of terms to the central pressure or height.Clear definitions of these terms have been given by Petterssen and Saucier(vide W.J. Saucier's - Principles of Meteorological Analysis pages 218-219and :S. Petterssen's - Weather Analysis and Forecasting Vol.1, pages 50-51).

39
weakened into low pressure area over Bihar and persisted on the 19th with little
movement. By 20th it became unimportant. Due to the depression, the monsoon
was vigorous in East Uttar Pradesh till the 17th. When it moved eastwards the
monsoon activity increased in Bihar Plains by 16th and remained strong till
19th. With the weakening of the system, the monsoon weakened over the whole of
Uttar Pradesh and Bihar by 20th. Very heavy rainfall amounts of the order of
15 to 25 cm were reported from East Uttar Pradesh between 13th and 17th.
7.9 The middle and upper tropospheric flow patterns appeared to give someintensification
indications of the of the depression over Uttar Pradesh on 12th, and
its subsequent slow eastward movement. Between 12th and 17th two troughs in
westerlies moved quickly across Western Himalayas in the middle troposphere.
The first moved across Jammu and Kashmir on 12th and the second on 15th
(Fig. 7.8). After the passage of the first trough, in the rear, there was a
shift of the anticyclone southwards to southern portions of Pakistan and West
Rajasthan at the middle tropospheric levels. The westerly flow was rather pre-
dominant. The upper air circulation associated with the deep depression appa-
rently came under the influence of the westerly trough and the depression took
a sharp turn eastward on 14th (Fig. 7.9). The shift of the middle tropospheric
anticyclone to the southern portions of Pakistan and Rajasthan also blocked any
westward movement of the depression. In the upper troposphere, the sub-tropical
ridge line was passing more or less over the depression area. On some charts,
an anticyclone could also be drawn in the upper troposphere over the depression
area, as for instance on 12th. Available temperature observations also sugges-
ted that the 'high' was a warm region. The superposition of the warm anticyclo-
nic vortex over the depression was perhaps responsible for intensification of
the system over Uttar Pradesh on 12th. The area of the depression was generally
colder compared to the surroundings in the lower troposphere and warmer in the
upper troposphere. However, when the depression moved eastwards and weakened,
the warmest area in the upper troposphere was no longer over the depression area.
40
7.10 Between the 12th and 14th evening, the depression was centred within
about 100 km of Lucknow. The composite of 5 radiosonde ascents at Lucknow
during this period is given in Fig. 7.10. This curve represents the mean con-
ditions at the centre of the depression. The lapse rate is almost saturated
adiabatic throughout, except for a relatively stable layer in the middle tro-
posphere whose significance is not clear. The curve is nearly similar to the
mean active monsoon curve (Fig. 2 . 4 ) except for the stable layer and the
slightly higher moisture content. Another feature of the depression was
that the associated circulation was very nearly vertical and did not show any
significant tilt with height, particularly when the depression was deep. The
tephigram for Calcutta for 9th (00Z) is also given in Fig. 7.11. On this day,
the deep depression was close to Calcutta. On comparing this tephigram with
the composite tephigram for Lucknow (Fig. 7.10.), we find a close similarity
between the two, except for the slight decrease in lapse rate between 650 mb
and 550 mb in Lucknow Tephigram. Another interesting feature is the extreme
dryness above 400 mb. The mean dew point curve for Lucknow does not extend
beyond 550 mb; on one day (l4th morning), when the dew point values were
available over Lucknow at 450 mb, it also suggested a tendency for decrease in
humidity above 500 mb.
7.11 To sum up, the following main features may be noted:-
i.) The depression was noteworthy forintensification
a) the that took place over land
b) the slow movement and recurvature
c) the continuous spell of heavy to very heavy rains (for about a week)
in East Uttar Pradesh while it was moving slowly over the area and
d) the effect of the middle and upper tropospheric flow patterns on the
surface system
i:.) When the depression was over north Bay of Bengal, the lower tropospheric
winds were mainly northwesterly over Bihar and East Uttar Pradesh and

41
generally dry weather prevailed over these sub-divisions.
iii) As the depression moved in a northwesterly direction, the easterlies
penetrated into Bihar and thence into Uttar Pradesh replacing the north-
westerlies and rainfall also commenced over the sub—divisions.
iv) While the depression was moving westwards across Bihar Plateau, it caused
vigorous monsoon there for two days. However, Bihar Plains experienced
only normal monsoon on these days.
v) As generally happens during the late monsoon period, the depression took
a northwesterly course and moved by 12th into East Uttar Pradesh where a
intensification it
rapid of the system took place, as came under an upper tropos-
pheric warm anticyclone,
vi) The movement of the two westerly troughs across the Western Himalayas
(later presumably over Tibet) and the shift southward of the mid-tropos-
pheric anticyclone over Pakistan and West Rajasthan were perhaps respon-
sible for the sharp change in the track of the depression. The 24 hr.
pressure change charts also gave some indications of the eastward move--
ment.
vii) The slow movement and the loop in the track occurred when the depression
was in a region of weak upper tropospheric flow (i.e. a ridge line). Sub-
sequently, when the westerlies predominated in the middle and upper tro-
posphere, the depression moved east. Such a loop in the track and the slow
eastward movement of depressions are rare.
viii)The diameter of the outermost closed isobar hardly exceeded 4 to 5 degrees
of lat./long. Depressions of the late monsoon season are usually charac-
terised by their small extent and intense rainfall over limited area. The
present case is a good example of this type.
8. Low Pressure Areas
8.1 In this section, we will discuss two cases of low pressure areas,
i) which travelled from Bangla Desh to West Uttar Pradesh and was seen both on

42
the surface and upper air charts and
ii)which moved from Bihar to Rajasthan mainly as an upper air low
8.2 (i) Low pressure area moving westwards from Bangla Desh toWest Uttar Pradesh - 19 to 24 August 1969
8.2.1 A depression from the Bay of Bengal which was centred near Jhansi
on 16 August 1969, moved in a northeasterly direction, weakened into a low
pressure area and lay over south Uttar Pradesh on the morning of 17th.
Continuing its northeasterly track, it weakened further and merged into the
seasonal monsoon trough the next day. In association with this, the axis of
the monsoon trough shifted northwards and on the morning of 18th, it was run-
ning on the surface chart through Ferozpur, Hardoi, Patna and thence east-
southeastwards towards Bangla Desh. The satellite picture showed heavy
clouding to the north of the trough line, with very little clouding to the
south. At the same time a low was also moving westwards across north Burmaand adjacent states
into Assam and Bangla Desh in the middle troposphere.
8.2.2 By 19th morning, the western end of the axis of the seasonal trough
shifted to the foot-hills (Fig. 8.1). The low from the east in the middle
troposphere, also extended downwards and a low pressure area formed over theand Meghalaya
northern parts of Bangla Desh and the adjoining north Bengal and Assam/on the
sea level chart. Associated with these developments, there was very goodand adjacent states
monsoon activity from West Uttar Pradesh to Assam and Bangla Desh.
8.2.3 The low pressure area persisted on the 20th more or less over the
same area and was well-marked extending from sea level upto nearly 400 mb
with a southeastward titt with height above 700 mb towards the cold air
(Fig. 8.2). Though pressures were slightly falling, the departures were
positive over the area of the low pressure system. The western end of the
axis of the monsoon trough continued to be close to the foot hills. Under
the combined influence of the seasonal trough and the low pressure area,
monsoon was vigorous in East Uttar Pradesh and active in Bihar Plains.

43
In West Uttar Pradesh, the rainfall was in and near the hills;
in East Uttar Pradesh also
the significant amounts of rainfall were in northern divisions. Satellite
pictures for 19th and 20th indicated heavy clouding over the Gangetic Plains
mainly to the east of 80°E, with almost clear skies to the west, though the
axis of the monsoon trough was close to the Himalayas over its entire length
from West Uttar Pradesh to Assam. This satellite information could be advanta-
geously utilised to forecast no significant weather to the west of 80°E.
Very heavy falls in Bahraich-Kheri areas (in East Uttar Pradesh) - Bahraich
39 cm and Kheri 24 cm - seems to have been due to a meso-scale low level
vortex over the area, the only indications of which were provided by the cumuli-
form bands in the Nimbus APT picture. The winds at Gorakhpur, Lucknow and
Allahabad at 0.3 km, at 00Z also indicated a possible circulation over the
area.
8.2.4 The general synoptic situation continued without any significant
change over Uttar Pradesh and Bihar on the 21st also. The monsoon was active
in East Uttar Pradesh and the heaviest falls (though much less compared to the
previous day) were near about the same area as on 20th. Monsoon was active in
Bihar Plains also.
8.2.5 The low pressure area moved westwards to Bihar Plains and adjoining
East Uttar Pradesh on 22nd morning (Fig. 8.3). The cyclonic circulation exten-
ded to about 500 mb with a slight slope towards southeast (Fig. 8.4). At
500 mb level temperatures were lower towards southeast of the circulation. A
north-south oriented low level trough was also noticed extending southwards
from the low upto Coastal Andhra Pradesh. The western end of the monsoon
trough continued to be close to the foot-hills and the winds over Uttar Pradesh
(west of 83°E) veered to northwest. Rainfall decreased considerably in East
Uttar Pradesh. But monsoon was strong over Bihar State, even though there were

44
no heavy falls. The rainfall belt extended southwards upto Gangetic West
Bengal and Orissa.
8.2.6 The low moved to the central parts of Uttar Pradesh on 23rd morning
and also slightly weakened as indicated by the rising 24 hr. pressure changes
on 22nd morning. On the surface chart, only an odd-valued closed isobar
could be drawn to delineate the low pressure area. At 500 mb and 300 mb
levels, air was colder to the southwest of the circulation and the tilt of the
low was now towards southwest (Fig. 8.5). The north-south oriented trough
extending southwards from the low was also somewhat less marked. As the low
moved west, the eastern end of the axis of monsoon trough shifted northwards
towards Eastern Himalayas. With the approach of the low, rainfall increased
in Uttar Pradesh. The monsoon was active in Bihar Plains and East Uttar Pra-
desh. A few heavy to very heavy falls were reported over Lucknow and neighbour-
ing areas.
8.2.7 By 24th morning the low weakened further and moved westwards to West
Uttar Pradesh and neighbourhood. The low could hardly be noticed in the upper
air chart. The eastern end of the axis of the monsoon trough lay close to the
foot-hills, and light to moderate south/southwesterlies prevailed over north-
east India, East Uttar Pradesh and East Madhya Pradesh in the lower levels.
8.2.8 As the low moved to West Uttar Pradesh, monsoon continued strong in
West Uttar Pradesh - particularly the northern divisions where a few very heavy
falls also occurred. Rainfall decreased in East Uttar Pradesh and it was
generally light and isolated in Bihar.
8.2.9 As the system weakened further, weather became almost dry on 25th
over the plains of Bihar and Uttar Pradesh, though some rainfall continued in
Bihar Plateau and in and near the hills.
8.2.. 10 The significant features brought out in this case study are:

45
i) During this spell, rainfall was mostly over Bihar Plains and East Uttar
Pradesh. Bihar Plateau was least affected. The spell was in two parts -
earlier part due to the monsoon trough shifting northward and the later
and adjacent statespart due to the movement of the low from Assam and Bangla Desh to West
Uttar Pradesh. This aspect was better marked in Uttar Pradesh where there
was a distinct decrease in rainfall on 21st and 22nd, followed by an
increase on 23rd and 24th.
ii) The low travelled westwards across upper Burma along a relatively northern
and adjacent stateslatitude for the monsoon season and moved into Assam and the northern
divisions of Bangla Desh in the middle troposphere. Subsequently, it
extended downwards and was noticed on the surface chart as well as in the
lower tropospheric levels.
iii) Though initially the low was quasi-stationary, once it became well-
developed, it moved regularly westwards upto West Uttar Pradesh.
iv) The low pressure area was defined by a single closed isobar on the surface
chart. It extended from surface upto the mid-tropospheric levels. The
pressure departures during the period were high positives over India (in
over
general). There was a pressure rise around the low on 22nd morning and
during the next 24 hours the low weakened.
v) On 22nd and 23rd, a north-south oriented trough extended southwards from
the low and there was also rainfall to the east of the trough line.
vi) In the earlier stages, as an earlier low pressure area was moving in a
northerly direction across Uttar Pradesh and weakening, the western half
of the axis of the monsoon trough was shifting northwards across Uttar
Pradesh. Available data also suggest the passage of a trough in wester-
lies across the extreme north of the country between 20th and 2lst. This
might have also contributed to the shift of the western half of the axis
of monsoon trough towards the foot-hills. As a result strong to vigorous
monsoon prevailed over West Uttar Pradesh on 19th and over East Uttar Pra-
desh from 19 to 21st (The meso-scale vortex referred to in para 8.2.3,
46
locally enhanced the activity). Gradually the winds over Uttar Pradesh
(particularly west of 83°E) veered from southwest/west (on 18th evening) to
northwest (on 22nd morning) and the rainfall decreased in Uttar Pradesh.
However, it increased once again (on 23 and 24) as the low pressure area
from Bihar Plains moved westwards across Uttar Pradesh.
vii)Satellite pictures show that the heavy overcast clouding associated with
the 'low' was about 5° (lat./long.) across and particularly during the
second half of the period, there was little clouding over northern and
central India except the one associated with the low.
8.3 (ii) Upper air low moving from Bihar to Rajasthan and causing rainfallin Bihar and Uttar Pradesh - 1st to 4th August 1970
8.3.1 A low pressure area which formed over northeast Bay of Bengal on
25th July 1970 moved inland into north Orissa on 27th evening and merged into
the seasonal trough by the 29th. However, the low persisted in the upper air
between 850 mb and 500 mb over Bihar Plateau and adjoining Madhya Pradesh and
Uttar Pradesh. This upper air circulation was over Bihar State and adjoining
Gangetic West Bengal on the next two days, though its vertical extent was
progressively becoming less. It was seen in the lower troposphere from
surface upto 1.5 km on the 31st (Fig. 8.6).
8.3.2 On 1st August, the upper air low moved slightly west and was over
Bihar State, northeast Madhya Pradesh and adjoining East Uttar Pradesh. It
once again extended throughout the lower troposphere (upto 500 mb) with no
appreciable tilt with height (Fig. 8.7). The intensification of the upper
sir low was apparently due to the movement of an upper westerly trough across
Iibet with its southern end extending upto West Uttar Pradesh. However, on
the surface chart only the seasonal trough could be seen (Fig. 8.8). As the
upper air circulation became well-marked rainfall increased in Bihar State
and East Uttar Pradesh; monsoon became strong in East Uttar Pradesh and a very
number of stations reported rather heavy to heavy falls. Monsoon was only

47
normal in Bihar State. Over Plains of West Uttar Pradesh, however, there was a
general decrease of rainfall as the western end of axis of the seasonal trough
shifted northwards towards the foot-hills.
8.3.3 The upper air cyclonic circulation rapidly moved to southwest Uttar
Pradesh and adjoining southeast Uttar Pradesh by the evening and persisted
there the next morning (2nd) also (Fig. 8.9). It extended upto about 700 mb
only. Monsoon continued to be strong in East Uttar Pradesh with an isolated
heavy fall of 7 cm at Banda. The western end of the seasonal trough shifted
southwards and (at 0.9 km) it extended from southwest Uttar Pradesh to central
Bihar and thence into East Central Bay where a low was forming. However,
another trough line could also be seen from central Bihar to Arunachal Pradesh
and Assam (in this context refer to item (iii) of para 3.6.10). Apparently
due to the movement of the latter trough line across the sub-division, from
south Bihar on 1st to Central Bihar on 2nd monsoon became active in Bihar
Plains also.
8.3.4 On the morning of 3rd the upper air cyclonic circulation moved
further west and was over extreme West Uttar Pradesh and adjoining Rajasthan
and northwest Madhya Pradesh; it was seen upto 4.5 km, with a slight southwest-
ward tilt with height (Fig. 8.10). The axis of the monsoon trough continued
to be in more or less the same position as on the previous day over Uttar
Pradesh; it shifted slightly southward over Bihar. The other trough line was
running from East Uttar Pradesh to Arunachal Pradesh and Assam. As the upper
air circulation moved west, the monsoon activity decreased in East Uttar Pra-
desh. However, over Bihar it remained the same. West Uttar Pradesh continued
to have normal rainfall.
8.3.5 The circulation shifted further west to East Rajasthan on the morning
of 4th and also somewhat weakened. The trough line over Bihar Plains shifted
towards foot-hills. As a result, there was a general decrease of rainfall in

48
East Uttar Pradesh and Bihar where monsoon became weak. It continued to be
normal in West Uttar Pradesh. The main rainfall area due to the low was over
Rajasthan.
8.3.6 The significant features to be noted in the present case are:-
i) As the low from north Bay moved inland and merged into the seasonal trough,
it was no longer to be seen on the surface chart; however, in the upper
air, the cyclonic circulation persisted though it was progressively wea-
kening.
ii) The upper air circulation intensified on 1st August when it came over
Bihar Plateau and neighbourhood; the cause of the intensification appears
to be the movement of a westerly trough across Tibet extending southwards
upto West Uttar Pradesh. With the intensification of the system, rainfall'
increased in Bihar State and East Uttar Pradesh,, Central Bihar, South
Uttar Pradesh and northeast Madhya Pradesh are the favourable areas where
fresh lows develop or lows stagnate during the southwest monsoon season.
In this particular case, an existing upper air cyclonic circulation
intensified when it came over this area.
iii) The upper air circulation progressively moved from Bihar to East Rajasthan
between 1st and 4th August. During this period, there was no evidence of
a corresponding surface low except on one or two charts. The pressure
departures also remained mostly positive. Pressure changes also were not
very significant.
iv) While the main seasonal trough was passing through south Uttar Pradesh and
central Bihar into the north Bay, there was simultaneously another trough
line from Central Bihar to Arunachal Pradesh and Assam in the lower tropos-
phere on 2nd which gradually shifted north to the submontane districts of
Bihar on 4th. This shift of the trough line across Bihar prolonged the
spell of rainfall, even after the upper air low moved west of this sub-
division.
49
v) During this spell, strong monsoon conditions prevailed over Bihar Plains
and East Uttar Pradesh between 1st and 3rd. In the other two sub-divisions,
the activity was normal. The rainfall decreased appreciably over Bihar
State and East Uttar Pradesh by 4th and over West Uttar Pradesh by 5th.
9. Rainfall associated with the shift in the position of the monsoontrough over Uttar Pradesh and Bihar
9.1 The mean position of the monsoon trough on the surface chart and in the
low levels, during the mid-monsoon season, is from Haryana and adjoining Rajas-
than to the head Bay of Bengal across extreme north Madhya Pradesh and Bihar
Plateau. But due to development of low pressure systems in the trough and
their movement or the influence of disturbances in middle latitude westerlies,
the position of the seasonal monsoon trough undergoes marked changes. For
example, the formation of a low or depression over the Bay of Bengal is prece-
ded by a general shift of the monsoon trough to a southerly latitude and the
extension of the eastern end into the Bay. Sometimes the eastern half of the
trough alone may shift south while the western end may remain north or may not
undergo any change from its normal position. On other occasions, for example,
when a depression or a low has moved into Western India and no fresh low has
formed in the Bay, the eastern end may shift north to the foot-hills of the
Himalayas, while the western end may be far south. Similarly the monsoon
trough may also shift north under the influence of a disturbance in the middle
latitude westerlies. When a depression or a low is forming over head Bay, the
axis of the trough may run across southeast Uttar Pradesh and Bihar Plateau to
north Bay and rainfall may occur in and near trough line over southeast Uttar
Pradesh and Bihar Plateau. However, there are a few instances when the rain-
fall extends further west also into West Uttar Pradesh along and near the
trough line. In such cases, it is generally found that the activity along the
western end of the trough over West Uttar Pradesh is triggered off by the
influence of systems in middle latitude westerlies.
50
9.2 An extreme case is when the entire trough shifts north and runs across
north Uttar Pradesh and Bihar Plains. Such a shift need not necessarily
always result in a 'break'. There are cases of good monsoon activity over the
Plains of Uttar Pradesh and Bihar under such synoptic conditions. A case of
this type will be discussed later (7-10 July 1967 case in para 10.4).
9.3 In this section, two types of situations are illustrated.
i) the western end of the monsoon trough shifting north while the eastern end
remains over north Bay
ii) eastern end of the monsoon trough first shifting north and the western
end later
9.4 Western end of Monsoon Trough shiftingtowards foot -h i l l s while eastern endremains over north Bay of Bengal
- 23 to 27 July 1966
9.4.1 A low pressure area from the Bay moved inland and lay over south
Orissa and adjoining parts of Andhra Pradesh and Madhya Pradesh on 23 July 1966
(Fig. 9.1). The associated upper air cyclonic circulation extended upto about
3.6 km (Fig. 9.2). The axis of the monsoon trough was well south of its
ncrmal position and it was running on the surface and 0.9 km a.s.l. from
Bikaner to Jhansi and thence southeastwards to the centre of the low. The
trough was also sloping south with height. The rainfall on this day was mainly
tc the south of the surface trough line and monsoon was weak over Bihar State
and East Uttar Pradesh. West Uttar Pradesh had normal monsoon.
9.4.2 By 24th, the low shifted slightly westwards and weakened, although a
feeble cyclonic circulation could still be seen between 850 mb and 600 mb
levels. Weather was practically dry over all the four sub-divisions. The
western end of the monsoon trough now showed a slight shift to the north and
its axis at 0.9 km a.s.l. was passing through Ferozepur, Nowgong and Puri.
9.4.3 During the subsequent 24 hrs. marked changes took place. A trough

51
in the middle latitude westerlies was seen over Russian Turkistan on 25th
morning. Apparently under its influence, the western end of the monsoon trough
shifted close to the foot-hills of the Himalayas. However, the eastern end
continued to remain in a southerly position due to the development of a fresh
low over Northwest and adjoining West Central Bay off Orissa coast (Fig. 9.3).
The axis of the monsoon trough at 0.9 km a.s.l. was passing through Dehra Dun,
Kanpur, Raipur and thence to the centre of the low (Fig. 9.4). The shift of
the axis of the monsoon trough to Western Himalayas and the approach of the
westerly trough led to a spurt of heavy rainfall in the Western Himalayas.
Monsoon became vigorous over West Uttar Pradesh, with Dehra Dun reporting 39 cm
of rain, Roorkee 24 cm and Najibabad 11 cm. Bihar continued to be dry as also
East Uttar Pradesh, excepting the extreme western parts.
9.4.4 By 26th, the low pressure area moved into Orissa and East Madhya
Pradesh (Fig. 9.5). The westerly trough apparently extended south to Western
Tibet as it moved eastwards. An upper air cyclonic circulation extending upto
3.6 km a.s.l. was also noticed over northwest Uttar Pradesh and neighbourhood
(Fig. 9.6): this was presumably induced by the westerly trough. On this day
the axis of the monsoon trough at 0.9 km a.s.l. was passing through Meerut,
Umaria, Jharsuguda and thence eastwards to Calcutta. Monsoon was active over
West Uttar Pradesh the rainfall being mostly in and near the hills. Rainfall
increased in East Uttar Pradesh mainly in the northern districts. Monsoon con-
tinued to be weak in Bihar State.
9.4.5 The low pressure area extended into the Northwest Bay and was
becoming marked on 27th (Fig. 9.7). Mark the significant pressure falls and
negative pressure departures from normal over north Bay. The upper air low
over northwest Uttar Pradesh and neighbourhood moved eastwards across the Wes-
tern Himalayas and the monsoon trough also shifted eastward across the plains
erf East Uttar Pradesh and northeast Madhya Pradesh (Fig. 9.8). These resulted
in an increase in rainfall over East Uttar Pradesh and monsoon became strong

52
over this sub-division. There was also a general decrease of rainfall over
West Uttar Pradesh where monsoon became normal. Weak monsoon conditions con-
tinued over Bihar on this day also.
-9.4.6 By 28th the low intensified into a depression over the Northwest Bay
and the situation thereafter is not relevant to the present discussion.
9.4.7 The important features to be noted in this case are:
i) A trough in the middle latitude westerlies moved from Afghanistan to
Western Himalayas across the extreme northern parts of the country between
24th and 26th. Under its influence, the western end of the monsoon trough
shifted north to the foot-hills of Himalayas. The eastern end continued
to remain in a southerly position due to development of low pressure
systems over Orissa and adjoining Bay.
ii) Monsoon activity increased over West Uttar Pradesh as the seasonal
monsoon trough shifted north and it was strong to vigorous on two days
(25th and 26th).
iii) The shift of the axis of the monsoon trough across north Uttar Pradesh
was preceded by the formation of an induced cyclonic circulation over
northwest Uttar Pradesh and neighbourhood and its movement northeastwards
(in this connection refer to para 3.6.3 of FMU Rep. No.III-3.3). The
combined effect of these systems (viz. westerly trough, induced cyclonic
circulation and the shift of the axis of the monsoon trough) resulted
in heavy to very heavy falls over the northern parts of Uttar Pradesh
between 25th and 27th.
9.5 Monsoon trough shifting north at its eastern end first andat the western end later - 15 to 18 August 1969
9.5.1 A cyclonic storm which developed over the Northwest Bay of Bengal
on 13 August 1969 moved westnorthwestwards, crossed north Orissa coast and lay
centred close to Rewa on the morning of 15th. It weakened progressively and
lay as a depression centred between Satna and Banda at 12Z. On the morning
53
of 14th, upper winds over Assam were light easterlies in the lower troposphere
and they changed to southwesterlies by the evening, from which it could be
inferred that the eastern end of the axis of monsoon trough had shifted
towards foot-hills across Assam. But the trough line could not be clearly
delineated on the surface chart. However, by the 15th evening, the eastern half
of the axis of the trough could be located, running from Gaya to Dibrugarh on
the surface chart also and the western portion of the axis of the trough was
running from central parts of Pakistan to northwest Madhya Pradesh across cen-
tral Rajasthan. Monsoon was normal over Bihar and Uttar Pradesh on 15th morn-
ing. Rainfall activity was poor over the northern parts of Bihar Plains and of
East Uttar Pradesh. Heavy rainfall due to the depression was over Madhya Pra-
desh. Nimbus 3 picture for the day showed that the clouding over Uttar Pradesh
and Bihar was composed of cumuli form bands on the northern sectors of the
depression. Rainfall over the northern portions of West Uttar Pradesh was appa-
rently due to the presence of a 'low' in the lower troposphere over central
parts of Pakistan.
9.5.2 The depression moved to northwest Madhya Pradesh by 16th and was
centred near Guna that morning (Fig. 9.9). As the depression moved further
westwards, the eastern half of the monsoon trough shifted further north and its
axis at surface as well in the lower tropo-phere was running from the centre of
the depression across East Uttar pradesh and Bihar Plains to the foot of the
Himalayas in Assam and Arunachal Pradesh. There was no significant change in
the position of the western half of the trough. The cyclonic circulation over
central parts of Pakistan and neighbourhood continued to be well-marked
(Fig. 9.10). On this day there was a marked decrease of rainfall in Bihar
Plateau and an increase over West Uttar Pradesh and the monsoon became strong
to this sub—division mainly in the northern districts. It was apparently due
to the low over Pakistan and the adjoining areas. Isolated heavy rains occurred
in Bihar Plains. The main area of rainfall due to the depression was over
West Madhya Pradesh and Gujarat Region.

54
9.5.3 By 17th the depression weakened further and lay as a low pressure
area over the central parts of Uttar Pradesh (Fig. 9.11). The cyclonic circula-
tion over central parts of Pakistan and neighbourhood also weakened (Fig. 9.12).
A further northward shift of the monsoon trough could be noticed over East Uttar
Pradesh and Bihar Plains, whereas the western half of the trough continued in
the same position across Rajasthan. In the lower troposphere, the winds over
northeast India south of 25°N strengthened resulting in a greater cyclonic
shear in and near the monsoon trough zone. As a result, there was a general
increase in Bainfall from Assam to Bihar Plains and monsoon was strong to
Bihar Plains. Rainfall was mainly in the northern districts of Bihar Plains.
However, rainfall decreased in West Uttar Pradesh; monsoon was weak in
Uttar Pradesh and Bihar Plateau.
9.5.4 With the further northeastward movement of the low towards northeast
Uttar Pradesh, the western half of the monsoon trough also shifted to the
foot-hills of the Himalayas and on 18th the entire monsoon trough lay close
to the foot of the Himalayas (Figs. 9.13 and 9.14). Nimbus picture showed
the heavy clouding associated with the northward shift of the trough, exten-
ding all along from West Uttar Pradesh to Assam and adjatent States. As the
entire length of the trough shifted towards the foot-hills, rainfall increased
all over the Gangetic Plains with rather heavy to very heavy rainfall at many
places. Monsoon was active in West Uttar Pradesh and Bihar Plains. Over
East Uttar Pradesh there was an increase in rainfall. But monsoon continued
to be weak over Bihar Plateau.
9.5.5 By the 19th morning the eastern end of the axis of the trough
corrmenced to shift southwards with the formation of a low over Bangla Desh
and adjoining areas. The western end, however, remained close to foot-hills.
The monsoon was active over West Uttar Pradesh, East Uttar Pradesh and Bihar
Plains. There were some heavy to very heavy falls in the northern districts
of Uttar Pradesh west of 82°E and in Bihar Plains. As the trough began to
55
shift south, rainfall increased in Bihar Plateau also and an isolated heavy
fall of 9 cm was reported from Naya Dumka. Further sequence of weather is not
followed as it is not relevant to the present discussion. However, it has
been dealt with in Sec. 8.2.
9.5.6 The main features to be noted in the present case are:
i) This is a typical case of monsoon activity over Uttar Pradesh and Bihar
Plains that occurs as the monsoon trough shifts north, in the wake of a
depression. In this case the shift did not last long as another low
formed over Bangla Desh by 19th.
ii) In the absence of development of any fresh disturbance over the head Bay
after the cyclonic storm crossed coast, the eastern part of the monsoon
trough shifted north first. The shift was fairly rapid and the trough at
its extreme eastern end shifted north to Assam. Subsequently the trough
shifted north to Sub-Himalayan West Bengal, Bihar Plains and northeast
Uttar Pradesh in a progressive manner. The western half, however, con-
tinued to remain in a southerly latitude as long as the depression/low,
was moving westnorthwestwards; the western half also shifted north, as the
weakening low moved finally towards north/northeast. The abrupt weakening
of the monsoon over Bihar Plateau on 15th and the commencement of strong
monsoon activity over Bihar Plains immediately thereafter were associated
with the northward shift of the eastern half of the monsoon trough. The
monsoon activity increased later in Uttar Pradesh as the low and the wes-
tern half of the monsoon trough shifted north.
iii) The northward movement of low/depression as well as the shift of the axis
of monsoon trough towards the Himalayas is generally associated with
middle latitude systems moving across the extreme north of India. In this
case, extended area charts showed that between 14th and 16th a westerly
trough (though not very well-marked), moved from Jammu Kashmir to north-
east Tibet. This was noticed only at the 500 mb level. At 300 mb level
56
there was no indication of the trough, as a well-marked anticyclone lay over
tibet. However, the satellite pictures showed the movement of a northeast-
southwest oriented cloud band (somewhat like a feeble frontal system) across
Tibet and Himalayas, lending support to the existence of the trough. The
lower tropospheric circulation over central parts of Pakistan and neighbour-
hood, had apparently been induced by this moving trough.
ii)An interesting feature of the upper tropospheric circulation between 17th and
19th, was that the upper winds over the Gangetic Plains (represented by
Gauhati, Lucknow and Delhi) became north/northeasterly (speed of the order
20/30 kt) at the 300 mb and 200 mb levels. The air over the Tibetan Plateau
being warmer, an advection of warm air at these levels over the Gangetic
Plains was indicated. By 20th the northerly flow became less pronounced.
v) The satellite pictures during the period were very helpful in understanding
the sequence of the weather development over Uttar Pradesh and Bihar. In
the initial stages when the depression was to the south of Uttar Pradesh,
clouds over Uttar Pradesh and Bihar were mainly CuF bands and later towards
the end when the axis of the monsoon trough shifted north, the entire area
became overcast with thick heavy clouds. These changes in the cloud
patterns and form are helpful in predicting the type, intensity and duration
of the precipitation. They are also a great aid for aviation forecasts
wherein clouds across the track have to be indicated.
10. Systems in Westerlies causing increase in monsoonactivity over Uttar Pradesh and Bihar
In contrast10.1. to the low pressure areas and depressions which move from
east to west and cause weather over Uttar Pradesh and Bihar, there are also a
few synoptic systems which move in the opposite direction, from west to east*,
across the Gangetic Plains, Madhya Pradesh and Orissa causing increased
* There have been some rare cases of north-south troughs moving from east towest, as for instance the case discussed in Section 6.3 of FMU Rep. No.III-3.2.

57
monsoon activity. Such systems are noticed usually when the monsoon trough is
towards the foot-hills of the Himalayas and the easterlies over the Gangetic
Plains are practically absent with westerlies predominating over the whole of
Indian sub-continent in the lower and middle troposphere.
10.2 The general features of these disturbances in westerlies causing
weather over Uttar Pradesh and Bihar have already been discussed in Section 3.7.
In this section we will discuss the following three types of situations:-
i) upper air low moving eastwards across Uttar Pradesh and Bihar,
ii) middle latitude westerly trough which while moving eastwards extended
southwards upto Uttar Pradesh and Bihar
iii) middle latitude westerly trough extending southwards to West Uttar Pradesh
and inducing a low there.
10.3 (i) Upper air low moving eastwards across Uttar Pradesh and Bihar
- 20 to 24 July, 1968
10.3.1 In Section 8.4 of FMU Rep. No. III-3.4 the effect of a north-south
oriented trough with an upper air cyclonic circulation to the north, was dis-
cussed so far as it affected the rainfall activity over Madhya Pradesh and
Vidharba. In this section the same case is presented, with particular reference
to the upper air low and the consequent monsoon activity over Uttar Pradesh
and Bihar.
10.3.2 On 20 July 1968 a trough in the middle latitude westerlies was
extending from a low lying over central USSR near 57°N 82°E to Afghanistan,
northern divisions of Pakistan and adjoining northwest India (Fig. 10.1).
Under its influence, a cyclonic circulation developed over northwest Rajasthan,
Punjab and adjoining Pakistan in the lower troposphere*. A north-south oriented
trough also could be noticed at some levels in the lower troposphere, extending
* For charts discussed in this section also refer to Figs. 8.4.1 to 8.4.7 ofFMU Rep. No. III-3.4.

58
from the cyclonic circulation southeastwards to West Madhya Pradesh. On this
day, the eastern end of the monsoon trough was north of its mean position,
running from Arunachal Pradesh to south Uttar Pradesh across Bihar Plains.
Monsoon was weak in Bihar and East Uttar Pradesh and normal in West Uttar Pra-
desh.
10.3.3 The westerly trough moved across the Western Himalayas to West
Tibet by 21st and along with it, the upper air low also shifted eastwards to
Punjab-Haryana and adjoining parts of West Uttar Pradesh. The axis pf the
monsoon trough shifted north particularly over Uttar Pradesh and there was an
appreciable increase in rainfall over Uttar Pradesh and Bihar. Monsoon became
strong over Bihar Plains and normal over East Uttar Pradesh; West Uttar Pradesh
continued to have normal monsoon activity on this day also. However, a few very
heavy falls were reported from West Uttar Pradesh hills. Some moderate to
heavy falls also occurred in Bihar Plains.
10.3.4 By 22nd the upper air low moved eastwards to northern portions of
Uttar Pradesh between 80°E to 85°E, and appeared to have weakened somewhat,
while the north-south trough was extending from the low southwards upto
Vidarbha; it was seen upto mid-troposphere. In the upper troposphere, the
westerly trough to the north, remained nearly stationary over Western Himalayas,
The western half of the monsoon trough also shifted further north and the entire
trough was close to the foot of the Himalayas. Rainfall increased further over
East Uttar Pradesh and Bihar Plains where monsoon was strong with heavy to very
heavy falls, upto 11 cm at some stations. Satellite (ESSA 6) pictures for
22nd showed
i) the cloud system associated with the extra-tropical system extending upto
Western Himalayas, Punjab and Haryana
ii) heavy clouding from Uttar Pradesh to Assam and adjoining areas due to the
monsoon trough and

59
iii) southward extension of clouds upto Madhya Pradesh associated with the
north-south trough.
10.3.5 While the main cyclonic circulation to the north weakened further,
the north-south trough shifted further east and extended from East Uttar Pradesh
to southeast Madhya Pradesh and Orissa on 23rd. On this day, the main rainfall
area was the eastern parts of East Uttar Pradesh and adjoining Bihar. Rainfall
also extended to Bihar Plateau where monsoon became normal. By this time,
another upper air low was developing over Pakistan and adjoining northwest India
and the good thundershower activity over West Uttar Pradesh was apparently due
to this. Over East Uttar Pradesh and Bihar Plains monsoon continued to be
strong though there was a decrease in rainfall since the previous day. Gorakh-
pur recorded a very heavy fall of 17 cm of rain.
10.3.6 With a further slight eastward shift of the north-south trough on
24th, the flow pattern changed and the eastern half of the monsoon trough re-
established itself in a more southerly position extending into the Northwest
Bay where a depression developed subsequently. Consequently the monsoon acti-
vity decreased over East Uttar Pradesh and Bihar Plains, while it was maintained
over Bihar Plateau.
10.3.7 To sum up, the salient features in this case are:-
i) The main synoptic feature that caused this spell of rainfall over Uttar
Pradesh and Bihar was an upper air low which developed over the northern
divisions of Pakistan and adjoining northwest India under the influence of
a middle latitude westerly trough and moved eastwards across extreme north
Uttar Pradesh. In the later stage, the low weakened and the north-south
trough continued to move eastwards upto the north Bay culminating in the
formation of a depression. The formation and the movement of the low was
accompanied by an almost complete disappearance of easterlies in the lower
troposphere over the Gangetic Plains and the shift of the seasonal monsoon
60
trough towards north. The axis of the monsoon trough (particularly on 21st
and 22nd) was over the plains of Uttar Pradesh on the surface isobaric
chart; however, in the lower tropospheric levels, the trough was further
north and above 850 mb level, it was close to the foot hills with no eas-
terlies over the Gangetic Plains and the north-south trough was the main
feature of the charts. In this case, we note the northward slope of the
trough line with height in the lower troposphere (from surface upwards)
ii)As the system was moving eastward, there was a regular eastward progres-
sion of the heavy rainfall belt across Uttar Pradesh and Bihar Plains and
an improvement of weather in the rear. Rainfall also extended southwards,
as far as Vidarbha.
iii) This system was essentially an upper air feature (in the lower and middle
troposphere); it was not apparent on the surface isobaric chart nor in
the pressure change and departure fields.
10.4 (ii) Influence of a westerly trough in enhancing themonsoon activity over Bihar and Uttar Pradesh
during 'break' monsoon conditions- 7 to 10 July 1967
10.4.1 This Case has been dealt with in Sec. 8.3 of FMU Rep. No.III-3.3
while discussing the effect of westerly troughs over northwest India during
the monsoon season. The same westerly trough moving across Tibet affected the
extreme northern parts of Uttar Pradesh and Bihar and is briefly discussed in
arethis section. Figures are already given in FMU Rep, No.III-3.3 and hence the
not reproduced here. They may be referred to, wherever necessary.
10.4.2 The eastern half of the monsoon trough, which was in near normal
position on 4 July 1967, shifted northwards and by 6th was close to the foot
of the Himalayas from East Uttar Pradesh to Assam and Arunachal Pradesh across
Bihar Plains. As this happened, there was some increase in the rainfall
activity over these areas, monsoon becoming strong in Bihar Plains on 5th and
in East Uttar Pradesh on 6th. Later the activity decreased. At this time

61
(i.e. on 6th) a westerly trough moved to the Western Himalayas and on 7th it was
over western Tibet. The earlier vigorous activity of the monsoon over West
Uttar Pradesh on 4th and 5th could be attributed to the combined influence of
the upper westerly trough and a low pressure area which formed on 5th over
Haryana and adjoining areas. The westerly trough was extending from central
Tibet to Bihar Plateau on 8th to 10th and weakened off by llth. As the low wea-
kened and the westerly trough moved away eastwards to Tibet, weather over West
Uttar Pradesh improved progressively from 6th. Rainfall completely ceased in
the plain of West Uttar Pradesh after 8th as the westerly trough moved away;
however, it continued in and near the hills, as the monsoon trough was close to
foot-hills. On the other hand, monsoon activity was maintained over the other
sub-divisions. Over East Uttar Pradesh the monsoon was normal from 7th to 9th
with widespread rainfall on 8th. Over Bihar Plains, the activity was more pro-
nounced with strong monsoon activity on 9th. Even over Bihar Plateau, the
weak monsoon conditions were disrupted on one day i.e. on 9th when there was
normal monsoon activity. By 10th rainfall decreased in East Uttar Pradesh also
and it continued in Bihar Plains on 10th and llth.
10.4.3 The main features to be noted in this case are:-
i) This case is illustrative of southward penetration of the systems in
middle latitude westerlies even upto the Gangetic Plains. Between 8th and
10th, the trough could be seen southwards upto Bihar Plateau in the upper
troposphere (300 mb).
ii) Unlike the case discussed in the previous section, the monsoon westerlies
over the Gangetic Plains in the lower troposphere were very strong:
(40-50 kts) in the present case with no trough (north-south) in them.
Only the mid-latitude upper westerly trough caused increased rainfall,
with a few heavy to very heavy falls in the northern parts.
iii) 'Break' monsoon features were noticed during the period (7-10) both in the
surface pressure and lower tropospheric upper wind fields. But the rain-
62
fall was not confined to the foot-hills but extended well southwards into
Gangetic Plain as the upper westerly trough extend upto 25°N. However, as
the westerly trough moved eastwards, in its rear, the rainfall was mainly
in the foot-hills and the plains had no rain.
10.5 (iii) Trough in westerlies which induced a low over West UttarPradesh, causing active monsoon in Uttar Pradesh and Bihar
- 23 to 27 August 1967
10.5.1 In this section, we will discuss a sequence of weather over Uttar
Pradesh and Bihar caused by three synoptic systems which were closely inter-
related and mutually inter-acting. These systems were (i) a middle latitude
westerly trough extending into northwest India, (ii) a low pressure area embed-
dec in the monsoon trough and (iii) the seasonal monsoon trough fluctuating in
position and intensity from day-to-day. During this spell the rainfall in
Bihar Plains and Uttar Pradesh was in large excess.
10.5.2 On the morning of 22 August 1967 a trough in middle latitude wester-
lies was observed between 500 mb and 200 mb extending from Kazakh to Afghanistan
and northern divisions of Pakistan with its axis roughly along 70°E. It per-
sisted on the next morning (23rd) with a very slight eastward movement (Fig.10.2).
On this day (23rd) the axis of the seasonal monsoon trough was passing through
Ferozpur, Meerut, Sidhi, Ranchi and Saugar Island on the sea level chart and a
low pressure area embedded in the monsoon trough was over Bihar Plateau and
adjoining areas. The monsoon was active in West Uttar Pradesh and adjoining
East Uttar Pradesh through which the axis of the trough was running. Elsewhere
over Uttar Pradesh and in Bihar, there was no significant weather, as the
weather was confined mostly to the south of the trough line, in the eastern
portion of the trough.
10.5.3 On the morning of 24th, the westerly trough moved slightly east-
wards and the 'high' in the rear was prominent over Iran and Pakistan(Fig.l0.3).
The low over Bihar Plateau moved to southwest Uttar Pradesh, weakened and
63
merged into the seasonal trough whose axis was passing from Churu to Allahabad
and thence towards Gangetic West Bengal (Fig. 10.4 and 10.5). As a result of
the movement of the low pressure area towards Uttar Pradesh and also the
presence of the seasonal trough over the area, monsoon became active in the
whole of Uttar Pradesh. Heavy to very heavy falls occurred over and near Wes-
tern Himalayas apparently due to the effect of the westerly trough. Note the
southeast winds over West Uttar Pradesh and Punjab in the lower troposphere andin
recall the discussion/para 3.7.2. Presumably as an effect of the passage of the
westerly trough, the seasonal low over Pakistan (on the surface chart) became
well-marked and convective activity was reported from Afghanistan and northern
divisions of Pakistan on 24th evening.
10.5.4 On the morning of 25th (Fig. 10.6), the westerly trough became more
marked, though there was little movement. It was extending from 50°N 82°E to
Jammu and Kashmir and adjoining Punjab. Under its influence a surface low also
developed over West Uttar Pradesh and the associated cyclonic circulation was
seen over West Uttar Pradesh and adjoining northwest India in the lower tropos-
phere (Fig. 10.7 and 10.8). Indications of this development were noticeable on
the evening of 24th itself. In the mean time, the eastern end of the axis of
the monsoon trough had moved northwards and the axis was running (in the lower
troposphere) through Ganganagar, Banda, Ranchi and thence more or less eastwards
towards Bangla Desh. There was a good cyclonic shear in the region of the
trough axis in the lower troposphere and the winds on either side of the axis
were moderate to strong easterlies and westerlies respectively. As the well-
marked trough shifted north, monsoon became active over Bihar Plains. Monsoon
continued strong over West Uttar Pradesh. The activity was only normal in Bihar
Plateau and East Uttar Pradesh.
10.5.5 By the evening (of the 25th), the well-marked upper air trough over(Fig 10.9)
Western Himalayas extended southwards upto West Uttar Pradesh and East Rajasthan.
On 26th also the westerly trough continued to extend as far south as West Uttar
64
Pradesh,(Fig. 10.9). The 'low' over West Uttar Pradesh also became well-marked
in the upper air (lower troposphere) with a slight eastward shift in its posi-
tion since the previous day. The eastern end of the axis of the monsoon trough
shifted further north to Bihar Plains and Sub-Himalayan West Bengal. With the
presence of the westerly trough and well-marked low, the monsoon became vigorous
in West Uttar Pradesh and a number of stations in West Uttar Pradesh and Haryana
reported heavy to very heavy rains of the order of 10 to 12 cms. Monsoon
became vigorous in Bihar Plains and strong in East Uttar Pradesh.
10.5). 6 The low over West Uttar Pradesh moved in a northerly direction and
weakened by the morning of 27th (Figs. 10.10 and 10.11). The upper trough
however persisted over West Uttar Pradesh and Western Himalayas. Under the
influence of a low pressure area approaching from the east, the eastern end of
monsoon trough shifted southwards to north Bay in the lower troposphere.
Monsoon continued vigorous over West Uttar Pradesh and was strong over East
Uttar Pradesh and Bihar Plains though isolated very heavy falls still occurred
near the hills. But there was a general decrease in West Uttar Pradesh.
10.5.7 A well-marked low developed over northeast and adjoining East Central
Bay on 28th morning and the monsoon trough system became ill-defined over Uttar
Pradesh and Bihar (Fig. 10.12). The upper trough was probably weakening as it
was seen only below 300 mb.over Western Himalayas and adjoining northwest India
(Fig. 10.13). It had also moved slightly westwards. Rainfall decreased con-
siderably over Uttar Pradesh and Bihar as all the three systems - surface low
and upper air trough weakened and the seasonal monsoon trough became less
marked. As a result, monsoon became weak in Bihar and normal in Uttar Pradesh.
The upper trough also became unimportant by 29th.
10.5.8 The main features of this case are:-
i) In this sequence, the monsoon activity over Uttar Pradesh was caused by
the westerly trough and the low level cyclonic circulation, while over
65
Bihar Plains the activity was due to the shift of the seasonal trough across
the sub-division.
ii)To begin with, the axis of the monsoon trough was in an almost near-normal
position on 22nd and a low pressure area moved from Bihar Plateau to south-
west Uttar Pradesh and weakened between 23rd and 24th. During this period,
a westerly trough also moved eastwards to Western Himalayas. These led to
active monsoon conditions over West Uttar Pradesh and adjoining East Uttar
Pradesh on 23 and 24th. There was no significant weather over Bihar on
these days.
iii)Under the influence of the westerly trough a surface low formed over West
Uttar Pradesh on 25th morning. By the evening the westerly trough rapidly
developed large amplitude over northwest India and West Uttar Pradesh. It
is not possible to state definitely whether the low was a fresh one or
whether it was a re-intensification of the earlier low which moved from Bihar
to southwest Uttar Pradesh. The main point is the development in the lower
troposphere under the influence of the westerly trough. The combined upper
and lower tropospheric systems, resulted in strong to vigorous monsoon acti-
vity over Uttar Pradesh on 26th and 27th. The rainfall was heavier in West
Uttar Pradesh where falls of the order of 10-20 cm were recorded. There was
an almost continuous spell of wet weather for 4 to 5 days over Uttar Pradesh.
The intensification of the seasonal low over Pakistan and increased convec-
tive activity there on 24th evening, formation of a low over West Uttar Pra-
desh and adjoining northwest India on 25th, its eastward shift on 26th and
its subsequent movement northeastwards across the Himalayas on 27th, all
these brought out a sequence of developments associated with the eastward
movement of the middle latitude westerly trough and its extension into north-
west India. The global satellite mosaics for 24th and 25th show the linking
up of the middle latitude cloud system over Central Asia with the cloud
system over northwest India.

66
iv) Over Bihar Plains the monsoon activity increased as the axis of the monsoon
trough shifted northwards across the sub-division between 25th and 26th.
leading to a spell of strong to vigorous monsoon for three days. Bihar
Plateau was not affected, except for a slight increase in rainfall between
25th and 27th.
v) (Comparison of the daily location and intensity of the monsoon trough during
"he period 25th to 28th, brings out clearly the large changes that take
place in the monsoon trough from day-to-day» On the 25th, the trough was
well-marked and in its near normal position. On the 26th the eastern end of
the trough shifted north and the easterlies in the Gangetic Plains became
less marked in the lower troposphere. On 27th the western half of the axis
of the trough shifted to foot hills while the eastern half was extending
Into Bay, as a low was approaching the north Bay of Bengal from the east.
On the 28th, the eastern end of the trough shifted well to the south and the
trough was generally weak over Uttar Pradesh. These day-to-day fluctuations
in the wind field brought in corresponding fluctuations in the rainfall
pattern.
11. Weak Monsoon - Typical cases
Synoptic situations associated with weak monsoon conditions over Uttar
Pracesh and Bihar have already been discussed in a general manner in Sec. 4.
A few cases of weak monsoon conditions in one or two of the sub—divisions are
given in Table VI.

67
TABLE - VI
Instances of Weak Monsoon
s. Date Areas of weakmonsoon
Synoptic Situation Refe-renceNo.
Date Areas of weakmonsoon
Refe-rence
1. 10-13 Aug.68 Bihar Plains A depression forming over head Bay of12,13 Aug.68 Uttar Pradesh Bengal on 11th moved westnorthwest to
northeast Madhya Pradesh where it wea-kened. The monsoon trough was much to thesouth of Bihar Plains and East UttarPradesh. Sec. 5
2. 12 Sep. 63 Bihar Plainsand Uttar Pra-desh (nearlydry weather)
A deep depression over northwest Bay ofBengal on 11th moved westnorthwest andlay centred near Keonjar on 12thmorning,, Sec. 6
3. 13 Sep. 70 Bihar State A deep depression from the Bay of Bengalmoved northwestwards and lay over centralUttar Pradesh on 13th. It was about tomake a loop and move eastwards. Thedepression caused vigorous monsoon in EastUttar Pradesh while monsoon was weak inBihar State on 13th. Sec. 7
4. 4 Aug. 70 Bihar State An upper air cyclonic circulation movedand EastUttar Pradesh
westwards to extreme West Uttar Pradeshand adjoining East Rajasthan on 3rd andthe eastern half of the monsoon troughshifted to foot hills on 4th. Sec.8.3
5. 25 July 66 Bihar Stateand EastUttar Pradesh
The western end of the axis of themonsoon trough shifted north across WestUttar Pradesh to the foot-hills, whilethe eastern end continued to remain ina southerly position due to the develop-ment of a low over northwest and adjoin-ing West Central Bay off Orissa coast. Sec.9.4
6. 16-18 Aug. Bihar Plateau A depression centred near Rewa on 15th69 morning moved to northwest Madhya Pra-
desh by next morning.In the wake ofthis, the eastern half of the monsoontrough shifted progressively north toBihar Plains and the foot-hills and con-tinued to remain there till 19th. Sec.9.5
7. 21,22 Aug.69
West UttarPradesh(Plains)
A low pressure area lying over BanglaDesh and adjoining areas on 20th movedto Bihar Plains and adjoining EastUttar Pradesh by 22nd morning. Thewestern end of the axis of monsoontrough remained close to the foot-hillsin West Uttar Pradesh. Sec.8.2
68
12. Conclusions
i) Southwest monsoon holds sway over Bihar State and East Uttar Pradesh
from the middle of June to the beginning of October, while over West
Uttar Pradesh, the duration of the monsoon is slightly less (from end of
June to end of September). Uttar Pradesh and Bihar get nearly 80% to
90% of their annual rainfall during the southwest monsoon season. A
point of interest is that in the whole country, it is only in these two
states (apart from Punjab and Haryana) that heavy rains occur as fre-
quently in September also, as in the height of the monsoon (July or
August). September is, therefore, an important month of rainfall for
Uttar Pradesh and Bihar.
i) The axis of the seasonal monsoon trough passes through south Uttar Pradesh
and Bihar Plateau in the mean charts. The mean rainfall is relatively
less over these areas. However, there are large day-to-day variations
in the position of the axis of the monsoon trough which in their turn,
affect the daily rainfall distribution. In the extreme case, when the
trough shifts to the foot-hills, heavy rains occur in the sub-montane dis-
tricts; the plains go almost dry. However, sometimes, even when the
monsoon trough has shifted to the north, disturbances in the lower as well
as middle and upper tropospheric westerlies cause good monsoon over the
plains as well.
i) The axis of the monsoon trough is found to be a common synoptic situation
associated with rainfall in Uttar Pradesh and Bihar, particularly when
there is an embedded low or depression or when the axis shifts rapidly
north or south across these sub-divisions. In typical cases, the axis of
the monsoon trough slopes southwards with height and rainfall is predomi-
nantly over areas to the south of the trough line. But there are also
occasions when the axis slopes north with height and the rainfall is to
the north of the trough line.

69
iv) Depressions affect mostly Bihar Plateau and the extreme south Uttar Pradesh
in the mid monsoon months. But, later in the season, depressions take a
more northerly track and even recurve when they cause active to vigorous
monsoon conditions in the whole of Uttar Pradesh and Bihar State. Towards
the end of the monsoon season (September), westerlies try to re-establish
over north India and the sub-tropical ridge line also shifts south, with
the result that the lows and depressions reaching the Gangetic Plains have
more chances of coming under the influence of westerly troughs or the upper
tropospheric anticyclonic vortices. Such super-positions appear to be res-
ponsible for spells of heavy rains in Uttar Pradesh and Bihar Plains.
Other characteristics of the late monsoon depressions (in contrast to
depressions of the mid-monsoon period) are:
a) their small areal extent
b) concentrated heavy rains over limited area and
c) the occurrence of rainfall not only in the southwest sector of the
depression but in other sectors as well
v)Low pressure areas are another type of disturbances that affect these areas;
some of the low pressure areas are remnants of depressions. Low pressure
areas have also a tendency to stagnate while over Bihar, south Uttar
Pradesh and northeast Madhya Pradesh. Land lows also form sometimes over
these areas
vi) In common with northwest India, Uttar Pradesh and Bihar are affected by
disturbances in middle latitude westerlies. Though these disturbances may
weaken or get modified as they move across the Himalayan massif, they still
seem to have profound effect on the circulation and weather over Uttar Pra-
desh and Bihar Plains. Because of the lack of adequate data over Tibet,
it is difficult to understand the role of the middle latitude disturbances
clearly. Extended charts covering upto at least Central Asia as well as
satellite picture coverage over these areas, may enable forecasters to
70
understand the sequence of weather over Uttar Pradesh and Bihar on such
occasions.
vii)When the monsoon trough has shifted to Himalayas and westerlies prevail
in the lower and middle troposphere over north India, north-south oriented
troughs or circulations form in the westerlies and move from west to east
causing rains over Uttar Pradesh and Bihar.
viii) During the southwest monsoon season, air over Uttar Pradesh and Bihar is
warm and very humid with a fairly high degree of latent instability. As
a result, convective type of clouds and precipitation are common and even
a feeble disturbance in the lower level is able to cause some weather over
these areas. In fact, thunderstorm is a principal feature of monsoon
over Uttar Pradesh and Bihar as in the case of Madhya Pradesh. The highest
frequency of occurrence of thunderstorms for the whole of India during the
southwest monsoon season is over south Bihar State. Thunderstorms are
also quite frequent over south Uttar Pradesh during the monsoon season.
ix) Weak monsoon conditions are associated with absence of any synoptic dis-
turbance over the sub-divisions.
ACKNOWLEDGEMENT
The authors wish to record their gratitude and thanks to Dr. P.K. Das,
Deputy Director General of Observatories (Forecasting), for going through the
article and giving many helpful suggestions.
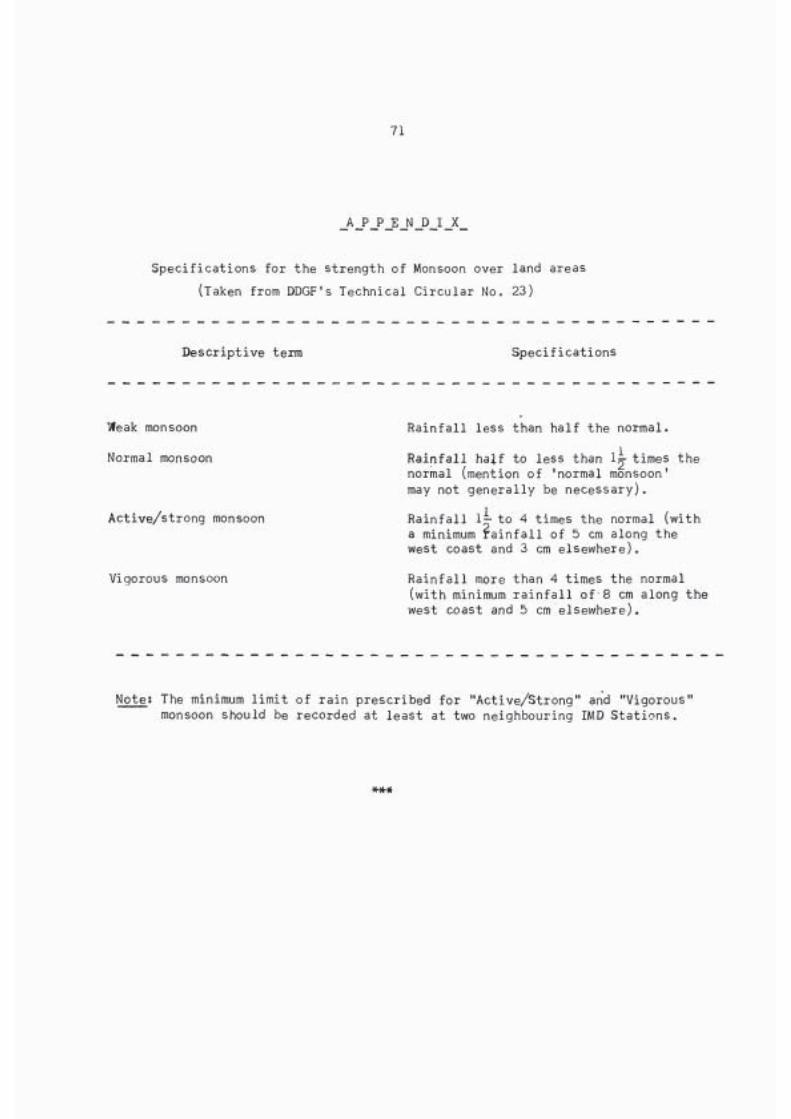
71
_A_P_P_E_N_D_I_X_
Specifications for the strength of Monsoon over land areas
(Taken from DDGF's Technical Circular No. 23)
Descriptive term Specifications
Weak monsoon
Normal monsoon
Active/strong monsoon
Vigorous monsoon
Rainfall less than half the normal.
Rainfall half to less than l½ times thenormal (mention of 'normal monsoon'may not generally be necessary).
Rainfall 1- to 4 times the normal (witha minimum rainfall of 5 cm along thewest coast and 3 cm elsewhere).
Rainfall more than 4 times the normal(with minimum rainfall of 8 cm along thewest coast and 5 cm elsewhere).
Note: The minimum limit of rain prescribed for "Active/Strong" and "Vigorous"monsoon should be recorded at least at two neighbouring IMD Stations.

72
REFERENCES AND SELECTED BIBLIOGRAPHY
1. Agarwala, K.S. 1963: Variations in rainfall at short distances inMoradabad and Meerut districts in Uttar Pradesh. IJMG Vol.XIV p. 490.
2. Ananthakrishnan, R. and Bhatia, K.L. 1958: Tracks of Monsoon Depressionsand their recurvature towards Kashmir. Symp. on the Monsoons of theWorld, p. 157.
3. Ananthakrishnan, R. and Pathan, J.M. 1970: On some features of the spacetime variation of rainfall over India and neighbourhood. I. Met. D.Pre-published Scientific Report No. 118.
4. Banerji, S. and Anand, CM. 1966: Flood producing storms in River Gomatiand their meteorological and climatological aspects. Symp. on Hydro-meteorology of India. IJMG Vol,, 17, pp. 207-216.
5. Blandford, H.F. 1886: Rainfall fof India. Memoirs of IMD Vol. III.
6. Banerji, S. and Gupta, D.K. 1966: Flood producing storm in lower Bihar.Symp. on Hydrometeorology of India. Vol. 17 Spl. Number pp. 15-22.
7. Bose, U.K. 1958: A study on the floods in West Bengal and West UttarPradesh during September-October 1956. IJMG Vol. IX pp.23.
8. Das, P.K., Datta, R.K. and Chhabra, B.M. 1970: Diagnostic study of verti-cal motion vis-a-vis large scale cloud systems. National Symp. onSatellite Meteorology, Poona, April 1970.
9. Das, P.K. 1968: The Monsoons. National Book Trust, New Delhi.
10. Desai, B„N. 1967: Trough of Low Pressure over the Gangetic valley duringthe southwest monsoon and its implications - A suggested new approach.IJMG Vol. 18., No.4, p. 473.
11. Dhar, O.N. 1958: Meteorological Situations associated with actual majorfloods in different parts of India. Proceedings of the Symposium onMeteorological and Hydrological aspects of Floods and Droughts inIndia, pp. 57-62.
12. Doraiswamy Iyer, V. and Mohammad Zaffar, 1938: Distribution of heavy rain-fall over India. IMD Sc. Notes Vol. VII, No. 7.
13. Doraiswamy Iyer, V. and (Miss) Pradhan, R.N. 1956: Monthly frequencies ofrainfall in India. Memoirs of IMD, Vol. XXX Part VI.
14. George, C.J„ and Dutta, R.K. 1965: A synoptic study of a Monsoon Depres-sion in the month of September 1-963. IJMG Vol.16, No.2, p. 213.
15. India Meteorological Department. 1962: Monthly and Annual normals of
rainfall and of rainy days. Memoirs of IMD Vol.XXXI Part III.
16. India Meteorological Department. 1963: India Weather Review, Oct-Dec.1963.
17. Jagannathan, P. 1968: Rainfall of India. IMD Forecasting Manual.Rep. No.IV-13.

73
18. Keshavamurthy, R.N. 1970: Cloud structure of monsoon depressions asrevealed by satellite cloud pictures. National Symp. on SatelliteMeteorology, Poona, April 1970.
19. Koteswaram, P. and George, C.A. 1958: A case study of a Monsoon Depres-sion in the Bay of Bengal. Symp. on the Monsoons of the World, p.145.
20. Kulshrestha, S.M. and Gupta, M.G. 1964: Satellite study of an IndianMonsoon Depression. IJMG Vol.15, No.2, p. 175.
21. Lal, S.S. 1958: Rainfall around slow moving monsoon depressions overIndia. Proceedings of the Symposium on Meteorological and Hydrologicalaspects of Floods and Droughts in India, pp. 53-56.
22. Mallik, A.K. 1958: Is the incidence of drought increasing in Bihar andeastern districts of Uttar Pradesh? Symposium on Flood and Droughts,1958, p. 65.
23. Malurkar, S.L. 1950: Notes on analysis of weather of India and neighbour-hood. Memoirs of India Met. Dept. Vol. XXVIII, Part IV.
24. Mooley, D.A. 1957: The role of Western Disturbances in the production ofweather over India during different seasons. IJMG Vol.8, p. 253.
25. Parthasarathy, K. 1954: Weather in relation to floods in Bihar, Bengaland Assam in July and August, 1954. IJMG Vol V,pp.329-336.
26. Parthasarathy, K. 1958: Some aspects of the rainfall in India during thesouthwest monsoon season. Symp. on Monsoons of the World, New Delhi,pp. 185-194.
27. Parthasarathy, K. 1958: Maximum point rainfall and frequency of rainfallof ten inches and over in 24 hrs over India. Proceedings of the Symp.on Meteorological and Hydrological aspects of Floods and Droughts inIndia, New Delhi, pp.31-36.
28. Petterssen, S. 1956: Weather Analysis and Forecasting-Vol.I, McGraw HillBook Co., pp. 50-51
29. Pisharoty, P.R. and Asnani, G.C. 1957: Rainfall around monsoon depres-sion over India. IJMG Vol.8, pp.15-20.
30. Raghavan, K. 1958: Zones of rainfall ahead of a tropical depression.IJMG Vol.6, p. 631.
31. Raghavan, K. 1967: Influence of tropical storms on monsoon rainfall inIndia, Weather 22, p. 250.
32. Rahmatulla, M. 1952: Synoptic aspects of the monsoon circulation andrainfall over Indo-Pakistan. Journal of Meteorology, 9(3),pp.176-179.
33. Ramachandran, G. 1967: Rainfall distribution in India in relation toLat. Long. and elevation. IJMG Vol.18, No.2, p.227.
34. Ramakrishna, K.P. and Krishnan, A. 1958: Spe l l s of heavy r a i n and r a i n -less days at Selected stations in India. Proc. of the Symp. onMeteorological and Hydrological aspects of Floods and Droughts inIndia. p. 164.
74
35. Ramamurthy, K.M. 1958: A study of the distribution of heavy rainfallwhich caused serious floods in West Uttar Pradesh during the end ofSeptember 1924. Proceedings of the Symposium on Meteorological andHydrological Aspects of Floods and Droughts in India. pp.83-90.'
36. Ramakrishnan, K.P., Sreenivasaiah, B.N. and Venkiteshwaran, S.P. 1958:Upper air climatology of India and neighbourhood in the monsoon season.Symposium on Monsoons of the world, 1958, pp.3-34.
37. Ramamurthy, K.M., Keshavamurthy, R.N.and Jambunathan, R. 1965: Somedistinguishing factors of strong and weak monsoon regimes over Indiaand neighbourhood. Proc. of the Symposium on Meteorological Resultsof IIOE, Bombay, pp.350-361.
38. Ramamurthy, K. 1969: Some aspects of the break in the Indian southwestmonsoon during July and August. I.Met.D. FMU Rep. No.IV-18.3.
39. Raman, P.K. and Dhar, O.N. 1966: A study of major rainstorms of Biharand Madhya Pradesh for evaluation of Design storms. Symp. on Hydro-meteorology of India. IJMG Vol.17, Spl. No. p.87.
40. Raman, P.K. and Chhabra, B.M. 1966: An empirical relationship betweenaverage rainfall and areal extent for major rainstorms of Bihar andMadhya Pradesh. IJMG Vol.17, Spl. No.p. 97.
41. Raman, P.K. and Raghavan, K. 1961: Diurnal variation of thunderstormsin India during different seasons. IJMG Vol.12, No.l, p.109.
42. Ramaswamy, C. 1958: A preliminary study of the behaviour of the IndianSouthwest Monsoon in relation to the westerly jet stream. SpecialPalmen Number, Geophysic-6, pp.455-476.
4 3 . Ramaswamy, C. 1962: Breaks in the Indian Summer Monsoon as a phenomenonof interaction between the easterly and the sub-tropical westerlyjet streams. Tellus Vol.XIV 3, p. 337.
44. Ramaswamy, C. 1967: The problem of the Indian Southwest Monsoon PrinceMukarram Jah lectures 1967, under the auspices of the Indian Geo-physical Union, Hyderabad.
45. Rao, K.N. 1958: Heavy rainfall in India. Symp. on Floods and Droughts.p. 11.
46. Rao, K.N. 1958: Thermodynamical I n s t a b i l i t y of the upper atmosphereover Ind ia during the Southwest monsoon. Symp. on Monsoons of theWorld, pp. 43-50.
47 . Rao, K.N., Danie l , C.E.J , and Balasubramaniam, L.V. 1971: Thunderstormsover I n d i a . IMD Pre-publ i shed Sc. Report No.153.
48 . Rao, K.N. and Raman, P.K. 1961: Frequency of days of thunder in I n d i a .IJMG Vol .12, N o . l , p . 103.
49. Rao, Y.P. and Ramamurthy, K.S. 1968: Climatology of India and neigh-bourhood. IMD Forecasting Manual Report No. I-2.
50. Rao, Y.P. and Desai, B.N. 1965: Bay of Bengal Monsoon. IJMG Vol.16,No. 3, p. 479.

75
51. Rao, Y.P., Srinivasan, V. and Raman, S. 1970: Effect of Middle latitudeWesterly Systems on Indian Monsoon. Presented at the Symposium onTropical Meteorology at Hawaii.
52. Roy, A.K. 1946; Air masses in India. India Met. Department Tech.Note No. 16.
53. Roy, A.K. 1958: On the usefulness of pressure departure charts in forecast-ing monsoon weather. Symp. on Monsoons of the World, Session IV, No.3,p. 173.
54. Saucier, W.J. 1955: Principles of Meteorological Analysis. The Universityof Chicago Press, pp. 218-219.
55. Sajnani, P.P. 1967: Divergence, vorticity and vertical motion in thefields of Winter and monsoon circulations over India. IJMG Vol. 19,No. 4, p. 391.
56. Sankaranarayanan, D. 1935 : On the nature of the frequency distribution ofprecipitation in India during the monsoon months June to September.Scientific Notes Vol.V, No.55.
57. Sharma, M.C. and Srinivasan, V. 1970: Centres of monsoon depressions asseen in satellite pictures. Symp. on Satellite Meteorology, Poona,April 1970.
58. Sinha, K.L. 1952: An analysis of the space distribution of rainfall inIndia and Pakistan. IJMG Vol.3, pp.1-16.
59. Sivaramakrishnan, M.V. 1970: A comparative satellite study of three mon-soon depressions during the months of June, July and August 1969.Symp. on Satellite Meteorology, Poona, April 1970.
60. Srinivasan, T.R. and Venkataraman, R. 1958: Frequency of spells ofabnormal and sub-normal rains in Bihar. Symp. on Floods and Droughts1958. p. 157.
61. Srinivasan, V. and Ramakrishnan, A.R. 1970: Location of Monsoon Troughover India in the lower troposphere during July-August. Symp.onTropical Meteorology, Hawaii.
62. Srinivasan, V., Raman, S. and Ramakrishnan, A.R. 1970: Monsoon, depres-sions as seen in satellite pictures. Symp. on Satellite Meteorology,Poona, April 1970.
63. Sutcliffe, R.C. Forsdyke, A.G. 1950: "The Theory and use of upper airthickness patterns in forecasting", QJRMS Vol.76 pp.189 to 190.
64. Ved Prakash, 1958: Dry days in North.- Bihar during June to September.Symposium on Flood's and Droughts, 1958, p. 160.
65. Walker, Gilbert, G. 1924: Frequency of heavy rainfall in India.Memoirs of I. Met. D. Vol. XXIII, Part YII.
-ooOoo-

DIAGRAMS
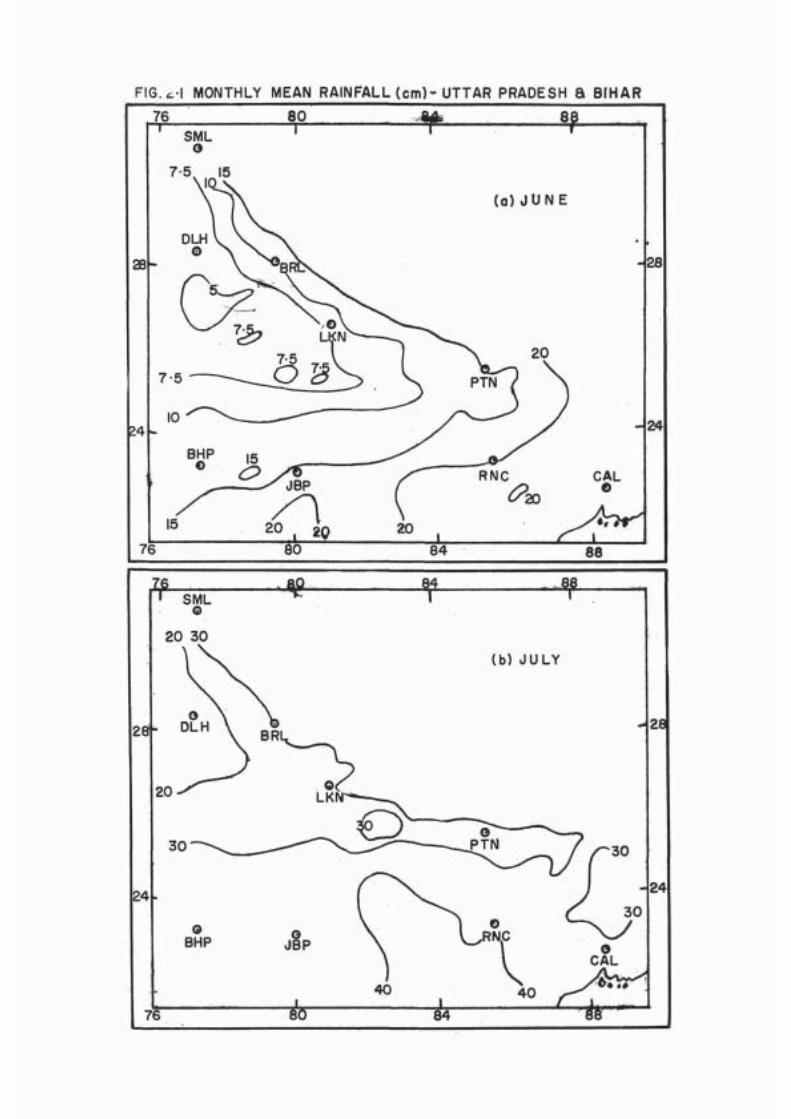
FIG. 2-1 MONTHLY MEAN RAINFALL (cm)- UTTAR PRADESH & BIHAR

FIG. 2.1 M O N T H L Y MEAN RAINFALL (cm) -UTTAR PRADESH & BIHAR .
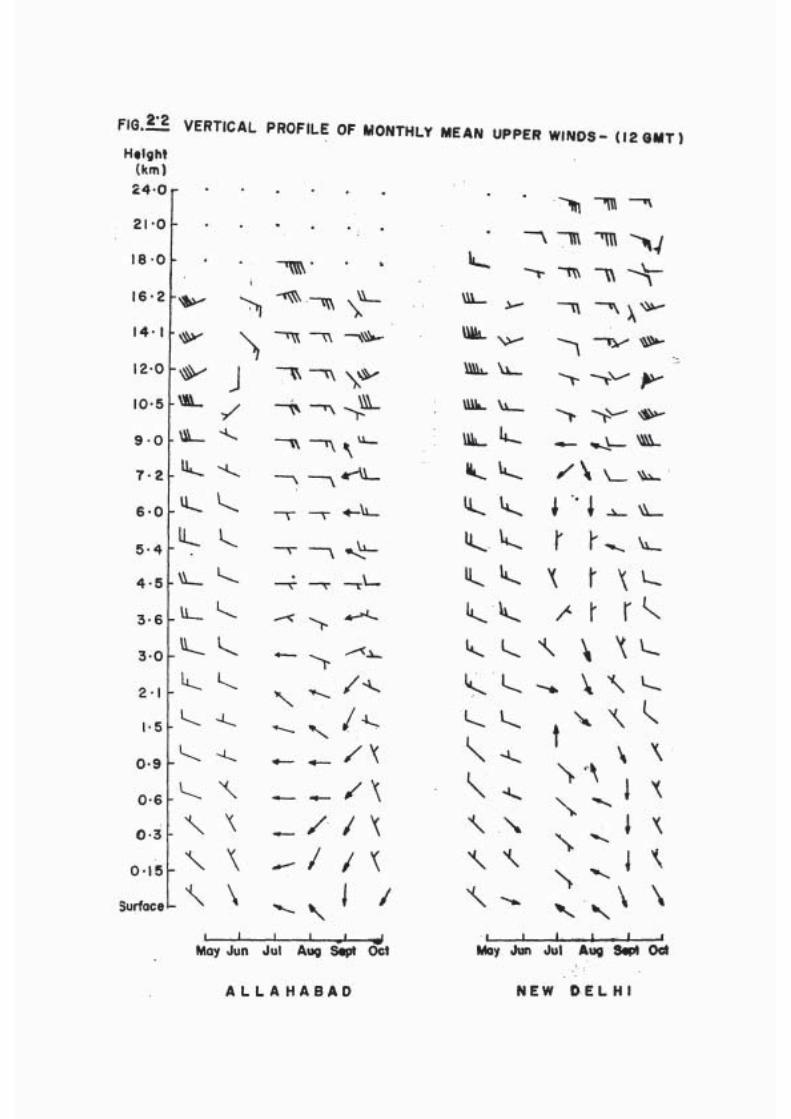
FIG. 2.2 VERTICAL PROFILE OF MONTHLY MEAN UPPER WINDS- (12 GMT)
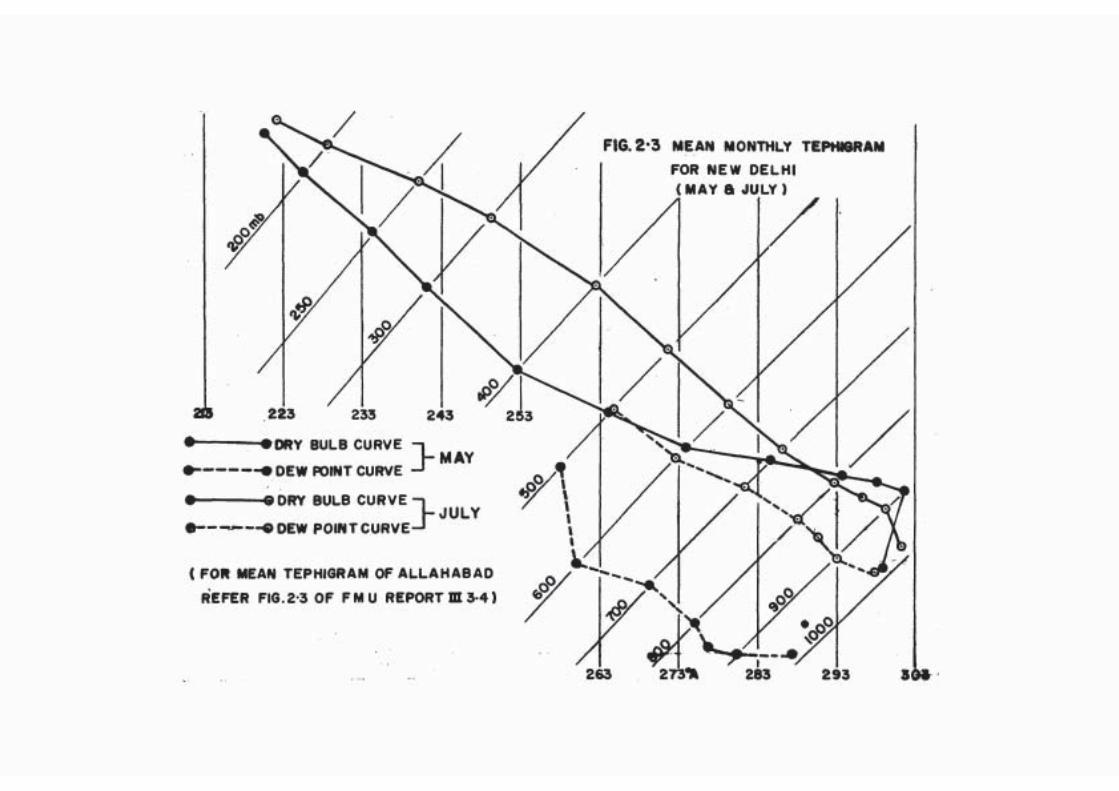
FIG. 2.3 MEAN MONTHLY TEPHIGRAM
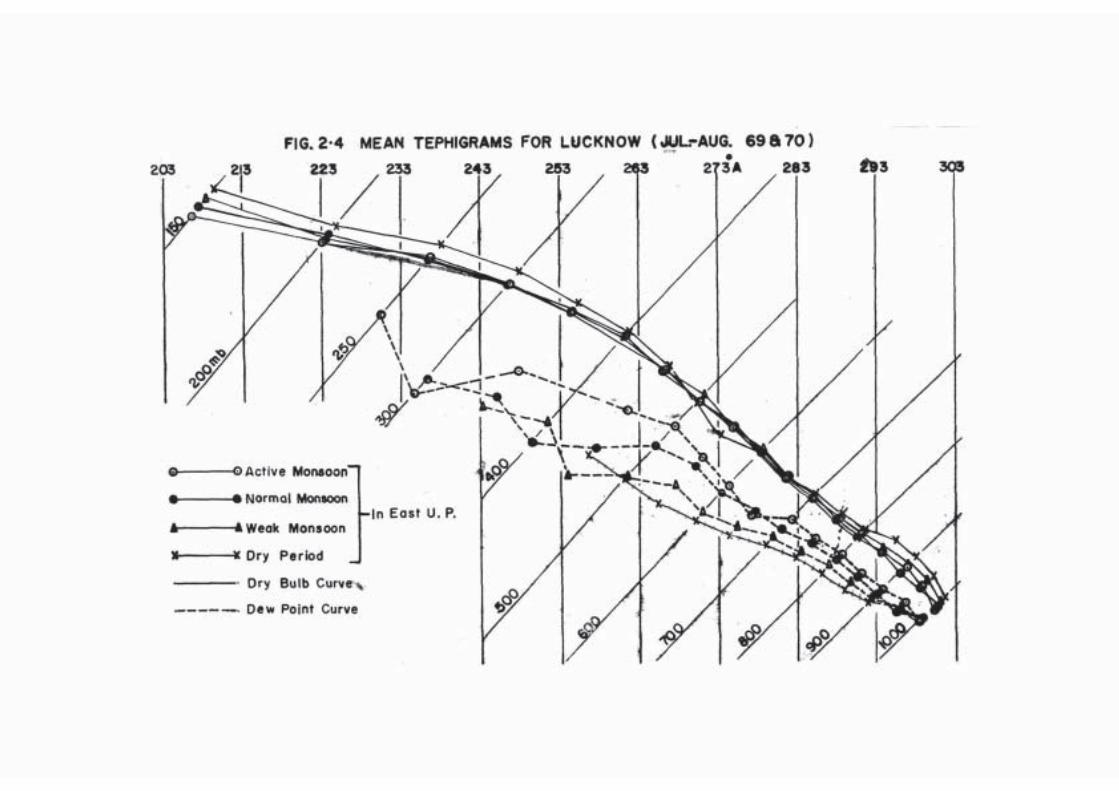
FIG. 2-4 MEAN TEPHIGRAMS FOR LUCKNOW (JUL-AUG. 69 & 70)
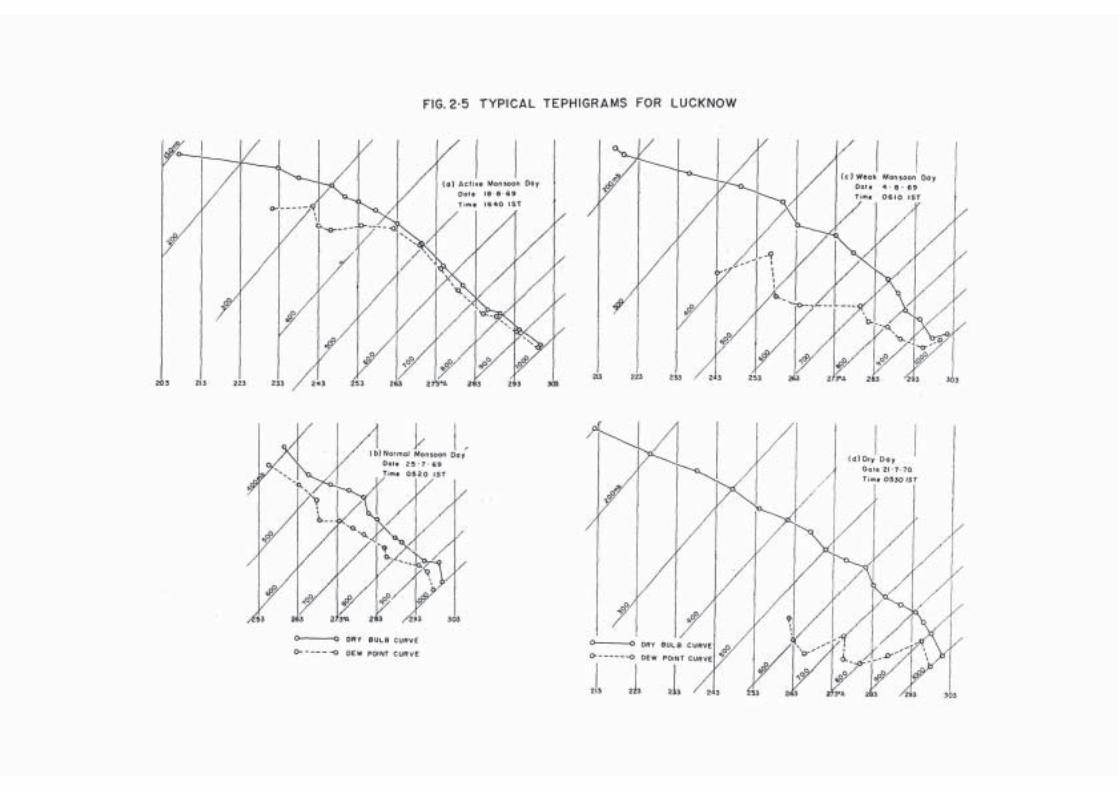
FIG. 2-5 TYPICAL TEPHIGRAMS FOR LUCKNOW

FIG. 31 AVERAGE NUMBER OF DEPRESSION CENTRESIN EACH DEGREE SQUARE (basedon data of 1891-1969)
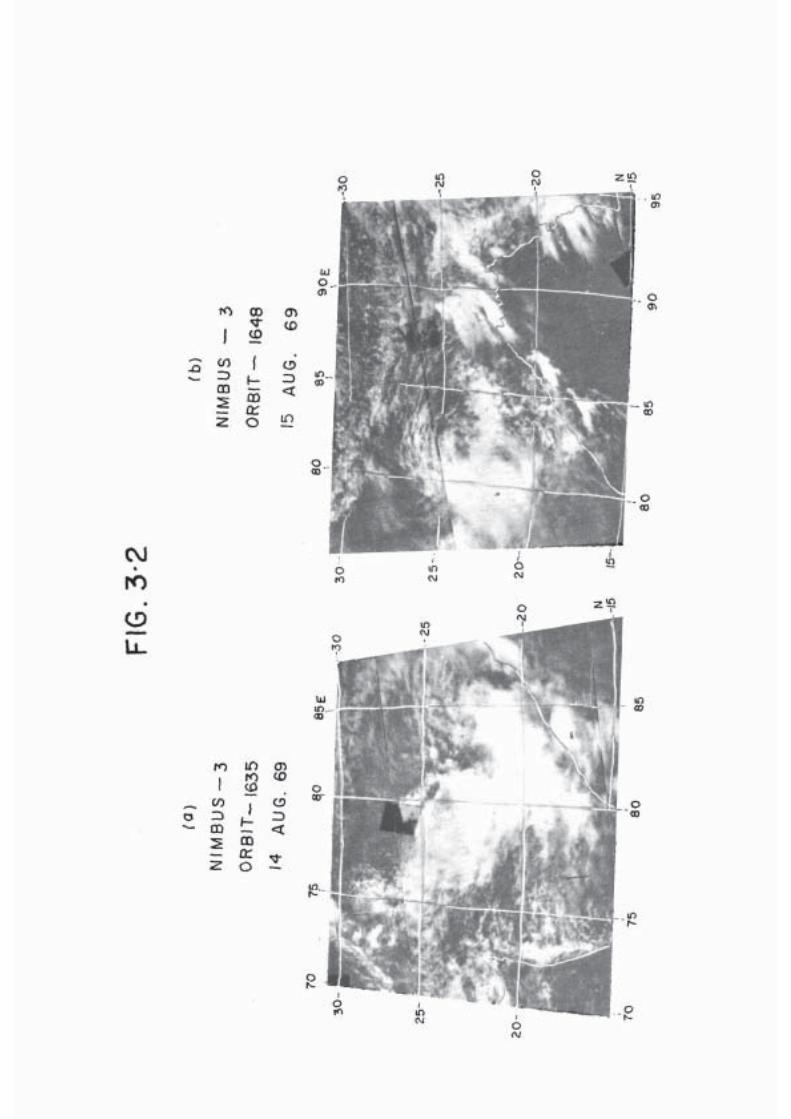
CVJ
egLL.

FIG. 3.3
ESSA – 2
ORBIT – 7021
5 SEPT. 67
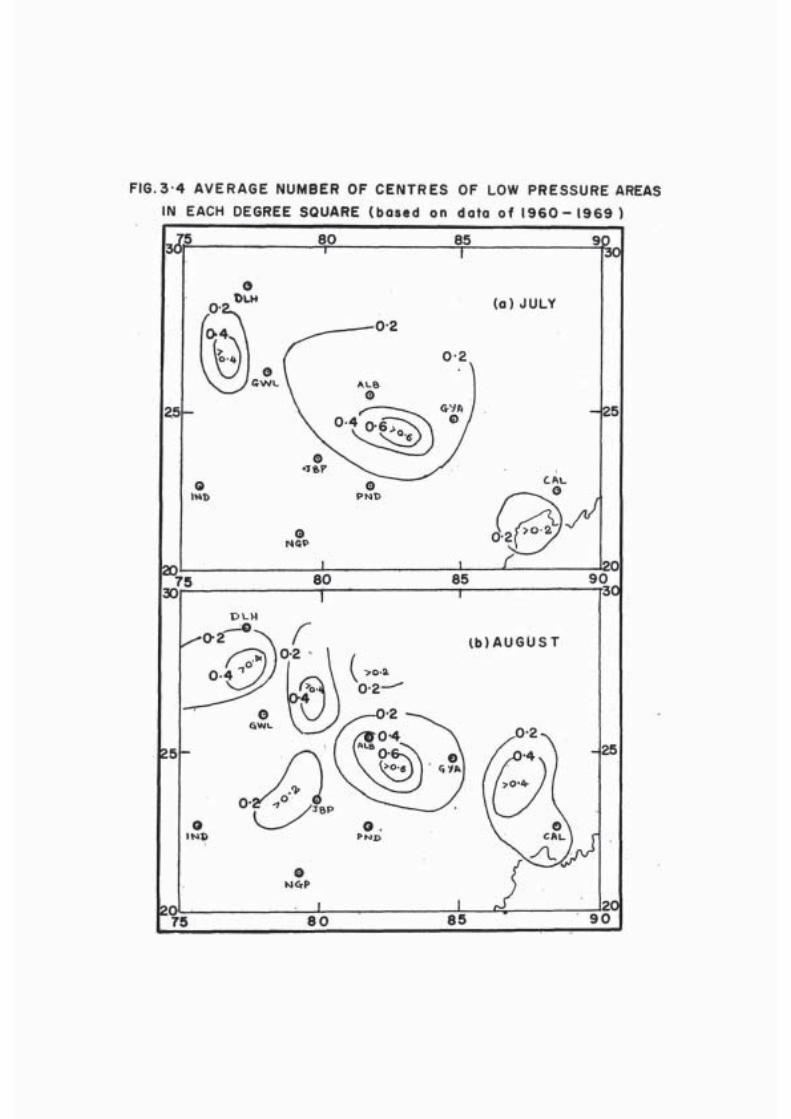
FIG. 3-4 AVERAGE NUMBER OF CENTRES OF LOW PRESSURE AREAS
IN EACH DEGREE SQUARE (based on data of 1 9 6 0 - 1 9 6 9 )

FIG. 5.1 SYNOPTIC CHARTS 0300 GMT II AUG. 68

FlG. 5-2 UPPER WINDS II AUG 68 0 0 GMT
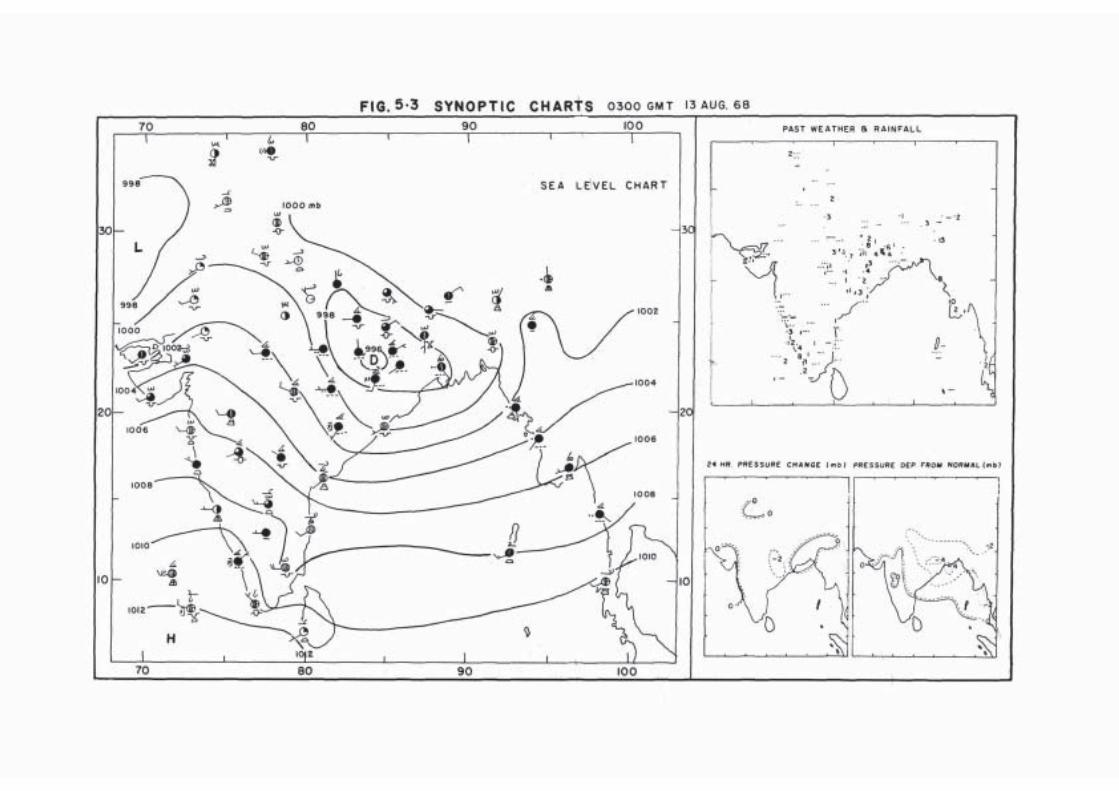
FIG. 5-3 SYNOPTIC CHARTS 0300 GMT 13 AUG. 68
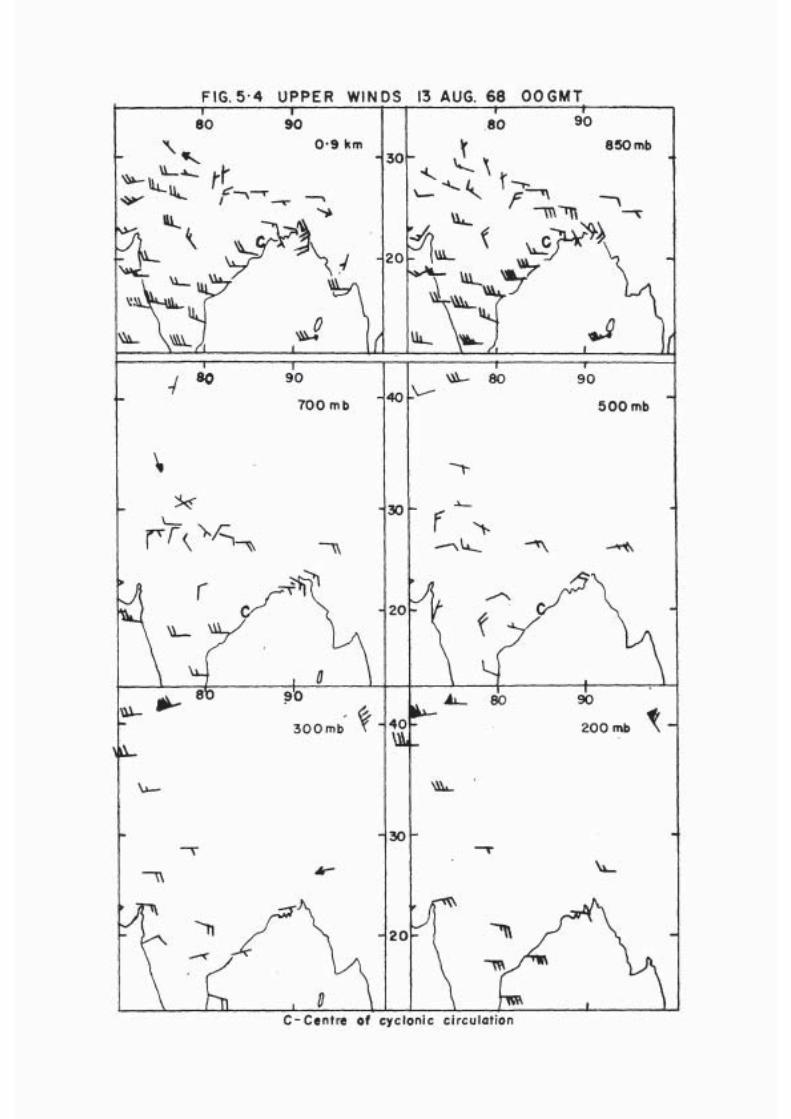
FIG. 5-4 UPPER WINDS 13 AUG. 68 OO GMT

FiG.5-5 SYNOPTiC CHARTS 0300 GMT 15 AUG. 66
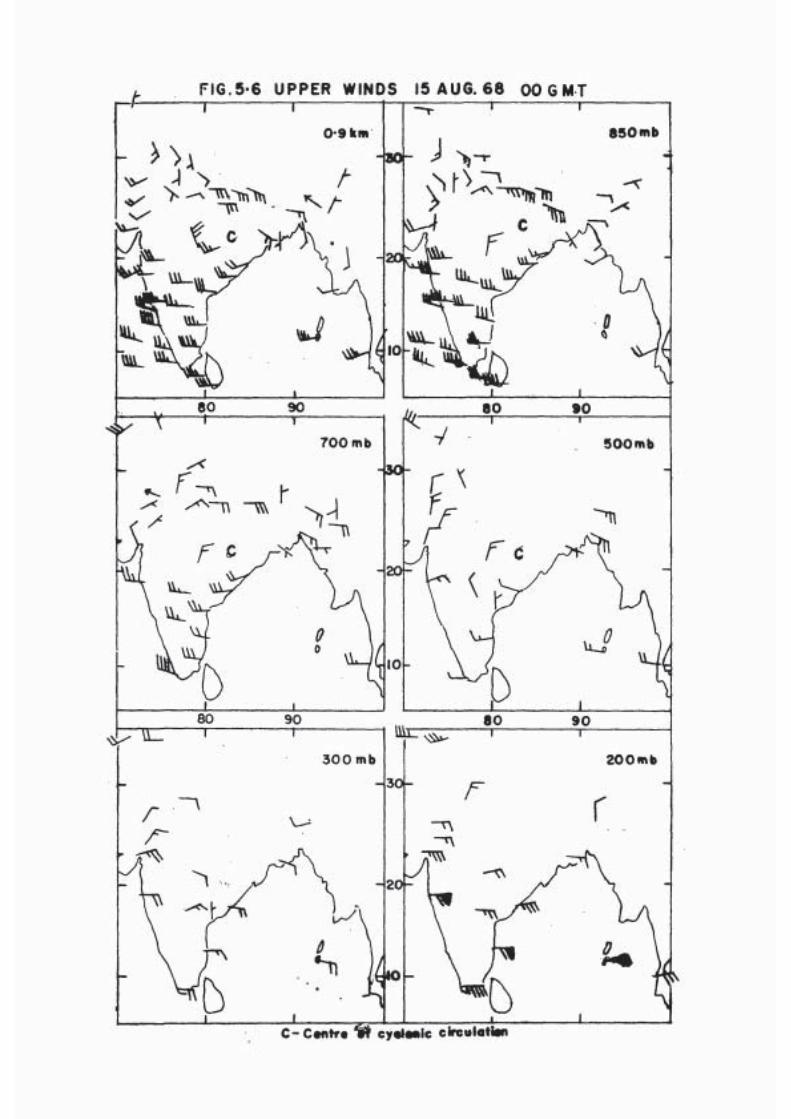
FIG.5-6 UPPER WINDS 15 AUG. 68 00 GMT
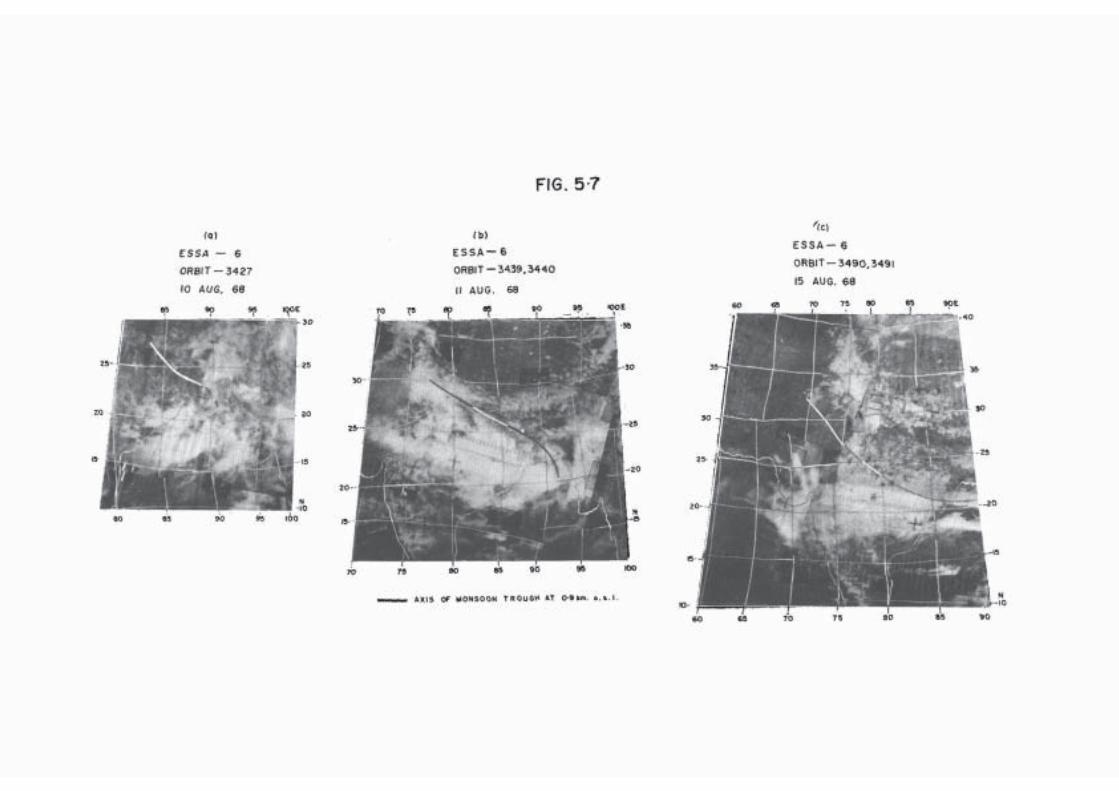
FIG. 5.7
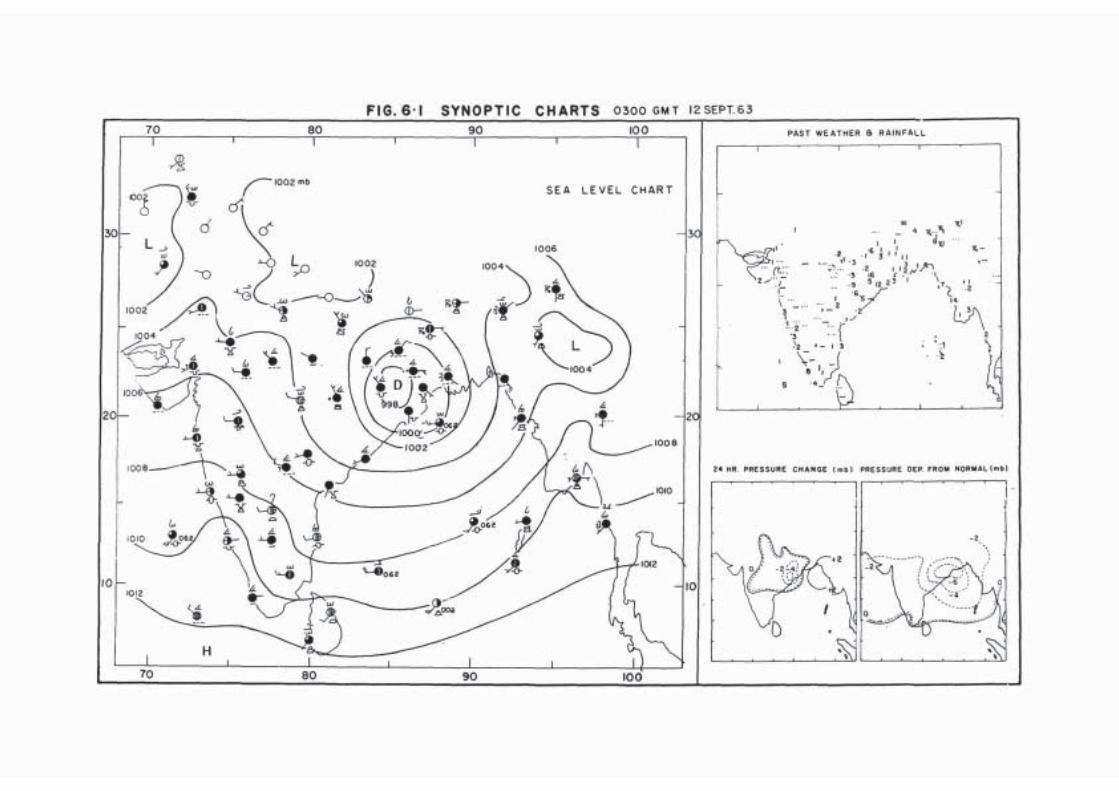
FIG. 6.1 SYNOPTIC CHARTS 0300 GMT 12 SEPT.63
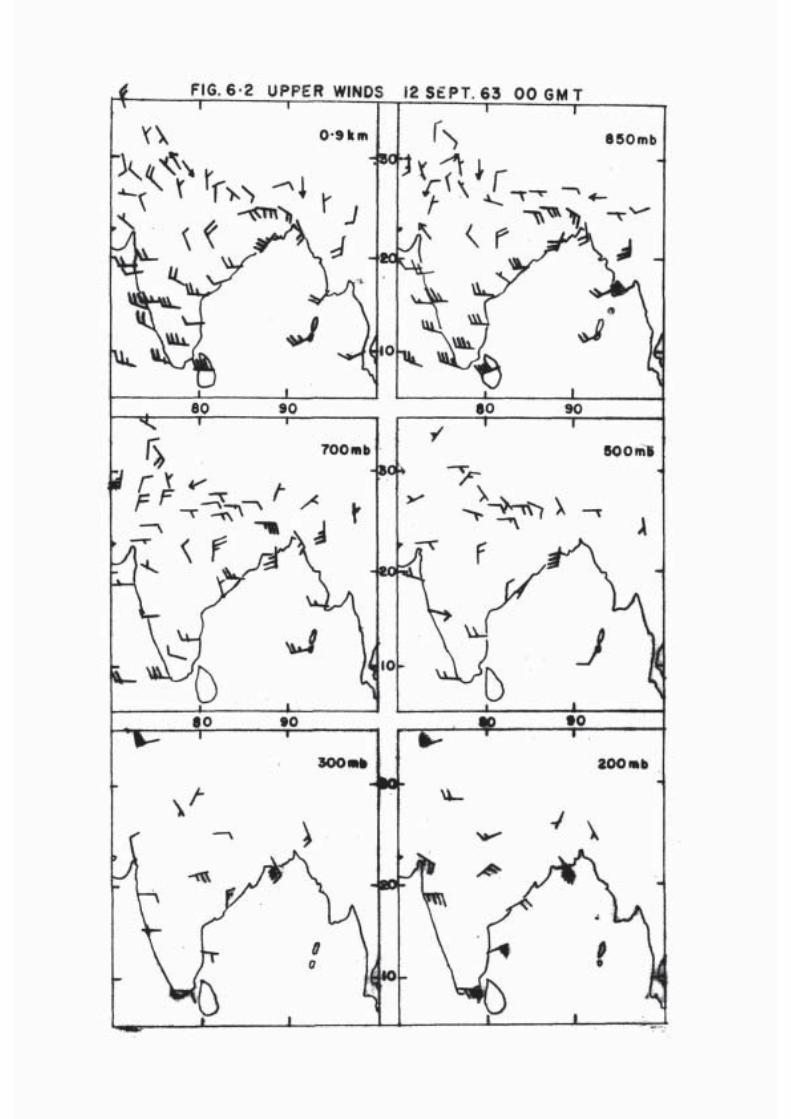
FIG. 6-2 UPPER WINDS 12 SEPT. 63 00 GMT
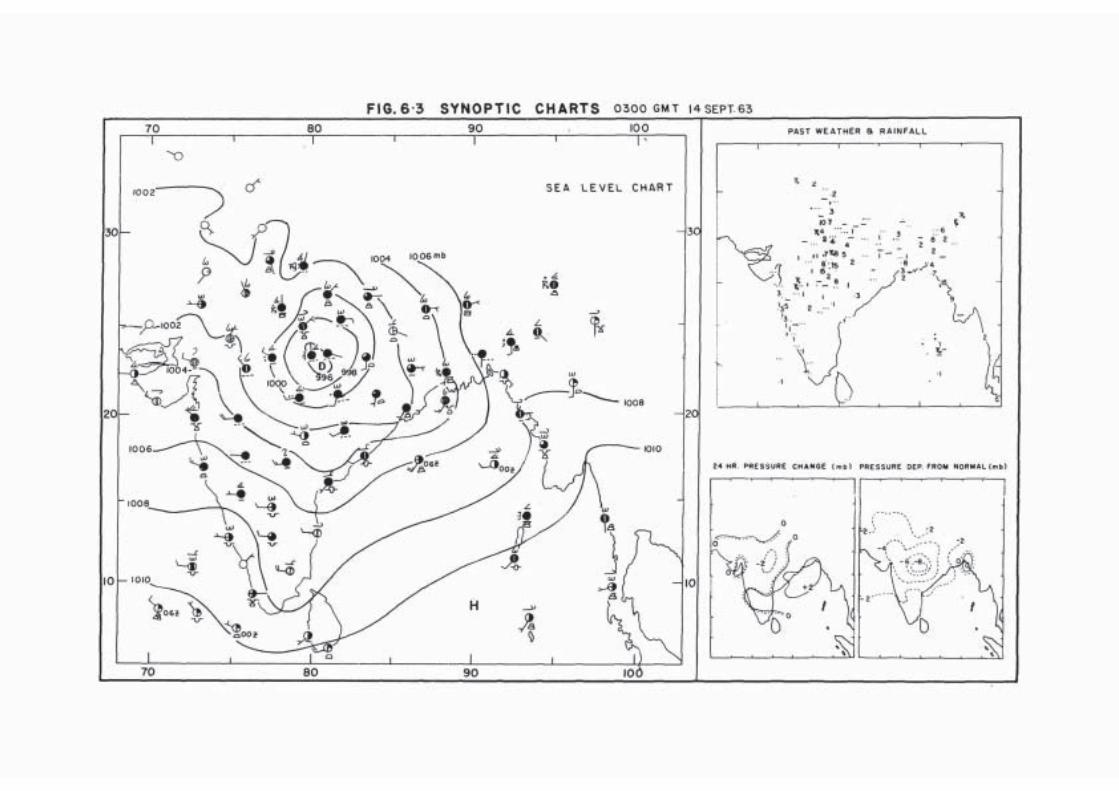
FIG.6 3 SYNOPTIC CHARTS 0300 GMT 14 SEPT.63
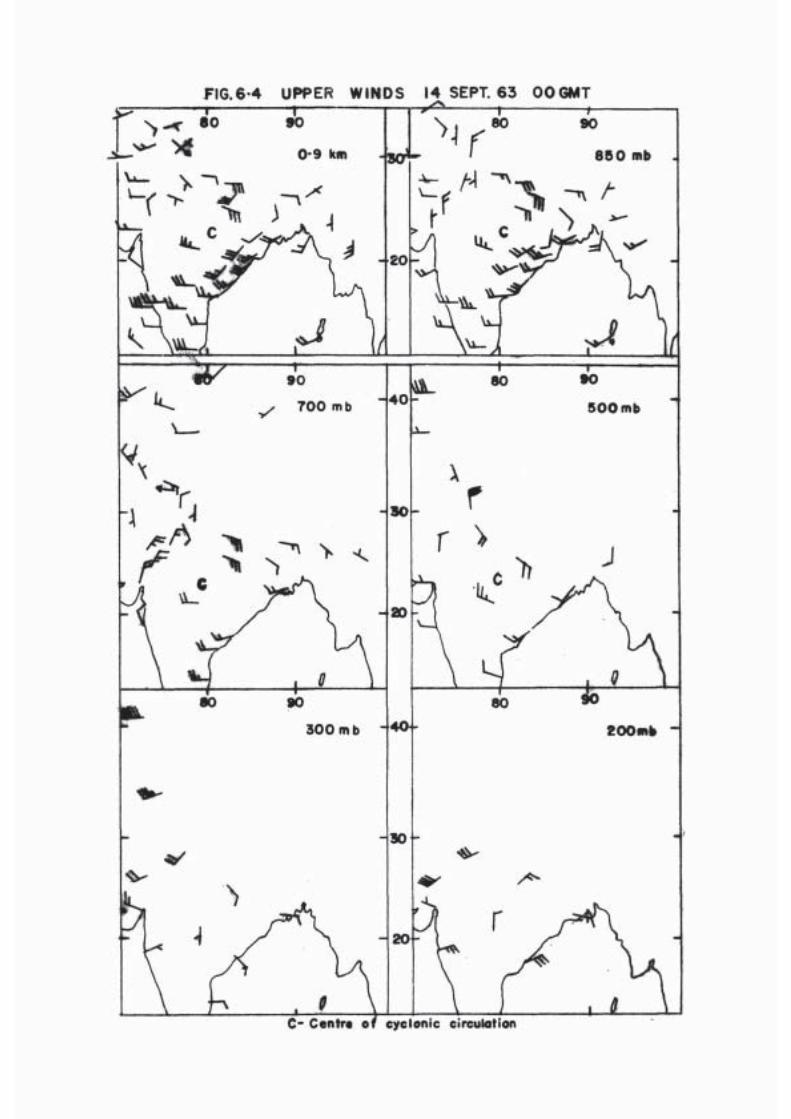
FIG. 6.4 UPPER WINDS 14 SEPT. 63 OO GMT
C- Centro of cyclonic circulation
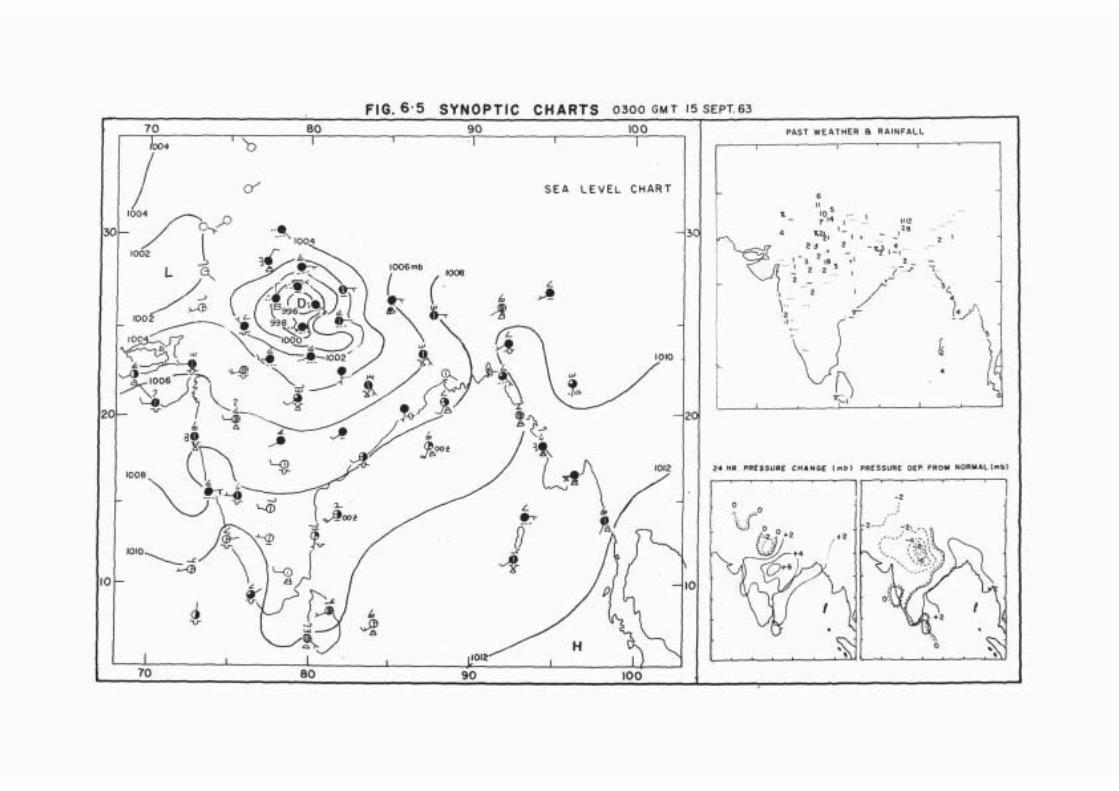
FIG. 6.5 SYNOPTIC CHARTS 0300 GMT 15 SEPT.63
PAST WEATHER & RAINFALL
100

FIG. 6-6 UPPER WIN80
DS 15 SEPT. 63 00GMT
C-Centre of cyclonic circulation Trough line
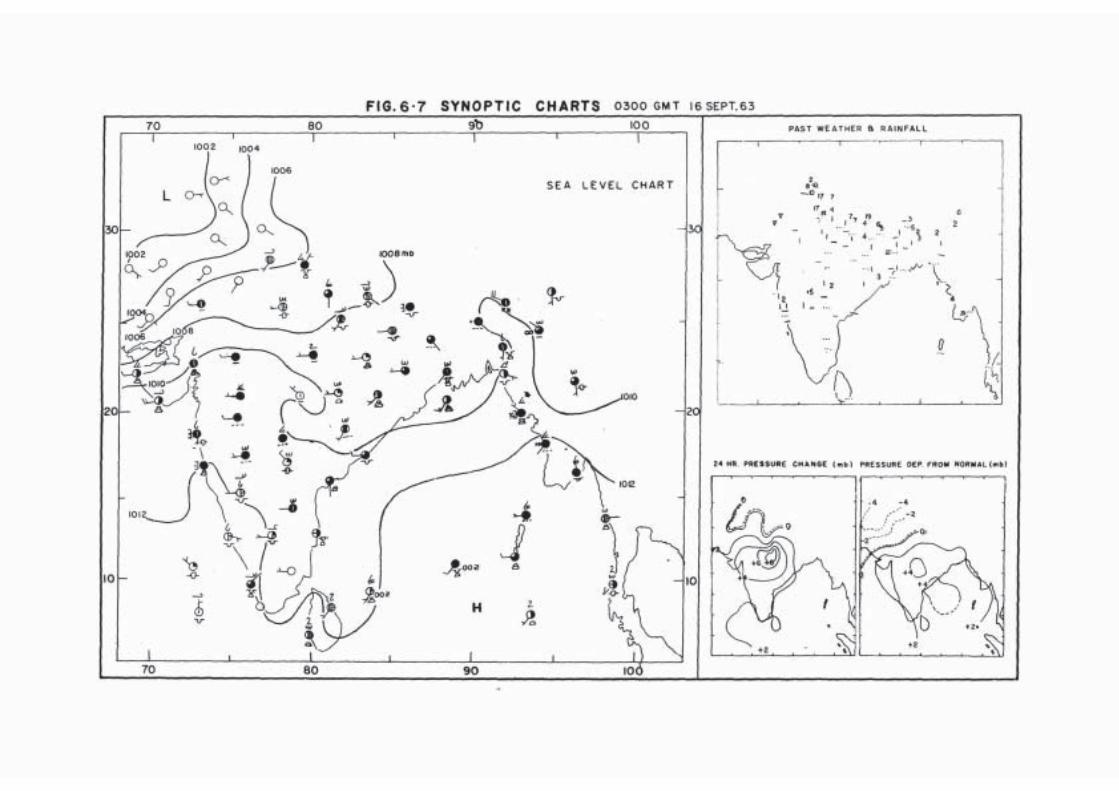
FIG. 6 - 7 SYNOPTIC CHARTS 0300 GMT I6SEPT.63
PAST WEATHER ft RAINFALL

FIG. 6-8 UPPER WINDS 16 SEPT. 63 00 GMT
Trough lint
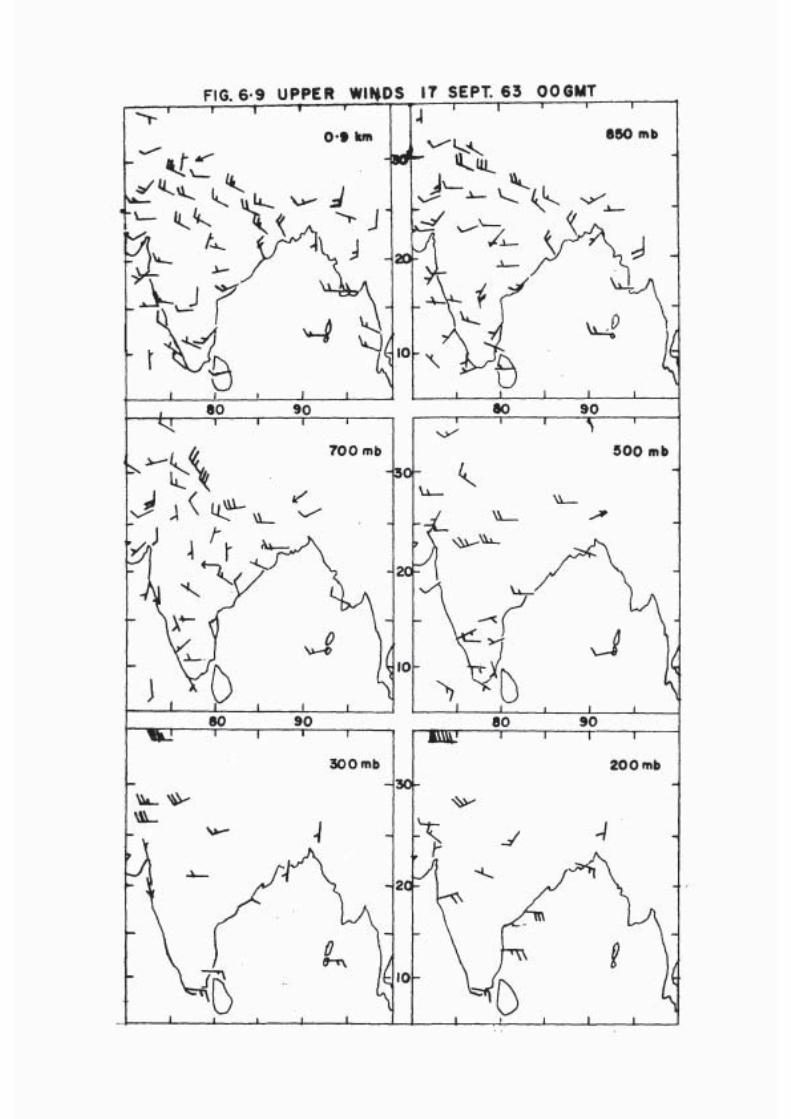
FIG. 6.9 UPPER WINDS 17 SEPT. 63 00 GMT

FIG. 610 VERTICAL TIME SECTION - NEW DELHI (10-17 SEPT. 63)

FIG. 7.1 SYNOPTIC CHARTS 0300 GMT 9 SEPT. 70

FIG. 7-2 UPPER WINDS 9 SEPT. 70 00 GMT
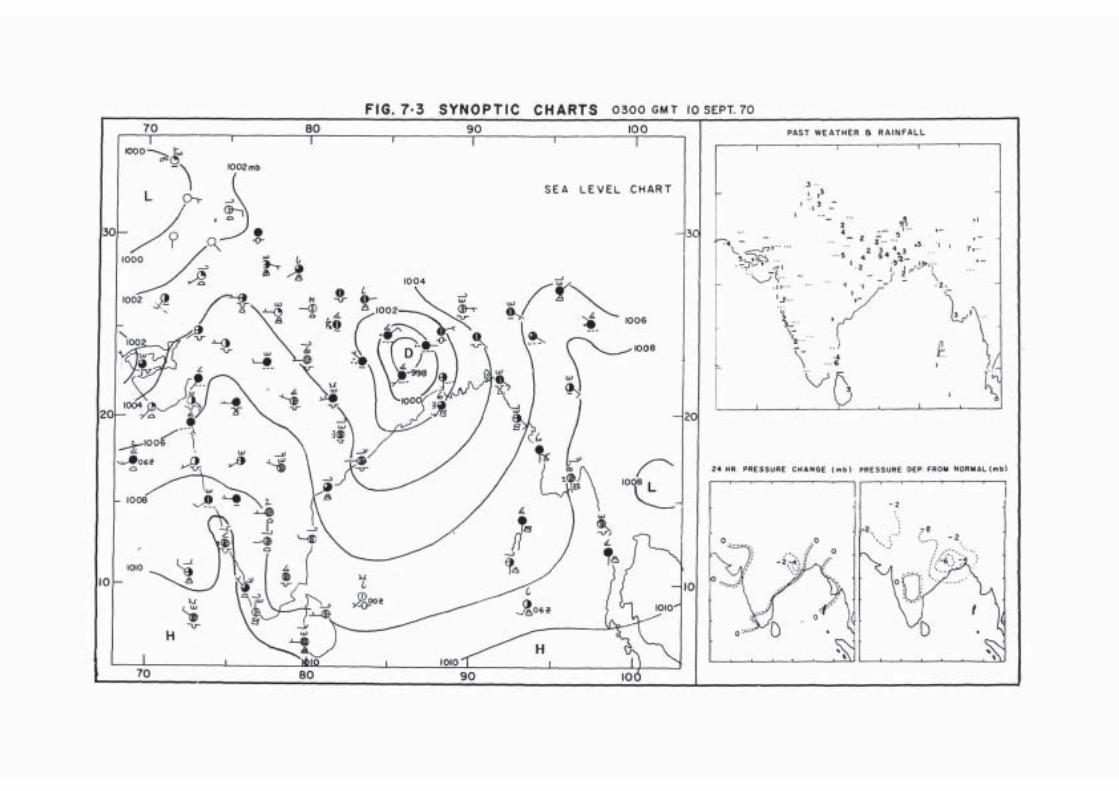
FIG. 7.3 SYNOPTIC CHARTS 0300 GMT 10 SEPT. 70
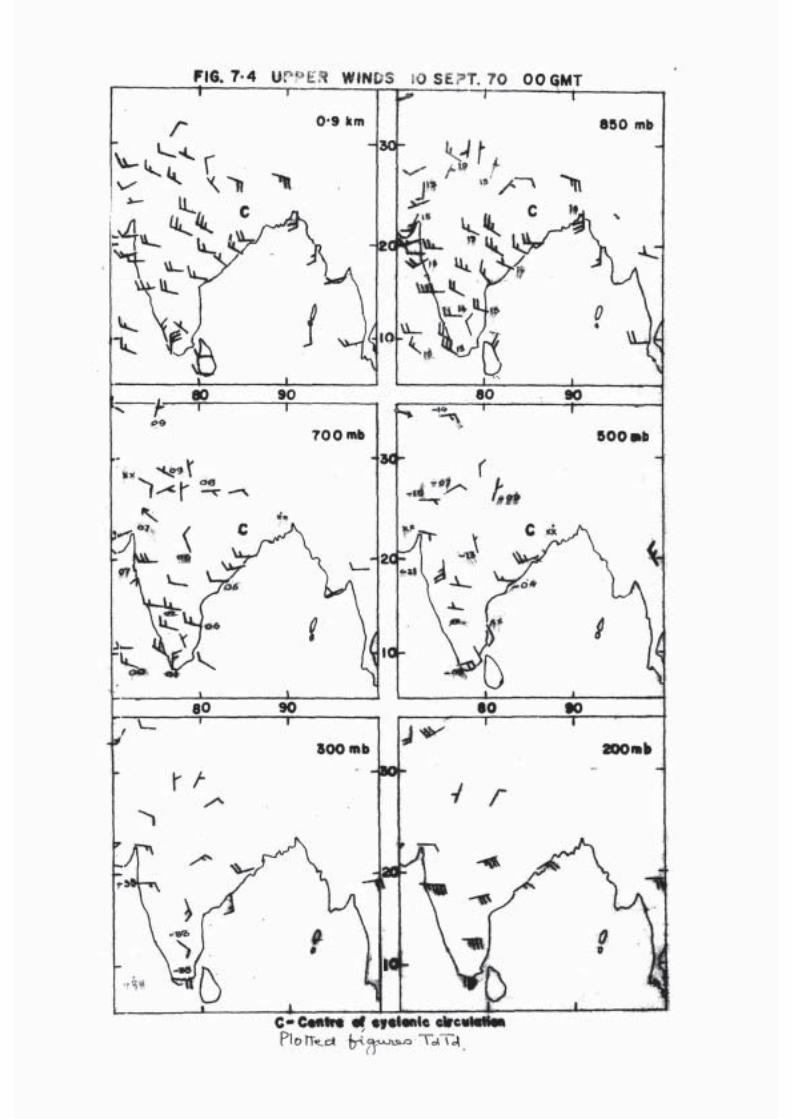
FIG. 7.4 UPPER WINDS 10 SEPT. 70 00GMT
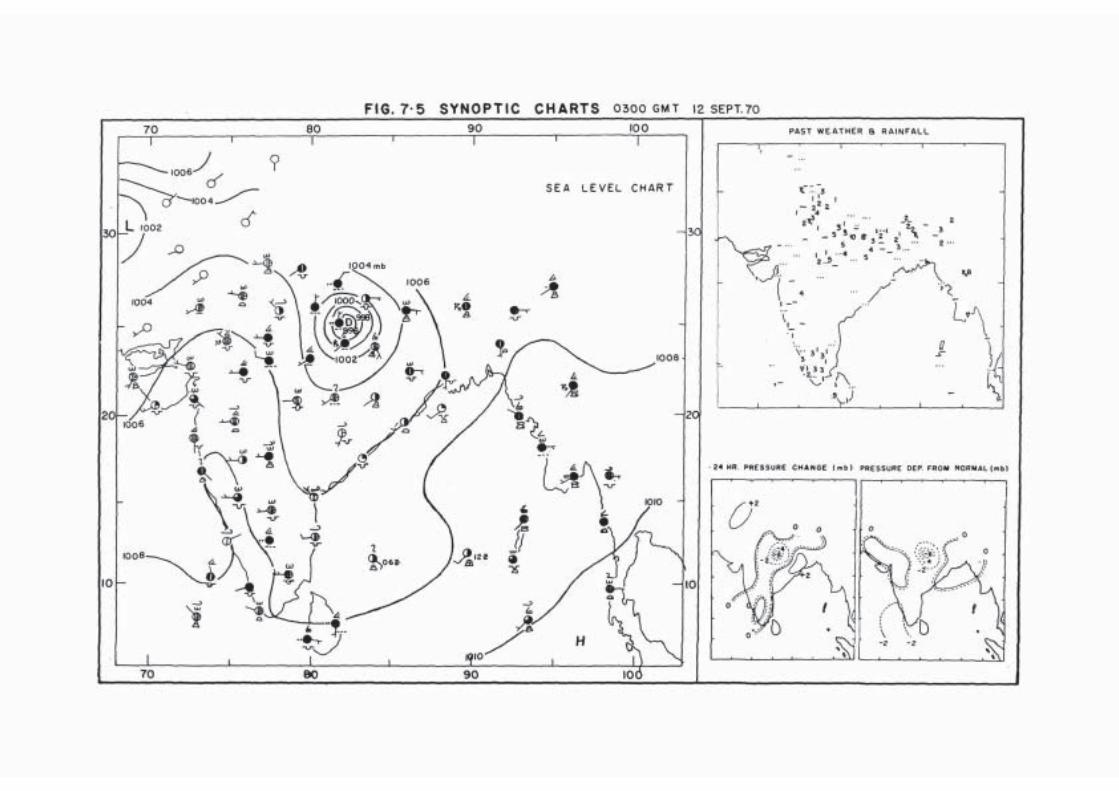
FIG. 7.5 SYNOPTIC CHARTS 0300 GMT 12 SEPT.70

FIG. 7-6 UPPER WINDS 12 SEPT. 70 GMT

FIG. 7-7 SYNOPTIC CHARTS 0300 GMT 13 SEPT. 70
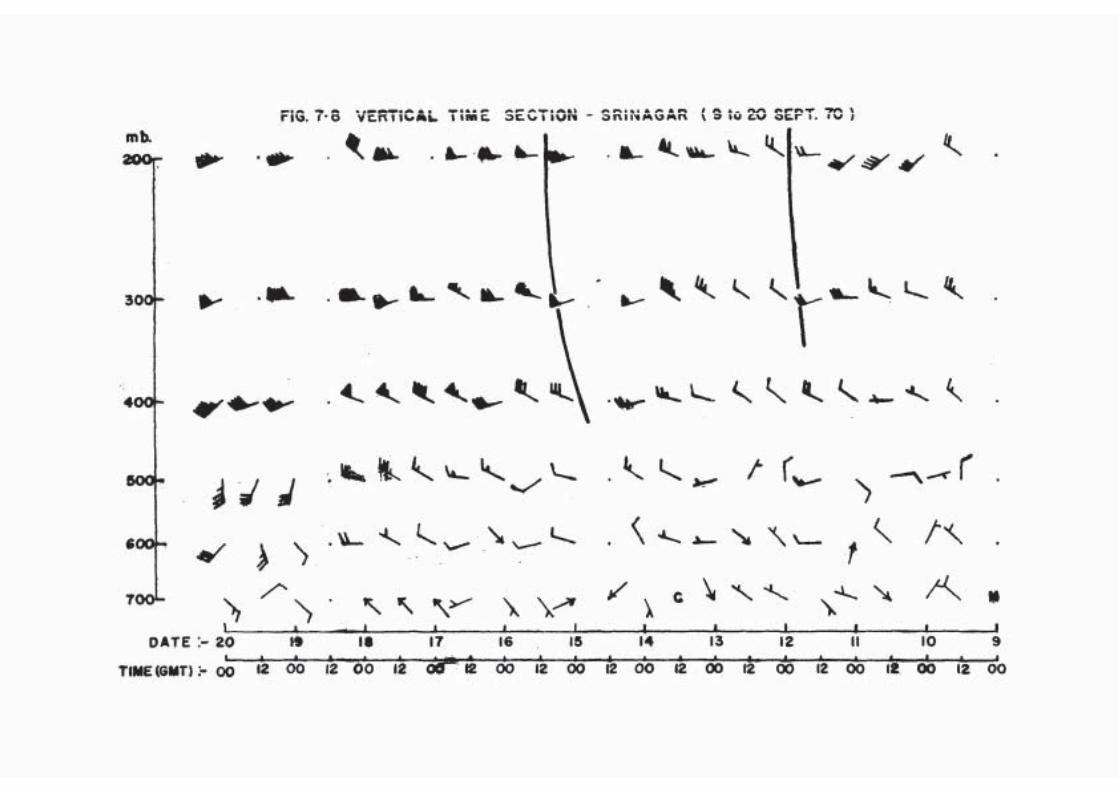
FiG. 7-6 VERTICAL TIME SECTION - SRINAGAR ( 9 to 20 SEPT. 70 )

FIG. 7-9 UPPER WINDS 14 SEPT. 70 00 GMT
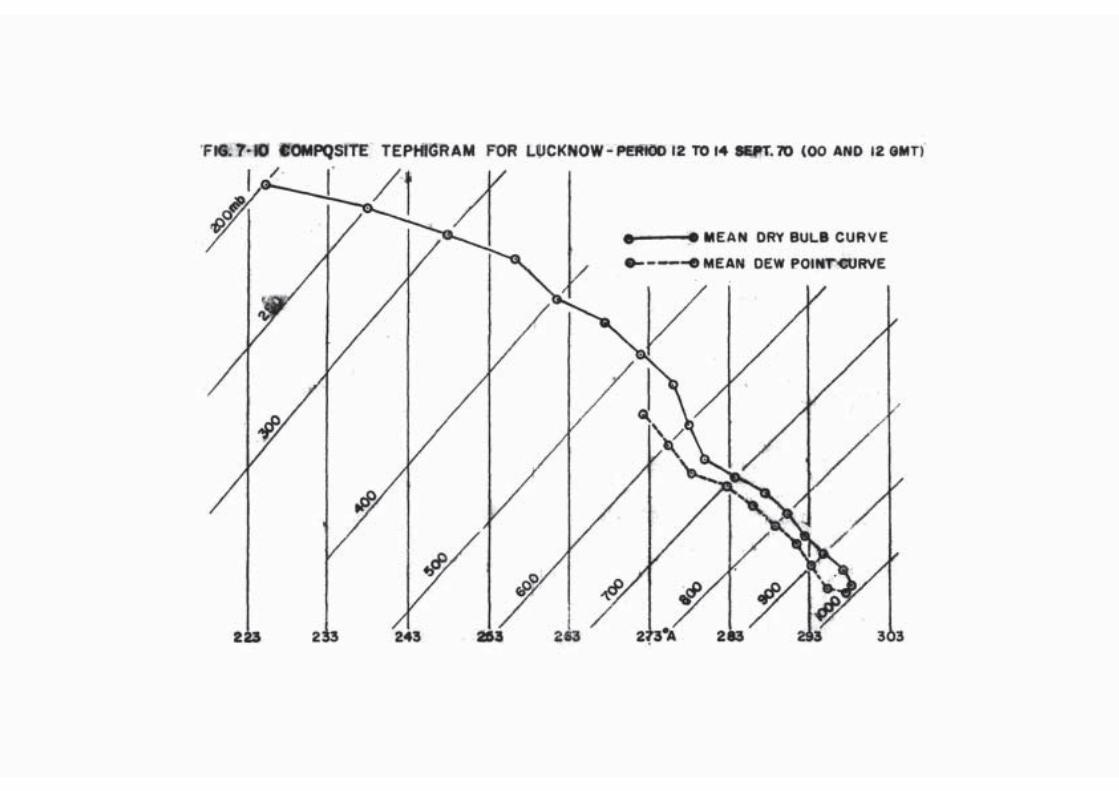
FIG. 7.10 COMPQSITE TEPHIGRAM FOR LUCKNOW-PERIOD 12 TO

FIG. 711 TEPHIGRAM FOR CALCUTTA - 9 SEPT. 70 (00 GMT)

FIG. 8-1 SYNOPTIC CHARTS 0300 GMT 19 AUG 69
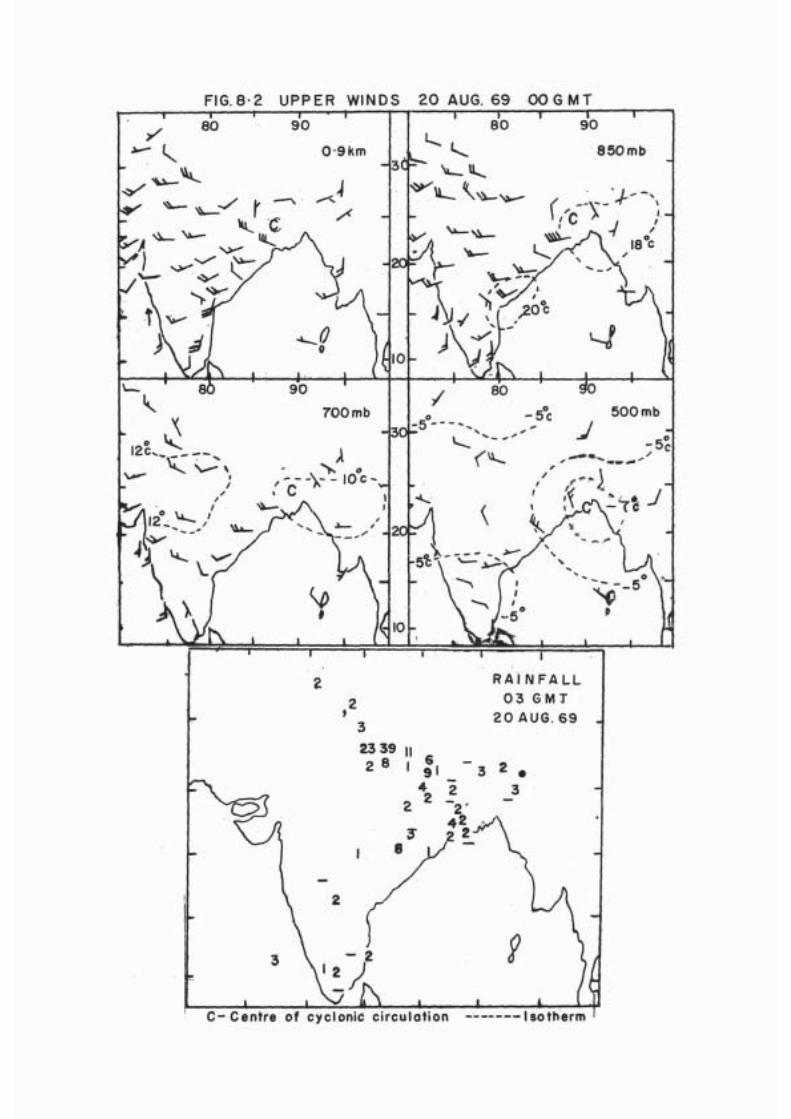
FIG.8-2 UPPER WINDS 20 AUG. 69 OO GMT

FIG. 9.3 SYNOPTIC CHARTS 0300 GMT 22 AUG. 69
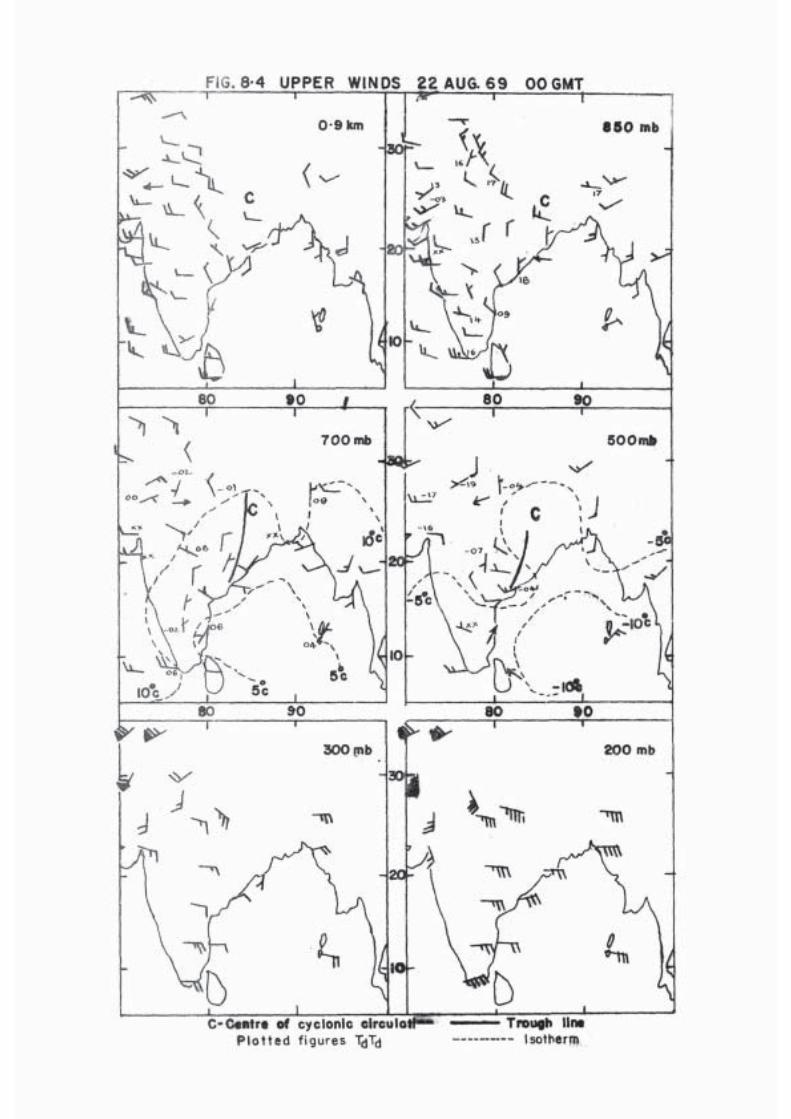
FIG. 8-4 UPPER WINDS 22 AUG. 69 00 GMT
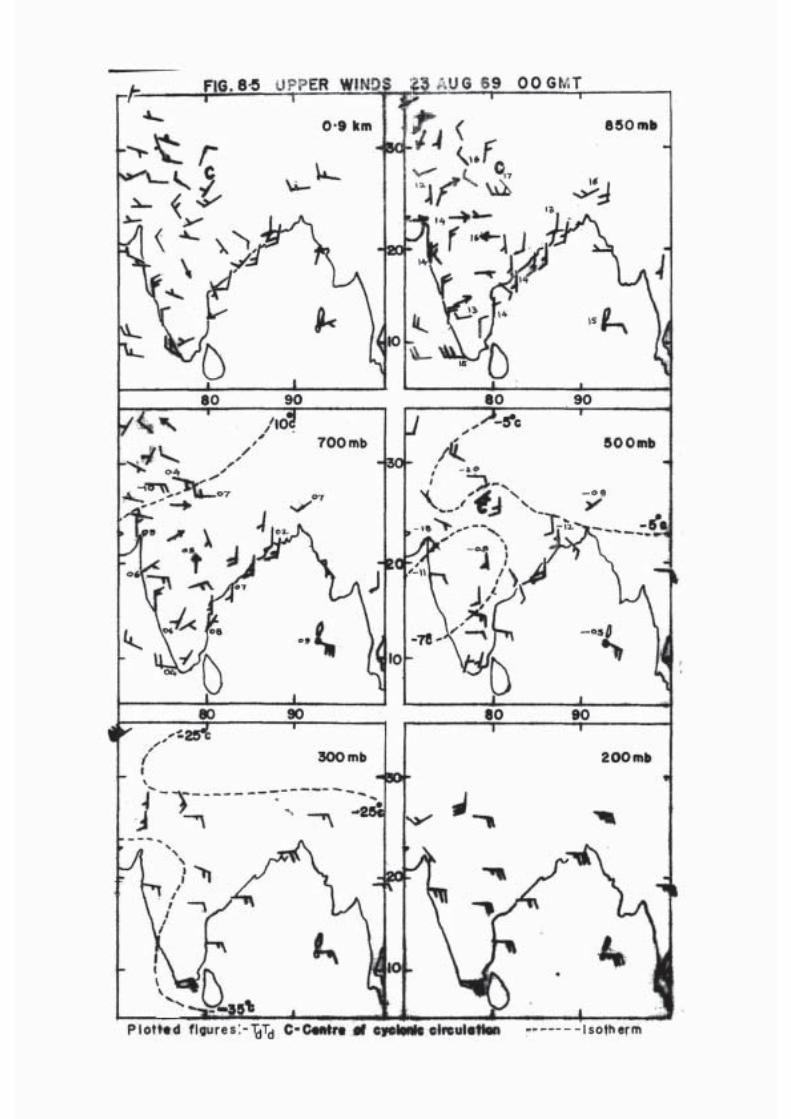
FIG. 8.5 UPPER WINDS 23 AUG 69 00 GMT

FIG. 8-6 UPPER WINDS 31 JUL.70 OO GMT

FIG. 8-7 UPPER WINDS I AUG. 70 0 0 GMT
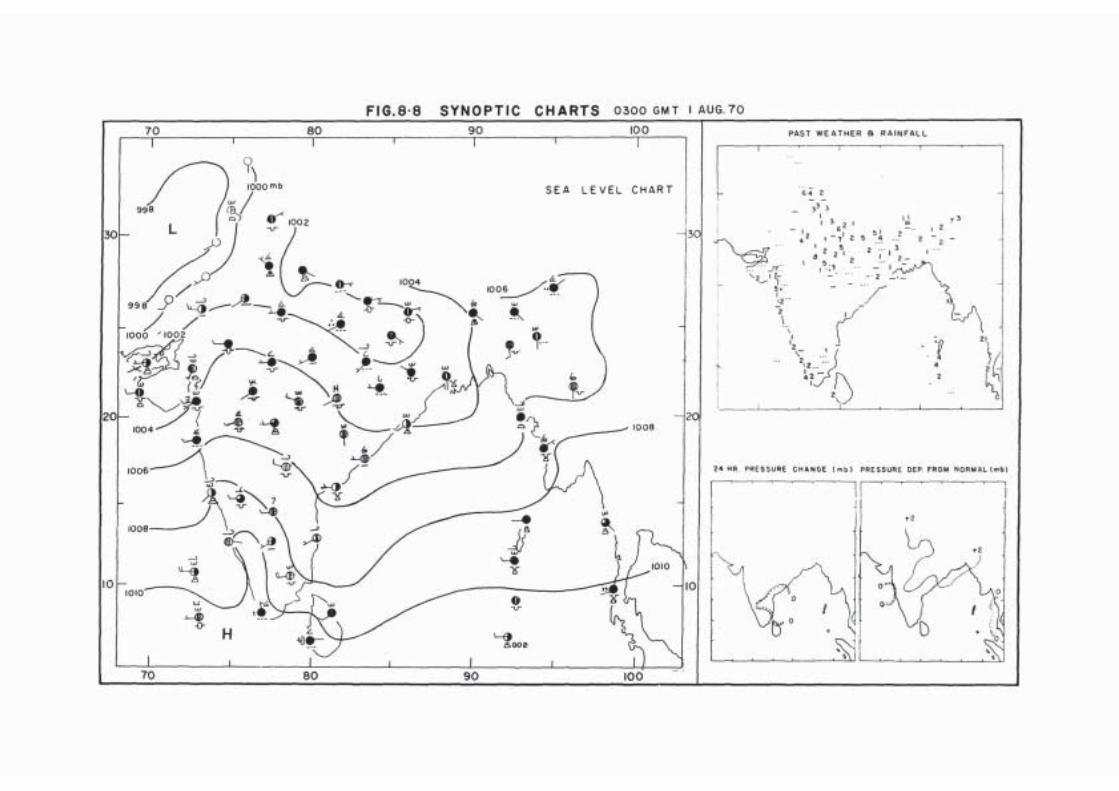
FIG.8-8 SYNOPTIC CHARTS 0300 GMT 1 AUG 7O
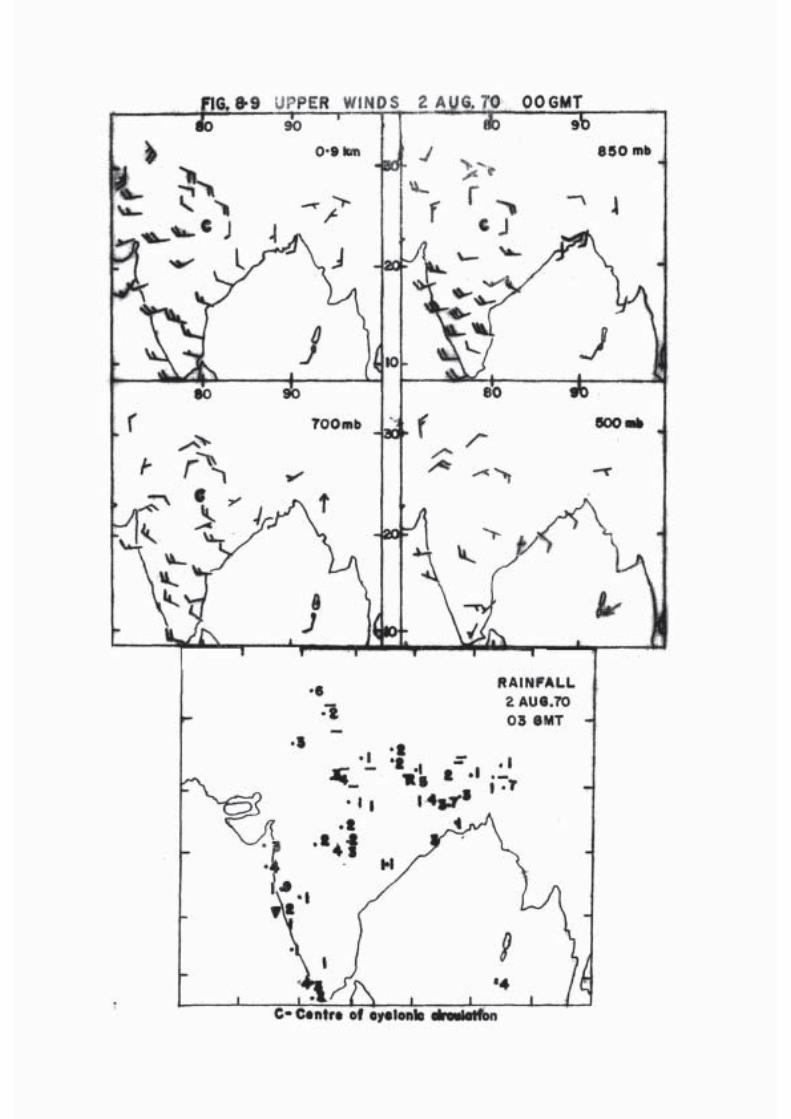
FIG.8-9 UPPER WINDS 2 AUG. 70 00GMT
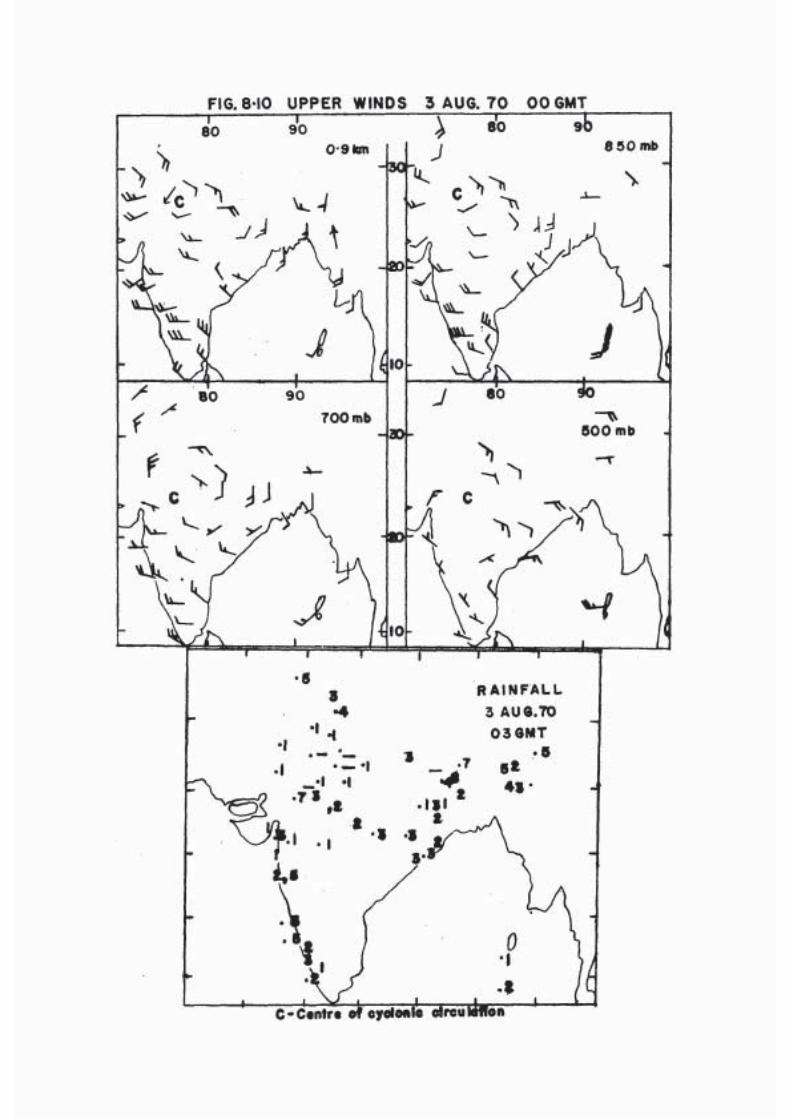
FIG. 8-10 UPPER WINDS 3 AUG. 70 00 6MT
C-Centre of cyolonle circulation

FIG. 9.1 SYNOPTIC CHARTS 0300 GMT 23 JUL.66
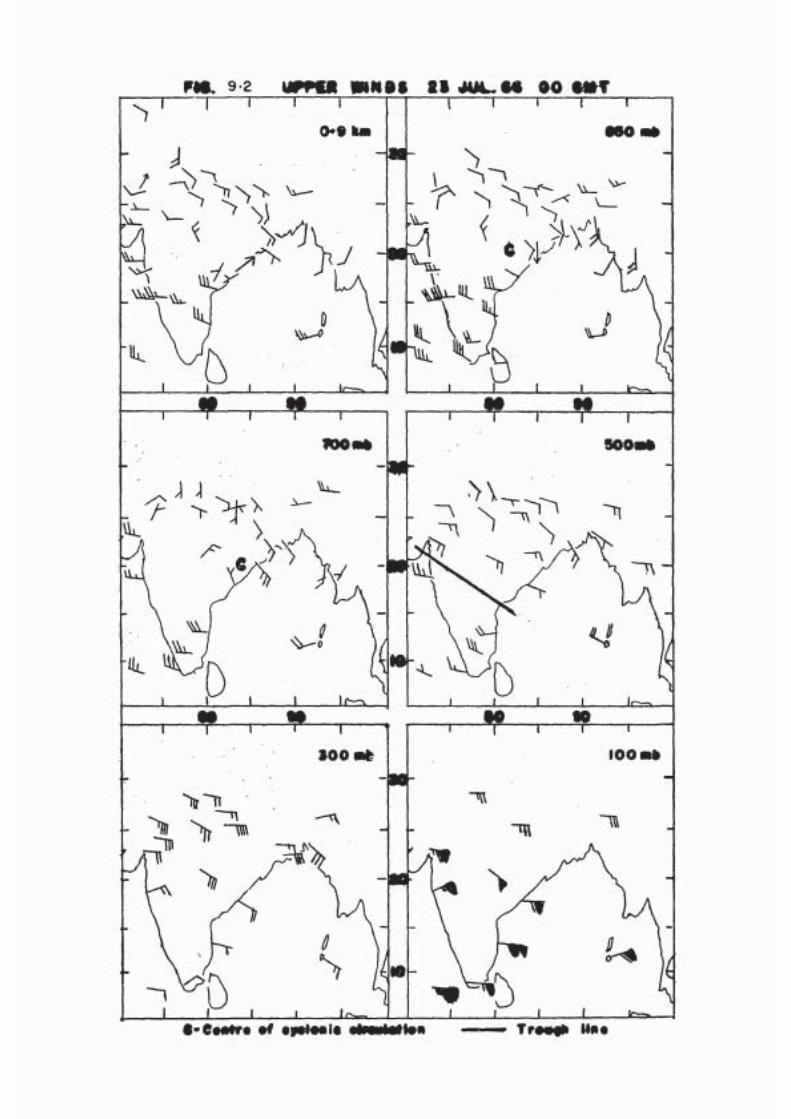
FIG 9. 2 UPPER WINDS 23 JUL 66 OO GMT

FIG. 9.3 SYNOPTIC CHARTS 0300 GMT 25 JUL. 66

FIG. 9.4 UPPER WINDS 25 JUL.66 00 GMT
Trough line
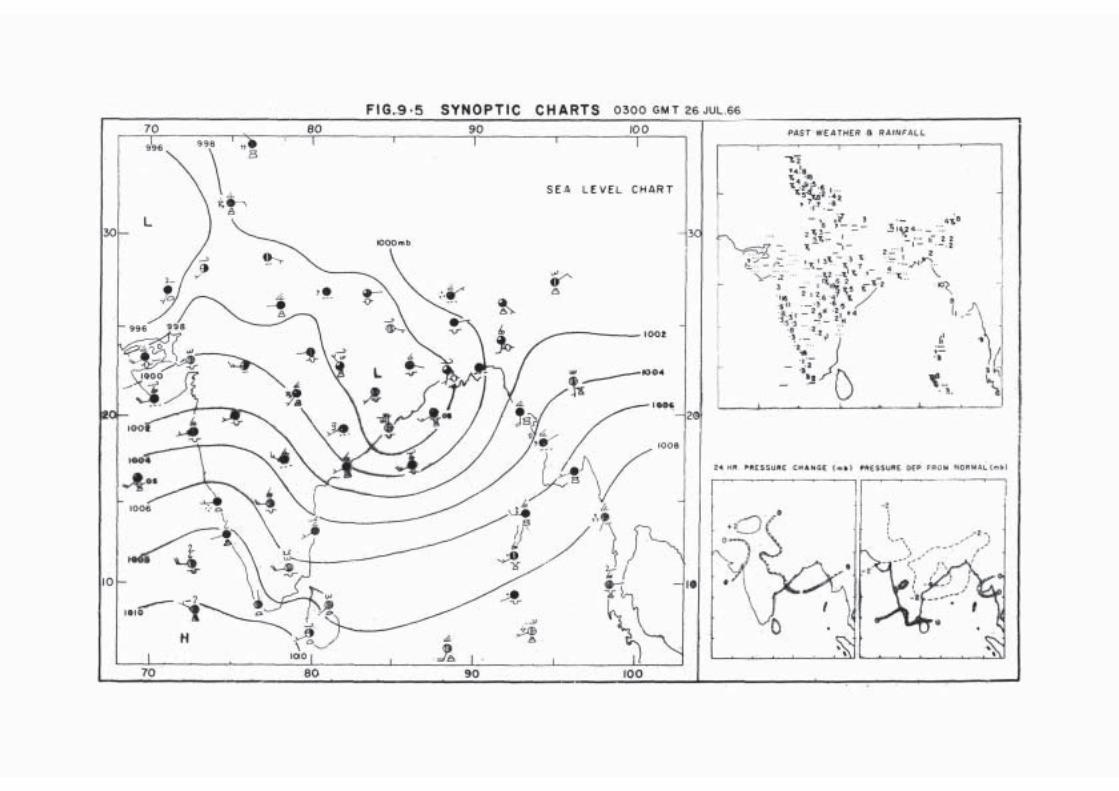
FIG.9 .5 SYNOPTIC CHARTS 0300 GMT 26 JUL.66

FIG.9.6 UPPER WINDS 26 JUL. 66 0 0 GMT
C-Centre of cyclonic circulation Trough line
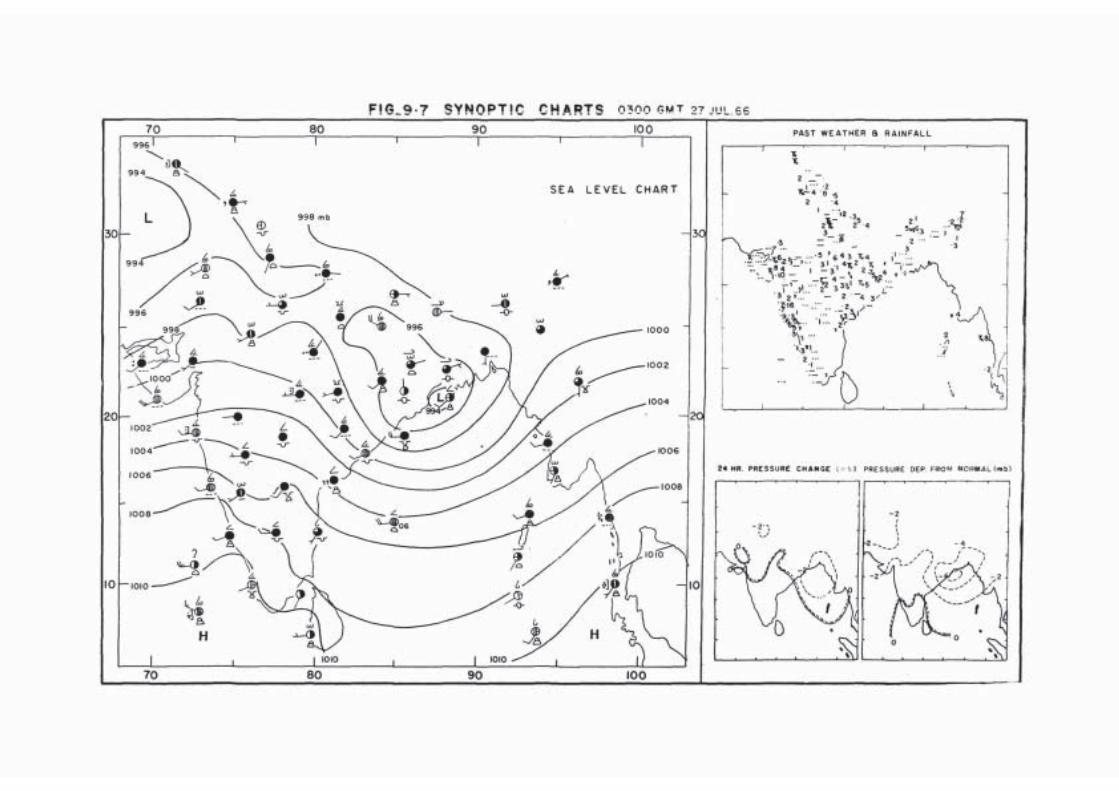
FIG 9.7 SYNOPTIC CHARTS 0300 GMT 27 Jul 66
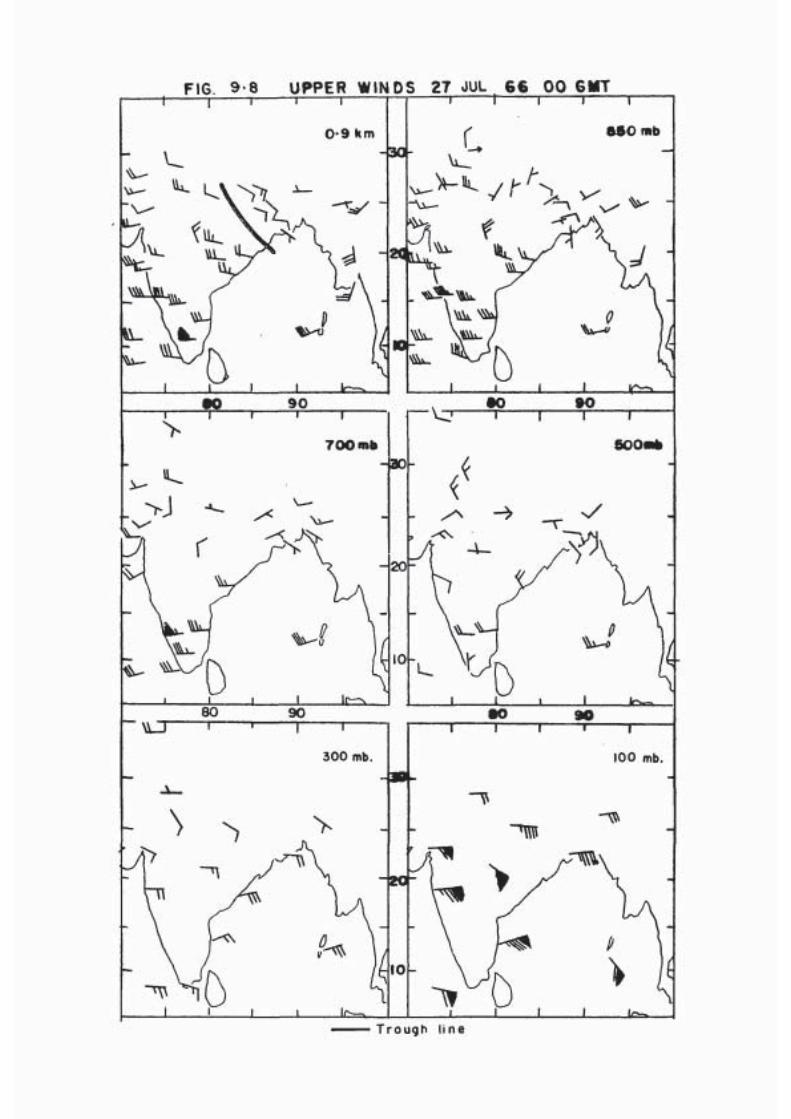
FIG. 9-8 UPPER WINDS 27 JUL . 66 00 GMT

FIG. 9 .9 SYNOPTIC CHARTS 0300 GMT 16 AUG. 69
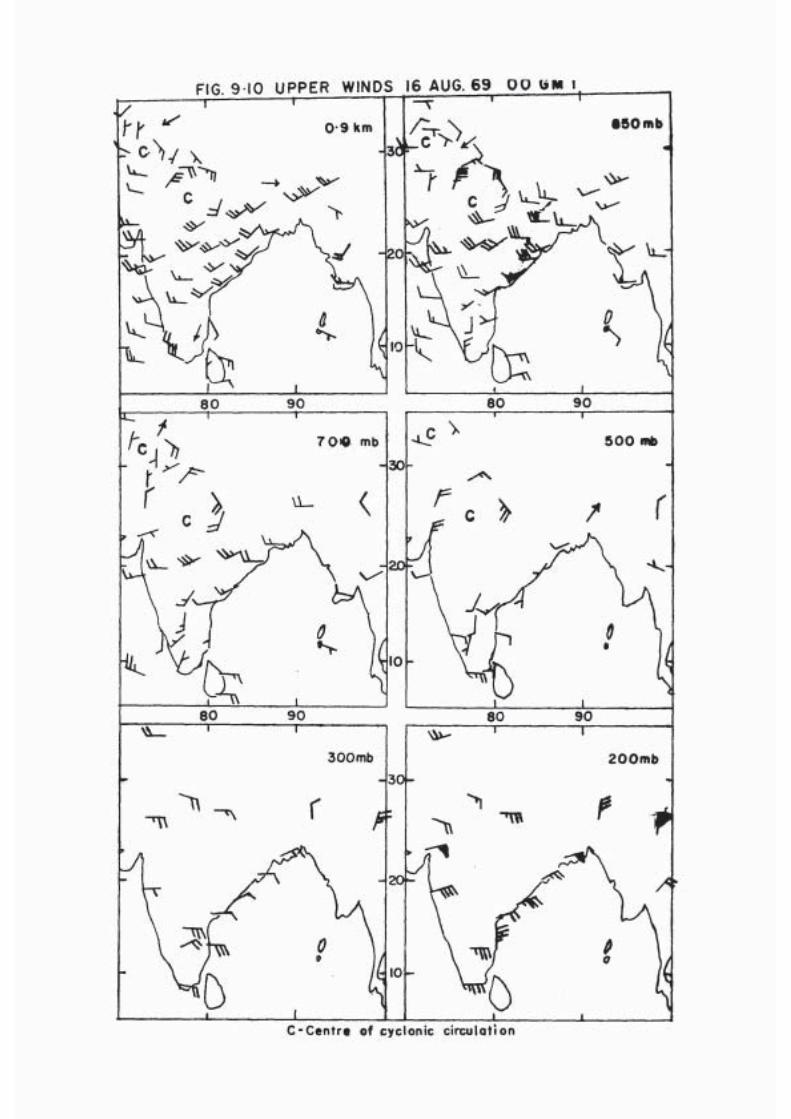
FIG. 9.10 UPPER WINDS 16 AUG. 69 0 0 GMT
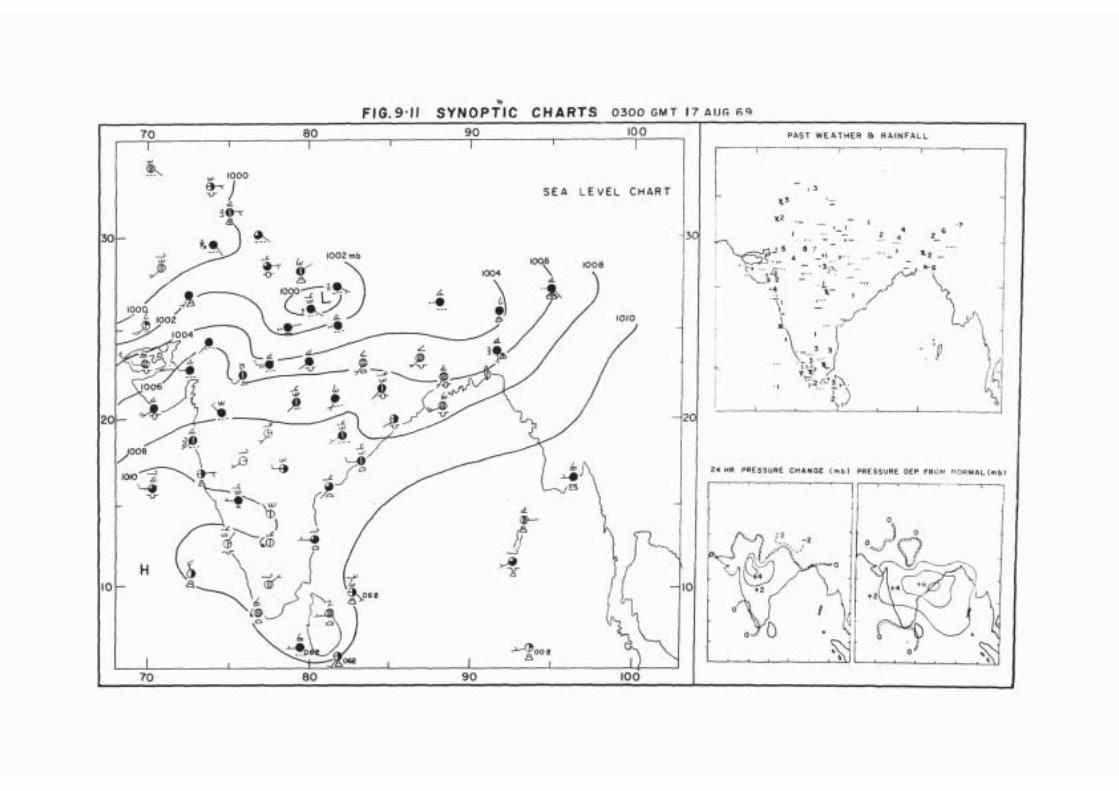
FIG. 9-11 SYNOPTIC CHARTS 0300 GMT 17 AUG 69

FIG. 9.12 UPPER WINDS 17 AUG. 69 0 0 GMT

F ! G . 9 ! 3 SYNOPTIC CHARTS 0300 GMT 18 AUG 6 9100 PAST WEATHER 8 RAINFALL

FIG. 9.14 UPPER WINDS 18 AUG.69 OO GMT

FIG. 10.1 UPPER AIR CHART 20 JUL.68 0 0 GMT 3 0 0 mb

FIG. 10-2 UPPER AIR CHART 23 AUGUST 67 0 0 GMT 500mb

FIG. 10-3 UPPER AIR CHART 24 AUGUST 67 0 0 GMT 500 mb

FIG.10-4 SYNOPTIC CHARTS 0300 GMT 24 AUG. 67

FIG. 10-5 UPPER WINDS 24 AUG. 67 00 GMT

FIG. 10.6 UPPER AIR CHART 25 AUG. 67 00 GMT
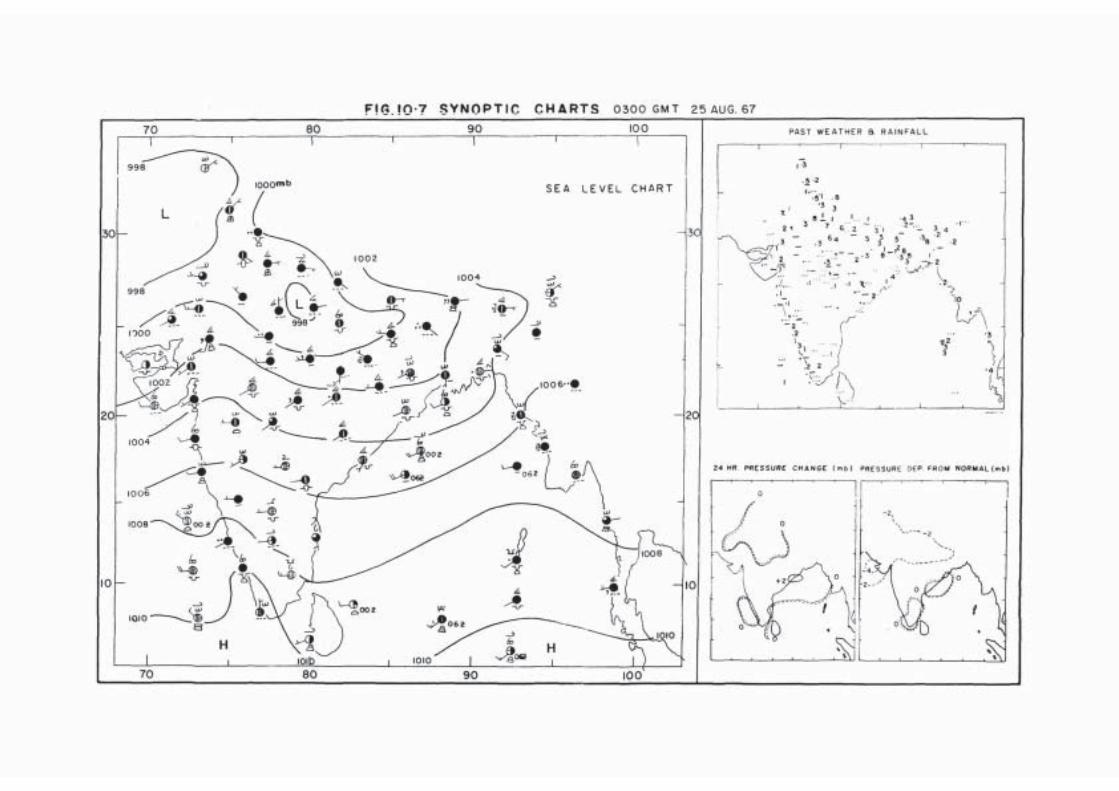
FIG.10.7 SYNOPTIC CHARTS 0300 GMT 25 AUG. 67
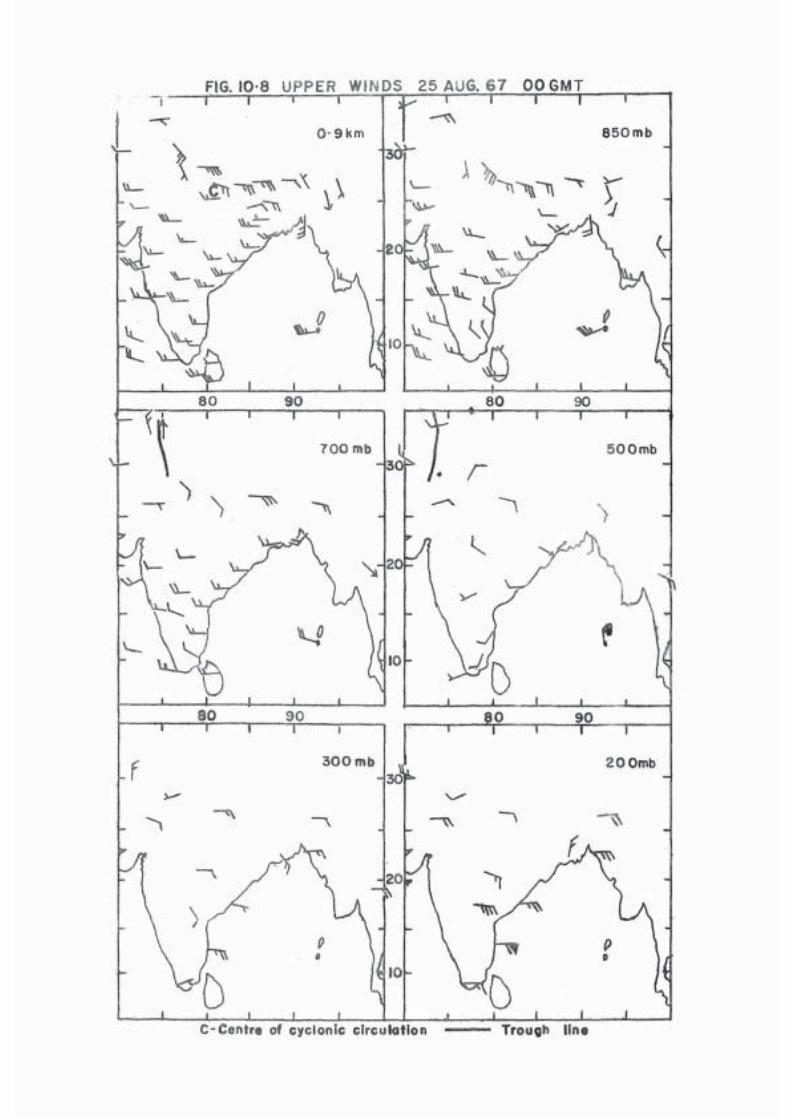
FIG. 10.8 UPPFR WINDS 25 AUG. 6 7 0 0 GMT

FI6.10.9 UPPER AIR CHART 25 AUG. 67 42 GMT

FIG. 10.10 SYNOPTIC CHARTS 0300 GMT 27 AUG.67
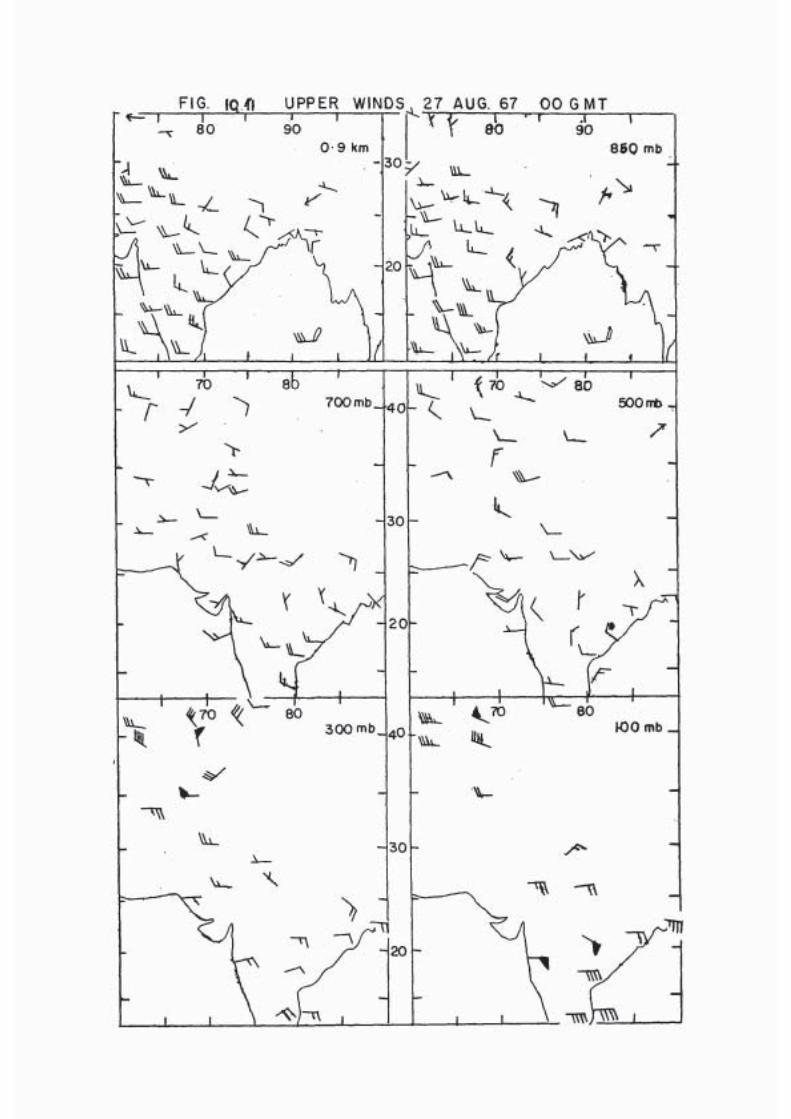
FIG. 10. 41 UPPER WINDS, 27 AUG. 67 0 0 GMT

FIG 10-12 SYNOPTIC CHARTS 0300 GMT 28 AUG.67
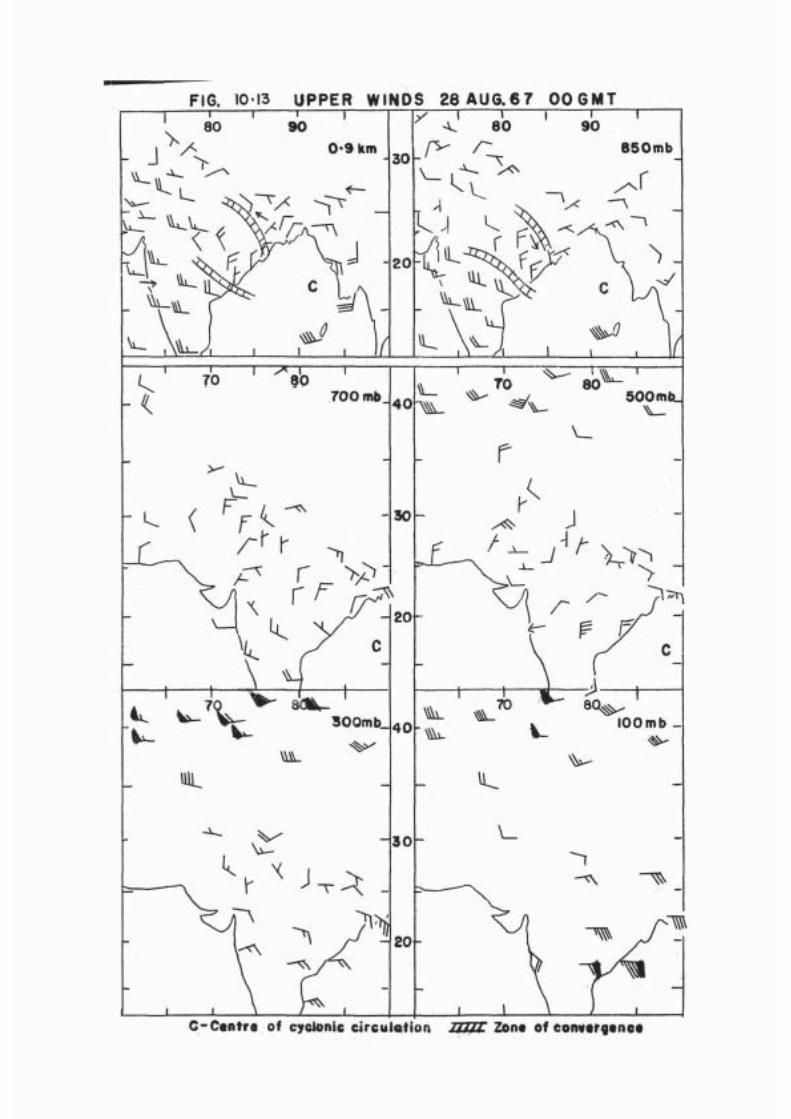
FIG. 10.13 UPPER WINDS 28 AUG. 67 00 GMT

FORECASTING MANUAL REPORTS
No. I-1 Monthly Mean Seal Level Isobaric Charts - R.Ananthakrishnan,V. Srinivasan and A.R. Ramakrishnan.
No. I-2 Climate of India - Y.P. Rao and K.S. Ramamurti.
No. II-l Methods of Analysis: 1. Map Projections for Weather Charts -K. Krishna
No. III-l.l Discussion of Typical Synoptic Weather Situations: Winter -Western Disturbances and their Associated Features - Y.P. Raoand V. Srinivasan.
No.III-3.1 Discussion of Typical Synoptic Weather Situations: SouthwestMonsoon: Active and Weak monsoon conditions over GujaratState - Y.P. Rao, V.Srinivasan, S.Raman and A.R.Ramakrishnan.
No.III-3.2 Discussion of Typical Synoptic Weather Situations: SouthwestMonsoon: Active and Weak monsoon conditions over Orissa -Y.P. Rao, V. Srinivasan, A.R. Ramakrishnan and S. Raman.
No. III-3.3 Discussion of Typical Synoptic Weather Situations: SouthwestMonsoon: Typical Situations over Northwest India - M.S.V.Rao,V. Srinivasan and S. Raman.
No.III-3.4 Discussion of Typical Synoptic Weather Situations: SouthwestMonsoon: Typical Situations over Madhya Pradesh and Vidarbha -V. Srinivasan, S. Raman and S. Mukherji.
No.IV-13 Rainfall of India - P. Jagannathan.
No.IV-16 Microseisms and Weather - A.N.Tandon and S.N.Bhattacharya.
No.IV-17 Medium Range Forecasting - K.R. Saha and D.A. Mooley.
N0.IV-18.1 On the Criteria for declaring the onset of the southwestmonsoon over Kerala - R. Ananthakrishnan, U.R.Acharya andA.R. Ramakrishnan.
No.IV-18.2 Monsoons of. India: Synoptic Features associated with onsetof Southwest Monsoon over Kerala - R. Ananthakrishnan,V. Srinivasan, A.R. Ramakrishnan and R. Jambunathan.
No.IV-18.3 Some aspects of the "Break" in the Indian Southwest Monsoonduring July and August - K. Ramamurthy.
No. IV-20 Evaporation - N. Ramalingam.
No.V-1 Techniques of High Level Analysis and Prognosis»1. Organisation and Methods of Analysis - P.K. Das,N.C. Rai Sircar and D.V. Rao.