Embed Size (px)
Citation preview

© 2017 Gresham Partners, LLC. All Rights Reserved. 1
Background
There is an old Indian expression “India grows at night, while
the government sleeps” that refers to the country’s economic
progress despite the presence of a large, burdensome state.
Recently however, Indian headlines have turned positive
based on significant central government reforms and the
acceleration of their economic growth rate, which now
exceeds that of China, making India the world’s fastest-
growing large economy.
Much of the positive sentiment derives from recent structural
reforms undertaken by Prime Minister Narendra Modi and
his ruling Bharitiya Janata Party (“BJP”). These reforms
are so extreme that many opponents and supporters
alike deemed them political suicide. Instead, the BJP’s
subsequent landslide victory in the Uttar Pradesh, India’s
most populous and politically important state, has only
strengthened their political standing and emboldened their
pro-business reforms, creating the potential for India to
become an economic growth leader for years to come.
However, it is important to remember that thirty years ago,
many prognosticators predicted that India would emerge as
the key driver of global economic growth over the coming
decades. The thesis was that a country with a population
that nearly rivaled China, with a western-based legal
system and a functioning free market economy would
provide the foundation for inexorable economic growth
and prosperity. Instead it was China, a country without
these perceived advantages, which lifted large portions of
its citizens out of poverty by urbanizing and developing
a robust industrial base to become the primary driver of
global growth, as shown in Chart 1.
For decades, western analysts believed the economic potential of India, given its perceived advantages, such as a free market economy, democratically elected government and western-style legal system, would allow India to become a dominant global economic and political power. Political inefficiency, corruption and historical cultural influences have derailed India’s progress, but reforms by the recently elected government have the potential to finally jump-start the economy and lift its citizens out of poverty.
What are the current challenges? What are the significant reforms? Will the political will for reform continue despite their significant short-term hardships? If so, can investors overcome the existing challenges to reap the potential rewards from the tailwinds that might be created? We provide our answers to these questions and share some insights into our current investment approach in India.
India: Into the DaylightTed Neild, President and Chief Investment OfficerJoe Simpson, Portfolio Manager
Chart 1. Despite a Head Start, India has Urbanized Much Slower than China
Population Living in Urban Areas60%
55%
50%
45%
40%
35%
30%
25%
20%
15%
10%
1950 1955 1960 1965 1970 1975 1980 1985 1990 1995 2000 2005 2010 2015
ChinaIndia
Source: Gavekal Data/Macrobond
2 October, 2017
Cultural and Historical Influences
Many don’t appreciate the important cultural differ-
ences that have contributed to these divergent
growth paths. India’s low growth emanates from its
long-standing hierarchical culture, in which elitist
tendencies never prioritized elevating its citizens
culturally, educationally or economically. In contrast,
China’s non-stratified culture and egalitarian bias
were centered on elevating the welfare of its people.
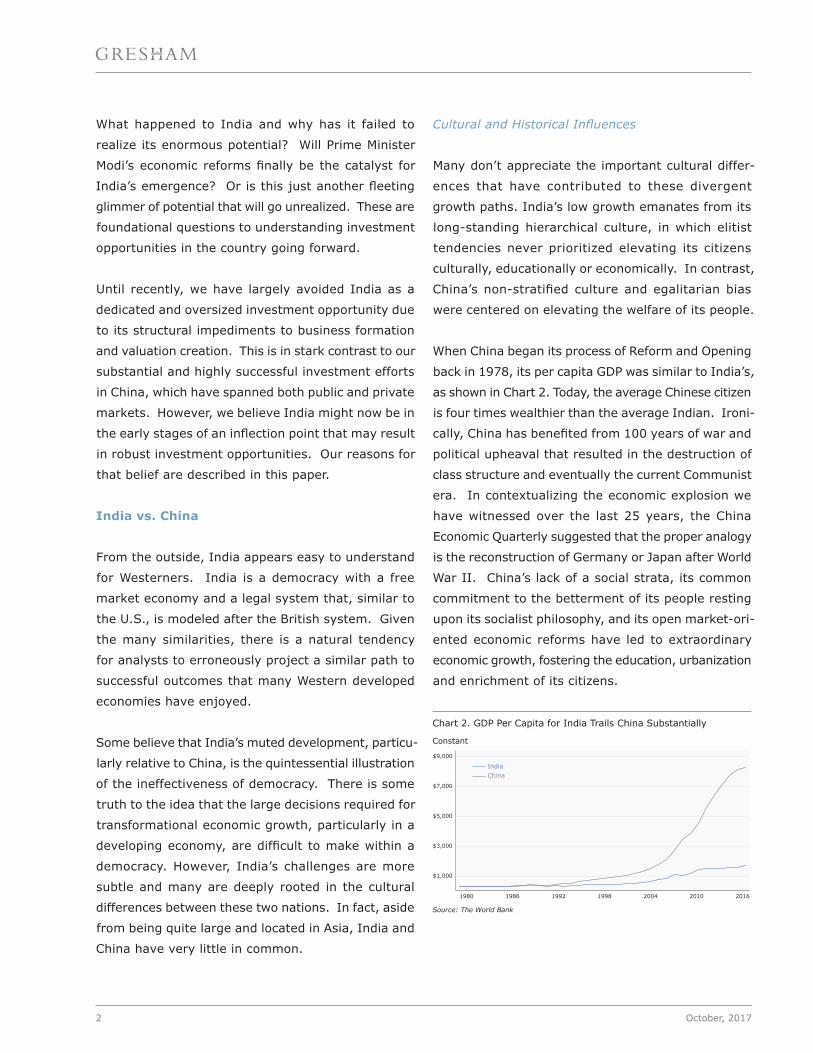
When China began its process of Reform and Opening
back in 1978, its per capita GDP was similar to India’s,
as shown in Chart 2. Today, the average Chinese citizen
is four times wealthier than the average Indian. Ironi-
cally, China has benefited from 100 years of war and
political upheaval that resulted in the destruction of
class structure and eventually the current Communist
era. In contextualizing the economic explosion we
have witnessed over the last 25 years, the China
Economic Quarterly suggested that the proper analogy
is the reconstruction of Germany or Japan after World
War II. China’s lack of a social strata, its common
commitment to the betterment of its people resting
upon its socialist philosophy, and its open market-ori-
ented economic reforms have led to extraordinary
economic growth, fostering the education, urbanization
and enrichment of its citizens.
What happened to India and why has it failed to
realize its enormous potential? Will Prime Minister
Modi’s economic reforms finally be the catalyst for
India’s emergence? Or is this just another fleeting
glimmer of potential that will go unrealized. These are
foundational questions to understanding investment
opportunities in the country going forward.
Until recently, we have largely avoided India as a
dedicated and oversized investment opportunity due
to its structural impediments to business formation
and valuation creation. This is in stark contrast to our
substantial and highly successful investment efforts
in China, which have spanned both public and private
markets. However, we believe India might now be in
the early stages of an inflection point that may result
in robust investment opportunities. Our reasons for
that belief are described in this paper.
India vs. China
From the outside, India appears easy to understand
for Westerners. India is a democracy with a free
market economy and a legal system that, similar to
the U.S., is modeled after the British system. Given
the many similarities, there is a natural tendency
for analysts to erroneously project a similar path to
successful outcomes that many Western developed
economies have enjoyed.
Some believe that India’s muted development, particu-
larly relative to China, is the quintessential illustration
of the ineffectiveness of democracy. There is some
truth to the idea that the large decisions required for
transformational economic growth, particularly in a
developing economy, are difficult to make within a
democracy. However, India’s challenges are more
subtle and many are deeply rooted in the cultural
differences between these two nations. In fact, aside
from being quite large and located in Asia, India and
China have very little in common.
2016201020041992 199819861980
$9,000
$7,000
$5,000
$3,000
$1,000
ChinaIndia
Source: The World Bank
Chart 2. GDP Per Capita for India Trails China Substantially
Constant
India: Into the Daylight
© 2017 Gresham Partners, LLC. All Rights Reserved. 3
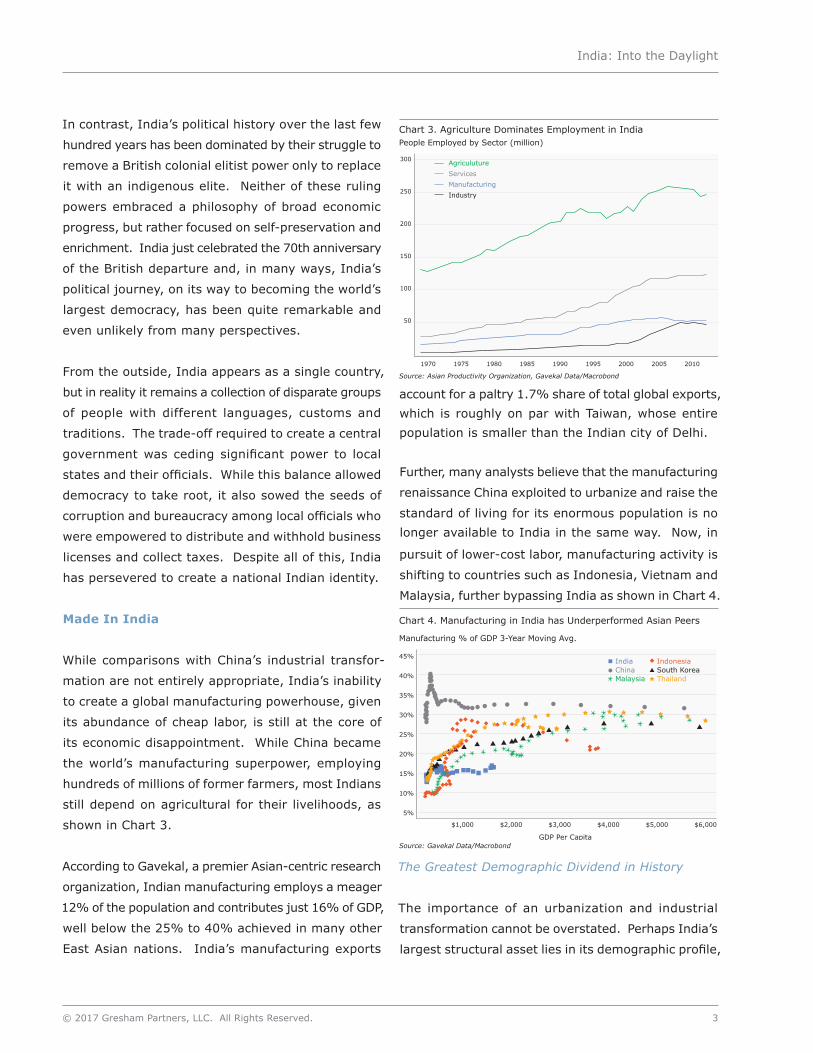
account for a paltry 1.7% share of total global exports, which is roughly on par with Taiwan, whose entire population is smaller than the Indian city of Delhi.
Further, many analysts believe that the manufacturing
renaissance China exploited to urbanize and raise the
standard of living for its enormous population is no longer available to India in the same way. Now, in
pursuit of lower-cost labor, manufacturing activity is
shifting to countries such as Indonesia, Vietnam and
Malaysia, further bypassing India as shown in Chart 4.
In contrast, India’s political history over the last few
hundred years has been dominated by their struggle to
remove a British colonial elitist power only to replace
it with an indigenous elite. Neither of these ruling
powers embraced a philosophy of broad economic
progress, but rather focused on self-preservation and
enrichment. India just celebrated the 70th anniversary
of the British departure and, in many ways, India’s
political journey, on its way to becoming the world’s
largest democracy, has been quite remarkable and
even unlikely from many perspectives.
From the outside, India appears as a single country,
but in reality it remains a collection of disparate groups
of people with different languages, customs and
traditions. The trade-off required to create a central
government was ceding significant power to local
states and their officials. While this balance allowed
democracy to take root, it also sowed the seeds of
corruption and bureaucracy among local officials who
were empowered to distribute and withhold business
licenses and collect taxes. Despite all of this, India
has persevered to create a national Indian identity.
Made In India
While comparisons with China’s industrial transfor-
mation are not entirely appropriate, India’s inability
to create a global manufacturing powerhouse, given
its abundance of cheap labor, is still at the core of
its economic disappointment. While China became
the world’s manufacturing superpower, employing
hundreds of millions of former farmers, most Indians
still depend on agricultural for their livelihoods, as
shown in Chart 3.
According to Gavekal, a premier Asian-centric research
organization, Indian manufacturing employs a meager
12% of the population and contributes just 16% of GDP,
well below the 25% to 40% achieved in many other
East Asian nations. India’s manufacturing exports
1970 1975 1980 1985 1990 1995 2000 2005 2010
300
250
200
150
100
50
IndustryManufacturingServicesAgriculuture
Source: Asian Productivity Organization, Gavekal Data/Macrobond
Chart 3. Agriculture Dominates Employment in IndiaPeople Employed by Sector (million)
IndiaChina South KoreaMalaysia Thailand
Indonesia
$1,000 $2,000 $3,000 $4,000 $5,000 $6,000
45%
40%
35%
30%
25%
20%
15%
10%
5%
GDP Per Capita Source: Gavekal Data/Macrobond
Chart 4. Manufacturing in India has Underperformed Asian Peers
Manufacturing % of GDP 3-Year Moving Avg.
The Greatest Demographic Dividend in History
The importance of an urbanization and industrial
transformation cannot be overstated. Perhaps India’s
largest structural asset lies in its demographic profile,

4 October, 2017
as the share of its working-age population will continue
to increase and its dependency ratio falls. Already
on schedule to become the world’s most populous
country in 2022, India’s population is also uniquely
youthful. More than half of Indians are under age 25,
nearly two-thirds are working age (15-64), and less
than 3% are over the age of 70. This youthful surge
will peak in 2030 as shown in Chart 5, by which time
an additional 200 million people will have entered the
workforce and 485 million people, or one-third of the
population, will be aged 15-34. The magnitude of
these numbers is staggering.
on the land, often barely above a subsistence level,
while many others are employed informally with few
labor protections and measly pay.
As evidence of the magnitude of this challenge, The
Times of India reported that last year in the West
Bengal state an estimated 2.5 million candidates –
including college graduates, postgraduates and even
PhDs – responded to an advertisement seeking applica-
tions for 6,000 entry-level positions in the government
secretariat. In 2015, it was reported that 2.3 million
candidates applied for 368 low-level positions in Uttar
Pradesh, equating to 6,250 candidates, including 250
candidates with doctorate degrees, for every post.
Current Economic Challenges
Before analyzing the potential impact of Modi reforms,
it is helpful to provide some background on the current
economic and business environment.
“Informal” Economy
In 1973, India’s highest personal tax rate, after adding
a surcharge, reached 97.75%. Tax rates subsequently
dropped, but the Indian government had created a
long-lasting incentive to avoid paying taxes. Partially
as a result of oppressive tax regimes, the Indian
economy came to be dominated by cash transactions.
This so-called “informal” segment of the economy
allowed citizens to easily conceal their true income
and avoid numerous taxes and the stifling government
regulation associated with the “organized” segments
of the economy. Further, there was little incentive
to change as working outside the system lowered
the cost of doing business and created a systematic
advantage against “organized” competitors.
In 2015, PriceWaterhouseCoopers estimated that
cash transactions in India constituted 68% of total
transactions by value and 98% by volume. Further,
1960 1970 1980 1990 2000 2010 2020 2030 2040 2050
1.2
1.0
0.8
0.6
0.4
0.2
IndiaChina
Source: Gavekal Data/Macrobond
Chart 5. India’s Working-Age Population will Soon Surpass China’s
Number of Working-Age People (billion)
If India fails to exploit the potential of its youthful
populace, it will squander the biggest demographic
dividend in history. However, this is a double-edged
sword that creates a political imperative: If hundreds
of millions of young men and women cannot find
work over the next two decades, India’s slums will
fill with resentment and anger that will likely morph
into a social nightmare. Job creation is the highest
priority and India will need to create roughly eight
million jobs every year to absorb new entrants into
the labor force.
India cannot create its desired economic boom without
broadly raising household incomes throughout its
population. Higher incomes create a virtuous cycle,
as wealthier households spend more on goods and
services, in turn creating more jobs. But household
incomes will not rise unless more people are produc-
tively employed. Currently, half of Indian workers toil
India: Into the Daylight
© 2017 Gresham Partners, LLC. All Rights Reserved. 5
Prime Minister Modi has promised to sweep away the
paralysis and corruption of the previous governments
and build a “strong, efficient and enabling state” so that
India can “grow by day.” As one measure of success,
Modi is targeting a Top 50 ranking in the World Bank’s
Doing Business Report by 2018. By demanding a
higher ranking, Modi is paralleling his formal reform
efforts with informal pressure on government ministers
and administrators to implement policies that support
private enterprise. Unfortunately, in the World Bank’s
2017 report, India still ranked a disappointing 130th
out of 190 countries. To put this ranking in perspective,
Russia ranked 40th, China 78th and Indonesia 91st.
However, there are signs of progress. It now takes
45 days to get connected to the power grid, down
from 138 days two years ago, which is almost twice as
fast as the average for OECD countries. Additionally,
reliability of power ranks 26th in the world, which
suggests that a bailout and reform of state power
distributors is beginning to work. Further, only 12
countries do a better job than India of protecting
shareholders after it implemented its Companies Act
of 2013. Productive reforms in India are possible
when the right motivations are supported by sufficient
political capital.
Modi Reforms
Prime Minister Modi rode to election victory on the
promise of reforms, but the early days of his admin-
istration lacked real progress, proving how difficult it
is to unseat entrenched interests. However, over the
past year, he has been successful in implementing
significant and transformative reforms, several of
which are worth discussing in greater detail given
their potential impact.
analysts estimate that as much as half of India’s
output is produced by companies outside the formal
economy. If accurate, this would imply over $2 trillion
of economic activity remains outside the system.
Central to any reform effort is bringing these informal
businesses into the daylight of the organized economy,
broadening the tax base and leveling the playing
field for all.
Business Environment
Historically, India’s governance structure has been
ineffective from almost every perspective. On one
side, the red tape of massive bureaucratic regulation
strangles new business formation and makes existing
firms uncompetitive. On the other, the governance
structure has proved ineffective in building infra-
structure and delivering public services. Whether too
big or too small, the state has failed in every direction.
To better understand the stifling business environment,
Gavekal provides several examples:
• It takes 26 days to start a business and 190 days
to gain a construction permit.
• In Mumbai, it takes nearly 13 days for imports to
clear customs compared to a brisk nine hours in
developed economies.
• Road delays alone are estimated to increase
manufacturing costs to levels two or three times
higher than international benchmarks. Simply
cutting wait times in half would decrease logistics
costs by up to 40%
• Enforcing a contract following a payment dispute
takes nearly four years.
• Factories with more than 100 employees must
receive government approval to fire workers or risk
heavy fines and even prison sentences for managers.
• Companies currently spend 241 hours a year paying
taxes, some filing over 100 returns per year.

6 October, 2017
demonetization program. On the evening of the
U.S. election in the fall of 2016, Prime Minister Modi
announced that all of the 500 rupee and 1000 rupee
notes would stop being legal tender as of midnight
that day. At the time of the announcement, India had
roughly $240 billion of local currency in circulation, of
which about $205 billion was in 500 rupee and 1000
rupee notes, the combination of which equated to
86% of all currency in circulation by value!
Given that the vast majority of transactions in India
occur in cash, it would be a great understatement to
describe this reform as “disruptive.” The cash crunch
severely curtailed transactions in the economy, stunting
economic growth. As a result, the IMF trimmed its
estimate of India’s GDP growth by one percentage
point for 2016 and 0.4 percentage point for 2017.
GST Reform
The Goods and Services Tax (“GST”) is the first large-
scale reform Modi was able to implement after more
than two years of failed attempts. The GST replaces
a wide range of central, state and local taxes with
a system that will unify and simplify tax payment
regimes for much of the economy leading to improved
tax compliance throughout the economy.
While implementation has only just begun, most
envision several clear benefits of the GST:
• The GST will level the playing field by eliminating
many of the subsidies that historically favored
certain industries and businesses.
• State and regional governments are now quite
limited in their ability to charge and collect taxes
so that goods should move more freely across
state borders, improving the competitiveness of
local goods compared to imports.
• The GST will broaden the tax base – the current
income tax regime only captures taxes from 5%
of the population – and increase governmental
receipts, improving the government’s ability to
invest in infrastructure.
• The simplification of tax compliance is expected
to improve participation in the formal economy by
reducing the enormous tax-compliance burdens
and costs currently embedded in most areas of
the economy.
Gavekal estimates that the enactment of the GST
alone will boost India’s economic growth by 1% to
2% per year.
Demonetization
In an effort to curb the use of “black money” and bring
the cash-based informal economy into the organized
economy, the Modi government implemented a surprise
Demonitization
2011 2012 2013 2014 2015 2016 2017
22.5%
20%
17.5%
15%
12.5%
10%
7.5%
5%
Source: Gavekal Data/Macrobond
Chart 6. Bank Deposits in India Spurred by Demonetization
Growth in Domestic Bank Deposits in India
While it is still early, we see signs that demonetization
is having a positive impact on the economy. Digital
transactions in the last few months have accelerated
as a result of massive customer adoption of debit cards,
credit cards and digital wallets for daily transactions.
This impact is reflected in the dramatic growth in bank
deposits since demonetization, as shown in Chart 6.
Despite India’s many challenges, smartphone
penetration is over 80%, providing a powerful tool
for the government to encourage migration to digital
India: Into the Daylight
© 2017 Gresham Partners, LLC. All Rights Reserved. 7
A second and equally important reform was the
formation of a single national agricultural market
(eNAM) to facilitate the sale and purchase of produce
by connecting these fragmented markets through an
online trading portal. Analysts estimate that eNAM
will become the largest digital agriculture exchange
market in the world, which could deliver a 20%-30%
reduction in intermediation costs to be shared by
consumers and farmers.
Importantly, with the agriculture sector comprising
nearly 50% of India’s labor force, these reforms will be
popular with large portions of the population, providing
additional political capital and election victories for
the BJP and Modi.
Modi’s Agenda Requires Sustained Political Success
Skeptics point out that we have been here before and
India’s history has been filled with false promises.
Without a commitment to continued reforms, India
risks sliding back into its old ways. Therefore, it is
critically important that the population appears to
have taken even the most drastic reforms and related
disruptions somewhat in stride in hopes of better
long-term job and growth prospects.
Early signs are positive, as the BJP has secured
several important political victories in state elections
in the disruptive aftermath of these reforms. Equally
important is the opportunity the BJP appears to have
to gain a majority of seats in the upper house of
Parliament. India’s rolling state elections smooth
(or slow, if you are a skeptic) the process of political
change. In the five state elections just after enactment
of the demonetization reform, which disproportionately
affects the poor, lower caste voters, the BJP won by a
landslide, including 80% of the seats in Uttar Pradesh,
a state with over 200 million people, marking the
BJP’s first victory in that state in 15 years.
platforms and transactions. The government recently
launched a new platform called the Unified Payments
Interface (UPI), which allows customers to transfer
money across bank accounts at any time of the
day using the UPI smartphone app. According to
Bloomberg, Paytm – the country’s largest digital-pay-
ments provider – noted a 1,000% surge in money
added to customers’ digital wallets the day after
demonetization was announced.
Expected Long-Term Benefits of GST and Demone-
tization
While short-term disruptions resulting from both
GST and demonetization have been significant, the
longer-term effects are expected to be quite positive.
Beyond simple headline growth estimates mentioned
earlier, these reforms should also accelerate the shift
towards the organized segment of the economy by
reducing tax complexity and increasing adoption of
electronic payments and tracking.
As businesses transition “into the light,” we expect to
see the tax base widen and improve India’s tax-to-GDP
ratio, which at 16.6% is less than half of the OECD
average of 34%. With more tax revenue in the hands of
the government, we should see either higher spending
by the government or reductions in tax rates, both of
which can result in a revival of a long-overdue capital
expenditure cycle.
Agriculture Reforms
The government launched a new crop insurance
program in early 2016 to help stabilize farmers’ income,
especially in disaster years. A farmer can now protect
his crop from any kind of non-preventable risks by
paying a low premium (1.5% – 5%). More than 31
million farmers enrolled in just the first few months
of the program.

8 October, 2017
Public Market Performance and Valuation
Recently, Indian equity market performance has
been quite strong, as westerners have been eager to
participate in its potential. Over the last five years,
India has returned just over 9% per year, keeping
pace with China (+9%) and far outpacing broader
emerging market equities (+4%).
One of the negative consequences of this outper-
formance with little corresponding earnings growth
is that the Indian equity markets are trading at a
premium valuation compared to other emerging
market countries, as shown in Chart 7. For investors,
If the momentum continues with Modi winning
reelection in 2019 and the BJP gaining control of the
upper house, Modi will be in a strong position to push
through even more substantive reforms and make
additional progress in unleashing the potential of the
Indian economy.
Investment Challenges
Accelerating economic growth and discretionary
spending by hundreds of millions of Indian consumers
has the potential to drive significant investment returns.
As it was with China over the last few decades, the
tailwinds created by an upward inflection of discre-
tionary consumer spending can be very powerful
drivers of investment returns. Despite a similarly-sized
population, India’s current online retail sales of $16
billion is just 2% of the value of similar sales in China,
according to Forrester Research. This data makes it
clear that India has a long way to go.
Modi’s continuing economic reforms are a necessary,
but not sufficient, condition to create sustained capital
market returns for investors. India has some unique
structural challenges that make investing more difficult
than some investors might assume given its free
market reputation.
1996 1998 2000 2002 2004 2006 2008 2010 2012 2014 2016
40
35
30
25
20
15
10
5
ChinaIndia
Emerging Markets
Source: IBES/Thomson Reuters
Chart 7. Indian Equities are Trading at a Premium
12-Month Forward Equity P/E Ratio
-12.5
-5.2
-44.3
-34.1-37.4
-32.4
-23.9
-14.9
-6.0
-13.9
-18.3
-11.3 -10.2-9.1
-14.2-10.7
-7.1-8.6
-56.7
-67.8
-11.7-12.2
-9.5-8.0
-25.7
-37.2
-20.3
-15.2
-24.0
-11.4
-6.0
-11.6
-23.2
-16.7
-6.6
-13.8
-4.6
-8.8
1999 2001 2003 2005 2007 2009 2011 2013 2015 Through6/30/2017
0%-5%
-10%
-15%
-20%
-25%
-30%
-35%
-40%
-45%
-50%
-55%
-60%
-65%
-70%
MSCI India
MSCI EM
Source: Morgan Stanley
Chart 8. Significant Drops in Indian Stock Prices Occur in Most Years
Maximum Price Decline

India: Into the Daylight
© 2017 Gresham Partners, LLC. All Rights Reserved. 9
Market Liquidity
At first glance, the Indian market appears deep.
Even the Bombay Stock Exchange (“BSE”), which is
generally regarded as the nation’s second exchange
behind India’s National Stock Exchange (“NSE”), has
over 5,500 listed stocks, more than any other national
exchange in the world, as shown in Chart 9.
However, many of these stocks are small and illiquid.
Over 4,000 Indian companies are less than $1 billion
in market capitalization. Further, the number of liquid
stocks is quite small compared to many of India’s
emerging market peers. India has just over 150 stocks
with an average daily trading volume exceeding $5
million per day versus nearly 3,000 listed companies
with this trading volume in China. Even Korea, a
much smaller country and stock market, has nearly
300 such stocks.
Several factors contribute to this lack of liquidity,
including the limited free float (i.e., the amount of
stock listed and freely traded) of listed equities. India’s
free float is among the worst in the world, relative to
the size at its market, as shown in Chart 10.
elevated valuations create significant risk by reducing
the margin of safety if earnings growth doesn’t live
up to expectations
Volatility
The good news for long-term investors is that the
Indian equity market provides numerous attractive
entry opportunities given its high volatility and frequent
drawdowns. Generally, emerging market equities are
more volatile than developed markets and the Indian
market is particularly so. Chart 8 shows the largest
decline that occurred within every calendar year for
the last twenty years for both the Indian market and
broader emerging market equities.
• In 16 of the last 20 years, Indian equity market
experienced a decline of over 10% during the
calendar year.
• In three of the four remaining “good” years,
investors experienced an 8% or larger decline.
• In 17 of the last 20 years, Indian equity market
experienced a larger decline than broad emerging
market equities.
These declines can provide long-term investors very
attractive entry points to deploy capital.
1,000
2,000
3,000
4,000
5,000
6,000
7,000
Bom
bay
Sto
ckEx
chan
ge
TMX G
roup
- C
anad
a
Kor
ea E
xcha
nge
Nas
daq
- U
.S.
NYS
E G
roup
Lond
on S
tock
Exch
ange
Hon
g Kon
gEx
chan
ge
Aus
tral
ian
Sec
uriti
esEx
chan
ge
Japa
n Ex
chan
geG
roup
BM
E Spa
nish
Exch
ange
s
Source: Bloomberg
Chart 9. Indian Stock Exchanges have More Listed Companies thanany Other Exchanges
India
$500 $1,000 $1,500 $2,000 $2,500 $3,000 $3,500 $4,000 $4,500
$2,800
$2,600
$2,400
$2,200
$2,000
$1,800
$1,600
$1,400
$1,200
$1,000
$800
$600
$400
$200
Each symbol shows a country's stock market.
Market Capitalization of All Listed Stocks (billion)
Free
Flo
at M
arke
t Cap
(U
S $
bill
ion)
Source: MSCI, RIMES, Morgan Stanley Research
Chart 10. The Amount of Stock Freely Traded in India is Very Limited
Publicly Listed Companies

10 October, 2017
shares and selling in the cash market. Unfortunately,
futures are currently available on fewer than 250
companies and sufficient liquidity is typically available
in only about 100 of them, which is a significant
deterrent to long/short strategies.
Manager Selection in India
Given the traditional benchmark-oriented investment
approach of most western investment managers, the
vast majority of foreign capital invests in the Indian
market through ETFs or other benchmark-centric
investment strategies. Most India indices have
sizable allocations to large-cap IT services, energy
and pharmaceuticals. While these companies are
important to the Indian business community, they
are heavily influenced by the global economic cycle
and their outlook is largely determined by external
factors rather than Indian dynamics.
Investors looking for true exposure to domestic
consumption and other impacts of local economic accel-
eration are better served in the small- and mid-cap
segments of the market. These smaller companies
are rarely followed by major research firms, creating
significant inefficiencies. It is estimated that over
70% of companies with market caps of $100 million
or less have no institutional research coverage. In
addition to the information challenge, the restricted
liquidity of these smaller companies keeps most global
managers with large asset bases away from them.
To access these opportunities, local managers with local
information networks and significant history working
on these companies are required. While there are
relatively few such firms that meet western institutional
investment standards, the handful that exist enjoy
the benefits of investing in a highly inefficient market.
As one might expect, India has a history of family
business ownership. However, unlike other countries
where family equity or so-called “promoter” holdings
are broadly available for the public to trade, promoter
ownership in India is typically 50% or higher.
Relatedly, the Indian government has historically
imposed a 49% limit on foreign ownership of some
companies’ stock. With these limitations, stock price
movements are often driven more by who is trading
or owns a stock than by underlying company funda-
mentals. Additionally, limited free float creates some
reluctance by investors to sell existing holdings for
fear of difficulty in reacquiring the stock, which can
cause valuations to become stretched. While this is
a structural problem, it also creates opportunities for
astute local investors who understand these dynamics.
However, it is important to recognize that some
progress is being made in lessening these restrictions.
For example, the average promoter owned 49.1% of
BSE 500 companies at the end of June, which was
down 10 percentage points from 59.1% ten years ago.
Shorting Limitations
Given the large investment universe, sparse research
coverage and higher volatility, India would seem to
be an ideal market for long/short hedge fund strat-
egies. Unfortunately, an insider trading scandal by a
former president of the BSE caused the Securities and
Exchange Board of India (SEBI) to ban short selling
during the 2000-2002 bear market, eliminating all
true hedge fund participation.
More recently, SEBI began permitting institutional
funds to engage in short selling and it is slowly allowing
other investors to do so also. However, the reforms
altered the way short selling is accomplished in India.
Creating short exposure is now primarily executed
through single-stock futures rather than borrowing

India: Into the Daylight
© 2017 Gresham Partners, LLC. All Rights Reserved. 11
middle-class consumer. They also illustrate the high
prices that investors must periodically face to own
these fantastic franchises.
Conclusion
India currently constitutes a small portion of most
investment portfolios and Gresham has historically
been reluctant to commit significant capital to the
country given the business challenges described earlier.
Further, there is always a healthy competition for
capital amongst competing investment ideas around
the world. To date, we have found more compelling
investment opportunities in other emerging economies,
most notably China. Although the promise of India’s
emergence has both tantalized and disappointed
investors for decades, the political will and economic
reforms needed to catalyze the emergence of India
as a global economic power are beginning to appear
under the Modi administration.
To identify and access these managers, consultants
and allocators face several challenges. First, the
investment firms with great local knowledge and access
are located in various cities across India. While travel
to India is a surmountable challenge, other factors
create additional disincentives.
Many of these investment firms do not report their
results to traditional databases that form the basis
of commonly accepted manager search practices.
This makes simply identifying these managers a
challenge. Further, given the limited liquidity of
the underlying stocks, most of these managers are
capacity constrained and many of them are closed
to new investments. Even if these managers could
take additional capital, the amount would be relatively
small and not commercially viable for the massive
asset bases of large consultants, private banks and
trust companies.
Presently, Gresham has invested modest amounts
of capital with several marketable managers within
India. These strategies range from a traditional equity
portfolio to a more eclectic small-cap manager, and
even to a long-short manager. Early returns produced
by these investments have been positively accretive
for our clients, but it is still too early to evaluate the
success of this initiative. However, if Indian reforms
continue under the Modi administration, we expect
investment opportunities will become more prevalent
and compelling, causing us to increase our clients’
exposure to levels that could be significant.
To illustrate the potential attractiveness of some
Indian small- and mid-cap companies, we highlight
in the Appendix two such companies, one from each
of Gresham’s two dedicated Indian managers. These
examples are not intended to be an endorsement of
these specific stocks or Gresham’s Indian managers,
but rather an illustration of the enormous growth
potential found within the tailwinds of India’s emerging
12 October, 2017
HDFC’s strong asset quality is helping it gain market
share against its private and public peers
• The bank’s quality underwriting standards have
protected its balance sheet, while many private
sector banks are seeing an uptick in non-per-
forming loans, as shown in Chart 12.
• HDFC has been using its expanded national branch
network to gain market share from the struggling
and undercapitalized public sector banks in the
small-to-medium and mid-corporate segments.
• Because of its strong position in the growing retail
loan market and its ability to selectively take
market share in the non-retail segment, HDFC
has the ability to grow substantially ahead of
the banking system, even if the system is in a
cyclically slow growth phase.
Appendix
HDFC Bank
Since going public in 1995, HDFC has grown to become
India’s largest private sector bank by assets and market
capitalization. The bank has established over 4,700
branches and 12,000 ATM terminals across more than
2,600 cities and towns in the country. In total, the
bank serves over 40 million customers.
Secular trends are boosting HDFC’s profitability
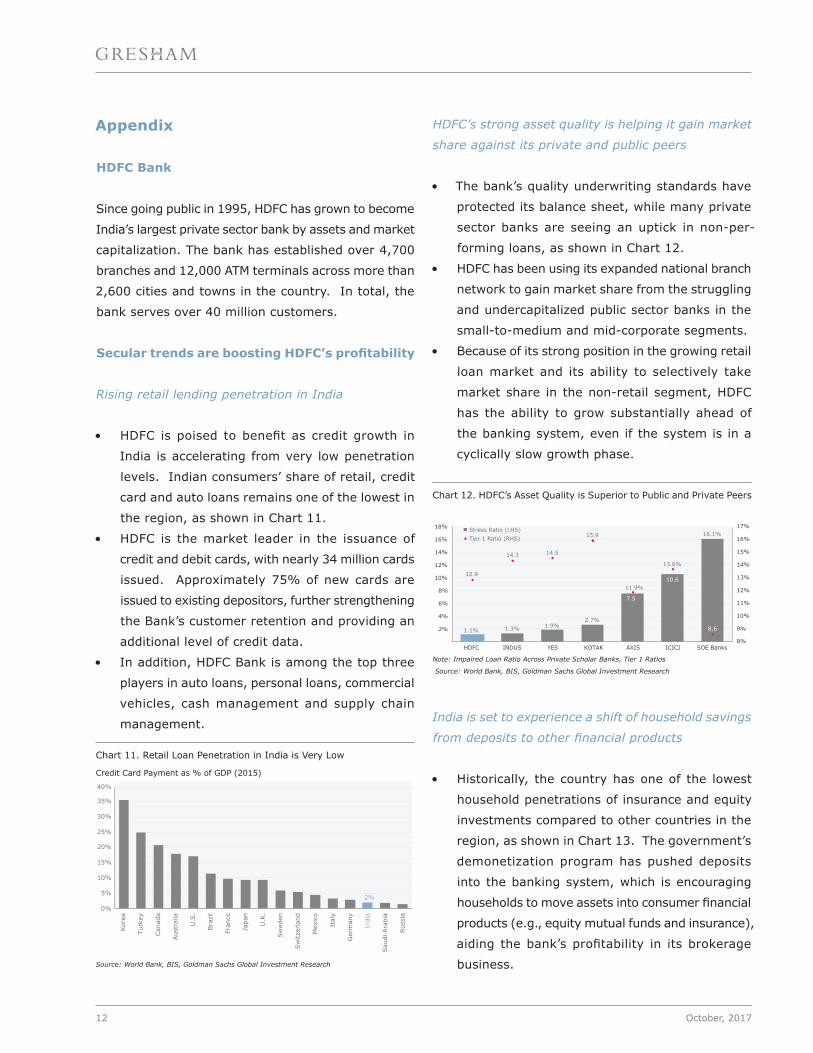
Rising retail lending penetration in India
• HDFC is poised to benefit as credit growth in
India is accelerating from very low penetration
levels. Indian consumers’ share of retail, credit
card and auto loans remains one of the lowest in
the region, as shown in Chart 11.
• HDFC is the market leader in the issuance of
credit and debit cards, with nearly 34 million cards
issued. Approximately 75% of new cards are
issued to existing depositors, further strengthening
the Bank’s customer retention and providing an
additional level of credit data.
• In addition, HDFC Bank is among the top three
players in auto loans, personal loans, commercial
vehicles, cash management and supply chain
management.
2%
0%
10%
5%
15%
20%
25%
30%
35%
40%
Kor
ea
Aus
tral
ia
U.K
.
U.S
.
Fran
ce
Bra
zil
Sw
eden
Sw
itzer
land
Mex
ico
Ital
y
Ger
man
y
Indi
a
Sau
di A
rabi
a
Rus
sia
Japa
n
Turk
ey
Can
ada
Source: World Bank, BIS, Goldman Sachs Global Investment Research
Chart 11. Retail Loan Penetration in India is Very Low
Credit Card Payment as % of GDP (2015)
1.1% 1.3% 1.9%2.7%
11.9%
13.6%
16.1%
•
• •
••
•
•
•
12.9
14.3 14.5
15.9
7.5
10.6
8.6
4%
2%
6%
8%
10%
12%
14%
16%
18%
10%
9%
8%
11%
12%
13%
14%
15%
16%
17%
HDFC INDUS YES KOTAK AXIS ICICI SOE Banks
•Stress Ratio (LHS)Tier 1 Ratio (RHS)
Note: Impaired Loan Ratio Across Private Scholar Banks, Tier 1 Ratios
Source: World Bank, BIS, Goldman Sachs Global Investment Research
Chart 12. HDFC’s Asset Quality is Superior to Public and Private Peers
India is set to experience a shift of household savings
from deposits to other financial products
• Historically, the country has one of the lowest
household penetrations of insurance and equity
investments compared to other countries in the
region, as shown in Chart 13. The government’s
demonetization program has pushed deposits
into the banking system, which is encouraging
households to move assets into consumer financial
products (e.g., equity mutual funds and insurance),
aiding the bank’s profitability in its brokerage
business.

India: Into the Daylight
© 2017 Gresham Partners, LLC. All Rights Reserved. 13
Financial Performance
• Despite the disruptions presented by demoneti-
zation and GST, HDFC has continued to show very
strong earnings growth of 20%, led by loan growth
of 23% and fee income growth of 30%, while
containing operating cost increases to roughly
12%. Additionally, the bank reported 17% growth
in commercial business lending, a space that
showed almost no growth at a system-wide level.
• Since 2008, HDFC has grown earnings per share
by fivefold and generated total shareholder returns
of nearly eightfold, as shown in Charts 14 and 15.
10 Year Compound Growth Rate Financial Metrics and Valuation Estimates for FY 2018Deposits 18.6% Return on Assets 2.0%
Profit After Tax 26.1% Return on Equity 18.5%
Earnings Per Share 21.9%
Dividend Per Share 22.3% Price-to-Book 3.5x
Price-to-Earnings (Fwd) 19.6
# Branches 21.8% EPS Growth (consensus) 20.5%
# ATMs 21.8%
Cities/Towns With Coverage 24.7%Source: HDFC Bank, Bloomberg
Chart 15. HDFC has Produced Strong Growth and Current Financial Metrics
Source: Goldman Sachs, CEIC
Chart 13. Household Allocations to Equities are Very Low in India
5,000
10,000
15,000
20,000
25,000
30,000
Jul-
95
Jul-
97
Jul-
99
Jul-
01
Jul-
03
Jul-
05
Jul-
07
Jul-
09
Jul-
11
Jul-
13
Jul-
15
Jul-
17
HDFCSensex Index
Source: Bloomberg
Chart 14. HDFC’s Stock has Substantially Outperformed
Cumulative Return in INR
10%
20%
30%
40%
U.S. Taiwan Australia SouthKorea
Singapore Japan China India

14 October, 2017
• Despite increasing its feed capacity by 150%
over the past four years, Avanti has faced
stock-out situations at peak harvesting season
in each of the last three years. Had it not been
for capacity constraints, Avanti could have
grown faster and gained further market share.
Strong brand, distribution and farmer relationships
• Avanti is the leading aquaculture feed company
in India and has a strong brand known for the
best feed conversion ratio, supported by a strong
distribution reach and highly trained technical
personnel of over 150 employees to assist shrimp
farmers. This has resulted in very high retention
rates of existing customers and a disproportion-
ately high share of incremental growth.
• Avanti’s technical expertise has allowed farmers
to reduce feed expense to 45% of total cost from
55% eight years ago, further strengthening their
competitive positioning and allowing the company to
increase its market share to 50% from 25% in 2008.
Avanti Feeds
Avanti Feeds produces and distributes prawn and
fish feeds to customers in the U.S., Europe, Japan,
Australia and Middle East. The company operates five
shrimp and fish feed manufacturing units with annual
capacity of 400,000 metric tons. The company also
operates a shrimp processing plant in Yerravaram.
The company was founded in 1993 and is based in
Hyderabad, India.
Emerging Leader in a Growth Industry
Scalable and fast growing market
• Since the introduction of Vannamei shrimp in 2009,
the shrimp export industry in India has grown at
an impressive annual rate of 38%. The Indian
shrimp industry has annual production of over
434,000 metric tons and exports totaling over
$3.5 billion globally, as shown in Charts 16 and 17.
The worldwide shrimp market is approximately 3.2
million metric tons, providing significant headroom
for Indian production to grow. Due to its vast
untapped coastline, huge stretches of brackish
water and one of the lowest costs of production,
India is ideally suited for aquaculture.
Source: Avanti Feeds
Chart 16. India Exports over $3.5 Billion of Shrimp Annually
Source: Avanti Feeds
Chart 17. India Exports Shrimp Globally
Allocation of Exports (2016)
50
150
100
200
250
300
350
400
450
500
000’
ton
s Millions
$500
$1.500
$1.000
$2.000
$2.500
$3.000
$3.500
$4.000
2000
2003
2008
2004
2006
2005
2009
2010
2011
2012
2013
2014
2015
2016
2007
2001
2002
Volume (LHS)Value (RHS)
U.S.36%
Vietnam23%
European Union19%
Japan7%
United Arab Emirates4%
Canada2%
China1%
Russia1% South Africa
1%
Kuwait1%
Others5%

India: Into the Daylight
© 2017 Gresham Partners, LLC. All Rights Reserved. 15
Experienced and technically strong team
• Avanti has been in the aquaculture business in
India for the past two decades and has shown
superior execution capabilities compared to its
competition. Avanti is further strengthened by
a technical and marketing relationship with the
Thai Union Group of Thailand, one of the largest
sea food processors in the world, with a market
cap of $3.7 billion.
Expansion into Food Processing
• Avanti derives 15% of its revenues from its shrimp
processing business. It purchases shrimp from
farmers, processes the harvest and distributes
the cooked products to export markets. Avanti
has created a dedicated new subsidiary for this
processing business in which Avanti holds a
60% stake and Thai Union holds a 40% stake.
Processing capacity has recently been increased
from 7,500 metric tons to 22,500 metric tons.
Avanti is expecting over 30% annual growth in
its processing business revenues over the next
three years.
Financial Performance
• The shrimp feeds industry is heavily concen-
trated and capital efficient. Avanti generated
a return-on-capital-employed of 61.7% on a
consolidated basis in FY 2017. The company has
grown its revenues at an annual rate of 46% and
EBITDA at an annual rate of 66% over the past
seven years, as shown in Chart 18.
Source: Bloomberg
Chart 19. Recent Innovation has Boosted Avanti Stock
Cumulative Return in INR
50,000
100,000
150,000
200,000
250,000
300,000
350,000
1999 2001 2003 2005 2007 2009 2011 2013 2015 2017
AvantiSensex Index
Source: Avanti Feeds
Chart 18. Avanti Financial Performance
INR (billion)
2.13.9
6.5
11.3
17.8
20.2
27.3
0.1 0.4 0.5 1.1 1.8 2.3 3.35
15
10
20
25
30
2011 2012 2013 2014 2015 2016 2017
RevenueEBITDA

© 2017 Gresham Partners, LLC. All Rights Reserved.
Gresham Partners is an independent investment and wealth management firm that serves its clients as a multifamily office and an outsourced chief investment officer. Gresham has been serving select family offices, foundations and endowments since the firm was established in 1997. Today, we manage or advise on over $5 billion for about 90 clients located nationally.
Past performance is no guarantee of future results. Investments in emerging markets are speculative and involve the risk of loss. No representation or warranty expressed or implied is made as to the accuracy or completeness of the information contained herein. Nothing in this paper shall be relied upon as a promise or representation of future performance.
Gresham Partners, LLC | 333 West Wacker Drive, Suite 700 | Chicago, IL 60606312.327.5020 | [email protected]
About Gresham