Embed Size (px)
Citation preview

February 2010
Report
The Water and Sanitation Program (www.wsp.org)is a multi-donor partnership administered by theWorld Bank to support poor people in obtainingaffordable, safe, and sustainable access to waterand sanitation services
Benchmarking forPerformanceImprovement
in UrbanUtilities
A Review in Bangladesh,India, and Pakistan

DISCLAIMER:
Water and Sanitation Program (WSP) reports are published to communicate the results of WSP’s work to the development community.Some sources cited may be informal documents that are not readily available.
The findings, interpretations, and conclusions expressed herein are entirely those of the author and should not be attributed to theWorld Bank or its affiliated organizations, or to members of the Board of Executive Directors of the World Bank or the governments theyrepresent. The World Bank does not guarantee the accuracy of the data included in this work. The boundaries, colors, denominations,and other information shown on any map in this work do not imply any judgment on the part of the World Bank Group concerning thelegal status of any territory or the endorsement or acceptance of such boundaries.
The material in this publication is copyrighted. Requests for permission to reproduce portions of it should be sent [email protected]. WSP encourages the dissemination of its work and will normally grant permission promptly.For more information, please visit www.wsp.org.
Benchmarking forPerformanceImprovement
in UrbanUtilities
A Review in Bangladesh,India, and Pakistan

Abbreviations 4
Executive Summary 5
Introduction 7
Benchmarking in the Global Perspective 9
Introducing Benchmarking in South Asia 11
Phase 1: Initiation
Phase 2: Institutionalization and Consolidation
Phase 3: Strengthening Performance Assessment and Improvement
Benchmarking Findings 19
The Reliability of Benchmarking Data
The State of Service Provision in the Region
Findings against Specific Indicators
Assessment
Contents

A Review in Bangladesh,India, and Pakistan:Benchmarking forPerformance Improvementin Urban Utilities
Performance Improvement Planning 31
Using Process Benchmarking to Drive Improvements
Strengthening Benchmarking to Drive Sector Reforms 37
Institutionalizing Benchmarking in Government
Moving beyond Utility Benchmarking Data
Key Lessons from Regional Benchmarking Experience 41
Next Steps 43
Conclusions 45
References 46
Appendix 47
South Asian Utilities Participating in Performance Benchmarking, 2005–07

Abbreviations
CIB Continuous Improvement and Benchmarking
DFID Department for International Development (UK)
GTZ Deutsche Gesellschaft für Technische Zusammenarbeit (German Agency for Technical Cooperation)
HUD&PHED Housing, Urban Development, and Public Health Engineering Department (Punjab)
IBNET International Benchmarking Network for Water and Sanitation Utilities
JICA Japanese International Cooperation Agency
JNNURM Jawaharlal Nehru National Urban Renewal Mission
JUSCO Jamshedpur Utilities and Services Company
Lpcd Liters per capita per day
MDGs Millennium Development Goals
MLGRD&C Ministry of Local Government, Rural Development, and Cooperatives (Bangladesh)
MoUD Ministry of Urban Development (India)
NRW Nonrevenue water
PIP Performance improvement planning
PROOF Public Record of Operations and Finance
RMC Rajkot Municipal Corporation
SAWUN South Asian Water Utility Network
SOP Standard Operating Procedures
SEAWUN South East Asian Water Utility Network
ULB Urban local body (India)
WASA Water and Sanitation Agency (Punjab, Pakistan)
WASA Water and Sewerage Authority (Bangladesh)
WSP Water and Sanitation Program
WSP-SA Water and Sanitation Program–South Asia
WSS Water supply and sanitation
4

A Review in Bangladesh,India, and Pakistan:Benchmarking forPerformance Improvementin Urban Utilities
Performance benchmarking is apowerful tool to make service providersmore accountable, and to measureprogress while improving performance.This review examines the introduction ofperformance benchmarking in over 30urban water utilities across Bangladesh,India, and Pakistan since 2003, with thesupport of their respective governmentsand the Water and Sanitation Program–South Asia. It focuses on the process ofbuilding systems for performancemeasurement, monitoring and analysis,and institutionalizing benchmarking asan integral part of operational practicein utilities and government, to supportbroader sector reforms.
The findings reveal that most utilities areperforming poorly, and just how dire thestate of service provision really is acrossthe towns and cities of South Asia:
Executive Summary
• No water utility in Bangladesh, Indiaor Pakistan provides its customerswith continuous water; the averageis five hours a day.
• Water utilities do not serve at least athird of urban residents.
• High nonrevenue water—frequentlyestimated above 40 percent—means a large volume of water isbeing lost through leaks, instead ofbeing available to improve andextend supply; billions are lost eachyear through unbilled consumptionand revenue mismanagement.Citizens are carrying these costs,and receiving very poor servicesin return.
• Operating expenditure far exceedsincome in many utilities, and tariffsbear no relation to costs. Mostutilities rely on subsidies and ad hocgrants from government.
With some exceptions, the quality ofthe performance data reported by theutilities does not yet support robustanalysis beyond indications of broadtrends. Consequently, comparativeassessment of the utilities’ performanceindicators is not the main focus ofthis review.
The data reveal the wide scope thatexists to implement internal systemimprovements. It is spurring the
5
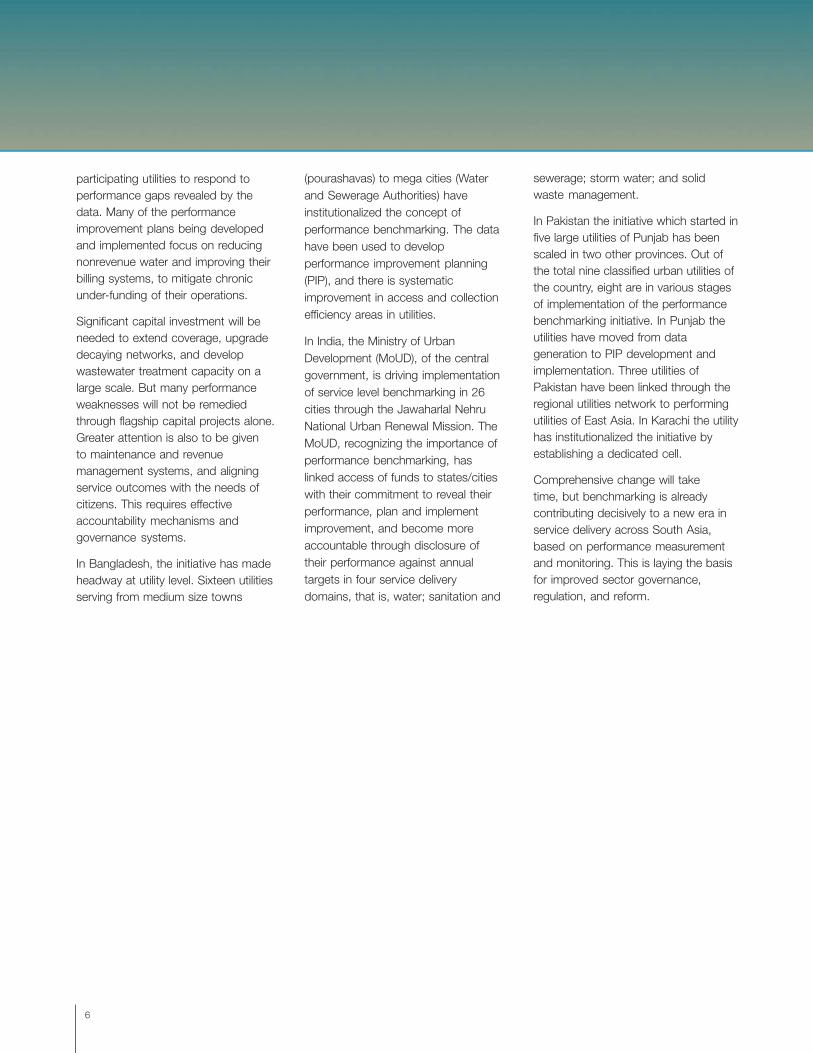
participating utilities to respond toperformance gaps revealed by thedata. Many of the performanceimprovement plans being developedand implemented focus on reducingnonrevenue water and improving theirbilling systems, to mitigate chronicunder-funding of their operations.
Significant capital investment will beneeded to extend coverage, upgradedecaying networks, and developwastewater treatment capacity on alarge scale. But many performanceweaknesses will not be remediedthrough flagship capital projects alone.Greater attention is also to be givento maintenance and revenuemanagement systems, and aligningservice outcomes with the needs ofcitizens. This requires effectiveaccountability mechanisms andgovernance systems.
In Bangladesh, the initiative has madeheadway at utility level. Sixteen utilitiesserving from medium size towns
(pourashavas) to mega cities (Waterand Sewerage Authorities) haveinstitutionalized the concept ofperformance benchmarking. The datahave been used to developperformance improvement planning(PIP), and there is systematicimprovement in access and collectionefficiency areas in utilities.
In India, the Ministry of UrbanDevelopment (MoUD), of the centralgovernment, is driving implementationof service level benchmarking in 26cities through the Jawaharlal NehruNational Urban Renewal Mission. TheMoUD, recognizing the importance ofperformance benchmarking, haslinked access of funds to states/citieswith their commitment to reveal theirperformance, plan and implementimprovement, and become moreaccountable through disclosure oftheir performance against annualtargets in four service deliverydomains, that is, water; sanitation and
sewerage; storm water; and solidwaste management.
In Pakistan the initiative which started infive large utilities of Punjab has beenscaled in two other provinces. Out ofthe total nine classified urban utilities ofthe country, eight are in various stagesof implementation of the performancebenchmarking initiative. In Punjab theutilities have moved from datageneration to PIP development andimplementation. Three utilities ofPakistan have been linked through theregional utilities network to performingutilities of East Asia. In Karachi the utilityhas institutionalized the initiative byestablishing a dedicated cell.
Comprehensive change will taketime, but benchmarking is alreadycontributing decisively to a new era inservice delivery across South Asia,based on performance measurementand monitoring. This is laying the basisfor improved sector governance,regulation, and reform.
6

A Review in Bangladesh,India, and Pakistan:Benchmarking forPerformance Improvementin Urban Utilities
Water and sanitation utilities are theessential vehicles for delivering theservices needed to enable and sustaineconomic growth, and, in turn, meetthe Millennium Development Goals andsupport South Asia’s fast-growingtowns. But there is widespreadevidence of poor performance.
Until recently, the evidence was largelyanecdotal. New data from regionalperformance benchmarking initiativesare now providing quantitative informa-tion on the state of water services,across a range of parameters. It revealsthe performance of a cross section ofutilities, and is enabling comparison withothers of similar size and structure.
No water utility in the region provides itscustomers with continuous water. Thesupply is intermittent and generally ofpoor quality, contributing to illnesses.High nonrevenue water—frequentlyabove 40 percent—means a largevolume of water is going to waste,instead of being available to improve andextend supply; billions of Rupees andTaka,1 vital for improving and sustainingthe quality of service delivery, are losteach year through unbilled consumptionand poor revenue management. Citizensare carrying these costs, and receivingpoor services in return.
The analysis of this data is shapingperformance improvement planning and
Introduction
decision making, and contributingpowerfully to sector reform initiativeswhich emphasize institutionalrealignment, transparency, andaccountability. Such reform initiativeswould become more effective andreliable if the data become increasingly
sophisticated. For example, in India,the grading of data adds an importantdimension to make benchmarkingincreasingly reliable. Benchmarking ishighlighting where improvement isneeded—not just in big infrastructuredevelopment programs, but in lower
7
1 US$1 = Bangladeshi Taka 69; US$1 = Indian Rs. 46; andUS$1 = Pakistani Rs. 85 (approximately, as of February 2010).Conversion rates are from www.coinmill.com; all conversions inthe text are approximations.

Box 1: Utility benchmarking: A tool for performance improvement and decision making
Benchmarking involves assessment of performance, and comparison with others to identify key areasfor improvement.
There are two main types of benchmarking; they complement each other. Both are being used by South Asianwater utilities.
Metric Benchmarking: Establishing Different Levels of Performance
A range of methods is used to quantify the performance of a utility, and compare its performance to others. Theapproaches described in this review rely on simple analysis of the ratio of inputs to outputs—cost per cubic meter,number of staff per 1,000 water connections, and so on.
As the quality and reliability of the qualitative data improves, more sophisticated techniques can be used, such asregression analysis. This type of analysis takes account of external variables that are outside the control of management,and allows for better comparison across different operating environments. For example, the cost per cubic meter isdetermined by a range of variables—including the nature of the water source, the total volume supplied, the cost ofelectricity, and so on; regression analysis enables these factors to be taken into account when assessing performanceacross very different operating environments (Kingdom, 1996).
Metric benchmarking provides information for utilities to identify performance gaps, but does not usually reveal thereasons for them. The key is to understand the reasons behind the performance gaps.
Process Benchmarking: Assessing How to Improve Performance
Having established a need for performance improvement in a particular function, process benchmarking highlights howto change the way things are done. Processes associated with the targeted function are analyzed closely, step by step,and compared against those in ‘best in class’ organizations. Rigorous assessment of internal processes, enhancedthrough comparative assessment, can achieve significant improvements through more effective, streamlined, andefficient approaches.
To date, most benchmarking activity in the South Asian water sector has focused on quantifying performance. A growingnumber of utilities are adopting process benchmarking approaches to fine-tune performance improvements.
profile interventions which drivedecisive service improvements.This includes household surveys toupgrade utilities’ customer databasesand improve their knowledge of whothey are serving, and how effectively;systems to track response times andloss reduction; comprehensivemetering to pinpoint losses andstrengthen sustainability; and so on.
Benchmarking is also revealingopportunities for quick wins. Bettermanagement of billing and collection,for example, generates more incometo do a better job of service delivery.This review examines the introductionof performance benchmarking in over30 water utilities across Bangladesh,India, and Pakistan since 2003, withthe support of their respective
governments and the Water andSanitation Program–South Asia. Itfocuses on the process of buildingsystems for performancemeasurement, monitoring andanalysis, and institutionalizingbenchmarking as an integral part ofoperational practice in utilities andgovernment, to support broadersector reforms.
8

A Review in Bangladesh,India, and Pakistan:Benchmarking forPerformance Improvementin Urban Utilities
How does the performance of differentutilities compare? Why do some dobetter than others, and what is it thatthey are doing differently? Globally,organizations are using benchmarkingto seek answers to these questionsand drive improvements.
‘Benchmarking’ can be used indifferent ways for different purposes:
� For competitive advantage:Benchmarking emerged in theprivate sector in the early 1980swhen the U.S. company, Xerox,sought to strengthen its competitiveadvantage by assessing itsperformance in relation to its rivals,learning from the best achievers,and adapting best practices toenhance its own performance(Cabrera, 2008). The approach isnow used widely by many of theworld’s most successful companiesand organizations.
� To promote efficiency in acontext of monopoly supply bywater utilities: In the UnitedKingdom, the national economicregulator for water utilities, OFWAT,uses mandatory benchmarking—or‘yardstick competition’—by waterutilities to generate information onappropriate water pricing andperformance norms (Dassler, Park,and Saal, 2006). Colombia’sregulator uses a similar approach.
In the Philippines, benchmarking isbeing used to compare theperformance of the two waterconcessionaires serving differentparts of the city of Manila.
� To support sector assessmentand programming: China, Vietnam,and a growing number of otherAsian countries have used one-offbenchmarking assessments of utilityperformance to determineperformance across thewater services sector and refinenational level planning andpolicy development.
� To identify and share bestpractice: Regional networks suchas the South East Asian Water UtilityNetwork (SEAWUN), the South AsianWater Utility Network (SAWUN), andthe Water Operators Partnershipsprogram for Africa (WOP–Africa)promote benchmarking to drivecomparative assessment andcontinuous improvement in serviceprovision and utility performance.These networks promote thecollection, analysis, and comparisonof key performance data betweenwater utilities in a country, a region,and worldwide, and then supportknowledge sharing, twinningpartnerships, and trainingworkshops to promote adoptionof good practice.
� To drive service improvementsthrough linking funding supportto performance monitoring andimprovement planning:Funders—within government andbeyond—increasingly wantevidence that capital investmentsare yielding better serviceperformance outcomes.Benchmarking can show howeffectively public funds are beingutilized, and where new investmentsshould be prioritized. There is agrowing move in India and Pakistanfor government to link capitalfunding to performanceimprovement plans which addressdeficiencies revealed throughbenchmarking. In India theJawaharlal Nehru National UrbanRenewal Mission (JNNURM), aRs. 16,500 crore program ofnational governments, is in the offingunder which the fiscal transfers tothe utilities linked to performance. InPakistan the provincial governmentof Punjab is exploring the option tolink the flow of funds, over andabove the regular transfers under afinance commission formula, toperformance. Utilities in Africa,particularly in Ethiopia and SouthAfrica, are eligible to receive thefunds from higher tiers ofgovernment on the production ofcredible data showing improvementin service delivery.
Benchmarking in theGlobal Perspective
9

Benchmarking of water supply utilitiesis now common practice worldwide,across developed and developingeconomies from Europe to LatinAmerica and Africa.
Involving Staff to Makethe Most of Benchmarking
The value of benchmarking as apractical management and decision-making tool is being recognized beyondgovernment and utility managers.In the Philippines, for example,
representatives of the Alliance ofGovernment Workers in the WaterSector, working with the PublicServices International Research Unit(PSIRU) and other agencies, believethat management-labor cooperationcan be mobilized to support the sharedgoal of safe, affordable, reliable, andsufficient water for all. In October 2008,a six-month capacity-building programon performance benchmarking anddatabase management was launched,targeting worker representatives frompublic water utilities across the
Philippines. The objective is tostrengthen decision making forimproved water services by drawingon the knowledge and informationof operational-level employees(Corral, 2008).
A valuable source of information onglobal utility performance benchmarksfrom over 2,000 utilities in 85 countriescan be found at the website of theInternational Benchmarking Networkfor Water and Sanitation Utilities(IBNET), at www.ib-net.org.
10

A Review in Bangladesh,India, and Pakistan:Benchmarking forPerformance Improvementin Urban Utilities
Introducing Benchmarkingin South Asia
The introduction of benchmarking inSouth Asia under a well designedregional program was pioneered inIndia, beginning in 2003. Bangladeshand Pakistan followed soon after, from2005, and were able to draw on thelessons of India’s experience. From thestart, these benchmarking initiativeshave looked beyond comparativeassessment, to using benchmarking tofocus performance improvementplanning (PIP) and monitor its impacts.
In each country, the Water andSanitation Program–South Asia(WSP-SA) has played a pivotal role ininitiating and supporting benchmarking,using tools developed by theInternational Benchmarking Network forWater and Sanitation Utilities (IBNET). Acommon approach has been pursued,which is adapted to align with country-specific needs and dynamics. It hasthree main phases:
� Phase 1: Initiation;
� Phase 2: Institutionalization andConsolidation; and
� Phase 3: StrengtheningPerformance Assessmentand Improvement.
The next section describes the processof introducing benchmarking in thedifferent contexts of Bangladesh, India,and Pakistan, before moving onto anassessment of key findings.
Phase 1:Initiation
Bangladesh
In Bangladesh, the local governmentdivision of the Ministry of LocalGovernment, Rural Development, andCooperatives (MLGRD&C) introducedbenchmarking in 11 cities and towns in2005, with the support of the WSP-SA.
This followed the development of a2005 Water Sector Development Plan,which aimed to guide comprehensivereforms, with an emphasis onpromoting greater autonomy andprofessionalism for water utilities. Thisheralded a major shift from the statusquo, where institutions are fragmentedand investment decisions occur at adifferent level from operations andmaintenance. The national Departmentof Public Health Engineering isresponsible for planning and developing
infrastructure in most areas, and citycorporations and local municipalitiescharged with operating and maintainingthe infrastructure and providingservices. Semi-autonomous Water andSewerage Authorities (WASAs) provideservices in the two largest cities, Dhakaand Chittagong. Overall planning isfragmented, utilities are inappropriatelystaffed, and revenue falls far short ofwhat good service provision requires.
The sector faces enormous challenges,in part arising from rapid urbanizationand increasingly dense settlements.The population of Dhaka, for example,is expected to surge from 12 millionnow to over 21 million by 2025.
Nationally, there is limited monitoring,resulting in widespread bacteriologicalcontamination of groundwater atshallow depth, the country’s primarywater source. Compounding this isarsenic contamination in a quarter ofthe country’s tubewells and increasingsalinity in the coastal belts. The watertable is falling steadily because of highabstraction rates. Very low river flows,seasonal shortages, and frequentpower cuts add to water supplyproblems. The potential for using
11
Phase 1: Activities

surface water is constrained bydeclining flows in the rivers from India,and the cost of treatment toovercome severe contamination.Climate change will impactparticularly harshly on Bangladesh’speople, accelerating urbanization andworsening water deficiencies.
Highly capable and professionalwater utilities are needed toovercome these challenges andprovide effective and sustainablewater and sanitation services.Government regards performancebenchmarking as a valuable tool forimproving water utility managementand business planning, throughrevealing what kinds ofinputs and improvement strategiesare needed to strengthenutility performance.
The first phase, beginning in 2005,focused on introducing the conceptto 11 utilities; the participantsincluded the Dhaka and ChittagongWASAs, a city corporation and eightsmaller urban local authorities knownlocally as pourashavas. As in India,the WSP-SA worked closely with thelocal government division of theMLGRD&C to introduce key IBNETperformance indicators and datacollection methodologies to utilitymanagers, and gain the support ofcity and town mayors andpourashava chairs. The focus thenshifted to providing hands-on supportto work teams within each utility, toassist them in collecting andassessing the data.
The findings from this first phaseprovided the most comprehensiveassessment to date of the state ofurban water services in Bangladesh.
IndiaThe way Phase 1 was structured andimplemented in India illustrates theapproach used across the region.The catalyst for benchmarking inIndia was the Ministry of UrbanDevelopment’s (MoUD) need forbaseline data on the state of the urbanwater sector, in order to assess howbest to direct reform initiatives. Withthe support of the WSP-SA, theMinistry initiated a project in 2003 tocollect and analyze performance datafrom 13 water supply and sanitationutilities. Project partners included stategovernments and the Indian WaterWorks Association (IWWA).
The term ‘water supply and sanitation(WSS) utilities’ covers a wide range ofservice providers, ranging from state-level departments, authorities andagencies, to city-level water supply andsewerage boards, technical servicedepartments within municipalcorporations, and companies ownedby the private sector. Representatives
of a wide range of public sector entitieswere approached to provide insightsinto the different organizationalcapacities and their implications forcollecting data. Between them, the 13utilities covered 23 cities and townsacross India, ranging in size from lessthan 50,000 connections to morethan 250,000.
From the start, the WSP-SA adopted aparticipatory, networked approach tobenchmarking. The emphasis was onfirst helping the utilities and local andstate governments to appreciate theconcept and its benefits—both internally,within each utility as a management tool,and externally, to support comparativeassessment. The focus then shifted todeveloping the methodology, usingindicators and definitions developed bythe IB-NET. The WSP-SA helped to setup, train, and support work teams withineach utility, who were then tasked withcollecting, checking, and assessing thedata. Key findings were analyzed indetail across the different utilities toreveal performance trends, and the
Figure 1: Average availability of water in India, comparedto international norms
Source: WSP (1996).
12

A Review in Bangladesh,India, and Pakistan:Benchmarking forPerformance Improvementin Urban Utilities
sample average was compared withinternational benchmarks.
Despite limitations in the reliability of thedata, the results were sobering.Comparison with benchmarking resultswith norms elsewhere showed clearlythat the performance of theparticipating Indian utilities comparedpoorly with that in other developingcountries. Perhaps the most strikingfinding was that no utility is able toprovide a continuous supply of safedrinking water; two provide water forless than two hours a day. Morecomprehensive findings are describedin later sections of the report.
PakistanIn Pakistan’s Punjab province, waterservices in the five largest cities—Lahore, Faisalabad, Gujranwala,Multan, and Rawalpindi—are providedby five publicly-owned Water andSanitation Agencies (WASAs). WASAsare accountable to both local- andprovincial-level authorities, but there islittle oversight of their performance.
In late 2005, the WSP-SA launchedperformance benchmarking in thesefive WASAs at the request of theHousing, Urban Development andPublic Health Engineering Department
(HUD&PHED). A World Bank study ineight Punjab cities had identified the lackof proper water and sanitation services asa major impediment holding back theireconomic potential. The HUD&PHEDwanted to use benchmarking to improvethe performance of the WASAs, andthereby achieve the service improvementsneeded to support economic growthand development.
In 2006 the Government of Punjab’snew Urban Unit drew up a roadmap forreforming urban water and sanitationservices in the province. It outlined aprogram of institutional reforms,culminating in the formation of moreautonomous, professionalized waterutilities, operating within a regulatoryframework that emphasized greateraccountability. One of the provincialgovernment’s first steps in implementingthe roadmap was to appoint new high-caliber managing directors for WASAs,recruited on merit from the private sector,to drive the process of sector reform atthe utility level. The provincial governmentsigned a performance contract witheach director.
The starting point for benchmarking wasfor the WSP in late 2006 to bring on boardthe top management of the key provincialgovernment departments responsible fordriving infrastructure development andservice delivery, including the HUD&PHED,the WASAs’ parent department. TheHUD&PHED nominated a senior official asthe provincial focal person, and eachWASA established a benchmarking teamwith a team leader. Following a similarapproach to that used in India andBangladesh, the first phase focused onbuilding awareness of the concept,localizing the IBNET indicators. The datawas collected by WASAs’ teams andanalyzed by the WSP-SA, to show trendsover the previous three to five years. It was
Box 2: Gaining a ‘whole organization perspective’through benchmarking
Data gathering is not new to most utilities. But the benchmarking indicatorsintegrate this information across different functional areas, and revealperformance in a whole new way—daily per capita consumption, unitproduction cost, staffing per connection, working ratio, and so on. Theprocess of data collection also reveals significant gaps in the managementinformation systems of most utilities.
Dhaka WASA in Bangladesh has always collected data, but throughassembling indicators for benchmarking, it gained a ‘whole organizationperspective’ for the very first time. The WASA formed a high-poweredBenchmarking Committee comprising top management and the sectionheads of Finance, Revenue, Operations, and Development. For the first time,section heads said they could see the links between leaks and revenue. Thisintegrated perspective is drawing attention to performance gaps, andshifting organizational perspectives beyond management of supply, to acustomer orientation which looks at service outcomes.
Other utilities in South Asia echo this. Senior managers in Faisalabad WASA,in Pakistan, say the process of assembling data for benchmarking is helpingthe different directorates within the WASA understand how performance inone area impacts on another. The WASA has always collected data onservice coverage, but analyzing consumption against the number ofconnections was new. A comprehensive revamp of the customer database,assessed against connections on the ground, revealed just how prevalentunauthorized connections were; 31,000 illegal connections have since beenregularized. The revised, more accurate data now show that consumptionper capita was lower than previously believed.
13

Phase 2: Activities
a steep learning curve for the utilities,particularly when analysis of the databy the WSP-SA revealed substantialperformance gaps.
Phase 2:Institutionalizationand ConsolidationThe findings from Phase 1 revealed anumber of shortcomings in the qualityof the data reported. Phase 2 aimed tostrengthen performance reportingthrough embedding measurement,monitoring, and reporting systems ineach utility. Concurrently, the WSPworked with the relevant ministry ordepartment in each country tobuild a platform in government todrive, coordinate, and supportbenchmarking in utilities.
BangladeshPhase 2 in Bangladesh focused onstrengthening data collection, andusing the findings to addressperformance gaps identified throughbenchmarking. A second round ofbenchmarking data were collected for2006–07, and the findings weresubsequently collated into acomprehensive data book forwider dissemination.
The WSP-SA worked closely with eachutility to help them use their findings todevelop performance improvementplans. They target a wide range ofissues from increased metering of
production and consumption, torevenue management, tariff revision,and improved energy efficiency.Utilities’ experiences in developingand implementing performanceimprovement plans have been sharedand discussed in detail at a series ofnational workshops, where ministryrepresentatives have participated.
Bangladesh utilities are hoping thatthe findings from benchmarking willalert municipalities to the quantumof funding needed to improveservice delivery. They also hope tomotivate them to raise fundsthrough the Municipal DevelopmentFund for sector improvementsranging from rehabilitation of watertreatment works to renewal ofnetworks and investment in bulk andconsumption meters.
A change of government in December2008 affected plans to institutionalizebenchmarking in the ministryresponsible for local government.Benchmarking in Bangladeshcontinues to rely on impetusprovided by WSP support.
IndiaA second phase of benchmarking waslaunched in 2005, involving 16 utilitiesapproached by the MoUD. Again,IB-NET indicators and definitions wereused, but this time there was greateremphasis on understanding theinternal systems used to collect dataon the different indicators, and gradingthe reliability of the information
submitted. Following an approachdeveloped by the IB-NET, each dataitem and indicator was graded on afour-point scale, A to D, with A havingthe highest and D the lowest reliability.This grading approach was necessaryto assess whether the data supportedcredible comparison betweenutilities, and helped utilities to identifyproblems in the reliability of the datathey collected.
Within each utility, data were refinedover two collection cycles. The firstwas for initial data gathering, learning,and error checking; this was followedby further data collection andrefinements. From the original list of 16participating utilities, only 10 were ableto provide adequate data forperformance measurement andanalysis. Key findings are shown inTable 2 (see page 20).
The value of the data being generatedthrough benchmarking was now veryevident. After the release of thePhase 2 results, in late 2007 theMoUD took benchmarking to a newlevel in India when it decided thatservice level benchmarking shouldbe institutionalized across governmentas an integral part of improving servicedelivery and public accountability in thecontext of urban renewal. Water supplyis being devolved to urban local bodies(ULBs), who are overseen by state-level authorities. The strategy of theMoUD in central government is to workwith state-level authorities to promotethe adoption of benchmarking atULB level.
14

A Review in Bangladesh,India, and Pakistan:Benchmarking forPerformance Improvementin Urban Utilities
PakistanBenchmarking gathered momentumin Pakistan in 2007. Participants at amajor benchmarking workshop inLahore in June 2007 noted theimportance of institutionalizingbenchmarking, within WASAs and ingovernment, to make the collationand analysis of benchmarking dataan integral part of organizationalmanagement and sector practice,rather than a one-off event. Afterreviewing various options, it wasevident that the HUD&PHED, theprovincial government departmentresponsible for the urban watersupply sector in the Province ofPunjab, was the most appropriateinstitutional home for the Punjabbenchmarking program.
In late 2007 the Department made acommitment to establish a ProvincialBenchmarking Data Cell. TheHUD&PHED would drive coordinationand institutionalization, setting upsystems to collect, collate, andrespond to the data. The Urban Unit,established within the Department ofPlanning and Development to driveurban sector reforms, would providefurther coordination and technicalsupport. The WSP-SA would providetechnical support, including data
analysis, performance improvementplanning, and capacity building.
The Department sent a formalinstruction to each WASA through anofficial notification in late 2007 to collectand submit data on definedperformance areas every six months tothe provincial government, with astandardized datasheet and definitionsfor each indicator. A remainingchallenge is, however, to mobilize theresources needed to establish aProvincial Benchmarking Data Cell thatwould have the capacity to drive theprocess across utilities.
Within the five WASAs, meanwhile,considerable attention was given todetailed performance improvementplanning to address gaps identifiedthrough metric benchmarking.
Utilities focused on developing andimplementing PIPs, improving revenuemanagement through collectingarrears and regularizing unauthorizedconnections, reducing nonrevenuewater, upgrading water and sewernetworks, and so on. Asbenchmarking data became available,milestones have been improved andmonitoring strengthened.
Figure 2: Profile of utilities participating in Phase 2:South Asian benchmarking, by size
15

Phase 3: Activities
Phase 3:StrengtheningPerformanceAssessment andImprovement
Phase 3 activities have focused onstrengthening benchmarking practiceswithin utilities, and building the systemsneeded to entrench performancemeasurement, monitoring, andimprovement to achieve better servicedelivery outcomes.
Bangladesh
In Bangladesh, 11 urban water utilities(two WASAs, eight pourashavas, andone city corporation) have developedbaseline datasets, managed theirbenchmarking data, and prepared PIPsfor improved service delivery. Thisincluded a revision of the rules forservices to the low-incomecommunities in the World Bank-fundedWater Supply and Sanitation Project inDhaka. A recent analysis reveals thataccess to piped water supply in the 11utilities increased by 30 percent, andaverage revenue collection periodreduced by 35 percent, from 2004to 2008.
Eleven utilities have come together toform an urban utility network topromote knowledge sharing, with moreutilities expressing an interest in joining
the network. The network regularlyconvenes to address key issues suchas the impact of climate change, tariffsetting, billing and collection, waterlosses, and so on. The number ofnetwork members has increased to18, and it is anticipated that a further19 pourashavas from the World Bank-funded Bangladesh Water Supply andSanitation Program (BWSSP) will jointhe urban utility after the completion ofthe project. WSP has been supportingthe scaling up and institutionalizing ofthe utility network.
IndiaThe MoUD is now using benchmarkingto drive improvements in urban servicedelivery through a pilot program in 26Indian cities, and aims to expand thiscoverage comprehensively.
During 2008 a core team working withthe ministry defined aspirationalbenchmarks for service performanceacross four services: water supply,sewerage, solid waste management,and storm water drainage.
Sanitation and Sewerage
� 100 percent toilet coverage
� 100 percent coverage bysewerage networks
� 100 percent collection andtreatment of sewage
� 100 percent capacity availableto treat sewage
� 100 percent compliance withspecified secondary sewagetreatment standards
� 20 percent of treated effluent reused
� 100 percent recovery of costs forsewerage management
� 80 percent of customer complaintsaddressed within 24 hours
� 90 percent efficiency in collection ofsewerage charge
Water
� 100 percent households havedirect water connections
� Minimum supply of 135 lpcd
� 24x7 water supply
� 100 percent consumption metering
� 20 percent nonrevenue water
� 80 percent of customer complaintsaddressed within 24 hours
� 100 percent compliance withstandards specified forpotable water
� 100 percent cost recovery, wheretotal operating revenue isexpressed as a percentage of totaloperating expenses incurred in thecorresponding time period
� 90 percent collection efficiency
Box 3: Required performance levels for water andsanitation defined by the Ministry of Urban Development
16

A Review in Bangladesh,India, and Pakistan:Benchmarking forPerformance Improvementin Urban Utilities
The MoUD identified key performanceindicators, defined the requirements forsupporting data and—extending thelearning from Phase 2—specified criteriato grade the reliability of performancedata. Following wide consultations, theresulting national framework wasformalized in a Handbook on ServiceLevel Benchmarking, and issued to allstate governments in September 2008. Itprovides a uniform framework of 28performance indicators across the fourservices, enabling a systematic approachto performance monitoring and inter-citycomparisons. In February 2009, theMoUD launched a pilot Service LevelBenchmarking program, with WSPsupport, to build awareness of the newframework, demonstrate its value, andlearn by doing. The response of cities andstate governments has been positive; thenumber of participating cities has grownswiftly from the initial 10 to 26, drawnfrom 14 states and one union territory.The cities range in size from those with apopulation of 100,000 to those with over12 million people.
The pilot program is leveraging fundingfor swift roll-out through existing donor-funded governance-strengtheningprograms at state level, and the ministryhas indicated its willingness to providefunding support for implementation ofplans to improve utilities’ performanceand data reliability. Apart from the WSP,other development agencies partnering inthe initiative are Japanese InternationalCooperation Agency (JICA), Departmentfor International Development (DFID),Deutsche Gesellschaft für TechnischeZusammenarbeit (GTZ), GatesFoundation, and Public Record ofOperations and Finance (PROOF). Thepilot initiative has lent momentum toexisting initiatives in other states, forinstance, Karnataka, Gujarat,Maharashtra, and Madhya Pradesh,where efforts are under way for
initiating performance assessmentsat a wider level.
Going forward, the MoUD is committed tousing its already existing major nationalurban renewal program for the largest 63cities, the Jawaharlal Nehru NationalUrban Renewal Mission (JNNURM), asthe vehicle for embedding benchmarkingat state and city levels. Sixteen of theparticipating pilot cities are covered underthe JNNURM. The MoUD is keen toassess the improvements in serviceprovision as a result of the vastinvestments being made. The aim is toshift the focus of sector practitioners fromasset creation to service outcomes. Citieswanting to access the JNNURM’s fundingthrough the MoUD will need to commit tocollecting data against defined serviceperformance indicators, and commit toachieving improvements in their servicedelivery performance. A similar approachis being implemented for other urbanfunding programs of the MoUD.
PakistanIn Pakistan, four rounds of benchmarkingdata have been collected to date, andthe findings are being used to trackperformance improvements and informdebate on priorities for sector reform.More systematic engagement by theprovincial government with the findings isneeded to sustain momentum andprovide the support and institutionalreforms the WASAs need to operatemore effectively—in particular, a clearerseparation between authority andoperator roles. Performanceimprovement planning has been boostedwith the introduction of CIB, orContinuous Improvement andBenchmarking, in two WASAs. Withsupport from the South Asian UtilityNetwork and Asian Development Bank,benchmarking representatives fromRawalpindi and Faisalabad WASAs
underwent a detailed training andmentoring program on processbenchmarking. The approach entails aclose analysis of the causes of problemsor inefficiencies in a given area, and arigorous assessment of ways tostreamline and enhance operatingprocedures. Rawalpindi has focused onleak detection and repair, as a means toachieving its broader goals of better waterquality and lower nonrevenue water.Faisalabad has pursued revenueimprovement through strengthening itsbilling and collection systems.
An important component of thebenchmarking initiative has been theemphasis on information sharing andnetworking. In practice, the comparativeassessment dimension of benchmarkinghas proved to be less about competitionthan about learning from the experienceof others. Under a planned phasedapproach, the learning from Punjab wasused to scale up this initiative in theutilities of two more provinces (Sindh andthe NWFP) and in the federal capital(Islamabad). As a first step, the officialsfrom the utilities of Sindh, the NWFP,and Islamabad were invited in sectorworkshops to learn and interact withPunjab WASAs. By end 2008, the initiativewas formally launched in the KarachiWater and Sewerage Board (KWSB) andin 2009 in the Peshawar DevelopmentAuthority (in the NWFP). In 2009 theKWSB institutionalized the initiative byestablishing a dedicated cell in the utilitywith dedicated staff and funds. The cellhas been tasked not only with collectingand analyzing supply side data(benchmarking) but also carrying out itsvalidation through demand side tools(CRC and consumer perception survey).Growing interaction with SAWUN/ADB,the South Asia Water Utility Networkfunded by Asian Development Bank, ispromoting wider knowledge sharing andlearning from good practices elsewhere.
17

Category
Benchmarkinginitiated
Driver in government
Number of currentparticipants
Key achievements
Bangladesh
2005
Ministry of Local Government, RuralDevelopment, and Cooperatives
11 utilities across Bangladesh
� Two rounds of benchmarkingdata collected, for 2005–06and 2006–07
� Benchmarking performanceindicators are informing thedevelopment of the first yearperformance agreement betweenDhaka WASA and government
� Formation of an Urban UtilityNetwork to promoteknowledge sharing
� At least three further utilities arekeen to participate inbenchmarking from 2009
India
2003
Ministry of Urban Development(MoUD)
26 cities in 14 states and oneUnion Territory
� Two rounds of benchmarkingdata collected, for 2003–04 and2005–06
� MoUD aims to embedbenchmarking into the waytowns and cities monitor andreport on their performancenationally, using nationally-sponsored urban renewalinitiatives to pilot implementation.Growing engagement bystate governments
� National Benchmarking Cellestablished in the MoUD tocoordinate and support state-and city-level benchmarking
� Strong emphasis on improvingdata quality
Pakistan
2005
Housing, Urban Development, andPublic Health EngineeringDepartment (HUD&PHED),Government of Punjab, and theUrban Development Unit
Five WASAs in Punjab; one each inKarachi, Peshawar, and Islamabad
� Four rounds of benchmarkingdata collected to date:for 2003–06, 2003–08,June to December 2007, andJanuary to June 2008
� In principle, agreement ofGovernment of Punjab toestablish a benchmarking cellin HUD&PHED
� Learning from Punjab scaled upin three utilities—serving Karachi,Islamabad, and Peshawar—in2008 and 2009
� Punjab data hosted onIB-NET website
� Performance benchmarking/CRCcell established in Karachi
� PIPs developed and implementedwith WSP-SA and SAWUN/ADBassistance
Across all three countries:� Limited metering, which compromises the reliability of key indicators� Poor data reliability� Benchmarking largely externally driven rather than internally motivated� An organizational culture which is often slow to accept performance measurement, accountability to
customers and to government, and improved service outcomes� Development of capacity within government to drive benchmarking, and use the findings to shape and
drive sector reforms� No strong incentives for water supply and sanitation service providers to improve performance
Table 1: Summary of benchmarking developments (across Bangladesh, India, and Pakistan)
� Limited engagement bygovernment withbenchmarking data
� Limited funding to implementimprovements
� Little progress towards institutionalizingbenchmarking in government
Key benchmarkingchallenges
Across all three countries:� Development of a range of performance improvement plans
18
A Review in Bangladesh,India, and Pakistan:Benchmarking forPerformance Improvementin Urban Utilities
The data generated through theseregional benchmarking initiativesprovides valuable information oncertain areas: the state of serviceprovision in the region; and on thequality of data that may supportcomparison of performance.
The Reliabilityof BenchmarkingDataThe findings on the utilities’performance cannot be assessedwithout an awareness of thelimitations of the reported data.The next section highlights somelimitations in the data, beforereviewing the performance findings.
Rigorous assessment ofbenchmarking data indicates anumber of problems which currentlycompromise their value for comparingperformance between utilities orover time.
First, data collection and managementsystems are poorly developed in mostutilities, and often data collected bydifferent sections within a utility cannotbe reconciled. This reflects the lowpriority that is given to performancemeasurement and monitoring withinmany utilities and the challenges thatare faced by governments’ attemptsto improve monitoring.
Second, many utilities simply do nothave the data requested; much of the
Benchmarking Findings
data submitted was based onestimates without measurableverification. This is evident from datafrom Phase 2 benchmarking in India,
where utilities graded the reliability oftheir data on each indicator on a scalefrom D (estimate) to A (based onrobust auditable data).
19

This grading system provides a usefultool as it indicates the greater or lesserreliability of the reported data. Even so,the validity of some of the gradesassigned remains open to debate. Forexample, it may well be premature toassign an ‘A’ grade for reliability onindicators such as water productionand consumption per capita per day,given incomplete customer databases
Explanation of color coding: Graded from A to D, where A has the highest reliability
Source: WSP (2008).
Utilities inparticipating cities
Watercoverage(%)
Production(lpcd)
Daily supply(hours perday)
Metering(% of totalconnections)
Operating ratio(operatingexpenses/revenue)
Nonrevenuewater(%)
Staff per1,000connections
Table 2: Reliability grading of data from Phase 2 benchmarking (in India, 2005–06)
CB DA
India, Bengaluru 91 143 2.5 90 1.1 48.63 5.42
Bhubaneswar 45 269 3 1 3.3 59.78 11.7
Chandigarh 100 290 12 71 1.3 24.85 10.6
Chennai 98 107 3 4 1.4 15.81 12.6
Dehradun 80 149 4 8 1.4 26.76 6.3
Hyderabad 95 192 1 93 1.1 49.55 9.9
Indore 54 102 0.75 0 5.4 49.99 8.8
Jamshedpur 79 608 6 1 0.9 9.36 6.9
Pune 88 274 7 16 0.80 40 16.6
Rajkot 98 126 0.33 0.40 6.6 12 1.62
and limited production and
consumption measurement.
Information provided by utilities in
Pakistan and Bangladesh reveals
similar problems with the reliability of
reported data, with the added
challenge that the reported data does
not differentiate between estimates and
auditable records. Introducing similar
grading of data may be an importantnext step in Bangladesh and Pakistan.
Third, because measurement remainslargely inadequate or even absent,comparative benchmarking is notnecessarily accurate. For example, theInternational Benchmarking Network forWater and Sanitation Utilities (IBNET)indicators used for benchmarking in
20
2005–06

A Review in Bangladesh,India, and Pakistan:Benchmarking forPerformance Improvementin Urban Utilities
South Asia assume that each utilitymeasures water production andconsumption comprehensively.The data are then used to derivethe indicators for production andconsumption per capita, nonrevenuewater (NRW), unit cost of waterproduced and sold, and so on.
However, measurement of productionand consumption is inadequate acrossthe region. Widespread reliance ontubewells across the regioncompounds the challenge ofmeasuring flows at source. LahoreWater and Sanitation Agency (WASA),for example, reported in August 2008that it had 373 tubewells with no bulkflow meters at all, and just 44 of themeters installed in the remaining172 tubewells were functional(HUD&PHED/WSP/SAWUN, 2008).Given this reality, Punjab WASAsestimate production on the basis ofthe rated capacity of aging pumps,multiplied by the hours of pumping;actual flows and pumping rates areseldom measured.
Benchmarking indicators for metercoverage show that consumption in
Figure 3: Metered domestic connections (in percent)
21
the vast majority of connections
across the region is not metered.
The average across the Indian
benchmarking participants was
30 percent, and far lower in
Bangladesh and Pakistan; just
3 percent of connections in Punjab
WASAs have functioning meters and
are being read. Compare this with
almost universal consumption
metering—an average of 99.4
percent—across 40 South East Asian
utilities surveyed in 2005
(SEAWUN/ADB, 2007).

Phase 2 Benchmarking Findingson the Extent of ConsumptionMetering in South Asian Utilities
Meter coverage is improving. However,even where bulk and consumptionmeters have been installed, manymalfunction and give incorrect readingsbecause an intermittent water supplyaffects the performance of meters. Fewutilities test the performance of theirmeters regularly. Because of faultymeters, at least one Punjab WASAderives data on the total volume ofmetered consumption from an estimateof nonmetered consumption.
Most utilities use estimating techniquesand their best judgment to quantify thevolumes of water supplied andconsumed. Without comprehensivemeasurement of flows and metering ofconsumption, however, utilities cannotreliably calculate consumption perconnection and per capita, the actualvolumes of water they sell on a flat rate,unit costs, or how much water is lostthrough leaks and bursts, or the extentof nonrevenue water. Withoutcomprehensive and up-to-datecustomer databases, utilities can onlyestimate how many people they serve,
what their aggregated demand is, andhow effectively they are billing andcollecting payments from them.
Estimates, over-estimates, and faultydata compromise the overall data-set,with implications for internalperformance assessment andcomparison with other utilities. Weakdata skew the average and the medianacross several utilities, and distortperformance reporting.
Despite these limitations, the datareveal some performance gaps andhighlights areas where improvementsare needed urgently. Within utilities, theneed to provide credible data forbenchmarking is spurring efforts tostrengthen performance measurementand data management systems. Itseems practical for utilities to try andwork towards improvement even withinthe limitations of the available data,to help target and track serviceimprovements. To become moreeffective in the longer term requires thatreliability remains a priority and thatcurrent data are not just simplyaccepted as the basis for planningwithout systematically improving dataitself. Introducing volumetric measuresis essential.
The State ofService Provisionin the RegionOverview
The benchmarking findings confirmthe dire state of service provisionand utility management acrossBangladesh, India, and Pakistan:
� No water utility in Bangladesh,India or Pakistan is able toprovide continuous water.
� A significant percentage ofcitizens do not receive servicesfrom their local water utility, andspend many resources to copewith this failure in service.Reported water service coverageranges from 30 percent to 100percent, with a simple averageacross 26 utilities in the region of66 percent.
� Relatively little water is beingmetered, which makes costing,cost recovery, and effectiveplanning impossible.
� Utilities are losing vast amounts ofrevenue from water losses in thenetwork and unbilledconsumption. The reportednonrevenue water figures are allbased on estimates; real lossesare likely to be substantially higherthan the average of about 30percent that was reported. Thisfigure would be even higher if thesystems were pressurized 24hours per day.
� Very little wastewater is treatedbefore it is discharged into theregion’s water courses. This is
22

A Review in Bangladesh,India, and Pakistan:Benchmarking forPerformance Improvementin Urban Utilities
causing severe watercontamination on a large scale, ina context of growing waterscarcity and rising demand.
� Tariffs lag far behind the real costof water supply, and expenditurefar exceeds revenue in mostutilities. The average collectionperiod for service payments isgenerally well over one year.
The service performance of utilitiesin these countries lags far behind theaverage performance across 40South East Asian water utilities, asassessed in 2005.
FindingsagainstSpecificIndicatorsSelected benchmarking findingsare reported below for Bangladesh(2005–06), India (2005–06), andPakistan (2007–08), and arecolor-coded by country. Data fromBangladesh were not available orsound across all indicators.Wherever possible, a comparativebenchmark is provided from asurvey of 40 South EastAsian utilities in 2005 (SEAWUN/ADB, 2007).
Coverage: Water
Self-assessed coverage levels rangefrom 15 percent to 100 percent, withaverage coverage markedly higher inIndia. No consistent approach wasused to assess coverage, however.Some estimated the populationserviced by the geographicalcoverage of their water andsewerage networks; others used the
length of the water supply pipelinenetwork as a percentage of the roadnetwork. More advanced efforts are
emerging such as to reflect the
number of properties provided with a
direct service connection, as a
percentage of the total number ofproperties, and make provision forbuildings with multiple dwellings.
Even where water coverage is relativelyhigh, access is compromised byintermittent supply.
Figure 4: Water coverage (in percent)
23
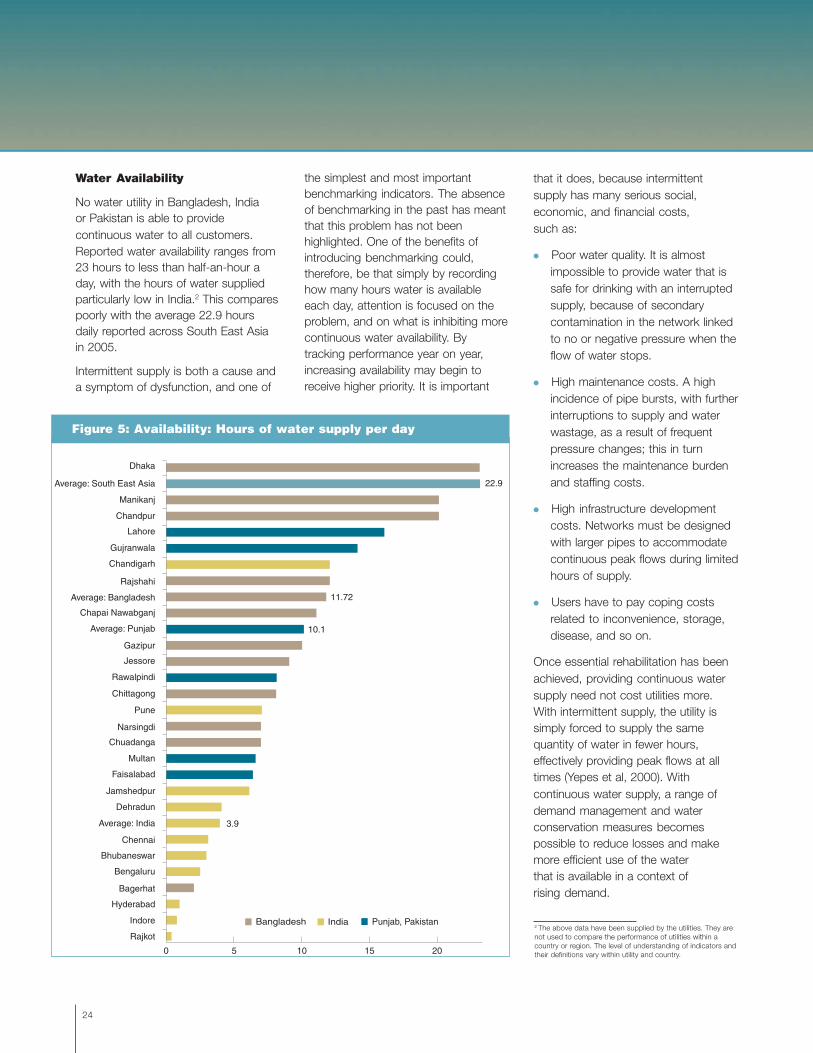
Figure 5: Availability: Hours of water supply per day
Water Availability
No water utility in Bangladesh, Indiaor Pakistan is able to providecontinuous water to all customers.Reported water availability ranges from23 hours to less than half-an-hour aday, with the hours of water suppliedparticularly low in India.2 This comparespoorly with the average 22.9 hoursdaily reported across South East Asiain 2005.
Intermittent supply is both a cause anda symptom of dysfunction, and one of
the simplest and most importantbenchmarking indicators. The absenceof benchmarking in the past has meantthat this problem has not beenhighlighted. One of the benefits ofintroducing benchmarking could,therefore, be that simply by recordinghow many hours water is availableeach day, attention is focused on theproblem, and on what is inhibiting morecontinuous water availability. Bytracking performance year on year,increasing availability may begin toreceive higher priority. It is important
that it does, because intermittentsupply has many serious social,economic, and financial costs,such as:
� Poor water quality. It is almostimpossible to provide water that issafe for drinking with an interruptedsupply, because of secondarycontamination in the network linkedto no or negative pressure when theflow of water stops.
� High maintenance costs. A highincidence of pipe bursts, with furtherinterruptions to supply and waterwastage, as a result of frequentpressure changes; this in turnincreases the maintenance burdenand staffing costs.
� High infrastructure developmentcosts. Networks must be designedwith larger pipes to accommodatecontinuous peak flows during limitedhours of supply.
� Users have to pay coping costsrelated to inconvenience, storage,disease, and so on.
Once essential rehabilitation has beenachieved, providing continuous watersupply need not cost utilities more.With intermittent supply, the utility issimply forced to supply the samequantity of water in fewer hours,effectively providing peak flows at alltimes (Yepes et al, 2000). Withcontinuous water supply, a range ofdemand management and waterconservation measures becomespossible to reduce losses and makemore efficient use of the waterthat is available in a context ofrising demand.
2 The above data have been supplied by the utilities. They arenot used to compare the performance of utilities within acountry or region. The level of understanding of indicators andtheir definitions vary within utility and country.
24

A Review in Bangladesh,India, and Pakistan:Benchmarking forPerformance Improvementin Urban Utilities
Figure 6: Nonrevenue water (in percent)
Nonrevenue Water
Without up-to-date customerdatabases to ensure that all users arebeing billed correctly, and withoutcomprehensive measurement ofproduction and consumption, dataon NRW are, at best, indicative.
Where there is no consumptionmetering, customers pay a fixed tariff,and there is no relationship betweenthe prices customers pay for water andthe volume they consume. Withoutcomprehensive metering, utilities’efforts to track NRW and minimize
losses are compromised. These NRW
losses are costing utilities literally
billions in foregone revenue; equally,
NRW represents the loss of
substantial volumes of water, in a
context of growing water scarcity.
Weak data on physical water lossesalso makes forward planning forsupply augmentation difficult, as it isdifficult to assess whether sufficientsupply gains can be achieved throughloss reduction, or whether newsource development is needed tomeet demand.
25
Note: The 2007–08 data from Punjab WASAs of Pakistan revealed an annual loss ofRs. 2.0 billion on account of nonrevenue water.

Coverage: Sewerage
Sewer coverage is harder toquantify than water supply, asconnections are less visible.
Using a simple average,Figure 7 shows that sewercoverage is higher in the fivePakistani cities than the 10Indian cities; Bangladeshi utilitiesdid not report on this indicator,and sewering is known to beseverely inadequate in thatcountry. In India, water coverageis higher than sewer coverage. InPakistan, there is higher sewercoverage than water coverage;this is because of widespreadreliance on private boreholes forwater in those cities.
Wastewater Treatment
The reported data reveal theextent to which the participatingutilities are discharging untreatedsewage back into water sources.
Sewer coverage is inadequate, evenby the reported data. This means thata significant amount of wastewater isnot collected. Of the wastewaterthat is collected, a significantproportion is not treated at all beforeit is discharged.
This situation is particularly severe inPakistan, where just 7 percent of thewastewater collected in Faisalabadreceives secondary treatment; noneof the other four WASAs treat theirwastewater at all before discharge.The result is severe contamination ofground and surface water sources(with particularly worrying implicationsfor those who draw their water directlyfrom tubewells and rivers), higher watertreatment costs, and wide-rangingnegative environmental impacts.
Figure 7: Sewerage coverage (in percent)
Figure 8: Secondary wastewater treatment (in percent)
26

A Review in Bangladesh,India, and Pakistan:Benchmarking forPerformance Improvementin Urban Utilities
Staffing
Official staffing levels in most utilitiesare high when compared withinternational averages, which arebelow five per 1,000 connections.Again, it should be emphasized thatthe methods of recording staffing level
Figure 9: Staff per 1,000 water connections
vary, and at least becoming moreconsistent with a benchmark practiceshould be an area of follow-up workas part of performance improvementplanning. Compounding thisinefficiency is the fact that too few ofthe staff employed have thecompetencies or customer service
orientation required for effectiveperformance. At least three constraintsare evident: civil service staffing policiesconstrain utility managers from hiringthe staff they require; they cannotincentivize them appropriately; andon-the-job training seems to be limitedby most accounts.
27

Operational Expenditure
A significant number of Indian andPakistani utilities are spending avery high proportion of their totaloperating expenditure on salariesand energy costs. This leaves verylittle for the essential maintenanceneeded to prevent a furtherdeterioration of service quality, letalone service improvements.
The high staffing levels raise thesalary bill. Energy costs formanother major cost element, and inseveral cities are driven upwardsdue to the high reliance ontubewells and associated pumpingcosts. There are indicators that
pumps are not suited to theparticular conditions and drive up thepumping costs. As a consequenceof this high expenditure, relativelylittle is being spent on preventativemaintenance and good assetmanagement. In a vicious cycle,decaying infrastructure raisesthe maintenance burden andoperating costs.
Operating Ratio
This indicator shows the ratio ofexpenditure to income. Ideally, itshould be around 0.68, to fund asurplus for good asset management,network expansion, and renewal.Even with inadequate spending onoperation and maintenance, it isevident that expenditure far exceedsincome in most utilities.
The combination of subeconomictariffs, inadequate customer accountdata, and poor collection efficiencymeans that utilities depend on
Figure 10: Salaries and electricity as a percent of totaloperational expenditure
28

A Review in Bangladesh,India, and Pakistan:Benchmarking forPerformance Improvementin Urban Utilities
Figure 11: Operating ratio
municipal or government subsidiesto close their funding gaps (andsome default on their electricity billsas well). Many subsidies aregenerally ad hoc so that it is moredifficult for utilities to do forwardbudgeting or medium-term planning.As a result, many utilities areengaged in reactive ‘fire-fighting’,
responding to the symptoms ofunder-funded operations and assetdecay. The reliance on subsidiesalso makes managers of the serviceproviders accountable andresponsive mainly to the municipalgovernments and politicians at avery operational level rather than totheir customers.
29
30
AssessmentThese findings show just howpoorly citizens are being served,across Bangladesh, India, andPakistan, and highlight theunsustainability of urban waterservices across the region in acontext of rapid urbanization.They underscore the urgencyof wide-ranging reforms in thewater sector.
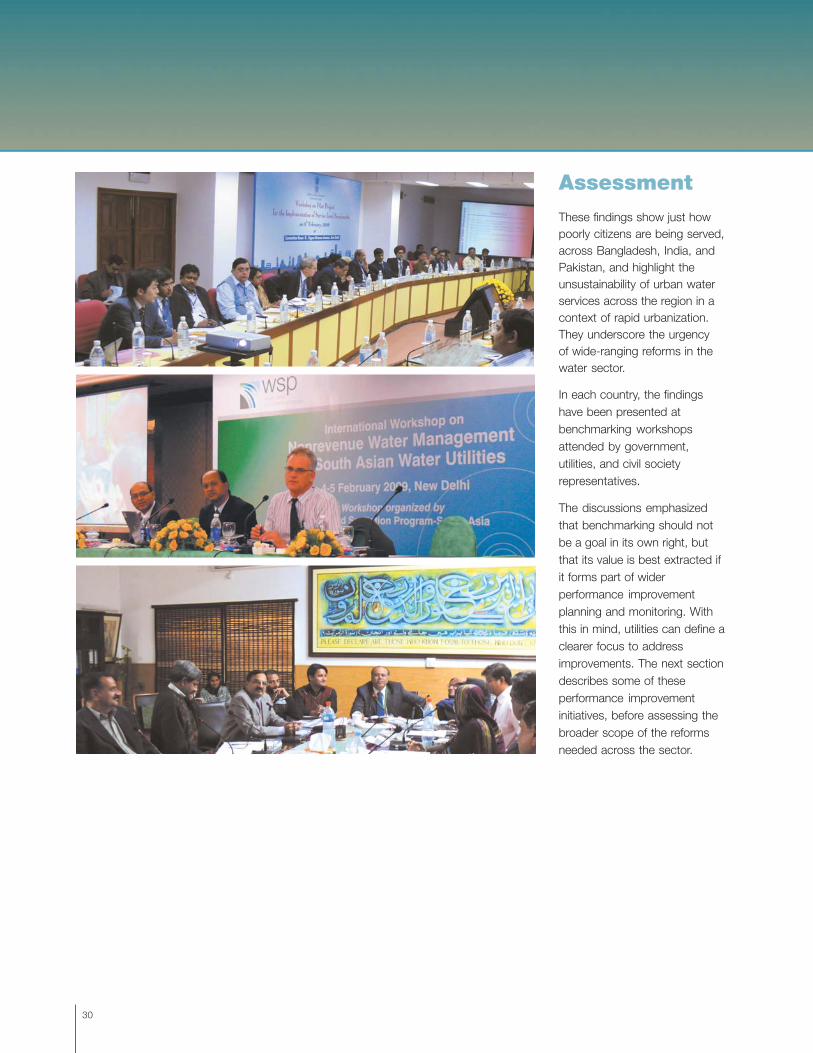
In each country, the findingshave been presented atbenchmarking workshopsattended by government,utilities, and civil societyrepresentatives.
The discussions emphasizedthat benchmarking should notbe a goal in its own right, butthat its value is best extracted ifit forms part of widerperformance improvementplanning and monitoring. Withthis in mind, utilities can define aclearer focus to addressimprovements. The next sectiondescribes some of theseperformance improvementinitiatives, before assessing thebroader scope of the reformsneeded across the sector.

A Review in Bangladesh,India, and Pakistan:Benchmarking forPerformance Improvementin Urban Utilities
In the light of the findings reportedthrough benchmarking, it is evidentthat metric benchmarking cannot beregarded as an end in itself. Theobjective is to improve performance,within each utility and across thesector. A strong feature of the Waterand Sanitation Program–South Asia(WSP-SA)-supported benchmarkinginitiatives across Bangladesh, India,and Pakistan is the emphasis onusing the findings frombenchmarking assessments to driveperformance improvement planning.With support from a range ofinitiatives from government, regionalnetworks, and funding partners,action plans are being developedand implemented to remedyidentified gaps and weaknesses.
The data suggest that manyperformance weaknesses will not beremedied only through capitalinvestment projects. Within utilities,the development of more effectiveinternal performance managementsystems is needed just as much asis infrastructure development.Upgraded customer databases,improved billing and collections, andmore metering will improve financialperformance, and fund someservice improvements—beforecitizens are asked to pay morefor services.
Box 4: Examples of areas which utilities are targeting forperformance improvement
• Increase water coverage.
• Build overhead reservoirs to increase continuity of water supply.
• Update and upgrade customer database.
• Conduct customer surveys.
• Establish a customer call center.
• Mitigate arsenic contamination through developing alternative sourcesof supply.
• Develop surface water sources to reduce reliance on declininggroundwater sources.
• Improve leak detection and repair.
• Relocate pipelines running alongside sewer lines or through drains.
• Rehabilitate decayed pipelines.
• Extend metering and replace dysfunctional meters.
• Implement comprehensive nonrevenue water reduction strategy.
• Optimize power consumption through auditing electricityconsumption and resizing pumps.
• Improve delivery of bills.
• Increase the number of pay-points.
• Reduce the collection period.
• Decrease staff per 1,000 connections.
• Revise organogram and fill critical posts.
• Improve communications with nongovernmental andcommunity-based organizations.
PerformanceImprovement Planning
31

Support initiatives are giving particularattention to reducing nonrevenue water(NRW), because it makes more waterand revenue available to support betterservice delivery. In May 2007, forexample, the WSP-SA hosted a‘Customized Clinic on Billing andCollection’ for revenue officials from sixwater utilities and municipal water
specific aspects of their billing andcollection systems that requiredattention. Two years later, examples ofsome of the improvements werepresented at a follow-up workshop inNew Delhi, showing some resultsachieved by participating utilities andreflecting on challenges in taking thiswork forward.
departments in Bangladesh, India,and Pakistan. The Clinic, which tookplace in Bangkok and Singapore,exposed participants to revenuemanagement best practices at thewater supply agencies operating inthose cities. The Clinic requiredparticipants to developimplementation plans to address
32

A Review in Bangladesh,India, and Pakistan:Benchmarking forPerformance Improvementin Urban Utilities
Box 5: Rawalpindi WASA: Improving services through better revenue management
Recognizing that low payment levels reflected customers’ dissatisfaction with the quality of services, RawalpindiWater and Sanitation Agency (WASA) developed a comprehensive strategy to deliver service improvements. Underthe leadership of its Managing Director, since 2006, the organization developed a multifaceted performanceimprovement strategy.
In early 2007, with technical assistance from the Water and Sanitation Program–South Asia, the WASA began acomprehensive survey of all domestic and commercial customers to establish precisely who its customers were, whethertheir account information was captured correctly on the WASA’s database, their billing status, whether they hadoutstanding payments and the reasons for this, how many were metered, how many people were served perconnection, average daily water consumption, and so on.
Equipped with this enhanced understanding of its customers, the WASA was able to upgrade its database from around78,000 to around 124,000 accountholders, regularize unauthorized connections, pursue collection of arrears, andsteadily improve revenue collection rates. The WASA is now financially self-sustaining for all operational expenditure, andis able to pay all staff salaries and electricity bills from its own funds. These measures have enhanced revenue recoveryfrom the previous 53 percent to 86 percent now. This improved revenue is providing funding for new serviceimprovement strategies.
A top priority is to improve water quality through reducing contamination. Most Punjab WASAs have been reluctant toinclude water quality among their benchmarks—because they know there are severe problems but are not necessarilyequipped to fix them. Rawalpindi WASA, however, is tackling this head-on. Testing of water quality at source showedthat while 36 percent of samples were unfit for drinking, the quality of water deteriorated significantly in the network. Aftertreatment, the water that reached consumers was contaminated in 64 percent of samples. Aging, leaking water lineswere passing through sewage drains, and with intermittent water supply, contaminants were entering the network.
Over the course of one year, the WASA reduced the number of samples failing water quality tests at the point ofconsumption from 64 percent to 26 percent. This was achieved by relocating distribution lines out of common servicechannels and gutters, and rehabilitating water treatment plants so that they are no longer a source of contamination.
Water quality improvements are being taken further, using Continuous Improvement and Benchmarking approaches toimprove the integrity of the water network. Leak detection and repair operations are being process-mapped, to identifyways of streamlining and strengthening operational management as well as developing standard operating proceduresto institutionalize improvements.
The increase in annual collection ofwater charges by Rs. 30 million since2006 has reduced its dependence onstate subsidies, and is enabling theorganization to implement serviceimprovements—including networkextensions—without having to relysolely on external funding. Furthermore,with improved data quality, the RajkotMunicipal Corporation has revised its
reported nonrevenue water figure from12 percent in 2006 to 30 percent in2009. These results illustrate severalimportant points with wider relevancefor using performance data:
� Reporting on ratios (for example,billing versus collection) can obscurereal performance improvements ifseen in isolation from other
indicators. Despite a huge increasein revenue, the collection rate hasdeclined because overall billing hasincreased faster than payments.
� Performance improvements includethe increased reliability of data,and may result in an apparentdeterioration in reportedperformance. In the Rajkot example,
33

Box 6: Rajkot: Acting on benchmarking findings torefine performance
The Rajkot Municipal Corporation (RMC), in the west Indian state of Gujarat,was an active participant in the Water and Sanitation Program–South Asia’s(WSP-SA’s) Phase 2 benchmarking initiative in 2005–06. Findings fromthe benchmarking process helped inform a range of service deliveryimprovements.
In 2006 the RMC reported nonrevenue water of 12 percent, but with just1 percent of connections metered, it acknowledged that this was purely anestimate. It set up a work team to improve billing and collection performance.It developed improvement plans tackling five areas: data cleansing,regularization of illegal connections, outsourcing of collection, improvedcollection rates, and the establishment of a call center.
The results, achieved over three years, have been impressive:
• Customers can now engage with the Corporation more easily througha 24x7 call center. Software was developed in-house to managecomplaints received by phone, fax or face-to-face at a zonal office.There was some initial resistance from staff when poor performancewas revealed by the new response tracking system, but this hasbeen overcome.
• Over 20,000 unauthorized connections have been regularized;citizen resistance was addressed through information campaigns in thelocal media.
• Payment has been made easier by providing pay-points within a radius of3 km from customer residences, and allowing payments through the PostOffice. The RMC is now planning to make provision for web-basedpayments. Considerable effort was put into publicizing the new ways ofpaying service charges.
The improvements achieved are summarized in Table 3.
Year Water billing Water % increase in % increase in Collection No. of payers No. of newcollections billing collections rate connections
2005–06 81,660,410 62,191,965 76% 83,196 3,345
2008–09 209,273,305 92,465,813 48% 31% 44% 87,446 11,087
Table 3: Rajkot Municipal Corporation: Performance improvement in water billing and collection
34
the revision of reported NRW figuresfrom 12 percent to 30 percent reflectsfar more credible data.
� Public education and awarenesscampaigns are needed to buildunderstanding of what performancedata actually show to prevent possiblemisinterpretation.
In some instances, benchmarking ishelping to focus and refine existingsupport strategies. Dhaka Water andSewerage Authority, for example, isreceiving assistance from the Governmentof Bangladesh and the World Bankthrough a five-year integratedperformance improvement plan focusedon improving its financial and operatingefficiency. Data collation and assessmentfor performance benchmarking wasundertaken while the performanceimprovement plan (PIP) was beingdeveloped; the performance gapsrevealed through benchmarkingstrengthened the PIP significantly, byhighlighting specific performanceparameters needing attention and makingthe plan more systematic and strategic.Similarly, a Bangladesh government watersupply program is using benchmarkingdata from five pourashavas to plan andfund service expansion. In Punjab,Pakistan, two World Bank-funded projectsin the pipeline—Punjab Large CitiesProject and Punjab Water Supply and
A Review in Bangladesh,India, and Pakistan:Benchmarking forPerformance Improvementin Urban Utilities
Sanitation Project—are also utilizingthe information generated throughperformance benchmarking andmight be financing some of the PIPsdeveloped so far.
Using ProcessBenchmarkingto DriveImprovementsBenchmarking does not explainthe causes of the gaps exposed,but it does reveal areas thatare contributing to weakperformance—poor collectioninefficiency, unrealistically lowtariffs, limited metering, and so on.
A growing number of utilities are usingprocess benchmarking approaches toidentify process inefficiencies andcorrect them. Where metric, orquantitative, benchmarking revealsareas of comparative strength andweakness, process benchmarkingexplores the underlying driversof performance.
A work team assesses in detail thesequence of activities in a specific
Box 7: Some performanceimprovements require funding
Chapai Nawabganj, a small town inBangladesh, is severely affected byarsenic contamination. Two-thirds of thepourashava’s (that is, municipality’s) 21wells have been taken out of productionbecause of severe contamination, resultingin a supply of 35 liters per person per day.Benchmarking, meanwhile, has revealedother performance weaknesses—notablythe extent of the gap between the cost ofservice provision and income, as a resultof poor collections and low tariffs.
In response, the town’s Mayor workedhard to persuade citizens to accept atariff increase, arguing that serviceimprovements were not possible withoutincreased revenue. He succeeded ingetting their approval, and tariffs wereraised. In parallel, the pourashava set upa water bill collection and maintenancecommittee, comprising the Water Superand four ward councilors, to trackcomplaints handling and go from house tohouse motivating people to pay their bills.The combination of their efforts and thoseof the pourashava’s billing and collectionsstaff saw collection efficiency rise from53 percent in 2006 to 82 percenttwo years later.
However, the Mayor faces growingdissatisfaction from the people, becausedespite the best efforts and a tariffincrease, the pourashava has not beenable to deliver the improvements itpromised as funding anticipated from thearsenic mitigation program failed tomaterialize. Chapai Nawabganj’s plightechoes the experience of severalBangladeshi benchmarking participantswhere lack of capital funds is holdingback the implementation of a number ofurgently needed investments for servicedelivery improvements.
35
functional area—for example,complaints handling or leakdetection—to map the existingprocess flow and identifyopportunities for streamlining orstrengthening performance.Effective, efficient ways of gettingthe job done can then be formalizedthrough standard operatingprocedures (SOPs) so that goodpractice becomes institutionalized,and does not rest on the ideasand experiences of individualswho may leave. Performance onthe basis of these SOPs can bemeasured and monitored regularly,and benchmarked againstother organizations, to drivecontinuous improvement.
In Punjab, Pakistan, the analysis ofdata has identified gaps and a fewWASAs have developed PIP to plugthe performance gaps. TheRawalpindi and Faisalabad Waterand Sanitation Agencies (WASAs)are two utilities who are benefitingfrom a rigorous training andmentoring program in processbenchmarking provided by theAsian Development Bank andSAWUN/ADB. Rawalpindi WASAis using Continuous Improvementand Benchmarking methodologiesto analyze its work flows to improveleak detection and repair, towardsits goal of better water qualityand lower NRW, while Faisalabadis working to strengthen its billingand collection systems toimprove revenue.
Process benchmarking is anintegral part of the businessapproach of Jamshedpur Utilitiesand Services Company, a privatecompany formed in 2003 to driveservice improvements inJamshedpur. Its approach isdescribed in Box 8.
Jamshedpur Utilities and Services Company (JUSCO) emerged as one of the strongest performers in the 2005–06Phase 2 benchmarking initiative supported by the Ministry of Urban Development and the Water and Sanitation Program–South Asia (WSP-SA). In August 2009, its achievements were recognized with a National Urban Water Award for CitizenServices and Governance.
Jamshedpur is an industrial town of 700,000 people in eastern India’s Jharkhand province, which was created in 1905 toserve the Tata Iron and Steel Works. Municipal and power services were built, operated, and maintained by Tata Steel’sTown Division until 2003, when the Town Division was converted into a wholly-owned subsidiary. This new company,JUSCO, is the only corporate private sector provider of civic and municipal services in India, including water andwastewater services.
In 2003, shortly before JUSCO was established, Tata Steel brought in an international water services company, VeoliaWater, to help improve the management of drinking water supply and wastewater services. With Veolia Water’sassistance, the new company addressed a range of performance areas—customer management, metering, nonrevenuewater management, detailed mapping of its operations to streamline processes and enhance efficiencies, laboratoryupgrading to improve water and wastewater quality monitoring, asset mapping with geographic information systems, andso on. Implementation of the new performance improvement strategies was then monitored closely.
Performance measurement, benchmarking, and continuous performance improvement are fundamental to the corporateculture of the Tata group of companies, and JUSCO is no exception. Like every Tata company, JUSCO identifies strategicchallenges, strategic objectives, short- and long-term plans, and performance indicators to track progress in achieving itsgoals. A detailed Balanced Scorecard is used to spell out its annual and medium-term year objectives and targets in fourdimensions: financial management; customer-related service delivery (customer satisfaction, service coverage, waterquality, complaints handling, and so on); internal business processes (operational management, performance efficiency,and so on); and community-oriented initiatives such as water conservation through rainwater harvesting.
Targets are set, with close monthly monitoring, and managers are made personally responsible for performance—withrewards for achieving targets and penalties if they do not. This is an important feature that differentiates JUSCO from itspublic sector peers.
Continuous improvement in JUSCO is achieved by involving all levels of employees in assessing performance andprocess. Each business process is mapped in detail, scrutinized, and discussed, and small group improvementdiscussions involve staff at all levels to build a sense of common purpose and involvement.
Operations are divided into small functional areas, called circles. Each circle analyzes its performance to identifyshortcomings and ways of performing better, and formulates an action plan with clear time-based targets and monitoringindicators. Performance against targets is monitored monthly to understand the impact of the actions, and refine theperformance improvement plan further. Managers are held personally accountable for achieving set targets.
Performances on internal and outcome-based indicators are then compared to regional and international benchmarks.It was on this basis that JUSCO participated in the WSP-SA’s 2005–06 benchmarking initiative. However, a JUSCOspokesperson maintains that while comparison with other utilities is valuable, JUSCO’s main goal is to out-do its ownperformance: “We are competing against ourselves, not anyone else.”
Each year, JUSCO’s reported performance against each target on its Balanced Scorecard is assessed rigorously byspecialized Tata performance auditors, who assign the company a grading out of 1,000. Achieving a high score in thisassessment is the chairman and executive officer’s first priority.
Box 8: JUSCO: A private sector approach to performance measurement and benchmarking
36

A Review in Bangladesh,India, and Pakistan:Benchmarking forPerformance Improvementin Urban Utilities
InstitutionalizingBenchmarkingin GovernmentThe introduction of benchmarkingrepresents an attempt to buildawareness of the value of goodinformation management, to revealperformance, and track progresstowards defined performanceimprovement goals. Governments havea critical role to play in incentivizingutilities to report their performance, andintroducing disincentives for poorquality data and poor performance.
The main reason for the poor quality ofmuch of the data reported by thebenchmarking participants is that, todate, public utilities have not beenincentivized to collect credible data.Unlike private sector entities, which areheld to account by their shareholders,and whose performance affects theirmarket share and survival, publicsector utilities are seldom required toreport to government—at any level—ontheir performance, and are not requiredto account for dismal performance.This is perhaps related to the fact thatpublic reporting reflects on the actionor inaction of local or nationalgovernment (Kingdom & Jagannathan,2001). Consequently, public utilitieshave had few incentives to changetheir performance, or develop the
systems to drive and coordinate datacollection, and if it does not dedicateresources to engage with thereported findings, interrogate them,and act on them. Utilities need bothmonitoring and support.
The proposed establishment of aPerformance Benchmarking Data Cellin the Punjab’s Housing, UrbanDevelopment and Public HealthEngineering Department is hoped toenable regular data collection andassessment. Dissemination of key
Strengthening Benchmarkingto Drive Sector Reforms
performance measurement systemsneeded to demonstrate improvements.It is evident that decisive governmentintervention is needed to driveperformance improvements.
Institutionalization of benchmarking ingovernment is essential to enable it totrack and shape sector performance.In Pakistan and Bangladesh,benchmarking by Water and SanitationAgencies/Water and SewerageAuthorities will lose impetus ifgovernment does not set up its own
37

to function more effectively, therewill be limited improvement in thequality of their data or the caliber oftheir performance.
In India, the leadership of the Ministry ofUrban Development (MoUD) hasengaged closely with the benchmarkingprocess and findings since itsinception, culminating in the launchin 2009 of the Service LevelBenchmarking pilot program. Workingin tandem with state governments, theministry aims to institutionalizebenchmarking across government asan integral part of improving servicedelivery and public accountability.
The MoUD is incentivizingbenchmarking by linking access to
data and analysis in a user-friendlyformat is equally important tosupport public debate and decisionmaking in provincial and citydistrict government, and informtargeted interventions.
In the absence of other sectorregulatory mechanisms, utilitybenchmarking represents one of thefew sources of information available togovernment to track and assesssector performance and informdecision makers about strategicpriorities and funding needs.Currently, there are fewconsequences for utilities that submitpoor data or perform poorly. Untilutilities are incentivized and enabled
central government funds for urbanrenewal to a commitment fromindividual urban local bodies (ULBs) toreport their performance—and thoseof service delivery agencies in theirareas—against defined service levelbenchmarks. It requires each ULB tograde the reliability of its eachreported indicator, and to prepare aninformation managementimprovement plan in addition to aservice quality improvement plan. Itenvisages data verification byindependent third party agencies tocross-check the validity of the datathat ULBs report.
More information on the MoUDapproach is provided in Box 9.
38

A Review in Bangladesh,India, and Pakistan:Benchmarking forPerformance Improvementin Urban Utilities
Box 9: Linking Service Level Benchmarking to national funding programs
In India, the national Ministry of Urban Development (MoUD) is seeking to embed benchmarking into the way towns and cities monitor and reporton their performance nationally, using the US$10 billion Jawaharlal Nehru National Urban Renewal Mission (JNNURM) and other nationallysponsored schemes to pilot implementation. Rapid urbanization and the scale of urban growth calls for a thorough overhaul of service deliveryand reform to enhance local government accountability for service delivery. The government sees benchmarking as an important mechanism forsupporting this, especially through public disclosure of commitments, performance against targets, and links to Performance Improvement Plans.
Building on the lessons of benchmarking experience in India and elsewhere, the ministry has led the development of a Handbook for ServiceLevel Benchmarks. The Handbook identifies nine key performance indicators for water supply, nine for sewerage management, eight for solidwaste management, and two for storm water drainage. It provides detailed information on what information is required and how to report it.
Each participating city is advised to collect and submit data to reveal its performance against each of the listed indicators—annually to state andcentral governments, and more frequently at local level. A report card format has been developed to capture performance objectives and data.
An example of how each Service Level Benchmark indicator will be reported in a performance report card is presented below.
Service Level Benchmark: Coverage of water supply connections
In due course, the report cards are expected to be made public, and used by governments and other stakeholders to hold utilities to accountagainst their improvement targets and action plans (MoUD, 2008).
Strengthening Information Systems
Reporting on performance is meaningless unless the data used for performance measurement are reliable. To ensure consistency in reportingand comparability of the performance data within and between cities, the requirements for each indicator are specified in detail. Each indicatoris defined clearly, with a practical explanation of what data to collect, how to calculate the indicator, and how frequently it must be measured. Tomonitor service delivery differences within and across a given city, the Handbook defines the geographical area for which the indicator must bemeasured—water distribution zone, ward, urban local body or city. The reliability of measurement for each data input must be specified, on ascale from A to D, in line with defined reliability criteria for each.
National Technical Advisors have been appointed, with the Water and Sanitation Program’s support, to provide guidance on data gatheringmethodologies, indicator definitions, and later to advise cities and consultants on the preparation of performance improvement plans. Regionaland national benchmarking workshops will be convened to share information and reflect on the lessons of experience. Beyond the first12-month period, each city’s performance will be reviewed against its action plans for improving service delivery and information management.
Scaling up
Based on implementation experience in the pilot cities, the MoUD will encourage state governments to prepare a benchmarking scale-up plan.This would include arrangements for the creation of a state-level Benchmarking Cell to coordinate and drive benchmarking in the state;extension of the benchmarking program to other cities in the state; and, crucially, identification of how to integrate benchmarking informationinto state government decision-making processes. In this way, the national government aims to promote the use of benchmarking data toinform policy development, funding transfers to states and cities, evaluation of personnel involved in service delivery, and so on.
Time period Performance Performance Data Action plan for achieving the targetachieved targeted reliability
FY 07–08 71 B(baseline)
FY 08–09 75 All backlog applications for new connections will be clearedwithin 12 months
FY 09–10 85 Major source augmentation and transmission project will be completed
Regularization of all illegal connections in north of the city
FY 10–11 90 Distribution improvement project will commence
Standposts will be replaced in wards 13 and 17
Regularization of all illegal connections in south of the city
FY 11–12 95 Standposts will be replaced in wards 19–23
39
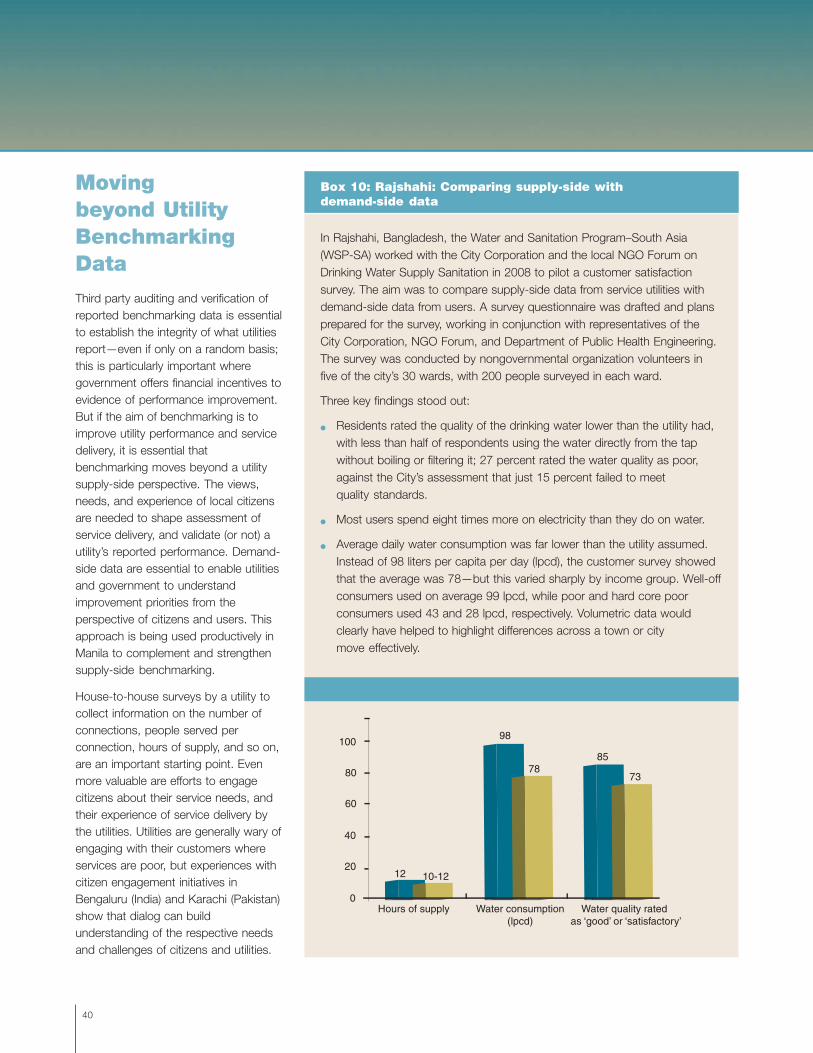
Movingbeyond UtilityBenchmarkingData
Third party auditing and verification ofreported benchmarking data is essentialto establish the integrity of what utilitiesreport—even if only on a random basis;this is particularly important wheregovernment offers financial incentives toevidence of performance improvement.But if the aim of benchmarking is toimprove utility performance and servicedelivery, it is essential thatbenchmarking moves beyond a utilitysupply-side perspective. The views,needs, and experience of local citizensare needed to shape assessment ofservice delivery, and validate (or not) autility’s reported performance. Demand-side data are essential to enable utilitiesand government to understandimprovement priorities from theperspective of citizens and users. Thisapproach is being used productively inManila to complement and strengthensupply-side benchmarking.
House-to-house surveys by a utility tocollect information on the number ofconnections, people served perconnection, hours of supply, and so on,are an important starting point. Evenmore valuable are efforts to engagecitizens about their service needs, andtheir experience of service delivery bythe utilities. Utilities are generally wary ofengaging with their customers whereservices are poor, but experiences withcitizen engagement initiatives inBengaluru (India) and Karachi (Pakistan)show that dialog can buildunderstanding of the respective needsand challenges of citizens and utilities.
Box 10: Rajshahi: Comparing supply-side withdemand-side data
In Rajshahi, Bangladesh, the Water and Sanitation Program–South Asia(WSP-SA) worked with the City Corporation and the local NGO Forum onDrinking Water Supply Sanitation in 2008 to pilot a customer satisfactionsurvey. The aim was to compare supply-side data from service utilities withdemand-side data from users. A survey questionnaire was drafted and plansprepared for the survey, working in conjunction with representatives of theCity Corporation, NGO Forum, and Department of Public Health Engineering.The survey was conducted by nongovernmental organization volunteers infive of the city’s 30 wards, with 200 people surveyed in each ward.
Three key findings stood out:
� Residents rated the quality of the drinking water lower than the utility had,with less than half of respondents using the water directly from the tapwithout boiling or filtering it; 27 percent rated the water quality as poor,against the City’s assessment that just 15 percent failed to meetquality standards.
� Most users spend eight times more on electricity than they do on water.
� Average daily water consumption was far lower than the utility assumed.Instead of 98 liters per capita per day (lpcd), the customer survey showedthat the average was 78—but this varied sharply by income group. Well-offconsumers used on average 99 lpcd, while poor and hard core poorconsumers used 43 and 28 lpcd, respectively. Volumetric data wouldclearly have helped to highlight differences across a town or citymove effectively.
40

A Review in Bangladesh,India, and Pakistan:Benchmarking forPerformance Improvementin Urban Utilities
Simply measuring performanceand sharing information within andbetween utilities is a significantperformance driver
Performance data are beingincreasingly recognized as a criticaldriver of strategic planning,performance management, andimproved sector accountability, by theparticipating utilities of the WSP-SAand higher tiers of government in thethree countries. Poor performance,and the reasons for poor performance,are obscured when performance is notmeasured and monitored regularly.Through revealing how serviceprovision by one utility compares withanother, benchmarking is drawingattention to the good practices of thestrong performers, and sendingsignals to the poor performers of theneed for corrective action.
Through quantifying performanceacross a range of operational andservice parameters, management canset improvement targets and start toidentify what is getting in the way ofachieving performance goals. Throughstimulating the development ofsystems for collecting and assessingperformance data, benchmarking islaying the basis for improved sectorgovernance and regulation.
Institutionalize benchmarking tooptimize the benefits of utilitybenchmarking for sector reform
Benchmarking can be onerous andcompromising for utilities who are not
accustomed to revealing theirperformance. Utilities need to knowthat government will scrutinize thedata they submit, ask questions, andengage with its implications.
Government gains real insight intoservice delivery gaps, utilities’ realchallenges, and the sector’s reformneeds when it puts in place systemsat state and national level to drive,coordinate, collect, and assessbenchmarking data. The insights itgains are invaluable for driving policydevelopment for service deliveryreform, and shaping the governanceframeworks that the sector needs.
Benchmarking requires clearly-defined performance indicatorsand consistent data sources
Benchmarking is premised oncomparative assessment, andcomparison is not feasible unless astandardized approach to collectingand analyzing data is used.
Where a utility is required to providedata for an indicator which it does notnormally measure, it is likely to providead hoc information. Most utilities willneed support and guidance in settingup consistent performancemeasurement systems and robustinformation management systems.Without this it is not possible to tracktrends or monitor improvementsover time.
Wherever possible, utilities shouldindicate the reliability of the data on
Key Lessons from RegionalBenchmarking Experience
41
which each indicator is based. Oneoption is to use the InternationalBenchmarking Network for Waterand Water Utilities’ data reliabilitygrading system, and to reward a utilityfor each reported indicator thatprogresses from a low towards ahigher reliability grading.
Third party verification should beintroduced to validate the data whichutilities report.
Keep performance improvementplanning pragmatic
Utilities are responding to the findingsof their benchmarking results with boldimprovement plans across a range ofperformance areas. But ‘less’ can be‘more’: too many objectives can meana loss of focus and effectiveness, andwithout clear time-based targets andsecured funding, improvement plansmay well lose momentum.
Networks between the utilities thatdo benchmarking allow successstories to be shared and promoteadoption of good practice
Mutual support and knowledgesharing between utilities is one of themost valuable outcomes of regionalbenchmarking initiatives. It shiftsthe focus beyond comparativeperformance assessment torecognition of successes anddiscussion on how to improveperformance and implement goodpractices in a different context.

42

A Review in Bangladesh,India, and Pakistan:Benchmarking forPerformance Improvementin Urban Utilities
Phase 4: The way forward
The value of water utility benchmarkingis increasingly recognized inBangladesh, India, and Pakistan, andprograms across the region are beingscaled up.
In Pakistan, the country’s biggest waterutility, Karachi Water and SewerageBoard, as well as the PeshawarDevelopment Authority in the NorthWest Frontier Province and IslamabadCapital Development Authority aregearing up to begin benchmarking.
In Bangladesh, at least three moreutilities will join the benchmarkinginitiative in 2009.
Next Steps
In India, the 26-city Service LevelBenchmarking pilot initiative aims tostimulate the adoption andinstitutionalization of benchmarkingnationally as a key part of servicedelivery reform.
Key priorities moving forward include:
• Improve the reliability andcomparability of benchmarkingdata, by incentivizing and assistingutilities to strengthen theirmanagement information systems.
• Broaden the scope of performanceassessment so that it shouldinclude customer perspectives.
• Widen dissemination ofbenchmarking data to citizens’groups, and promote dialog abouthow best to use the findings tosupport improved service delivery.
• Build government’s capacity to drivebenchmarking, and use the resultsto shape sector reforms and provideinvestment support.
Following on from the introduction ofbenchmarking over three phases, asdescribed at the beginning of thisreview, the fourth phase ofbenchmarking in Bangladesh, India,and Pakistan might look like the figuregiven here.
43
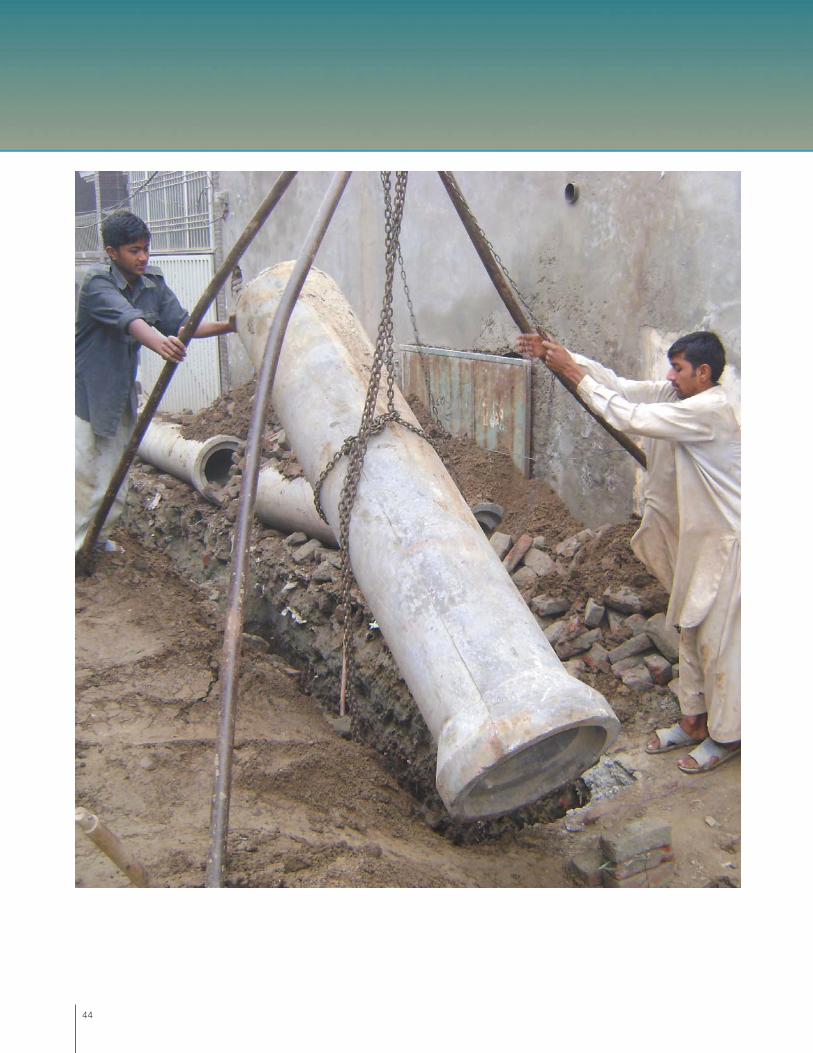
44
A Review in Bangladesh,India, and Pakistan:Benchmarking forPerformance Improvementin Urban Utilities
The introduction of performancebenchmarking is driving a newrecognition of the importance ofmeasurement as a management tool. Itis exposing performance gaps, andhighlighting the value of integratedinformation systems to support decisionmaking and track progress towardsdefined targets. The information hascritical importance for performanceimprovement planning, and for shapingthe evolution of government policy andinstitutional frameworks. It enablesdevelopment partners to target theirassistance more effectively.
Given the absence of formal monitoringsystems to track the performance ofwater utilities, the institutionalization ofbenchmarking represents a major stepforward to building the necessarysystems, procedures, and structuresneeded for sector oversight. A keyfinding from benchmarking acrossSouth Asia is that performance trackingsystems are poorly developed in most
Conclusions
water utilities. Without reliablequantitative data, managers areoperating largely in the dark, unable toidentify trends or track the impact oftheir decisions. Equally, the lack ofcredible performance informationmakes it difficult for government orcitizens to hold service providers toaccount, and contributes toongoing poor service deliveryacross the region.
By tracking performance outputs andoutcomes, benchmarking supports areorientation in the way utilities assesstheir performance—beyondinfrastructure development to networkmanagement and customer service.This, in turn, paves the way for a newera in service provision, wherecomparative performance data aremade public and provides a basis fordialog between government, citizens,and service providers around howbest to achieve the serviceimprovements the region needs.
The benchmarking data also highlightthe limits of what internal utility reformscan achieve, and the need for wider-ranging sector reforms—to clarify andstreamline the lines of accountability,provide a clearer separation betweenthe role of authority and provider, andincentivize a greater customer andcommercial orientation. Performanceimprovements will be limited as long asutilities are structured as technicalservice departments of government,but required to perform likecommercial utilities.
The emergence of an organizationalculture that strives for continuousperformance improvement—withthe associated data generation,performance management, andbenchmarking systems that go with it—is unlikely as long as all the currentdisincentives to real change prevail.Benchmarking lays a basis for strongergovernance systems and accountabilityacross the sector.
45

Cabrera, Enrique Jr. 2008. ‘Benchmarking in the Water Industry: A Mature Practice?’ Water Utility ManagementInternational, June 2008.
Corral, Violetta P. 2008. ‘Training on Performance Benchmarking for Philippine Water District.’ October 21–24, 2008,MCWD Regional Training Centre, Cebu City.
Dassler, Thoralf, David Parker, and David S. Saal. 2006. ‘Methods and Trends of Performance Benchmarking’, UtilitiesPolicy Vol. 14:3, September 2006.
Government of Bangladesh, Ministry of Local Government, Rural Development, and Cooperatives, Local GovernmentDivision, and the Water and Sanitation Program–South Asia. 2008. Bangladesh Water Utilities Book. Draft.
Government of India, Ministry of Urban Development. 2008. Handbook on Service Level Benchmarks.
Government of Punjab and the Water and Sanitation Program–South Asia. 2009. Data Book: Punjab Water Utilities. Draft.
Housing, Urban Development and Public Health Engineering Department, Government of Punjab, Water and SanitationProgram–South Asia, and the South Asian Water Utilities Network. 2008. ‘National Workshop on PerformanceBenchmarking.’ August 26-29, 2008, Burbhan. Unpublished proceedings.
Kingdom, Bill. 1996. Performance Benchmarking for Water Utilities.
Kingdom, Bill, and Vijay Jagannathan. 2001. Utility Benchmarking: Public Reporting of Service Performance. Public Policyfor the Private Sector, Note Number 229. World Bank.
South East Asian Water Utilities Network and Asian Development Bank. 2007. Data Book of Southeast Asian WaterUtilities, 2005.
Water and Sanitation Program. 2006. Urban Water Sector in South Asia: Benchmarking Performance.
Water and Sanitation Program. 2008. Phase II Benchmarking Urban Water Utilities in India.
Yepes, Guillermo, Klas Ringskog, and Shyamal Sarkar. 2000. ‘The high costs of intermittent water supplies.’http://www.liemberger.cc/downloads/publicationsfiles/Yepes.pdf
References
46

A Review in Bangladesh,India, and Pakistan:Benchmarking forPerformance Improvementin Urban Utilities
Appendix
South Asian utilities participating in performance benchmarking, 2005–07
Country Town or city Utility name Indicative size: Number ofwater connections
Bangladesh Dhaka Dhaka Water Supply and Sewerage Authority (WASA) 243,000
Chittagong Chittagong Water Supply and Sewerage Authority 43,810
Rajshahi Rajshahi City Corporation 22,650
Bagerhat Bagerhat Pourashava 3,200
Chandpur Chandpur Pourashava 4,620
Chapai Nawabganj Chapai Nawabganj Pourashava 3,750
Chuadanga Chuadanga Pourashava 2,250
Gazipur Gazipur Pourashava 4,010
Jessore Jessore Pourashava 8,950
Manikanj Manikanj Pourashava 4,500
Narsingdi Narsingdi Pourashava 2,060
India Bengaluru Bangalore Water Supply and Sewerage Board (BWSSB) 479,720
Bhubaneswar Public Health Engineering Organization 52,210
Chandigarh Municipal Corporation of Chandigarh 137,409
Chennai Chennai Metropolitan Water Supply and Sewerage Board 365,680
47

South Asian utilities participating in performance benchmarking, 2005–07
Country Town or city Utility name Indicative size: Numberof water connections
Dehradun Uttarakhand Jal Sansthan 62,370
Hyderabad Hyderabad Metropolitan Water Supply and Sewerage Board (HMWSSB) 526,870
Indore Indore Municipal Corporation 158,920
Jamshedpur Jamshedpur Utility Services Company Limited (JUSCO) 42,000
Pune Pune Municipal Corporation 106,500
Rajkot Rajkot Municipal Corporation 192,000
Punjab, Faisalabad Faisalabad Water and Sanitation Agency (F-WASA) 93,000
Gujranwala Gujranwala Water and Sanitation Agency (G-WASA) 31,413
Lahore Lahore Water and Sanitation Agency (L-WASA) 570,000
Multan Multan Water and Sanitation Agency (M-WASA) 34,347
Rawalpindi Rawalpindi Water and Sanitation Agency (R-WASA) 124,000
Pakistan
48

A Review in Bangladesh,India, and Pakistan:Benchmarking forPerformance Improvementin Urban Utilities

Water and Sanitation ProgramE 32 Agargaon, Sher-e-Bangla NagarDhaka 1207, BangladeshPhone: (880-2) 8159001-14Fax: (880-2) 8159029-30
55 Lodi EstateNew Delhi 110 003, IndiaPhone: (91-11) 24690488, 24690489Fax: (91-11) 24628250
20 A Shahrah-e-JamhuriatRamna 5, G-5/1, Islamabad, PakistanPhone: (92-51) 2279641-46Fax: (92-51) 2826362
E-mail: [email protected] site: www.wsp.org
February 2010
WSP MISSION:WSP’s mission is to support poor people in obtainingaffordable, safe, and sustainable access to water andsanitation services.
WSP FUNDING PARTNERS:The Water and Sanitation Program (WSP) is amulti-donor partnership created in 1978 andadministered by the World Bank to support poorpeople in obtaining affordable, safe, and sustainableaccess to water and sanitation services. WSPprovides technical assistance, facilitates knowledgeexchange, and promotes evidence-basedadvancements in sector dialog. WSP has offices in25 countries across Africa, East Asia and the Pacific,Latin America and the Caribbean, South Asia, and inWashington, DC. WSP’s donors include Australia,Austria, Canada, Denmark, Finland, France, the Billand Melinda Gates Foundation, Ireland, Luxembourg,Netherlands, Norway, Sweden, Switzerland, UnitedKingdom, United States, and the World Bank. Formore information, please visit www.wsp.org.
AusAID provides WSP-SAprogrammatic support.
PEER REVIEWERS:Alexander V. Danilenko, Chris Heymans,Jemima T. Sy, Vandana Mehra, and William Kingdom.
TASK MANAGER:Masroor Ahmad, supported byMd. Akhtarzaman and Vandana Bhatnagar.
AUTHOR:Katherine Eales, supported by Masroor Ahmad.
Editor: Anjali Sen GuptaPictures by: WSP–SA, Asad Zaidi, and Sajid DarokhanCreated by: Write MediaPrinted at: PS Press Services Pvt. Ltd.
ACKNOWLEDGMENTS:Senior officials of the provincial and national governments, utility heads, and performancebenchmarking focal persons in utilities in Bangladesh, India, and Pakistan.