Embed Size (px)
Citation preview

Indexology®
SPRING 2019
Magazine
The Fourth Industrial Revolution: Are We Ready?Getting Smarter About Saving for College
Talking Sustainability
What Does It Really Mean to be Diversified?
How Low Volatility Could Make You “King of the Mountains”
1
7
14
17
23

1 S&P Dow Jones Indices
John van MoylandManaging Director Global Head of S&P Kensho Indices S&P Dow Jones Indices
Rapid developments in artificial intelligence (AI) and robotics—coupled with ubiquitous connectivity and vast, easily accessible processing power—are laying the groundwork for fundamental structural changes in the global economy. These mutually reinforcing catalysts are driving exponential innovation across a wide swathe of the economy, reshaping entire industries and creating new ones.
Interestingly, these catalysts are not new in and of themselves. For instance, the early work in modern-day artificial intelligence began in the 1950s, even though progress was limited given the lack of necessary processing power; and, of course, robots have been commonplace in manufacturing for well over 30 years. What’s prompting this new era is the compounding effect of developments in each of these areas. For instance, massively powerful and easily accessible computing power has greatly accelerated
developments across AI, robotics, and the internet of things. Similarly, rapid developments in AI have greatly enhanced the capabilities of robotics, complex network management, and our ability to make sense of the vast amount of data captured by an increasingly connected world.
It is not purely technical advancements that are facilitating this revolution: a cultural shift towards a more open, sharing economy has also lowered the barriers to entry for many innovative startups. The open source community has evolved to include valuable intellectual property and sophisticated foundational components made freely available by large companies, such as Amazon, Google, and Facebook, for use by third parties. Couple that with on-demand services, such as effectively limitless computing power, and it’s easy to see how many traditional barriers to entry have been lowered across many industries.
Thirty-eight percent of American workers may need to change occupations by 2030, according to PwC.1 That means about 45 million people already in the workforce might need to be retrained over the next 11 years. In the same vein, McKinsey Global Institute has estimated that approximately 50% of the activities people are paid to do, representing USD 16 trillion in costs to the global economy, can be automated using currently available technology.2
1 PricewaterhouseCoopers LLP, “UK Economic Outlook,” (March 2017), https://www.pwc.co.uk/economic-services/ukeo/pwc-uk-economic-outlook-full-report-march-2017-v2.pdf.2 Manyika, et al., “A Future that Works: Automation, Employment, and Productivity,” McKinsey Global Institute, (January 2017),
https://www.mckinsey.com/~/media/mckinsey/featured%20insights/Digital%20Disruption/Harnessing%20automation%20for%20a%20future%20that%20works/MGI-A-future-that-works-Executive-summary.ashx.
The Fourth Industrial Revolution: Are We Ready?
2Indexology Spring 2019
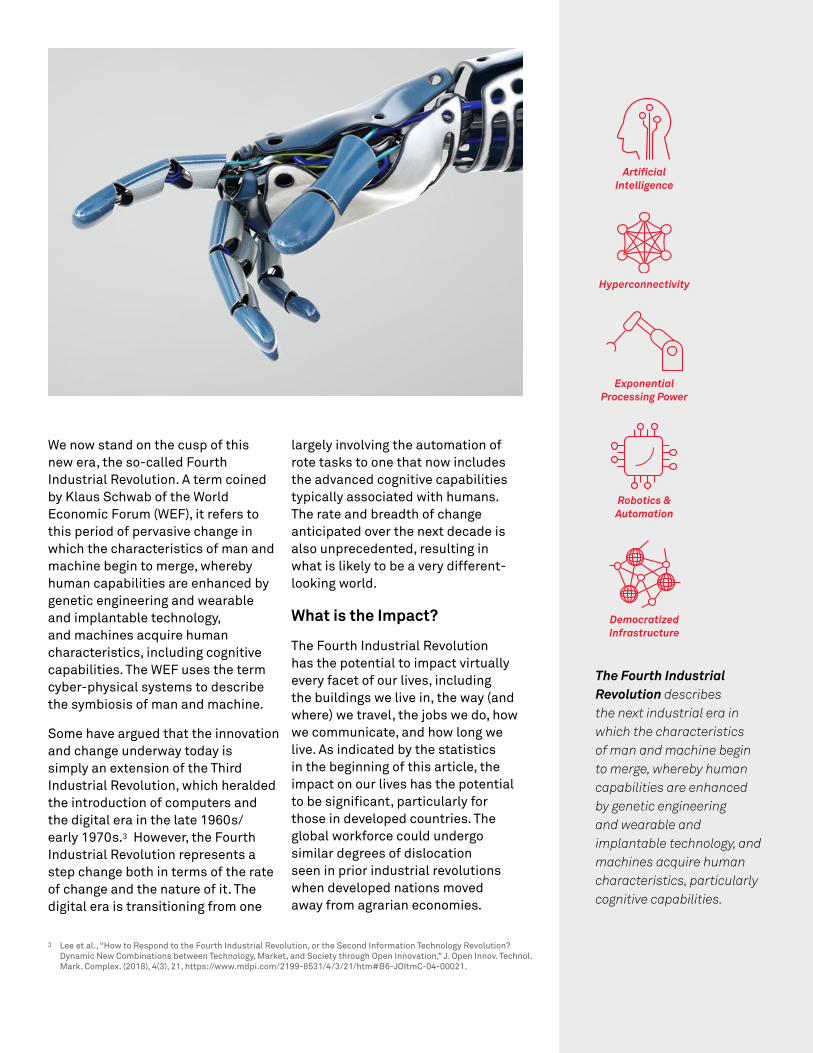
We now stand on the cusp of this new era, the so-called Fourth Industrial Revolution. A term coined by Klaus Schwab of the World Economic Forum (WEF), it refers to this period of pervasive change in which the characteristics of man and machine begin to merge, whereby human capabilities are enhanced by genetic engineering and wearable and implantable technology, and machines acquire human characteristics, including cognitive capabilities. The WEF uses the term cyber-physical systems to describe the symbiosis of man and machine.
Some have argued that the innovation and change underway today is simply an extension of the Third Industrial Revolution, which heralded the introduction of computers and the digital era in the late 1960s/early 1970s.3 However, the Fourth Industrial Revolution represents a step change both in terms of the rate of change and the nature of it. The digital era is transitioning from one
largely involving the automation of rote tasks to one that now includes the advanced cognitive capabilities typically associated with humans. The rate and breadth of change anticipated over the next decade is also unprecedented, resulting in what is likely to be a very different-looking world.
What is the Impact?
The Fourth Industrial Revolution has the potential to impact virtually every facet of our lives, including the buildings we live in, the way (and where) we travel, the jobs we do, how we communicate, and how long we live. As indicated by the statistics in the beginning of this article, the impact on our lives has the potential to be significant, particularly for those in developed countries. The global workforce could undergo similar degrees of dislocation seen in prior industrial revolutions when developed nations moved away from agrarian economies.
3 Lee et al., “How to Respond to the Fourth Industrial Revolution, or the Second Information Technology Revolution? Dynamic New Combinations between Technology, Market, and Society through Open Innovation,” J. Open Innov. Technol. Mark. Complex. (2018), 4(3), 21, https://www.mdpi.com/2199-8531/4/3/21/htm#B6-JOItmC-04-00021.
The Fourth Industrial Revolution describes the next industrial era in which the characteristics of man and machine begin to merge, whereby human capabilities are enhanced by genetic engineering and wearable and implantable technology, and machines acquire human characteristics, particularly cognitive capabilities.
Artificial Intelligence
Hyperconnectivity
Exponential Processing Power
Robotics & Automation
Democratized Infrastructure

3 S&P Dow Jones Indices
However, as the world’s population has increased exponentially, the absolute numbers of those affected will be unprecedented should these predictions come to fruition. There is one important difference to note: the demographics are very different this time around. In the context of an aging population, it has been argued that we require as much automation and as many workers as possible in order to meet our future aspirations for economic growth.4 The challenge is likely to be far less about a lack of jobs for human workers than about how to retrain and redeploy millions of people.
What Does All This Mean for Investors?
Periods of upheaval pose both opportunities and risks for investors. Just as the internet revolution of the 1990s presented investors with significant opportunities, particularly in Technology and Telecommunications, the Fourth Industrial Revolution may do so as well. In this case, given the unprecedented breadth of its predicted impact, it may be particularly important to understand which industries could be disrupted and which new ones might emerge.
The traditional tools available to help investors understand company exposures, such as the common company classification schemes prevalent today, may not be very well-suited to identifying specific areas of exponential innovation and disruption. While a perfectly legitimate lens with which to view the world, traditional sector and industry classifications are largely functionally oriented, a reflection of a manufacturing-oriented economy. A market- or outcome-based classification scheme is more suitable for capturing specific innovative areas of the new economy. Given the degree of complexity
4 Manyika, et al., “A Future that Works: Automation, Employment, and Productivity,” McKinsey Global Institute, (January 2017), https://www.mckinsey.com/~/media/mckinsey/featured%20insights/Digital%20Disruption/Harnessing%20automation%20for%20a%20future%20that%20works/MGI-A-future-that-works-Executive-summary.ashx
How long we live Genetic Engineering
The power we use Clean Power
Where we travel Space
Where we live Smart Buildings
How we travel Autonomous Vehicles
How we communicateVirtual Reality
How we build things 3D Printing
The jobs we do Robotics
How we protect ourselves Cybersecurity
The food we eatSustainable Staples

4Indexology Spring 2019
of supply chains today, it is also important to consider the entire ecosystem of companies, i.e. pure plays, supply chain companies, and service providers, when evaluating the full economic exposure in a given sector. On top of that, it may help to look beyond the traditional cues used to categorize a company’s activities, such as revenue filters, in order to understand which companies are driving innovation in this dynamic and rapidly changing environment. They are generally making large, strategic bets—ones designed to position them at the forefront of their industries in the years to come. New approaches are required to capture
these forward-looking strategies in a systematic way and may help investors skate to where the puck is going, rather than where it has already been.
Existing broad-based market indices do not precisely capture these areas of innovation. In fact, we know that history does not favor the incumbent: the average tenure in the S&P 500 was 15 years in 2015, down from 65 years in 1920, and, if current projections hold true, 40% of the current Fortune 500 companies will not be around in 2025.5 Understanding the makeup of the “New Economies” may be an
interesting complement to the use of existing broad-based market indices, providing a bridge between the economies of today and those of tomorrow as they develop.
In 2015, Kensho Technologies, LLC, now a subsidiary of S&P Global, committed to providing market participants with the tools necessary to understand and capture the opportunities presented by the Fourth Industrial Revolution. Using a new and innovative adaptive classification framework6 and employing cutting-edge AI to identify the companies propelling this revolution,
S&P Kensho New Economy Indices21st Century Sectors
Expert curation, combined with advanced topic modelling, is used to create a comprehensive model of the target industry
Natural Language Processing (NLP) and machine learning identify companies from SEC filings
Captures both pure play names, as well as the supporting ecosystems
Each company categorized according to the degree of its focus on the New Economy (Core vs. Non-Core)
Core category over-weighted vs. Non-Core
Companies equal weight within each category
Minimum market cap and ADTV applied
Index construction verified by investment analysts and approved by the Index Committee
Entirely rules-based and objective
Model Industry AI Selection Categorize Weight
& Optimize Verify1 2 3 4 5
5 Mochari, Ian, “Why Half of the S&P 500 Companies Will Be Replaced in the Next Decade,” Inc., (March 23, 2016), https://www.inc.com/ilan-mochari/innosight-sp-500-new-companies.html.
6 Rook, D., Salvatori, A., Van Moyland, J., and Rosa, P., “Innovation Patterns: Upgrading Sectoral Classification for the Fourth Industrial Revolution,” Kensho Technologies, (March 2017), http://www.kenshoindices.com/src/assets/whitepapers/innovation-patterns-ssrn.pdf.
S&P Kensho New Economy Indices Methodology Overview

5 S&P Dow Jones Indices
Kensho has produced a comprehensive, and investable, view of the Fourth Industrial Revolution. The resulting family of indices consists of 25 subsectors, each representing an area of exponential innovation, 11 sectors that are the aggregations of one or more subsectors (in whole or in part), and composite indices providing investors with the broadest exposure to this phenomenon.
Please visit spdji.com/index-family/kensho-new-economies/all to learn more. n
The most comprehensive family of indices to capture the industries and innovation of the Fourth Industrial Revolution
Composite Indices
New Economies Composite (KNEX)^# New Economies Select (KNESLX)^
Sectors Subsectors
Intelligent Infrastructure (KINFRA)#
Space (KMARS)^
On Demand Economy (KPDQ)**
Smart Transportation (KMOVE)#
Robotics (KBOTS)^
Sustainable Farming (KFARM)**
Future Security (KSECURE)#
Clean Energy (KENERGY)^
Genetic Engineering (KDNA)^
Clean Power (KPOWER)#
Cyber Security (KCYBER)^
3D Printing (KDDDP) ^
Final Frontiers (KEXPLORE)#
Smart Borders (KDMZ)^
Nanotechnology (KNANO)^
Future Communication (KCONNECT)
Wearables (KBORG)^
Smart Factories (KMAKE)**
Democratized Banking (KFIN)
Drones (KDRONE)^
Smart Grids (KGRIDS)^
Human Evolution (KEVOLVE)
Clean Tech (KCLEAN)^
Adv. Transport Systems (KATS)^
Advanced Fabrication**
Virtual Reality (KVR)^
Electric Vehicles (KEV)^
On Demand Economy**
Smart Buildings (KHOME)^
Alternative Financing (KALTFIN)^
Sustainable Staples**
Autonomous Vehicles (KCARS)^
Future Payments (KPAY)^
Digital Communities (KSOCIAL)^
Distributed Ledger (KLEDGER)^
Enterprise Collaboration (KTEAM)^
#: Tracked by State Street SPDRs ^: Tracked by non-US or non-SSgA US fund(s) *: Calculation Ready **: Not live yet
23 24 25
17 18 19
14
15 16
421 5 6 7 9
3 8
1 7
9 12 13
7 11 21
10 20
2 6 9 16 17 18
1
2
3
4
5
6
7
8
9
10
11
12
13
14
15
16
17
18
19
20
21
22
23
24
25

6Indexology Spring 2019
SPICE® Your gateway to index data.A platform that delivers a wealth of data on more than 250,000 equity and fixed income indices for the purposes of research, reporting, and analysis. Recently redesigned to be more flexible and easier-to-use than ever, SPICE offers data solutions for every user.
Visit spice-indices.com to learn more and subscribe.

7 S&P Dow Jones Indices
Jodie Gunzberg, CFA* Unfortunately, most market participants saving for college only have some combination of the investments currently available—perhaps in a 529 plan, also known as a “qualified tuition plan,” made up of just traditional stock and bond funds.
In response to this growing issue, S&P Dow Jones Indices partnered with Enduring Investments to develop the S&P Target Tuition Inflation Index, which is designed to reflect changes in college tuition and fees over long-term periods using a combination of inflation bond, corporate bond, and equity indices.
Constructing the Index
The first step in designing an index to track college tuition inflation over time is to understand how college tuition is set. Colleges are producing a product just like any other business—in this case, the product is education. And just like any other
business, they have expenses and revenues.
On the expense side, colleges have mostly labor costs, but that’s not all that goes into creating the educational product—there’s also student services, administration, operations, and maintenance. According to American Institutes for Research (AIR), “More than one-half of total average spending by private research universities was dedicated to E&R [education and related spending] functions, and at private non-research colleges, E&R accounted for approximately 80 percent of total expenditures.” 2
Collectively, those costs rise with general inflation. For example, in 2013, E&R spending per full-time equivalent student increased an average of 2-3% at public four-year institutions.2
On the revenue side, colleges basically have two types—internal
Getting Smarter About Saving for College
Costs associated with college tuition and fees, as measured by the U.S. Bureau of Labor Statistics,1 have far outpaced general U.S. inflation, as measured by CPI (5.9% versus 2.6%, annualized from January 1987 to June 2018; see Exhibit 1). So for individuals saving for college, growing assets on pace with tuition inflation can be challenging without the assistance of a college inflation protection security.
1 U.S. Department of Labor, Bureau of Labor Statistics. CPI-All Urban Consumers (Current Series) Original Data Value, Series Id: CUUR0000SA0, Not Seasonally Adjusted, Series Title: All items in U.S. city average, all urban consumers, not seasonally adjusted, Area: U.S. city average, Item: All items, Base Period: 1982-84=100, Years: 1987 to 2018. U.S. Department of Labor, Bureau of Labor Statistics. CPI-All Urban Consumers (Current Series) Original Data Value, Series Id: CUUR0000SEEB01, Not Seasonally Adjusted, Series Title: College tuition and fees in U.S. city average, all urban consumers, not seasonally adjusted, Area: U.S. city average, Item: College tuition and fees, Base Period: 1982-84=100, Years: 1987 to 2018, https://data.bls.gov/pdq/SurveyOutputServlet.
2 Desrochers, Donna M. and Steven Hurlburt, American Institutes for Research, Delta Cost Project. Trends in College Spending: 2003-2013 – Where Does the Money Come From? Where Does It Go? What Does It Buy? January 2016. pp. 9. https://www.air.org/system/files/downloads/report/Delta-Cost-Trends-in-College%20Spending-January-2016.pdf.
* Former Head of U.S. Equities, S&P Dow Jones Indices.

8Indexology Spring 2019
100
120
140
160
180
200
220
240
Jan.
200
1
Jul.
2001
Jan.
200
2
Jul.
2002
Jan.
200
3
Jul.
2003
Jan.
200
4
Jul.
2004
Jan.
200
5
Jul.
2005
Jan.
200
6
Jul.
2006
Jan.
200
7
Jul.
2007
Jan.
200
8
Jul.
2008
Jan.
200
9
Jul.
2009
Jan.
201
0
Jul.
2010
Jan.
201
1
Jul.
2011
Jan.
201
2
Jul.
2012
Jan.
201
3
Jul.
2013
Jan.
201
4
Jul.
2014
Jan.
201
5
Jul.
2015
Jan.
201
6
Jul.
2016
Jan.
201
7
Jul.
2017
Jan.
201
8
Inde
x Le
vels
CPI-All Urban Consumers College Tuition and Fees in U.S. City Average
3 College Board. Trends in Higher Education Series: Trends in College Pricing 2017. https://trends.collegeboard.org/sites/default/files/2017-trends-in-college-pricing_0.pdf. October 2017. pp. 12.
4 CNBC. Here’s how much more expensive it is for you to go to college than it was for your parents. Martin, Emmie. https://www.cnbc.com/2017/11/29/how-much-college-tuition-has-increased-from-1988-to-2018.html. Nov. 29, 2017.
Exhibit 1: College Tuition Inflation Has Grown Faster Than General U.S. Inflation
Source: U.S. Bureau of Labor Statistics. Data from Jan. 1. 2001 to June 1. 2018. Chart is provided for illustrative purposes.
revenues and external revenues. The internal revenues are government appropriations for public universities, or the endowment returns for private universities. The external revenues come from college tuition. As noted in the Delta Cost Project, colleges and universities typically receive revenues to fund their educational mission from tuition, as well as state and local appropriations. They tend to receive income from endowments or investment returns.2 So understanding how college tuition varies depending on how the appropriations or the endowment returns behave is the key to constructing the S&P Target Tuition Inflation Index.
In the past three decades (adjusted to reflect 2017 U.S. dollars): – Private nonprofit four-year institutions increased tuition
129%, from USD 15,160 to USD 34,740 per year.
– Public four-year institutions increased tuition 213%, from USD 3,190 to USD 9,970 per year.3
A 1988 graduate of Harvard University would have spent USD 17,100 on tuition during their senior year. Now, they would have to pay USD 44,990 in tuition for their child to attend Harvard, a markup of 163%.4

9 S&P Dow Jones Indices
The Impact of Appropriations on Tuition
Generally, there is an inverse relationship between tuition increases and funding by appropriations and endowments. The health of the latter may be driven by investment performance, meaning that when the market declines, sometimes tuition goes up.
According to the Council for Advancement and Support of Education, “Endowments are managed for the long-term to strike a balance between the competing demands of funding current operations and preserving purchasing power to fund future operations…. However, endowments are not immune from market risks. During the Great Recession, endowments lost an average of 3.0 percent from 2007-08 and 18.7 percent from 2008-09.” 6
The Economics of Education Review also found that for every USD 1,000 cut from per-student state and local appropriations, the average student could be expected to pay USD 257 more per year in tuition and fees. Tuition increases, which can be traced to state budget cuts, have more than doubled since 1987 and remain at their highest level in the post-recession era. 7 These severe and sustained losses of public funding have contributed to the rapid increase in net tuition revenue seen since the recession.2
Understanding Tuition Inflation
We see tuition inflation as a function of general inflation (as measured by CPI), plus a spread. The spread is a flexible combination of short stocks, long corporate bonds, and cash, which is recalibrated based on stock
5 Student Loan Hero. A Look at the Shocking Student Loan Debt Statistics for 2018. https://studentloanhero.com/student-loan-debt-statistics/. May 1, 2018.6 Council for Advancement and Support of Education, American Council on Education, Association of American Universities, Association of Public and Land-grant Universities, National
Association of Independent Colleges and Universities, among others. Facts About College and University Endowments. January 2017.
There is about USD 620 billion more student loan debt than total U.S. credit card debt.5
The average student loan debt for 2017 graduates was USD 39,400, up 6% from the prior year.5
About 44 million borrowers owe a total of USD 1.48 trillion in student loan debt.5

10Indexology Spring 2019
market performance to account for the inverse relationship between endowment and appropriation performance and tuition inflation. Though endowments’ allocations to U.S. equities varied among those surveyed by the 2017 NACUBO-Commonfund Study of Endowments, and the U.S.-dollar-weighted average was 16%, the smaller endowments allocated over 40% to U.S. equities.8 The U.S. equity allocations were smaller in the largest plans, but allocations of up to 20% in alternative strategies—including long/short equity and 130/30—may also carry a significant amount of equity market risk. Given these relatively large exposures to equities, endowment (and appropriation) performance was largely driven by equity returns. So when the stock market declined, endowments and appropriations suffered, and tuition inflation
generally increased to cover the shortfall.
Putting It All into Practice
Suppose an investor has USD 3,500 today, enough to pay for 10% of tuition and fees at a private college that now costs nearly USD 35,000. A hypothetical investment into a fund tracking this index (excluding fees) should theoretically be able to keep pace with tuition inflation over a long period, so that in eight or more years, that investor may still pay for 10% of college. It may also be possible to mix this strategy with higher-growth investments for longer time periods in pursuit of extra gains with risky asset reduction as the college liability approaches—much in the same way inflation bonds are used in glide paths for retirement where retirees aim to preserve purchasing power for their retirement liabilities.
While traditional measures like return and standard deviation for risk may be important, perhaps the most meaningful metric is the shortfall risk—the risk of not having enough to pay for college tuition. The S&P Target Tuition Inflation Index has the potential to reduce that risk, and could reduce debt created by shortfalls.
To learn more about the index model development, methodology, and performance results, please read our paper of the same name, "Getting Smarter about Saving for College."9 n
7 Webber, Douglas A., Economics of Education Review, State divestment and tuition at public institutions, Volume 60, Oct. 2017. pp 1-4. SN - 0272-7757. https://doi.org/10.1016/j.econedurev.2017.07.007. https://www.sciencedirect.com/science/article/abs/pii/S0272775717303618.
8 National Association of College and University Business Officers. 2017 NACUBO-Commonfund Study of Endowments. http://products.nacubo.org/index.php/nacubo-research/2017-nacubo-commonfund-study-of-endowments.html.
9 Getting Smarter about Saving for College. https://us.spindices.com/documents/education/education-getting-smarter-about-saving-for-college-introducing-the-sp-target-tuition-inflation-index.pdf

What is carbon pricing— and why include it in investment decisions?Carbon emissions are costly to society in a variety of ways, from the healthcare costs of pollution impacts to the infrastructure damages of climate change. That’s why many governments are now charging companies for the carbon they emit. These governments are not only recouping costs, but also incentivizing companies to reduce their emissions for a safer, more sustainable world.
4 UK $25/tonne
Korea $21/tonne
EU $16/tonne
5
6
10 Beijing $9/tonne
Chile $5/tonne
Japan $3/tonne
11
12
2
1
3
Sweden $139/tonne
Switzerland $101/tonne
France $55/tonne
8
7
9
New Zealand $15/tonne
California $15/tonne
Ontario $15/tonne
1
3
7
1012
94
5
11
2
6
8
How much are companies currently paying around the world?Carbon pricing schemes are becoming increasingly prevalent at the regional, country, and city levels, with 51 carbon pricing initiatives already implemented or scheduled for implementation.
Source: World Bank Group, State and Trends of Carbon Pricing, 2018. Carbon prices for 12 (of 51) initiatives as of April 1, 2018.

12Charts and tables are provided for illustrative purposes. Past performance is no guarantee of future results. Indexology Spring 2019
How much could companies’ carbon payouts increase in the future, by sector?The impact of carbon pricing on companies can be estimated based on several factors, including how much carbon is emitted in different locations and projected carbon pricing in those locations. Companies can have very different exposures—even within the same sector—creating potential investment risks and opportunities.
How are we helping investors who seek to mitigate this risk?For the first time, the S&P Carbon Price Risk Adjusted Index Series allows investors to take into account future carbon price risk. Companies in the index series are weighted by their adjusted market capitalization after accounting for their estimated valuation-at-risk from future carbon pricing. The result is similar exposure to the underlying benchmark but with reduced carbon pricing risk.
Get the full story: spindices.com/indexology/esg/considering-the-risk-from-future-carbon-prices
Have questions? Contact: [email protected]
How could this impact the market?
$1.3 trillion may be at risk due to projected 2030 carbon costs across S&P 500-listed companies. This amounts to 5.6% of S&P 500 market capitalization.
Source: Trucost Corporate Carbon Pricing Tool, 2018 and S&P Carbon Price Risk Adjusted Indices Methodology.
While changes associated with a transition to a lower-carbon economy present significant risks, they also create significant opportunities.
Source: Recommendations of Task Force on Climate-Related Financial Disclosures, 2017.
Carbon Pricing Risk Exposure, 2030
Estimated increases in carbon prices across companies in the S&P 500® by 2030.
All S&P 500 companies
Source: Trucost Corporate Carbon Pricing Tool 2018 and S&P Dow Jones Indices. S&P 500 constituent data as of Dec. 2017 rebalance.
Average: $102 per tonne
Average: $78 per tonne
Average: $115 per tonne
$41 $42 $94$120 $105 $120
All S&P 500 technology companies
All S&P 500 utilities companies

13 S&P Dow Jones Indices
S&PDJI can ESG my way
indexology® ESG starts herespdji.com/indexology
Companies worldwide are making choices for the future like you are. They know ESG practices are good business. S&P Dow Jones Indices innovated early to capture this foundational shift by tapping Trucost® ESG Analysis and SAM for deep insights and data. Today, our index solutions provide innumerable ways to deploy leading-edge ESG strategies— from carbon effi ciency and renewable energy to corporate social responsibility and governance.
Copyright © 2018 S&P Dow Jones Indices LLC (“S&P DJI”). All rights reserved. S&P® and Indexology® are registered trademarks of Standard & Poor’s Financial Services LLC. Dow Jones® is a registered trademark of Dow Jones Trademark Holdings LLC. Trucost® is a registered trademark of S&P Trucost Limited. It is not possible to invest directly in an index. S&P DJI receives compensation for licensing its indices to third parties. S&P DJI does not make investment recommendations and does not endorse, sponsor, promote or sell any investment product or fund based on its indices. SAM, a unit of RobecoSAM AG, provides research and data for use with the S&P DJI ESG scores.

14Indexology Spring 2019
Talking SustainabilityThe Largest Pension Fund in the World Embraces ESG
EMILY: Why is ESG investing becoming so important to investors around the world, including the largest pension fund in the world, GPIF?
YOSHIYUKI: The impact of environmental, social, and governance issues can be seen in our daily lives—whether it’s rising sea levels or changes in corporate management, society can no longer look the other way. Investors are now starting to take these serious risks into consideration in their valuation models.
In the 2017 ESG Report produced by GPIF, Mr. Takahashi, President of GPIF is quoted as saying, “GPIF believes that it is vital to minimize negative externalities by integrating ESG factors in the investment process, in addition to improving the governance of investee companies, to ensure its portfolio’s investment returns over the long term.”
We have seen this proactive approach to incorporating ESG from asset owners around the world, and it’s exciting to see GPIF leading the way here in Japan.
EMILY: How did GPIF decide to use a passive approach to ESG investing, and more specifically, what made them decide to work with S&P DJI?
YOSHIYUKI: Since 2015 when GPIF became a signatory of the Principles of Responsible Investment (PRI), GPIF has exemplified commitment to developing and heightening awareness surrounding ESG strategies. By using a rules-based index approach, they remain transparent in their investment philosophy. This helps investee companies understand why they may or may not be weighted favorably in the index construction. Contrast this approach with an active investment strategy conducted in a black box—in these cases, companies aren’t privy to the metrics being used to evaluate their ESG status, so they don’t necessarily know how to change their business for the better.
One of the key factors that led GPIF to invest in the S&P Carbon Efficient Indices is that S&P DJI offered full transparency into its methodology and the underlying quantitative environmental data from Trucost,
Yoshiyuki MakinoHead of Tokyo OfficeS&P Dow Jones Indices
Ryan ChristiansonSenior Analyst ESG and StrategyS&P Dow Jones Indices
Emily Wellikoff, Indexology Magazine Editor-in-Chief, recently talked with Yoshiyuki Makino, Head of Tokyo Office at S&P DJI, and Ryan Christianson, Senior Analyst, ESG and Strategy Indices at S&P DJI, to discuss the implications of GPIF choosing S&P DJI carbon indices as benchmarks for their sustainability-conscious investment strategy.
S&PDJI can ESG my way
indexology® ESG starts herespdji.com/indexology
Companies worldwide are making choices for the future like you are. They know ESG practices are good business. S&P Dow Jones Indices innovated early to capture this foundational shift by tapping Trucost® ESG Analysis and SAM for deep insights and data. Today, our index solutions provide innumerable ways to deploy leading-edge ESG strategies— from carbon effi ciency and renewable energy to corporate social responsibility and governance.
Copyright © 2018 S&P Dow Jones Indices LLC (“S&P DJI”). All rights reserved. S&P® and Indexology® are registered trademarks of Standard & Poor’s Financial Services LLC. Dow Jones® is a registered trademark of Dow Jones Trademark Holdings LLC. Trucost® is a registered trademark of S&P Trucost Limited. It is not possible to invest directly in an index. S&P DJI receives compensation for licensing its indices to third parties. S&P DJI does not make investment recommendations and does not endorse, sponsor, promote or sell any investment product or fund based on its indices. SAM, a unit of RobecoSAM AG, provides research and data for use with the S&P DJI ESG scores.

15 S&P Dow Jones Indices
a part of S&P Global. Benefiting from the combination of Trucost’s extensive environmental data expertise and S&P DJI’s independent and transparent index investment solutions, GPIF felt these indices would help achieve their goal of encouraging corporations to actively seek solutions to environmental issues.
EMILY: How does the low-carbon approach taken here differ from that of other environmental indices out there?
RYAN: This index is different in that it incorporates the S&P Carbon Global Standard, which was developed to create a universal way of measuring a company’s GHG emissions relative to others in its industry group
around the world. Based on the S&P Global LargeMidCap universe of approximately 3000 stocks, the standard removes any inherent biases that may apply to certain industry groups with high emissions, such as utilities and materials, and makes it a level playing field for each company within its industry group.
Another major difference setting this index apart is that it’s inclusive rather than exclusive, and does not conduct negative screening. In other words, the index doesn’t “punish” stocks by making them ineligible for the index, but instead is designed to provide additional weight to companies that are more carbon-efficient in comparison to their peers around the world.
EMILY: How did you obtain the carbon data, and is it quantitative or qualitative?
RYAN: The Trucost environmental data used in the index is strictly quantitative, which is another differentiating feature. As opposed to other market indices that use relative ESG scores based on analyst research, these indices use data showing the amount of greenhouse gas (GHG) emitted per company. S&P DJI and Trucost take into account not only a company’s direct emissions, but also its direct suppliers’ purchased energy and emissions.
Tune in to find out why S&P DJI is the most-watched company on Asset TV at www.assettv.com/channel/sp-dow-jones-indices

16Indexology Spring 2019
EMILY: To what extent have these indices reduced exposure to carbon risks compared to their benchmarks?
RYAN: In comparison to their benchmarks, the carbon reduction is approximately 38% for the S&P Global Ex-Japan LargeMidCap Carbon Efficient Index and 29% for the S&P/JPX Carbon Efficient Index (as of September 2018). This difference in carbon reduction between the two indices is to be expected, as the dispersion of carbon emissions within each of the industry groups is bigger in the global index strategy. The greater dispersion increases the impact to overall portfolio carbon reduction.
EMILY: How has environmentally conscious investing affected returns historically?
RYAN: We are excited to see how this trend will affect returns, and as corporate responsibility becomes more integrated in financial valuation models, we may begin to see more outperformance from these “E”-focused strategies.
We have seen relative outperformance from the S&P/TOPIX 150 Carbon Efficient Index, which launched in 2011. While this index, created in collaboration with the Tokyo Stock Exchange, has a slightly different methodology from the aforementioned version that GPIF invested in, it maintains the same objective of tracking the performance of the parent index while reducing the carbon footprint. The 1-, 3-, 5-, and 10-year annualized returns all show over 50 basis points of outperformance versus the parent index. 1
EMILY: What impact do you think GPIF’s prioritization of ESG could have in Japan and around the world?
YOSHIYUKI: From discussions we have had with asset managers and other financial institutions in Japan, it is clear that GPIF’s investment is prompting many firms to shift their focus towards evaluating ESG and sustainable development goals (SDG)-related investment strategies. And the level of ESG sophistication is
growing among financial institutions. As investment teams become familiarized with the intricacies and implications of the underlying ESG data, it may be only a matter of time before certain areas of ESG become key factors when evaluating an investment strategy.
EMILY: Are there any new launches on the horizon for the index series? And beyond this index series, what’s next in ESG for S&P DJI?
RYAN: Besides the two indices that have been selected by GPIF, there are 14 more indices within the S&P Carbon Efficient index family that follow the same methodology, including the S&P 500 Carbon Efficient Index and the S&P Europe 350 Carbon Efficient Index. In addition to the S&P Carbon Efficient Index Series, S&P DJI has made a significant commitment to developing a variety of ESG indices, such as the S&P Green Bond Indices, S&P Carbon Price Risk Index Series, and the S&P 500 ESG Index.
It is important to note that we do not consider the S&P Carbon Efficient Index series to be the best solution for all asset owners/asset managers. It is one of many ways to create an indexed ESG investment strategy, and what may fulfill the objectives for one asset owner may not always be the best fit for another. S&P DJI’s ESG team is equipped with the tools and capabilities to have these discussions with members of the financial community, and to propose the most appropriate strategy for each respective client. n
“One of the key factors that led GPIF to invest in the S&P Carbon Efficient Indices is that S&P DJI offered full transparency into its methodology and the underlying quantitative environmental data from Trucost, a part of S&P Global.
“
1 As of November 2018.

17 S&P Dow Jones Indices
Tianyin ChengDirector Stategy and ESG Indices S&P Dow Jones Indices
Berlinda LiuSenior DirectorGlobal Research & Design S&P Dow Jones Indices
Vinit SrivastavaManaging Director Head of Strategy & ESG Indices S&P Dow Jones Indices
(1) asset class returns are generally proportional to the risk taken,
(2) a diversified portfolio of relatively uncorrelated assets may reduce risk without foregoing return, and
(3) different economic cycles expose different asset classes to different levels of risk.
By balancing risk contribution from a mix of assets and applying leverage to the overall portfolio, these strategies may help to meet the dual challenges of achieving higher returns and reducing risk in a diversified portfolio. Once the first risk parity fund—Bridgewater’s All Weather fund—launched in 1996, many investment companies began offering risk parity funds to their clients, especially in the aftermath of the 2008 global financial crisis. However, for many years there was no appropriate benchmark for these strategies, and most investors used a traditional 60/40 mix to fill that void. The problem is that most of the time, these benchmarks don’t
reflect the construction or risk/return expectations of risk parity strategies. The S&P Risk Parity Indices were designed with this in mind, with the goal of offering investors an appropriate benchmark that’s also an investable, passive alternative to active risk parity approaches.
What’s Inside the S&P Risk Parity Indices and How do They Work?
A wide range of assets can be used in these strategies—including equities, fixed income, currency, commodities, real estate, and hedge funds. However, the S&P Risk Parity Indices’ exposure is limited to futures contracts (as shown in Exhibit 1) representing the three asset classes generally considered to be the most liquid: equity, fixed income, and commodities.
To measure risk, we use long-term realized volatility. The lookback window has a minimum five-year history at the beginning of our back-
What Does It Really Mean to be Diversified?
While investors often turn to them for portfolio diversification, traditional asset allocation approaches—such as the classic 60/40 equity/bond blend—can lead to a disproportionate allocation of risk across asset classes, with equities accounting for most of the risk. So what does it really mean to be diversified? Risk parity strategies seek to answer this question by acknowledging that:

18Indexology Spring 2019
test period and is capped at 15 years as we accumulate more data. We use realized volatility to avoid dependence on volatility forecasting models. With the goal of having each asset class contribute a similar amount of volatility, we calculate the position weight of each asset class as the predefined target volatility divided by its long-term realized volatility.
Due to the correlation among asset classes, the realized volatility of the risk parity portfolio would usually be lower than the target volatility. To achieve the target volatility, we apply a leverage factor. This approach avoids estimating the variance-covariance matrix, while addressing the correlation effects.
Within each asset class, we then combine the futures contracts using the above approach to ensure equal risk contribution from each of the futures to their asset class. We repeat this process each month and rebalance to the new weights.
What’s the Rationale Behind the Methodology?
The S&P Risk Parity Indices (which are available in versions targeting various risk levels) seek out a balanced risk exposure across asset classes and across time for each asset, as well as a dynamic leverage based on cross-asset correlation. A balanced risk exposure across asset classes helps to achieve a minimum-variance portfolio when the assets are uncorrelated. A balanced risk exposure across time for each asset may take advantage of the negative relationship between volatility and return, as well as the persistence of volatility. When realized volatility is high, the future volatility tends to be high as well; and when future volatility is high, the expected futures return tends be low. For that reason, the dynamic exposure adjustment to a volatility target has the potential to add value over time.
Finally, a dynamic leverage based on cross-asset correlation helps to
Risk ParityThe concept of risk parity is widely applied, but unsurprisingly, there are variations in the ways these strategies are implemented. Differences arise from the asset classes (and the instruments) chosen, the risk measurement used, and how the assets’ risk contribution to the portfolio is handled.
Exhibit 1: Constituents of the S&P Risk Parity Indices
Equity Fixed Income Commodities
S&P 500®
Euro Stoxx 50Nikkei 225 Futures
U.S. T-Notes (5-year)U.S. T-Notes (10-year)U.S. T-Bonds (30-year)Long GiltEuro-BundEuro-BoblJGB (10-year)
Natural GasHeating Oil #2Gas OilCrude OilBrent CrudeGasolineSugar #11Live CattleCoffee “C”Cotton #2SoybeansCorn
Source: S&P Dow Jones Indices LLC. Data as of July 2018. Table is provided for illustrative purposes.

19 S&P Dow Jones Indices
manage overall portfolio risk. Cross-asset correlation is proportional to levels of macro volatility and shows cyclical behavior. A high level of correlation usually points to a common source of risk for asset prices. When correlation increases across asset classes, the portfolio volatility increases if everything else remains equal. Whenever this happens, it is common that risk and portfolio managers respond by reducing leverage and liquidating assets. Put more simply, leverage is a function of the correlation between asset classes—when correlation is low, overall portfolio risk is reduced
and there is an opportunity to leverage up to the target. In times of stress, when correlations are high, such leverage is marginal, as overall portfolio risk isn’t affected much by correlation effects.
How do the Indices Perform in Different Economic Regimes?
Historically, the S&P Risk Parity Indices have delivered smoother performance and reduced drawdowns over the long run than a 60/40 portfolio. However, they have not outperformed the 60/40 portfolio in every environment.
When inflation has risen, risk parity strategies have tended to outperform, benefiting from a material allocation to a broad basket of commodities. Risk parity strategies have also historically outperformed during equity bear markets, given the strategies’ higher allocation to reserve assets like treasury and gold—considered flight-to-safety assets. In equity bull markets, though, equities tended to be the best-performing asset on a risk-adjusted basis, so risk parity strategies would have a tough time outperforming the 60/40 portfolio, given the lower allocation to equities.
Exhibit 2: S&P Risk Parity Indices in Different U.S. Business Cycles
Economic Regime S&P Risk Parity Index – 10% Tv
S&P Risk Parity Index – 12% Tv
S&P Risk Parity Index – 15% Tv
Equity/Bond Portfolio 60/40
Average monthly returns (%)
Expansion 0.92 1.07 1.30 0.99
Slowdown 0.83 0.98 1.23 0.46
Contraction 0.77 0.91 1.13 0.35
Recovery 0.35 0.40 0.49 0.51
Difference between Average Monthly Returns of S&P Risk Parity Indices and 60/40 Portfolio (two-sample t-stats and significance level)
Expansion -0.38 0.38 1.31 -
Slowdown 1.55 1.98** 2.50** -
Contraction 1.85* 2.30** 2.85*** -
Recovery -0.46 -0.28 -0.05 -
The 60/40 equity/bond portfolio is a hypothetical portfolio.Source: S&P Dow Jones Indices LLC. Data as of May 31, 2018. Index performance based on monthly total return in USD. Past performance is no guarantee of future results. Table is provided for illustrative purposes and reflects hypothetical historical performance. Please see the Performance Disclosure at the end of this document for more information regarding the inherent limitations associated with back-tested performance. *** Significant difference at 0.01 level** Significant difference at 0.05 level* Significant difference at 0.10 level

20Indexology Spring 2019
To study how the indices performed during different types of business cycles, we broke down U.S. business cycles into four regimes—expansion, slowdown, contraction, and recovery.1 Exhibit 2 shows how the S&P Risk Parity Indices performed on average during the business cycles. We can see that the S&P Risk Parity Indices, regardless of the volatility targets, significantly outperformed the hypothetical 60/40 portfolio in the slowdown and contraction phases, while they underperformed in the expansion and recovery phases.
The S&P Risk Parity Indices’ performance was best in the contraction phase and worst in the recovery phase. During the contraction phase, the S&P Risk Parity Indices significantly outperformed the 60/40 portfolio by 1.85% to 2.85% a month, depending on the volatility target in the period studied. During the recovery phase, they underperformed by 5 to 46 bps a month. However, from a statistical point of view, the performance difference was not significant, even at a 0.1 level.
It’s also worth noting that the S&P Risk Parity Indices delivered reduced downside compared with the traditional 60/40 portfolio during almost every major market shock event since the end of 2003, especially during the global financial crisis, the Europe/Greece debt crisis in 2010, and the downgrade of U.S. debt in 2011. Note that these events include equity and bond market shocks. During the two oil price shocks in 2008 and 2014-2016, the S&P Risk Parity Index – 10% TV reduced downside compared with the 60/40 portfolio.
1 See “Introducing the S&P Risk Parity Indices” for details on how we construct these regimes. http://spindices.com/documents/education/education-introducing-the-sp-risk-parity-indices.pdf

21 S&P Dow Jones Indices
Can the Indices Help Protect Against Inflation?
One of the key potential benefits of the risk parity strategies is the historical inflation hedge that they have provided. To illustrate this, we studied the relationship between the indices’ monthly returns and inflation rates2 compared with the traditional 60/40 portfolio. Exhibit 3 shows that over the 14-year testing period, the S&P Risk Parity Indices with 10%, 12%, and 15% target volatility outperformed the 60/40 portfolio by a monthly average of 45 bps, 39 bps,
and 31 bps, respectively, in the high-inflation months (1st quintile). They underperformed the 60/40 portfolio in the low-inflation months (5th quintile) by 42 bps, 29 bps, and 9 bps, respectively.
Which Asset Classes Contributed the Most to Returns?
Exhibit 4 shows the historical annual return contributed by the equity, fixed income, and commodities asset classes to the S&P Risk Parity Index – 10% TV.
Unsurprisingly, fixed income contributed the highest return to the overall portfolio over the full period. Since low-volatility assets tend to be overweighted in risk parity strategies, we expected them to generate more return in the portfolio.
The return attribution of the three asset classes varied significantly from year to year, due to changes in the performance of individual asset classes, correlation between asset classes, and overall portfolio performance. In 2008, equity and commodities experienced market
-1.00%
-0.50%
0.00%
0.50%
1.00%
1.50%
2.00%
S&P Risk ParityIndex - 10% TV
S&P Risk ParityIndex - 12% TV
S&P Risk ParityIndex - 15% TV
60/40 Equity/bondPortfolio
Ret
urn
1st Quintile(3.3%, 5.5%]
2nd Quintile(2.3%, 3.3%]
3rd Quintile(1.7%, 2.3%]
4th Quintile(1.1%, 1.7%]
5th Quintile(-2.0%, 1.1%]
Source: S&P Dow Jones Indices LLC and U.S. Bureau of Labor Statistics. Data from Dec. 31, 2003 to May 31, 2018. Index performance based on monthly total return in USD. Past performance is no guarantee of future results. Table is provided for illustrative purposes and reflects hypothetical historical performance. Please see the Performance Disclosure at the end of this document for more information regarding the inherent limitations associated with back-tested performance.
Exhibit 3: Average Monthly Return of the S&P Risk Parity Indices Versus the 60/40 Portfolio During Different Inflation Periods
2 Inflation was measured by year-over-year changes in the U.S. Consumer Price Index (Consumer Price Index for All Urban Consumers: All Items, Index 1982-1984=100, Monthly, Seasonally Adjusted, Source: U.S. Bureau of Labor Statistics). The monthly inflation rate was ranked from high to low for the period from January 2003 to May 2018, and divided into five quintiles. This analysis was performed from the hypothetical point of view of investors based in the U.S. or having exposure to U.S. inflation in their portfolios.

22Indexology Spring 2019
Annual Return (%) Equity Fixed Income Commodities
Mean 2.01 3.28 1.15
Median 2.47 2.62 0.93
Maximum 8.91 13.29 9.47
Minimum -20.94 -3.64 -11.70
Full Period (January 2004 to May 2018)
1.97 3.39 1.10
Source: S&P Dow Jones Indices LLC. Data as of May 31, 2018. Past performance is no guarantee of future results. Table and chart are provided for illustrative purposes and reflect hypothetical historical performance. Please see the Performance Disclosure at the end of this document for more information regarding the inherent limitations associated with back-tested performance.
Exhibit 10: Annual Weighted Return by Asset Class for the S&P Risk Parity Index – 10% TV
-40
-30
-20
-10
0
10
20
30
2004 2005 2006 2007 2008 2009 2010 2011 2012 2013 2014 2015 2016 2017YTD2018
Ann
ual W
eigh
ted
Ret
urn
(%)
Equity Fixed Income Commodities
Exhibit 4: Annual Weighted Return by Asset Class for the S&P Risk Parity Index – 10% TV
drawdowns and only fixed income had a positive return. The overall portfolio posted a loss. The return attribution in 2008 clearly showed the diversification benefit from adding a fixed income instrument through its negative correlation with equity and commodity returns.
Risk parity, at its core, is an argument about the importance of diversification—across time and asset classes. The S&P Risk Parity Index Series uses a transparent, rules-based methodology to construct risk parity benchmarks
that are easy to understand and replicate. While risk parity strategies have not outperformed a traditional 60/40 portfolio in all economic environments, they may provide a potentially smoother path of returns thanks to their inherent risk diversification. Benefiting from a material allocation to a broad basket of commodities, these indices also have the potential to offer a hedge to inflation that cannot be found in a 60/40 portfolio. n

23 S&P Dow Jones Indices
Each rider’s particular talents are important in determining the stages to which their style of racing is best suited. However, not all talents are rewarded equally; the yellow jersey is typically captured by a rider who excels in the mountainous stages. This is because, generally speaking, there is a greater degree of variation in completion times in the mountain stages than the sprint stages. Since the overall winner is based on the total time, outperformance in the mountain stages is more valuable than outperformance on the flats, even though there are more of the latter. Said differently, the greater dispersion in riders‘ times during the mountain stages mean the rewards for outperformance are higher compared to stages when
everyone sprints at similar speeds to a bunched finish.
The relative value of sprinting and mountain-climbing in the Tour de France has analogies in financial markets. Over time, investors will encounter calm, smooth gains in some periods, and more challenging, volatile returns in others. Extending the analogy further, just as performance in the mountainous stages often determines the yellow jersey, the performance of equity portfolios during the most volatile periods goes a long way in determining long-term returns, because there are typically greater differences between the relative winners and losers during periods of elevated volatility.1
How Low Volatility Could Make You “King of the Mountains”
Hamish PrestonAssociate Director Global Research & Design S&P Dow Jones Indices
The world’s most prestigious cycling race, the Tour de France, lasts three weeks and comprises a series of one-day stages. Although the main prize—the yellow jersey—is awarded to the rider who takes the minimum amount of time to complete the entire tour, there are plenty of races (and prizes) up for grabs along the way. Some cyclists aim to prove themselves to be the best sprinter, while others hope to wear the polka-dot jersey awarded to the “King of the Mountains” – the fastest cyclist over the tour’s stages in the Alps, Pyrenees, and the Massif Central.

24Indexology Spring 2019
Low volatility indices have tended to underperform in less volatile, rising markets and outperform in more volatile, falling markets, historically. The table above summarizes this empirically through the monthly “capture ratios” for a number of our low volatility indices. Each monthly downside capture ratio is less than one, meaning the low volatility indices were typically better insulated in months when their
benchmark fell. The higher upside capture ratios indicate that the low volatility indices stayed closer to the pack when the benchmark rose.
Just as the race for King of the Mountains is a key determinant of who takes home the yellow jersey, the pattern of upside participation and downside protection offered by low volatility indices can help to explain how many of them have recorded
market-beating performance in the longer term, historically. Low volatility may in fact offer a way to avoid a crowded finish. n
Exhibit 1: Low Volatility Indices Have Provided Downside Protection and Upside Participation
Index Upside Capture (Monthly)
Downside Capture (Monthly)
S&P 500 Low Volatility Index 0.72 0.46
S&P Europe 350 Low Volatility Index 0.93 0.61
S&P Korea Low Volatility Index 0.87 0.58
S&P Pan Asia Low Volatility Index 0.74 0.51
S&P South Africa Low Volatility Index 0.84 0.46
S&P/ASX 200 Low Volatility Index 0.84 0.63
S&P/TSX Composite Low Volatility Index 0.71 0.31
S&P Mid Cap 400 Low Volatility Index 0.74 0.51
S&P SmallCap 600 Low Volatility Index 0.81 0.61
S&P Japan 500 Low Volatility Index 0.69 0.52
S&P BMI Emerging Markets Low Volatility Index 0.73 0.56
Source: “Low Volatility: A Practitioner’s Guide”; Edwards, Lazzara & Preston (2018), S&P Dow Jones Indices LLC. Data based on monthly total returns from January 2001 to April 2018. Past performance is no guarantee of future results. Table is provided for illustrative purposes and reflects hypothetical historical performance.
1 Dispersion: Measuring Market Opportunity. Edwards, Lazzara. December 2013. https://www.spindices.com/documents/research/research-dispersion-measuring-market-opportunity.pdf.
25 S&P Dow Jones Indices
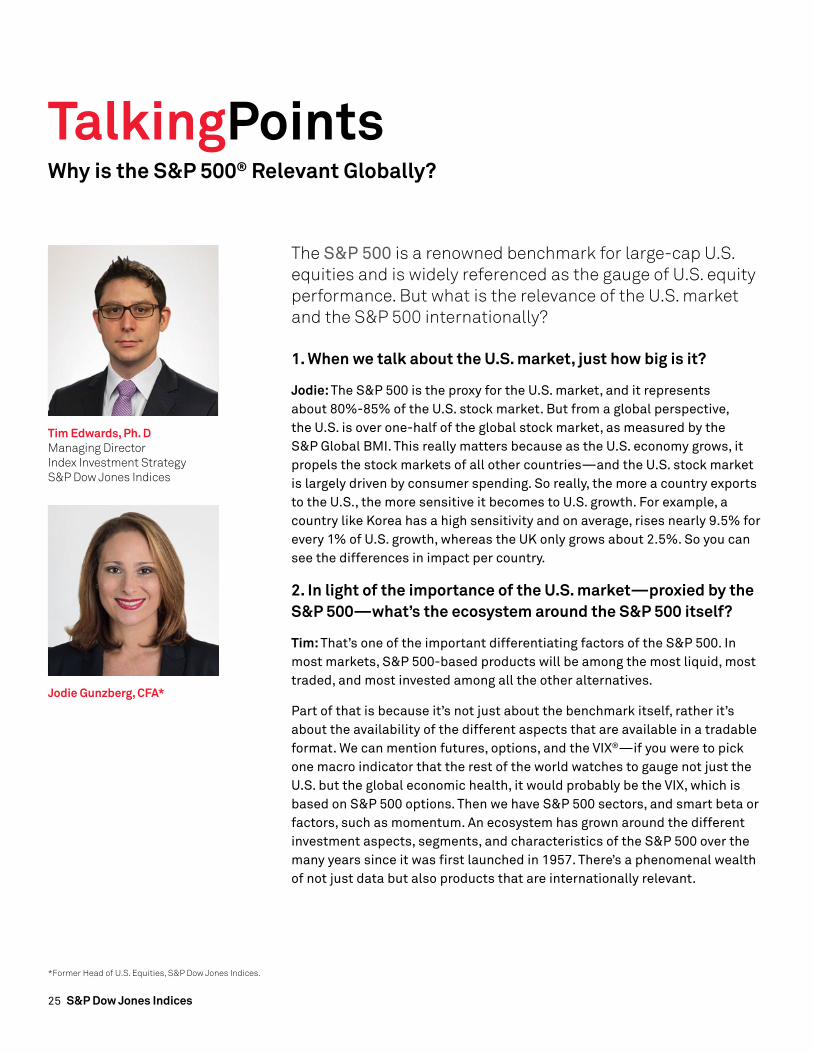
The S&P 500 is a renowned benchmark for large-cap U.S. equities and is widely referenced as the gauge of U.S. equity performance. But what is the relevance of the U.S. market and the S&P 500 internationally?
1. When we talk about the U.S. market, just how big is it?
Jodie: The S&P 500 is the proxy for the U.S. market, and it represents about 80%-85% of the U.S. stock market. But from a global perspective, the U.S. is over one-half of the global stock market, as measured by the S&P Global BMI. This really matters because as the U.S. economy grows, it propels the stock markets of all other countries—and the U.S. stock market is largely driven by consumer spending. So really, the more a country exports to the U.S., the more sensitive it becomes to U.S. growth. For example, a country like Korea has a high sensitivity and on average, rises nearly 9.5% for every 1% of U.S. growth, whereas the UK only grows about 2.5%. So you can see the differences in impact per country.
2. In light of the importance of the U.S. market—proxied by the S&P 500—what’s the ecosystem around the S&P 500 itself?
Tim: That’s one of the important differentiating factors of the S&P 500. In most markets, S&P 500-based products will be among the most liquid, most traded, and most invested among all the other alternatives.
Part of that is because it’s not just about the benchmark itself, rather it’s about the availability of the different aspects that are available in a tradable format. We can mention futures, options, and the VIX®—if you were to pick one macro indicator that the rest of the world watches to gauge not just the U.S. but the global economic health, it would probably be the VIX, which is based on S&P 500 options. Then we have S&P 500 sectors, and smart beta or factors, such as momentum. An ecosystem has grown around the different investment aspects, segments, and characteristics of the S&P 500 over the many years since it was first launched in 1957. There’s a phenomenal wealth of not just data but also products that are internationally relevant.
TalkingPointsWhy is the S&P 500® Relevant Globally?
Jodie Gunzberg, CFA*
Tim Edwards, Ph. DManaging DirectorIndex Investment StrategyS&P Dow Jones Indices
*Former Head of U.S. Equities, S&P Dow Jones Indices.

26Indexology Spring 2019To see the original interview watch: Understanding the Global Impact of the S&P 500
3. Given the analysis and ecosystem, how do people use those to express their views about the U.S. economy or the U.S. market?
Jodie: There’s been tremendous growth in the indexing industry. The Financial Times put out an article that said that there are nearly 3.2 million indices published every day, which trounces the number of stocks that are publicly available at 44,000. 1 Of those indices, 43% are sector-based, which is important because they give investors—whether they’re domestic or international—different ways to express their views through sectors. Different sectors in the U.S. have different levels of exposure to international revenues—for example, information technology has pretty high international revenues of about 60%, whereas real estate may only have 10%-15%. So whether an investor wants an exposure that’s very U.S.-centric or more global, measuring that with sensitivities to the U.S. dollar, interest rates, inflation, or U.S. growth—with upside potential from these factors—may help bolster an investment strategy.
Tim: At the risk of stating the obvious, here in the UK equity market, we can easily get exposures to the energy or financials sectors. However, if you want to get exposure to information technology in the UK, or in Europe more generally, it’s quite difficult. Many of the behemoths of the information technology sector and media industry are U.S.-based, and there are certain aspects of portfolio construction in terms of diversification that are almost impossible without reaching for the U.S. So naturally, there is international interest in not just the index itself, but in the different parts that could be used to diversify a domestic portfolio.
4. With the necessary biases that a domestic market has and therefore the relevance of U.S. market exposure plus the ecosystem, do you think this all feeds into why there’s so much research out there about the S&P 500, including the VIX and the index itself?
Tim: In a word, yes. I think that, as an index provider we are fortunate; as well as producing our own research, it’s often the case that if an academic researcher or a practitioner wishes to test a theory or examine a market dependency, the S&P 500 will often be used as either a benchmark or as the object of study in order to explore that. What that means for market participants is that there is a wide bank of research, commentary, and analysis that helps people understand what makes the S&P 500 tick.
Jodie: Again, the S&P 500 was launched in 1957, and at the time it represented the entire U.S. stock market. Today, it still represents about 85% of the U.S. stock market, and it serves as the foundation for much of the research available because it is used as the beta, and without beta, you don’t have any smart beta or any of the other developments that have occurred. So from the S&P 500, a number of different indices have been developed—such as equal weight, different sizes, styles, and other factors such as quality, momentum, value, ESG, and strategies that are well beyond what the original beta ever was. n
1 Financial Times "Number of stock indices at 3m dwarfs tally of quoted companies" https://www.ft.com/content/9ad80998-fed5-11e7-9650-9c0ad2d7c5b5

27 S&P Dow Jones Indices
There is only one original — the S&P/ASX 200 — Australia’s iconic, time-tested benchmark. By leaps and bounds, it’s the most widely used Australian index, and its trusted methodology continues to feed a growing appetite for S&P/ASX sector, factor, franking credit, and fi xed interest indices — the starting points for ETFs, managed funds, and derivatives. The past, present and future of Australian investing is all in one place.
S&PDJI can get the real deal
Copyright © 2018 S&P Dow Jones Indices LLC. All rights reserved. S&P® and Indexology® are registered trademarks of Standard & Poor’s Financial Services LLC. Dow Jones® is a registered trademark of Dow Jones Trademark Holdings LLC. It is not possible to invest directly in an index. S&P Dow Jones Indices receives compensation for licensing its indices to third parties. S&P Dow Jones Indices LLC does not make investment recommendations and does not endorse, sponsor, promote or sell any investment product or fund based on its indices.
indexology®always originalau.spdji.com/asx200

28Indexology Spring 2019
Historically, few corporations paid the top tax rate due to deductions, domicile, and incentives within the code; hence, an effective tax rate was typically substituted for the statutory tax rate in analysis and conversations. The Act removed many deductions and reprioritized corporate spending via credits, deductions, and schedules. Corporations reacted to the change quickly, taking advantage of the pre-2018 higher rates for costs in 2017 and adjusting purchases and expenditures to take advantage of the old and new polices.
Since the Act’s passage, there has been noise on the line for corporate income taxes, as Q4 2017 included accelerated payments to take advantage of the higher rate, with income deferred, along with orders covered by the new depreciation schedule. Additionally, 2018 included a repatriation tax, as well as additional pension payments that were permitted to be paid until
September 2018, but deducted at the old tax rate. A clear picture of the new tax structure and regulations may not exist yet, but the outline does, as does the ability to start to quantify the impact on corporate profits now and going forward. While November’s election may have potentially changed the scenery, lower corporate tax rates are here for now, and have been incorporated into estimates and share prices.
Using S&P 500 methodology-based operating earnings (you may not like some of our items, but they are consistent over sectors and issues, and are compatible over time), historical tax rates have been constructed. Lower tax rates have accelerated operating earnings growth, permitting 2018's 25%+ year-over-year earnings gains for the first three quarters, as margins set record levels.
For analysis, S&P DJI chose to use S&P 500 as-reported earnings, since
Nothing Is Certain but Death and Taxes—though Taxes Now Seem Less Deadly
Howard SilverblattIndex Investment Strategy Senior Industry Analyst S&P Dow Jones Indices
The Tax Cuts and Jobs Act of 2017 (“the Act”) changed the market landscape, as it reduced the top U.S. federal corporate tax rate from 35% to 21%, starting in 2018. U.S. corporate tax rates started at 1% in 1909 (until 1915, for income over USD 5,000), reached a statutory high of 53% (1942-1945), and have been at 35% since 1993 (the interim pre-max bracket was 38%).

29 S&P Dow Jones Indices
they are defined by the General Accepted Accounting Principles under the Financial Accounting Standard Board, which was designated in 1973 by the Securities and Exchange Commission to set standards for public companies. These earnings, similar to operating earnings, have also experienced a steep year-over-year increase for 2018 (20%+ for each quarter, even including the recent General Electric USD 22 billion charge, which reduced year-over-year Q3 2018 EPS by 6.6%) since taxes have been reduced.
An initial review of the S&P 500 income statements for the first three quarters of 2018 show a sharp drop in the income tax rate paid by corporations, even as corporations
continue to react to the Act. Specifically, the Q1, Q2 and Q3 2018 tax rates were 18.81%, 19.58% and 18.38%, respectively.
For Q3 2018, the S&P 500 tax rate shows a significant decline in the actual tax rate paid by S&P 500 companies compared to their Q3 2017 and Q3 2016 periods. With the exception of the Q4 2008 period, when as-reported income was negative (the only negative quarter in index history), Q1 through Q3 2018 had the lowest tax rates since at least 1993, and compare to the 1993-2017 25-year average quarterly tax rate of 32.42%
At this point, corporate policy is still being changed, and to some extent
(not yet quantified) tax rates reflect the short-term adjustments that take advantage of the Act. Additionally, specific sectors have (and have had) different rates, along with different government policies and incentives. However, at this moment the single clear point is the reduction of corporate income taxes paid, along with the strong double-digit gains in earnings. S&P DJI will continue to research and analyze the impact of the Act, as data become available. n

30Indexology Spring 2019
Exhibit 2: S&P 500 Index and Sector Q3 Tax Rates
S&P 500 Income Tax Rates Q3 2018 (%) Q3 2017 (%)
S&P 500 18.38 25.44
Communication Services 15.72 34.53
Consumer Discretionary 17.66 31.53
Consumer Staples 19.94 27.35
Energy 27.09 20.05
Financials 19.56 29.16
Health Care 16.91 21.57
Industrials 37.06 29.16
Information Technology 11.54 18.39
Materials 24.16 27.33
Real Estate 2.65 2.99
Utilities 16.30 29.93
Source: S&P Dow Jones Indices LLC. Data as of Jan. 31, 2019. Table is provided for illustrative purposes. Note: Communication Services was reorganized from Telecommunication Services on Sept. 24, 2018.
Exhibit 1: Overall S&P 500 Tax Rates
Month S&P 500 Tax Rate (%)
September 2018 18.38
June 2018 19.58
March 2018 18.81
December 2017 20.38
September 2017 25.44
June 2017 25.89
March 2017 25.44
December 2016 24.29
September 2016 26.93
June 2016 26.70
March 2016 27.89
Source: S&P Dow Jones Indices LLC. Data as of Jan. 31, 2019. Table is provided for illustrative purposes.

31 S&P Dow Jones Indices
S&PDJI can
Factors add new variables into the investing mix and require focused insight, robust data, and transparent methodologies. Investors count on S&P Dow Jones Indices as a market leader for all things factors, and to express their views with straightforward single-factor indices as well as the most complex multi-factor strategies.
weigh all the factors
indexology®rethink factorsspdji.com/indexology
Copyright © 2018 S&P Dow Jones Indices LLC. All rights reserved. S&P® and Indexology® are registered trademarks of Standard & Poor’s Financial Services LLC. Dow Jones® is a registered trademark of Dow Jones Trademark Holdings LLC. It is not possible to invest directly in an index. S&P Dow Jones Indices receives compensation for licensing its indices to third parties. S&P Dow Jones Indices LLC does not make investment recommendations and does not endorse, sponsor, promote or sell any investment product or fund based on its indices.

32Indexology Spring 2019
At the center of the partnership is the S&P/CLX Index Series. Many investors are familiar with the S&P/CLX IPSA, the highly regarded benchmark covering nearly 90% of Chile’s equity market. However, the index series extends well beyond this broad equity index to sector, strategy, and fixed income indices, providing a diverse set of tools for investors looking to access Chile’s evolving markets.
Ericka Alcantara, Associate Director at S&P DJI, recently sat down with Jaime Merino, Director, Fixed Income Indices, and Silvia Kitchener, Director, Global Equity Indices, Latin America, to discuss what's inside the S&P/CLX Index Series and possible next steps for Chilean market indices.
Ericka: First let’s delve into the S&P/CLX Equity Indices. How are they segmented, and what distinguishes each of them?
Silvia: Looking at the current S&P/CLX Equity Indices, the S&P/CLX IGPA is playing the most important role as the benchmark (see Exhibit 1). The subindices include the headline investable indices, as well as those tracking markets by size, sector, and strategy.
Each index has a specific objective, which is to measure a particular segment of the market. For example, the headline and strategy indices tend to be investable indices, designed to underlie financial products like mutual funds or ETFs. The S&P/CLX IGPA is the barometer of the Chilean equity market, with broad coverage of about 60 to 70 stocks covering nearly 90% of the equity market. While the S&P/CLX IGPA is representative of the market, it is not investable, which means that it cannot be replicated by an investor. That’s because it includes a number of stocks that don’t have much
Spotlight on the S&P/CLX Indices
Jaime MerinoDirector Fixed Income Indices S&P Dow Jones Indices
Silvia KitchenerDirector Global Equity Indices Latin America S&P Dow Jones Indices
Given Chile’s strong capital market program and stable government supporting the development of many types of investments, the partnership between S&P DJI and Bolsa de Santiago was put into motion to support the growth of this market. This partnership aims to bring international standards to existing indices, help develop new benchmarks that reflect crucial segments of the market, and most importantly, educate investors on new policies and practices being applied around the world.

33 S&P Dow Jones Indices
Dow Jones Sustainability Chile IndexTM
S&P/CLX Chile Dividend Index
Strategy Indices
S&P/CLX IPSA
S&P/CLX Chile 15 Index
S&P/CLX INTER-10
Headline Indices
S&P/CLX IGPA LargeCap
S&P/CLX IGPA MidCap
S&P/CLX IGPA SmallCap
Size Indices
S&P/CLX IGPA Consumer Discretionary
S&P/CLX IGPA Staples
S&P/CLX IGPA Energy
S&P/CLX IGPA Financials
S&P/CLX IGPA Health Care
S&P/CLX IGPA Information Technology
S&P/CLX IGPA Industrials
S&P/CLX IGPA Materials
S&P/CLX IGPA Real Estate
S&P/CLX IGPA Telecommunication Services
S&P/CLX IGPA Utilities
Sector Indices
Source: S&P Dow Jones Indices LLC. Data as of August 2018. Chart is provided for illustrative purposes.
Exhibit 1: S&P/CLX Equity Indices
liquidity, meaning they don’t trade often in the market. This is a problem if an investor wants to buy or sell the stock, because they can’t find shares to trade in a timely manner.
Ericka: There’s a relatively new index series for the Chilean market, the S&P/CLX Strategy Indices. Can you tell us a little about what these indices are designed to do?
Silvia: Strategy indices tend to track specific investment objectives. As you can see in Exhibit 1, currently we manage two of these indices in Chile, the Dow Jones Sustainability Chile Index™—the first ESG index launched in Chile—and the S&P/CLX Chile Dividend Index, created as a tool for income-seeking investors. These indices seek to measure the performance of companies that meet specific criteria, such as the most
sustainable companies in Chile as identified by SAM, or the companies that consistently pay dividends.
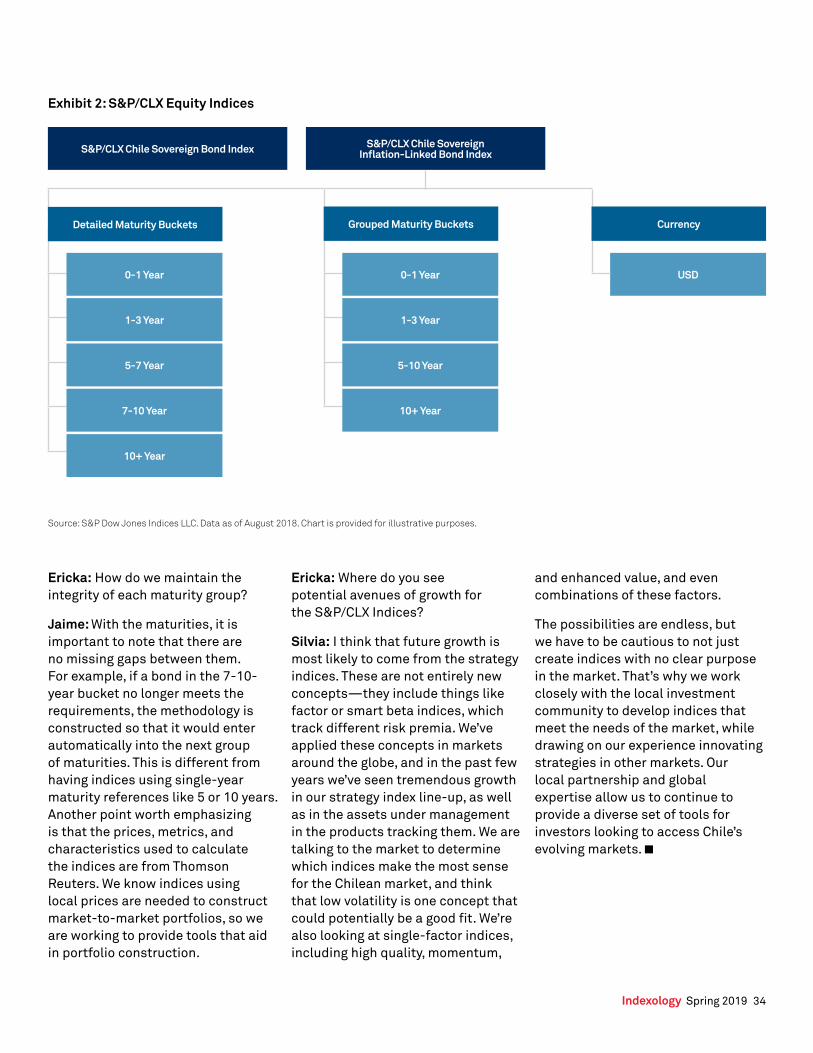
Ericka: Moving outside the equity space, what’s included in the S&P/CLX Fixed Income Indices, which seek to track bonds in the Chilean market? And what’s the rationale for issuing them in non-local currency, as well as splitting the indices by maturity?
Jaime: The S&P/CLX Fixed Income Indices include two large series of sovereign indices: nominal rate and real rate indices, known as the S&P Inflation-Linked Indices. As you can see in Exhibit 2, these indices are divided into long maturities and short maturities. Both sets of indices and the benchmark indices, which cover the entire nominal and real curve, are calculated in U.S. dollars.
It’s important to have indices in different currencies (in this case, U.S. dollars) so that they can be used locally and by international investors. The indices are split by maturities because the curve does not move the same way in the short term as it does in the long term. Accounting for these differences gives us benchmarks for asset managers who have short-, medium-, or long-term bond strategies. We wanted to develop a set of tools that could provide data to inform investors across geographies and across a range of strategies.
The indices can also serve as the basis for investment products, such as ETFs or index funds, since they are easy to replicate. This would lead to a more transparent and liquid way to tailor allocations to meet investment goals.
S&P/CLX IGPA
34Indexology Spring 2019
Source: S&P Dow Jones Indices LLC. Data as of August 2018. Chart is provided for illustrative purposes.
Exhibit 2: S&P/CLX Equity Indices
0-1 Year
1-3 Year
5-7 Year
7-10 Year
10+ Year
0-1 Year
1-3 Year
5-10 Year
10+ Year
USD
CurrencyDetailed Maturity Buckets Grouped Maturity Buckets
Ericka: How do we maintain the integrity of each maturity group?
Jaime: With the maturities, it is important to note that there are no missing gaps between them. For example, if a bond in the 7-10- year bucket no longer meets the requirements, the methodology is constructed so that it would enter automatically into the next group of maturities. This is different from having indices using single-year maturity references like 5 or 10 years. Another point worth emphasizing is that the prices, metrics, and characteristics used to calculate the indices are from Thomson Reuters. We know indices using local prices are needed to construct market-to-market portfolios, so we are working to provide tools that aid in portfolio construction.
Ericka: Where do you see potential avenues of growth for the S&P/CLX Indices?
Silvia: I think that future growth is most likely to come from the strategy indices. These are not entirely new concepts—they include things like factor or smart beta indices, which track different risk premia. We’ve applied these concepts in markets around the globe, and in the past few years we’ve seen tremendous growth in our strategy index line-up, as well as in the assets under management in the products tracking them. We are talking to the market to determine which indices make the most sense for the Chilean market, and think that low volatility is one concept that could potentially be a good fit. We’re also looking at single-factor indices, including high quality, momentum,
and enhanced value, and even combinations of these factors.
The possibilities are endless, but we have to be cautious to not just create indices with no clear purpose in the market. That’s why we work closely with the local investment community to develop indices that meet the needs of the market, while drawing on our experience innovating strategies in other markets. Our local partnership and global expertise allow us to continue to provide a diverse set of tools for investors looking to access Chile’s evolving markets. n
S&P/CLX Chile Sovereign Bond Index S&P/CLX Chile Sovereign Inflation-Linked Bond Index

35 S&P Dow Jones Indices
Global Index News Feed
U.S. & GLOBAL
S&P DJI’s latest Annual Survey of Assets showed that USD 13.7 trillion in total assets were indexed to S&P DJI indices.* Of that total, more than USD 8.9 trillion was tied to benchmarked assets, and USD 4.8 trillion was directly indexed via exchange-traded products and other investment vehicles.
S&P DJI acquired Kensho and launched the S&P Kensho New Economy Indices, the first and most comprehensive family of indices to capture the full breadth of companies driving the Fourth Industrial Revolution.
S&P DJI introduced the Communication Services sector to reflect the evolving media and telecommunications landscape. It combines the existing Telecommunication Services sector with parts of the Information Technology and Consumer Discretionary sectors.
The first U.S.-listed ETF, SPY, which tracks the S&P 500, celebrated its 25th anniversary.
The S&P 500 Equal Weight Index celebrated its 15th anniversary.
The DJSI (Dow Jones Sustainability Index) World celebrates its 20th anniversary in 2019, making it one of the longest-running sustainability benchmarks in the world.
S&P DJI launched the first index series that incorporates future carbon price risks, the S&P Carbon Price Risk Adjusted Index Series. The indices seek to measure the performance of companies in each respective underlying index with a weighting scheme based on estimated company market valuation at risk from predicted 2030 carbon prices.
S&P DJI launched the S&P 500 ESG Index, an innovative index that is aligned with Environmental, Social and Governance (ESG) selection guidelines and designed to closely replicate the risk and return profile of its iconic benchmark.
S&P DJI launched the S&P Risk Parity Indices, implementing a long-term target volatility multi-asset strategy.
S&P DJI won Index Admin and Benchmark Services Provider of the Year at the GlobalCapital Americas Derivatives Awards in 2018.
S&P DJI won Best Index Provider, North America at the Structured Retail Products Awards in 2018.
EUROPE, MIDDLE EAST, AND AFRICA
S&P DJI was named Best Index Provider by Mondo ETF in 2018.
S&P DJI won Best Index Provider at the Africa Global Funds Service Providers Awards 2018, for the third consecutive year.
S&P DJI was named Index Provider of the Year at the MENA Fund Manager Services Awards 2018.
S&P DJI won Best Islamic Index Provider at the Asset Triple A Islamic Finance Awards 2018.
S&P DJI won Best Islamic Index Provider at the Islamic Finance News Service Provider Awards 2018.
S&P DJI signed a co-operation agreement with Nigeria’s OTC Securities Exchange (FMDQ), which allows us to create and launch co-branded fixed income indices such as the S&P/FMDQ Fixed Income Indices, expanding our offerings in Africa.
* As of December 2017

36Indexology Spring 2019
LATIN AMERICA
The S&P/BMV IPC, one of the oldest and most esteemed measures of Mexican securities, celebrated its 40th anniversary.
Chile’s CLX indices were rebranded as S&P/CLX. The cobranded index series, which includes the flagship S&P/CLX IPSA, is now calculated, maintained, and distributed by S&P DJI.
S&P DJI signed a strategic agreement with the Argentine Stock Exchange (BYMA), which will allow us to manage our current indices as well as launch new ones in the South American country.
ASIA PACIFIC
The world’s largest pension fund, Government Pension Investment Fund for Japan (GPIF), selected the S&P/JPX Carbon Efficient Index and S&P Global Ex-Japan LargeMidCap Carbon Efficient Index to serve as benchmarks for their ESG business strategy.
In conjunction with the Taiwan Futures Exchange, S&P DJI launched the S&P/TAIFEX RMB Indices, the first index series to track listed renminbi (RMB) futures in Taiwan.
S&P DJI won Index Provider of the Year at the Structured Products Asia Awards 2018.
S&P DJI won Best ETF Index Provider at the Insurance Asia News Institutional Asset Management Awards 2018.
S&P DJI won Index Provider of the Year and ETF Index Provider of the Year at the Asia Asset Management Best of the Best Awards 2018.
S&P DJI won Best Index Provider, Asia and Best Index Provider for ETFs, Asia at the Asset Triple A Private Banking, Wealth Management, Investment and ETF Awards 2018.
S&P DJI hosted its 11th Annual Japan ETF Conference in Tokyo, which explored the evolution and continued growth of the Asia Pacific ETF landscape, as well as the latest innovations driving access to these markets.
Don't miss out on our latest research, education, and commentary.Register now to stay ahead of the index investing curve.go.spdji.com/SignUp

37 S&P Dow Jones Indices
Complimentary Events & WebinarsUpcoming
3rd Annual Insurance Investment Summit May 2 New York
FA Forum: Applying the Next Wave of Index-Based Strategies
May 7 Seattle
On-Demand
Playing Defense with Factor StrategiesExplore the potential defensive benefits that factors, such as low volatility, quality, and size, bring to the table vs. traditional large-cap solutions.
Achieving Sustainable Income in RetirementHear how industry experts are using rules-based methods to overcome traditional retirement planning and income uncertainty by mitigating sequence-of-returns and inflation risk.
There’s Nothing Equal about Equal-WeightingRediscover an approach that has outperformed its market-cap-weighted benchmark over the past 15 years and the surprising dynamics that have driven it.
Is Now the Time to Stack up Your Sectors?As financial advisors position clients' portfolios for 2019, join us to consider the role sectors can play.
Tap Into Liquidity with Fixed Income ETFsHow are ETFs resolving bond market illiquidity—and is the current toolkit sufficient for today’s markets and the next regulatory wave?
Emerging from Home Bias with Passive Investing Many advisors know their portfolios are over-weighted to their home country, but aren’t sure exactly which international exposures would best diversify client risks. Could an emerging market strategy be part of the solution?
To register for an upcoming event or watch a replay on-demand, visit spdji.com/events/sp-hosted/ indexology®
truly unique spdji.com/indexology
invest like a Dividend Aristocrat®S&PDJI can
Investors worldwide know that Dividend Aristocrats are companies in a class of their own. They offer potential for capital appreciation plus income — having consistently increased their dividends over many years. And, this exclusive collection of companies is accessible to all through investment funds and ETFs based on the global family of S&P Dividend Aristocrats® Indices.
Copyright © 2018 S&P Dow Jones Indices LLC. All rights reserved. S&P®, Dividend Aristocrats® and Indexology® are registered trademarks of Standard & Poor’s Financial Services LLC. Dow Jones® is a registered trademark of Dow Jones Trademark Holdings LLC. It is not possible to invest directly in an index. S&P Dow Jones Indices receives compensation for licensing its indices to third parties. S&P Dow Jones Indices LLC does not make investment recommendations and does not endorse, sponsor, promote or sell any investment product or fund based on its indices.

38Indexology Spring 2019
indexology® truly unique spdji.com/indexology
invest like a Dividend Aristocrat®S&PDJI can
Investors worldwide know that Dividend Aristocrats are companies in a class of their own. They offer potential for capital appreciation plus income — having consistently increased their dividends over many years. And, this exclusive collection of companies is accessible to all through investment funds and ETFs based on the global family of S&P Dividend Aristocrats® Indices.
Copyright © 2018 S&P Dow Jones Indices LLC. All rights reserved. S&P®, Dividend Aristocrats® and Indexology® are registered trademarks of Standard & Poor’s Financial Services LLC. Dow Jones® is a registered trademark of Dow Jones Trademark Holdings LLC. It is not possible to invest directly in an index. S&P Dow Jones Indices receives compensation for licensing its indices to third parties. S&P Dow Jones Indices LLC does not make investment recommendations and does not endorse, sponsor, promote or sell any investment product or fund based on its indices.

39 S&P Dow Jones Indices
Indexology® Top Blog Posts
Get the latest at indexologyblog.com
The Skew Is Not New Craig LazzaraHow can return skew help explain the persistent underperformance of active managers?
How Global is the S&P 500?Phillip BrzenkWhere are large-cap U.S. companies selling their goods and services?
Why is the GICS Telecommunication Sector Becoming the Communication Services SectorDavid BlitzerHow has the communications landscape changed?
Considering REIT Lease Durations in a Rising Rate EnvironmentJohn WellingHow have REITs historically fared over full cycles of rising rates?
Momentum's Minsky Moment?Tim EdwardsThe historical relative performance of momentum is cyclical – what does that mean for investors?
ESG Meets Behavioral Finance: Part 1Lauren Smart
How might insights from behavioral economics be used to revolutionize ESG investing?
3 Reasons to Love Equities When Rates Are RisingJodie GunzbergHow have rising rates historically affected equity performance?
There's Nothing Equal About Equal Weight ReturnsJodie GunzbergHow have equal-weight indices performed compared to their market-cap-weight counterparts?

40Indexology Spring 2019
Pop QuizThe S&P Risk Parity Indices’ performance was:
A. Best in the contraction phase and worst in the recovery phase
B. Best in the recovery phase and worst in the contraction phase
C. About the same in the recovery and contraction phases
The U.S. represents:
A. Over one-quarter of the global stock market
B. Over one-half of the global stock market
C. Over two-thirds of the global stock market
In 1909, U.S. corporate tax rates started at:
A. 1%
B. 5%
C. 10%
There is about ___ more student loan debt than total U.S. credit card debt.
A. USD 3 billion
B. USD 230 billion
C. USD 620 billion
The S&P Carbon Efficient Indices:
A. Exclude stocks that don’t meet carbon efficiency standards
B. Give extra weight to companies that are more carbon-efficient compared to their peers
The percentage of American workers who may need to change occupations by 2030 is:
A. 24%
B. 38%
C. 47%
Due to projected 2030 carbon costs across S&P 500-listed companies, ___ of S&P 500 market capitalization may be at risk.
A. 1.5%
B. 3.7%
C. 5.6%
A
B
C
A
B
C
A
B
C
A
B
C
A
B
C
A
B
C
A
B
The S&P Risk Parity Indices’ performance was:
A. Best in the contraction phase and worst in the recovery phase
The U.S. represents:
B. Over one-half of the global stock market
In 1909, U.S. corporate tax rates started at:
A. 1%
There is about ___ more student loan debt than total U.S. credit card debt.
C. USD 620 billion
The S&P Carbon Efficient Indices:
B. Give extra weight to companies that are more carbon-efficient compared to their peers
The percentage of American workers who may need to change occupations by 2030 is:
B. 38%
Due to projected 2030 carbon costs across S&P 500-listed companies, ___ of S&P 500 market capitalization may be at risk.
C. 5.6%

41 S&P Dow Jones Indices
Analyze Your Factor Portfolio DNA
With Factor Allocator™
Factor Allocator, an innovative web- based information tool, allows users to
analyze, build, deconstruct, and replicate simulated portfolios based
on S&P Factor Indices.
Visit factorallocator.com/spdji

42Indexology Spring 2019
SoundbitesSoundbites
The idea that research at the sector or country level is more valuable, followed by research on stock selection, is a powerful finding and supports a top-down approach to asset allocation.
Tim Edwards in the research paper, “The Value of Research: Skill, Capacity, and Opportunity”
It is important not to conflate the performance advantage of value over growth with the process of stock selection within a value universe. To do otherwise is to confuse style with selection.
Fei Mei Chan in her Indexology blog post, “Confusing Style and Selection”
As the world transitions to a low-carbon economy, organizations that have been proactive may be better positioned to adapt to new regulations, innovation, or a shift in consumer appetite.
Aye Soe in the research paper, “A Look Inside Green Bonds: Combining Sustainability With Core Fixed Income”
We estimate that the passive management industry, at its current scale, saves investors more than USD 20 billion annually in management fees alone, a benefit that accrues to institutional and retail investors alike.
Anu Ganti in the research paper, “The Slings and Arrows of Passive Fortune”
Market participants seem to believe active managers are better able to navigate more volatile markets. However, the data belies this belief: most active managers underperform regardless of market direction.
Hamish Preston in his Indexology blog post, "Volatility and Active Management"

PERFORMANCE DISCLOSURE
The S&P Risk Parity Index – 10% Target Volatility, S&P Risk Parity Index – 12% Target Volatility, and S&P Risk Parity Index – 15% Target Volatility were launched July 9, 2018. The S&P 500 Low Volatility Index was launched April 11, 2011. The S&P Europe 350 Low Volatility Index was launched July 9, 2012. The S&P Korea Low Volatility Index was launched May 8, 2013. The S&P South Africa Low Volatility Index was launched January 29, 2014. The S&P/ASX 200 Low Volatility Index was launched October 17, 2017. The S&P/TSX Composite Low Volatility Index was launched April 10, 2012. The S&P MidCap 400 Low Volatility Index and S&P SmallCap 600 Low Volatility Index were launched September 24, 2012. The S&P Japan 500 Low Volatility Index was launched June 8, 2015. The S&P BMI Emerging Markets Low Volatility Index was launched December 5, 2011. The S&P Pan Asia Low Volatility Index was launched November 19, 2012. All information presented prior to an index’s Launch Date is hypothetical (back-tested), not actual performance. The back-test calculations are based on the same methodology that was in effect on the index Launch Date. However, when creating back-tested history for periods of market anomalies or other periods that do not reflect the general current market environment, index methodology rules may be relaxed to capture a large enough universe of securities to simulate the target market the index is designed to measure or strategy the index is designed to capture. For example, market capitalization and liquidity thresholds may be reduced. Complete index methodology details are available at www.spdji.com. Past performance of the Index is not an indication of future results. Prospective application of the methodology used to construct the Index may not result in performance commensurate with the back-test returns shown.
S&P Dow Jones Indices defines various dates to assist our clients in providing transparency. The First Value Date is the first day for which there is a calculated value (either live or back-tested) for a given index. The Base Date is the date at which the Index is set at a fixed value for calculation purposes. The Launch Date designates the date upon which the values of an index are first considered live: index values provided for any date or time period prior to the index’s Launch Date are considered back-tested. S&P Dow Jones Indices defines the Launch Date as the date by which the values of an index are known to have been released to the public, for example via the company’s public website or its datafeed to external parties. For Dow Jones-branded indices introduced prior to May 31, 2013, the Launch Date (which prior to May 31, 2013, was termed “Date of introduction”) is set at a date upon which no further changes were permitted to be made to the index methodology, but that may have been prior to the Index’s public release date.
The back-test period does not necessarily correspond to the entire available history of the Index. Please refer to the methodology paper for the Index, available at www.spdji.com for more details about the index, including the manner in which it is rebalanced, the timing of such rebalancing, criteria for additions and deletions, as well as all index calculations.
Another limitation of using back-tested information is that the back-tested calculation is generally prepared with the benefit of hindsight. Back-tested information reflects the application of the index methodology and selection of index constituents in hindsight. No hypothetical record can completely account for the impact of financial risk in actual trading. For example, there are numerous factors related to the equities, fixed income, or commodities markets in general which cannot be, and have not been accounted for in the preparation of the index information set forth, all of which can affect actual performance.
The Index returns shown do not represent the results of actual trading of investable assets/securities. S&P Dow Jones Indices LLC maintains the Index and calculates the Index levels and performance shown or discussed, but does not manage actual assets. Index returns do not reflect payment of any sales charges or fees an investor may pay to purchase the securities underlying the Index or investment funds that are intended to track the performance of the Index. The imposition of these fees and charges would cause actual and back-tested performance of the securities/fund to be lower than the Index performance shown. As a simple example, if an index returned 10% on a US $100,000 investment for a 12-month period (or US $10,000) and an actual asset-based fee of 1.5% was imposed at the end of the period on the investment plus accrued interest (or US $1,650), the net return would be 8.35% (or US $8,350) for the year. Over a three year period, an annual 1.5% fee taken at year end with an assumed 10% return per year would result in a cumulative gross return of 33.10%, a total fee of US $5,375, and a cumulative net return of 27.2% (or US $27,200).
GENERAL DISCLAIMER
Copyright © 2019 by S&P Dow Jones Indices LLC. All rights reserved. Standard & Poor’s ®, S&P 500 ® and S&P ® are registered trademarks of Standard & Poor’s Financial Services LLC (“S&P”), a subsidiary of S&P Global. Dow Jones ® is a registered trademark of Dow Jones Trademark Holdings LLC (“Dow Jones”). Trademarks have been licensed to S&P Dow Jones Indices LLC. Redistribution, reproduction and/or photocopying in whole or in part are prohibited without written permission. This document does not constitute an offer of services in jurisdictions where S&P Dow Jones Indices LLC, Dow Jones, S&P or their respective affiliates (collectively “S&P Dow Jones Indices”) do not have the necessary licenses. All information provided by S&P Dow Jones Indices is impersonal and not tailored to the needs of any person, entity or group of persons. S&P Dow Jones Indices receives compensation in connection with licensing its indices to third parties. Past performance of an index is not a guarantee of future results.
It is not possible to invest directly in an index. Exposure to an asset class represented by an index is available through investable instruments based on that index. S&P Dow Jones Indices does not sponsor, endorse, sell, promote or manage any investment fund or other investment vehicle that is offered by third parties and that seeks to provide an investment return based on the performance of any index. S&P Dow Jones Indices makes no assurance that investment products based on the index will accurately track index performance or provide positive investment returns. S&P Dow Jones Indices LLC is not an investment advisor, and S&P Dow Jones Indices makes no representation regarding the advisability of investing in any such investment fund or other investment vehicle. A decision to invest in any such investment fund or other investment vehicle should not be made in reliance on any of the statements set forth in this document. Prospective investors are advised to make an investment in any such fund or other vehicle only after carefully considering the risks associated with investing in such funds, as detailed in an offering memorandum or similar document that is prepared by or on behalf of the issuer of the investment fund or other vehicle. Inclusion of a security within an index is not a recommendation by S&P Dow Jones Indices to buy, sell, or hold such security, nor is it considered to be investment advice.
These materials have been prepared solely for informational purposes based upon information generally available to the public and from sources believed to be reliable. No content contained in these materials (including index data, ratings, credit-related analyses and data, research, valuations, model, software or other application or output therefrom) or any part thereof (Content) may be modified, reverse-engineered, reproduced or distributed in any form or by any means, or stored in a database or retrieval system, without the prior written permission of S&P Dow Jones Indices. The Content shall not be used for any unlawful or unauthorized purposes. S&P Dow Jones Indices and its third-party data providers and licensors (collectively “S&P Dow Jones Indices Parties”) do not guarantee the accuracy, completeness, timeliness or availability of the Content. S&P Dow Jones Indices Parties are not responsible for any errors or omissions, regardless of the cause, for the results obtained from the use of the Content. THE CONTENT IS PROVIDED ON AN “AS IS” BASIS. S&P DOW JONES INDICES PARTIES DISCLAIM ANY AND ALL EXPRESS OR IMPLIED WARRANTIES, INCLUDING, BUT NOT LIMITED TO, ANY WARRANTIES OF MERCHANTABILITY OR FITNESS FOR A PARTICULAR PURPOSE OR USE, FREEDOM FROM BUGS, SOFTWARE ERRORS OR DEFECTS, THAT THE CONTENT’S FUNCTIONING WILL BE UNINTERRUPTED OR THAT THE CONTENT WILL OPERATE WITH ANY SOFTWARE OR HARDWARE CONFIGURATION. In no event shall S&P Dow Jones Indices Parties be liable to any party for any direct, indirect, incidental, exemplary, compensatory, punitive, special or consequential damages, costs, expenses, legal fees, or losses (including, without limitation, lost income or lost profits and opportunity costs) in connection with any use of the Content even if advised of the possibility of such damages.
S&P Dow Jones Indices keeps certain activities of its business units separate from each other in order to preserve the independence and objectivity of their respective activities. As a result, certain business units of S&P Dow Jones Indices may have information that is not available to other business units. S&P Dow Jones Indices has established policies and procedures to maintain the confidentiality of certain non-public information received in connection with each analytical process.
In addition, S&P Dow Jones Indices provides a wide range of services to, or relating to, many organizations, including issuers of securities, investment advisers, broker-dealers, investment banks, other financial institutions and financial intermediaries, and accordingly may receive fees or other economic benefits from those organizations, including organizations whose securities or services they may recommend, rate, include in model portfolios, evaluate or otherwise address.
Indexology StaffEmily Wellikoff Editor-in-Chief [email protected] Baggs Editor [email protected] Murdock Editor [email protected] Almeida Production Assistant [email protected]