Embed Size (px)
Citation preview

International Journal of Scientific & Engineering Research, Volume 7, Issue 10, October-2016 172 ISSN 2229-5518
IJSER © 2016 http://www.ijser.org
DYNAMIC ANALYSIS OF MINI TENSION LEG PLATFORMS UNDER RANDOM
WAVES Shibin P Shaji, Dr. Jayalekshmi R.
Abstract— Mini Tension Leg Platform (TLP) is a new generation TLP of relatively low cost, developed for the economic exploration and extraction of hydrocarbons from marginal deepwater oil fields. It can also be used as a utility, satellite, or early production platform for larger deepwater discoveries. The development of the mini TLP concept illustrates the advancement of offshore technology venturing into deeper water depths at not so exorbitant costs. The ease in fabrication and installation is another advantage of the mini TLP over the conventional TLP. These offshore structures should be able to withstand the dynamic effects of environmental loads during their lifetime. These loads range from temporary/transient loads induced by earthquakes and sea storms to continuous (or stationary) loads due to wind, waves, and sea currents, among others. To design and construct offshore structures, including floating ones, against various environmental loads, the response of structures to these loads should be understood. This paper deals with the detailed numerical investigations of the dynamic behaviour of a mini TLP under random waves. The numerical study has been carried out using the finite element software ANSYS AQWA using diffraction theory.
Index Terms— Airy’s waves, ANSYS AQWA, Dynamic Analysis, Mini Tension Leg Platform, Offshore structures, P-M Spectrum, Random Waves,
—————————— ——————————
1 Introduction
T
HE The development of minimal offshore fields in deep water locations in a hostile environment is currently being actively pursued to meet the increasing demand of oil and natural gas. For economic development of such fields new concept of platform construction and technologies of exploration, production and drilling are necessary. Tension leg platforms and Spar platforms are two such options. An objective in the development of mini TLP platform was to reduce platform cost to the extent that many development project could be economically justified by reserves proved up by a single well.
This new generation TLPs have favourable motion characteristics as those of TLPs but they do not require huge initial investment, working expenses, complexity of construction and relatively long project period associated with TLPs. Thus, the mini TLP combines the simplicity of a spar and favourable motion response features of a TLP. It is being pursued as a promising candidate among the various options used in constructing permanent production platforms for marginal deepwater resources.
In the present work, the dynamic analysis of a mini TLP under random waves has been carried out using the finite element software ANSYS AQWA. The basic components of mini TLP are shown in fig.1
———————————————— • Shibin P. Shaji, PG Student, Department of Civil Engineering, NSS College of Engineering, Palakkad, E-mail: [email protected] • Dr. Jayalekshmi R, Professor, Department of Civil Engineering, NSS College of Engineering, Palakkad, E-mail:
IJSER

International Journal of Scientific & Engineering Research, Volume 7, Issue 10, October-2016 173 ISSN 2229-5518
IJSER © 2016 http://www.ijser.org
Fig. 1: Mini TLP
IJSER

International Journal of Scientific & Engineering Research, Volume 7, Issue 10, October-2016 174 ISSN 2229-5518
IJSER © 2016 http://www.ijser.org
2 Random Wave Kinematics For a known random wave elevation, the random wave kinematics and the pressure intensity need to be calculated. For this purpose, the random wave surface elevation η at x from origin and at time t can be considered as a superposition of N different monochromatic Airy’s wave heights Hi, i = 1 to N and frequencies ωi, i = 1 to N combined with the random phase angle Φi. Thus,
(1)
Where Φ i can take values in the range 0<Φi<2π with uniform probability density and N is related to the cut off frequency. The corresponding fluid velocity, acceleration and pressure intensity at depth z can be written in terms of the regular wave heights Hi and frequency ω i which are obtained by using Fast Fourier Transform. Thus for a random waves,
(2)
(3)
2.1 Dynamics of Mini Tlp The expression generally used to describe the motion is given by:
(4) Where. ‘ M(t) = inertial mass matrix. C(t)= damping matrix. . K(t) =stiffness matrix. = system displacement vector. = system velocity vector. ̈=system acceleration vector
A common assumption is to limit the system model to a rigid platform and exclude riser and tendon displacements. The system then has 6 degrees of freedom as shown in figure 8(the translatory motion in the x direction is taken as the surge, the translatory motion in the y direction is taken as the sway, the translatory motion in the z direction is taken as the heave (positive upwards), the rotatory motion about the x axis is taken as the roll, the rotatory motion about the y axis is taken as the pitch, and the rotatory motion about the z axis is taken as the yaw). The fixed coordinates are coincident with the principal directions of the platform when the platform is at rest. Here time domain analysis is performed to understand the behaviour of mini TLP under the dynamic load.
IJSER
International Journal of Scientific & Engineering Research, Volume 7, Issue 10, October-2016 175 ISSN 2229-5518
IJSER © 2016 http://www.ijser.org
3 Modelling And Analysis
3.1 Analysis Software For the present study the software ANSYS AQWA is used and the salient features of the same is presented.
Hydrodynamic software ANSYS AQWA is used for the hydrodynamic analysis of both fixed and floating structures. It is a diffraction radiation program based on linear potential theory. Second order effects can also be included. Free floating as well as moored floating body RAO can be generated in ANSYS AQWA. It works on the principle of panel methods. ANSYS AQWA is a set of hydrodynamic software programs and the modules in it are briefly described below. AQWA-LIBRIUM: Used to find the equilibrium characteristics of a moored or freely floating body or bodies. Steady state environmental loads may also be considered to act on the body. AQWA-LINE: Used to calculate the wave loading and response of bodies when exposed to a regular harmonic wave environment. The first order wave forces and second order wave drift forces are calculated in the frequency domain. AQWA-FER: Used to analyze the coupled or uncoupled responses of floating bodies while operating in irregular waves. The analysis is performed in the frequency domain. AQWA-NAUT: Used to simulate the real time motion of a floating body or bodies while operating in regular or irregular waves. AQWA-WAVE: Used to transfer wave loads on fixed or floating structure calculated by AQWA-LINE to a finite element structure analysis package. AQWA GRAPHICAL SUPERVISOR (AGS): It is a pre and post processor for all the modules.
IJSER

International Journal of Scientific & Engineering Research, Volume 7, Issue 10, October-2016 176 ISSN 2229-5518
IJSER © 2016 http://www.ijser.org
IJSER

International Journal of Scientific & Engineering Research, Volume 7, Issue 10, October-2016 177 ISSN 2229-5518
IJSER © 2016 http://www.ijser.org
Fig. 2: Geometry of mini TLP
3.2 Platform Configuration of Mini TLP The platform selected for the study is called Morpeth seastar mini TLP. The Morpeth project is the world’s first application of a seastar mini TLP and establishes that mono-column TLP’s can be used to economically develop deep water fields. The Morpeth field is located in Gulf of Mexico in Ewing Bank (EW) blocks 921, 964 and 965 of the shore of Louisiana. It was developed by British Borneo, although the company has been bought by Agip. The platform geometry is shown in figure 2 and details are given in table 1.
Table 1: Platform data of mini TLP
IJSER

International Journal of Scientific & Engineering Research, Volume 7, Issue 10, October-2016 178 ISSN 2229-5518
IJSER © 2016 http://www.ijser.org
3.3 Environmental Details For random waves, the wave train is generally specified by a wave spectral density S(f). In the present study a single parameter Pierson-Moskowitz wave spectrum is taken as the representative spectrum. It is given by,
(5)
Where f0 is the peak frequency and is calculated as
f0=1/2π √(0.161g/Hs )
(6)
IJSER

International Journal of Scientific & Engineering Research, Volume 7, Issue 10, October-2016 179 ISSN 2229-5518
IJSER © 2016 http://www.ijser.org
3.4 Modelling Details The surface profile of the mini TLP is simulated in 3D modelling software called “Design Modular” which is available in the software package. Then the geometry modelled is imported into the model cell. The model cell selects the geometry object in the tree where the global parameters are given. This platform configuration is given as input.
Fig. 3: Model created in ANSYS DM
IJSER
International Journal of Scientific & Engineering Research, Volume 7, Issue 10, October-2016 180 ISSN 2229-5518
IJSER © 2016 http://www.ijser.org
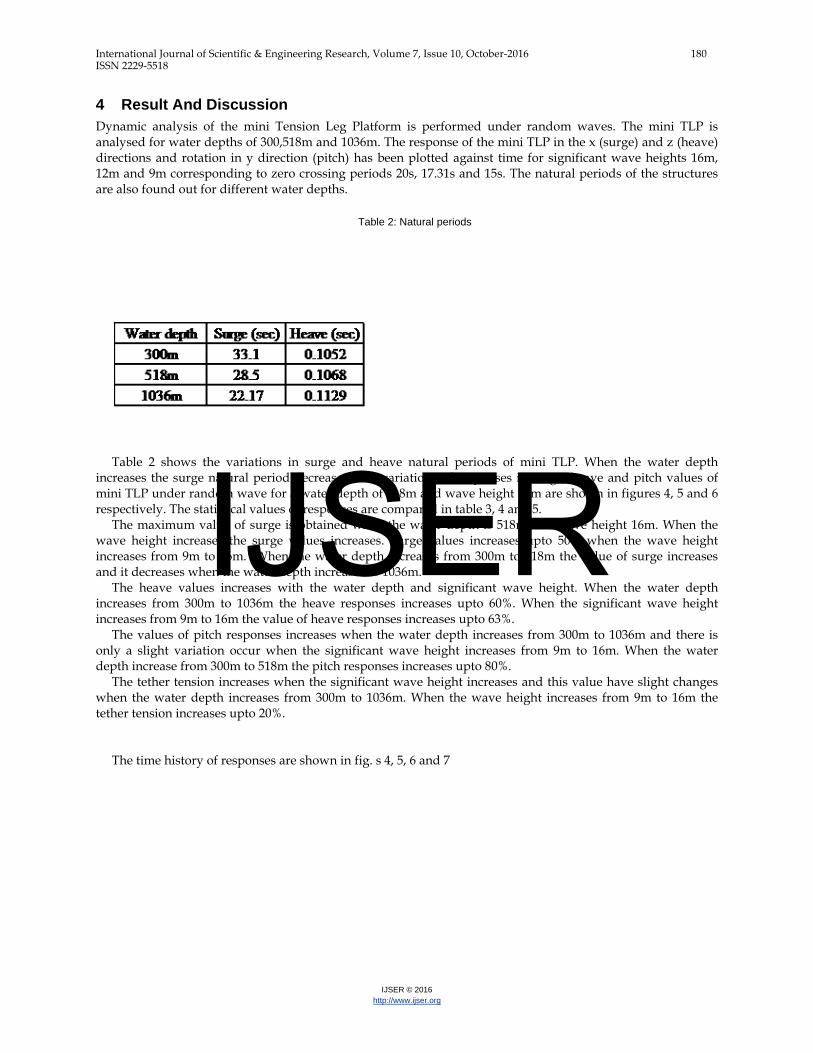
4 Result And Discussion Dynamic analysis of the mini Tension Leg Platform is performed under random waves. The mini TLP is analysed for water depths of 300,518m and 1036m. The response of the mini TLP in the x (surge) and z (heave) directions and rotation in y direction (pitch) has been plotted against time for significant wave heights 16m, 12m and 9m corresponding to zero crossing periods 20s, 17.31s and 15s. The natural periods of the structures are also found out for different water depths.
Table 2: Natural periods
Table 2 shows the variations in surge and heave natural periods of mini TLP. When the water depth
increases the surge natural period decreases. The variations of responses in surge, heave and pitch values of mini TLP under random wave for a water depth of 518m and wave height 16m are shown in figures 4, 5 and 6 respectively. The statistical values of responses are compared in table 3, 4 and 5.
The maximum value of surge is obtained when the water depth is 518m and wave height 16m. When the wave height increases the surge values increases. Surge values increases upto 50% when the wave height increases from 9m to 16m. When the water depth increases from 300m to 518m the value of surge increases and it decreases when the water depth increases to 1036m.
The heave values increases with the water depth and significant wave height. When the water depth increases from 300m to 1036m the heave responses increases upto 60%. When the significant wave height increases from 9m to 16m the value of heave responses increases upto 63%.
The values of pitch responses increases when the water depth increases from 300m to 1036m and there is only a slight variation occur when the significant wave height increases from 9m to 16m. When the water depth increase from 300m to 518m the pitch responses increases upto 80%.
The tether tension increases when the significant wave height increases and this value have slight changes when the water depth increases from 300m to 1036m. When the wave height increases from 9m to 16m the tether tension increases upto 20%.
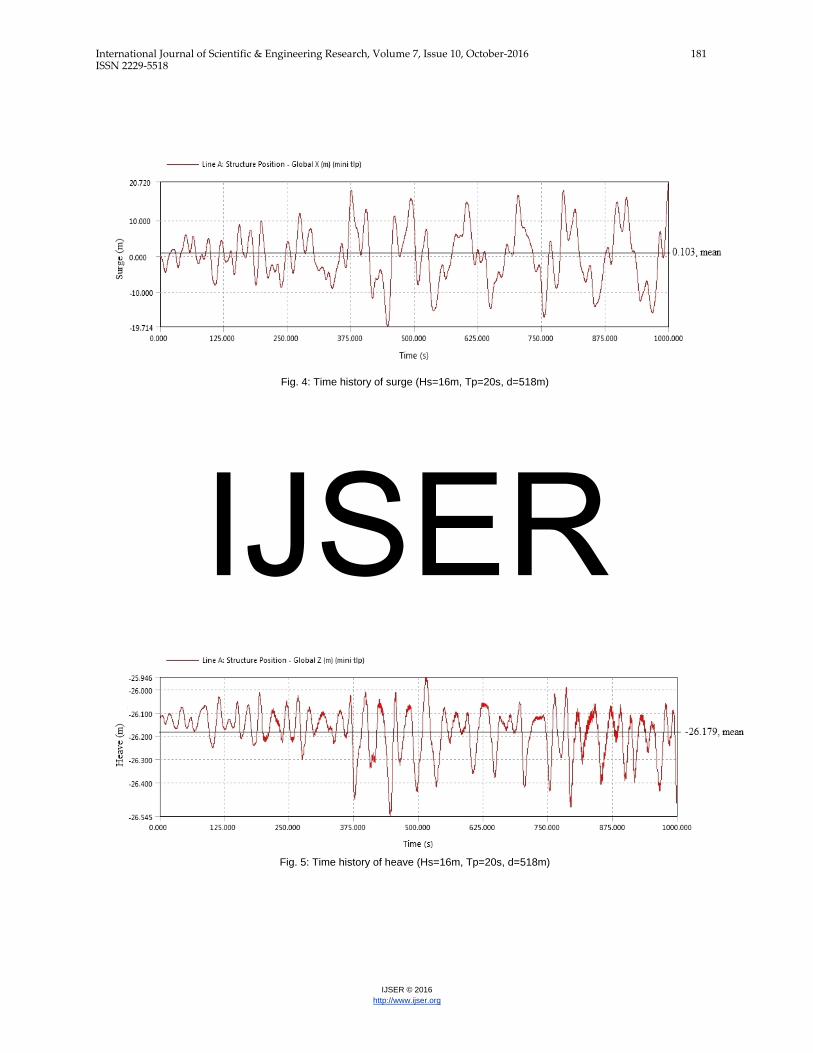
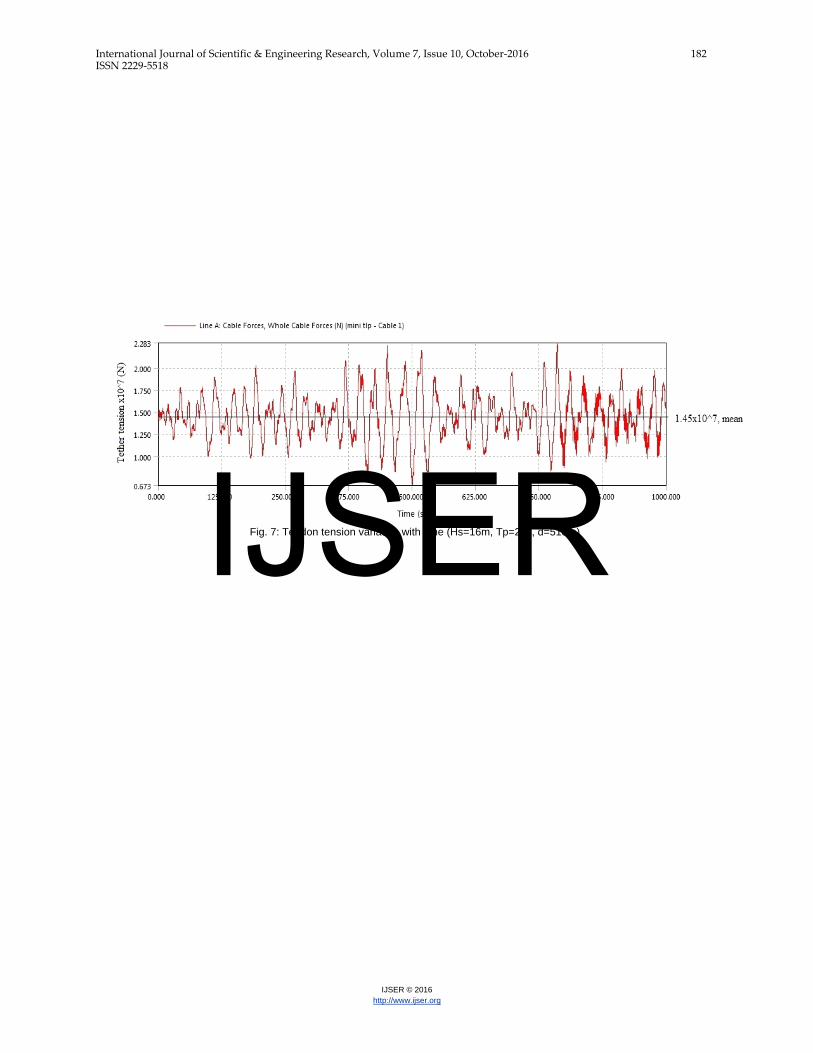
The time history of responses are shown in fig. s 4, 5, 6 and 7
IJSER
International Journal of Scientific & Engineering Research, Volume 7, Issue 10, October-2016 181 ISSN 2229-5518
IJSER © 2016 http://www.ijser.org
Fig. 4: Time history of surge (Hs=16m, Tp=20s, d=518m)
Fig. 5: Time history of heave (Hs=16m, Tp=20s, d=518m)
IJSER
International Journal of Scientific & Engineering Research, Volume 7, Issue 10, October-2016 182 ISSN 2229-5518
IJSER © 2016 http://www.ijser.org
Fig. 7: Tendon tension variation with time (Hs=16m, Tp=20s, d=518m)
IJSER

International Journal of Scientific & Engineering Research, Volume 7, Issue 10, October-2016 183 ISSN 2229-5518
IJSER © 2016 http://www.ijser.org
Fig. 6: Time history of pitch (Hs=16m, Tp=20s, d=518m)
Fig. 8: Comparison of maximum surge response
The comparison of the results using bar charts are shown below
Fig. 9: Comparison of maximum heave response
IJSER

International Journal of Scientific & Engineering Research, Volume 7, Issue 10, October-2016 184 ISSN 2229-5518
IJSER © 2016 http://www.ijser.org
Fig. 11: Comparison of maximum tether tension
Fig. 10: Comparison of maximum pitch response
Table 5: Comparison of statistical values of responses for different water depth (Hs=16m)
IJSER

International Journal of Scientific & Engineering Research, Volume 7, Issue 10, October-2016 185 ISSN 2229-5518
IJSER © 2016 http://www.ijser.org
Table 4: Comparison of statistical values of responses for different water depth (Hs=12m)
Table 3: Comparison of statistical values of responses for different water depth (Hs=9m)
IJSER

International Journal of Scientific & Engineering Research, Volume 7, Issue 10, October-2016 186 ISSN 2229-5518
IJSER © 2016 http://www.ijser.org
Fig. 14: Spectral distribution for surge (d=518m)
Fig. 12: Spectral distribution for surge (Hs=16m)
The spectral distribution for surge and heave for different water depth and wave heights are shown in fig. 12, 13, 14 and 15. When the significant wave height is 16m the obtained maximum spectral density obtained at a water depth of 300m and minimum when the water depth is 1036m. The power spectral density (PSD) of surge is maximum at a frequency of 0.031Hz in 300m water depth surge natural frequency is 0.030Hz which is near to the maximum frequency of PSD. Similarly for other water depth the maximum PSD for surge is same as natural periods of the corresponding water depths.
IJSER

International Journal of Scientific & Engineering Research, Volume 7, Issue 10, October-2016 187 ISSN 2229-5518
IJSER © 2016 http://www.ijser.org
Fig. 13: Spectral distribution for heave (Hs=16m)
PSD for heave is maximum when the water depth is 1036m and minimum when the water depth is 300m.
The maximum PSD value occur at 0.034Hz when the water depth is 1036m.
Fig. 15: Spectral distribution for heave (d=518m)
• Conclusion Dynamic analysis of mini Tension Leg Platform has been performed under random waves. The mini TLP is analysed for different water depths and significant wave height conditions. When the water depth increases the heave and pitch responses increases but the surge responses is maximum at an intermediate water depth 518m and it is decreases when the water depth increases. When the significant wave height increases surge, heave and pitch responses also increases. Tether tension shows slight variations when the water depth increases but when the significant wave height increases its value increases. When the water depth is 300m the PSD for surge is maximum and PSD heave is minimum. The surge PSD and heave PSD is maximum for a significant wave height of 16m. It was found that for every water depth power spectral density for surge is maximum at its natural frequency.
Acknowledgment First of all I thank Lord Almighty for the blessings. He had bestowed on me throughout this work. I wish to extend my gratitude and indebtedness to the staff and students of NSS College of Engineering Palakkad. I have great pleasure to express my deep sense of gratitude towards my Guide Dr. Jayalekshmi R, Professor, Department of Civil Engineering, NSS College of Engineering, Palakkad, for her efforts, assistance and inspiration in all phases of my thesis period.
IJSER

International Journal of Scientific & Engineering Research, Volume 7, Issue 10, October-2016 188 ISSN 2229-5518
IJSER © 2016 http://www.ijser.org
References • Anitha Joseph, Bhattacharyya S K, Idichandy V.G, “Experimental and Numerical Study of Coupled
Dynamic Response of a Mini Tension Leg Platform”, Journal of offshore mechanics and arctic engineering, Vol.: 126, pp 318-330, 2004,
• A Bassam, Younis, Vlado P. Przuljb, “Prediction of hydrodynamic loading on a mini TLP with free surface effects”, Ocean Engineering 33, Vol.: 33, pp 181-204, 2006,
• James F. Wilson, “Dynamics of Offshore Structures”, Second edition John Wiley & Sons, New Jersey, 2003 • Sreekumar S, Bhattacharyya S K, Idichandy V.G, “Coupled dynamics of SeaStar mini tension leg
platform”, Ocean Engineering 30, vol.: 30, pp 709-737, 2003 • Xiaohong Chen, Yu Ding, Jun Zhang, Pierre Liagre, John Niedzwecki, Per Teigen, “Coupled dynamic
analysis of a mini TLP: comparison with measurements”, Ocean Engineering 33, vol.: 33, pp 93-117, 2006 • B A Younis, Teigen P.,V P Przulj, “Estimating the hydrodynamic forces on a mini TLP with computational
fluid dynamics and design-code techniques”, Ocean Engineering 28, vol.: 28, pp 585-602, 2001
IJSER