Embed Size (px)
Citation preview

Purchasing Managers’
Index (PMI) Survey
Report
Central Bank of Nigeria
Statistics Department
September 2018
1
PURCHASING MANAGERS’ INDEX (PMI) SEPTEMBER 2018 REPORT
1.0 Introduction
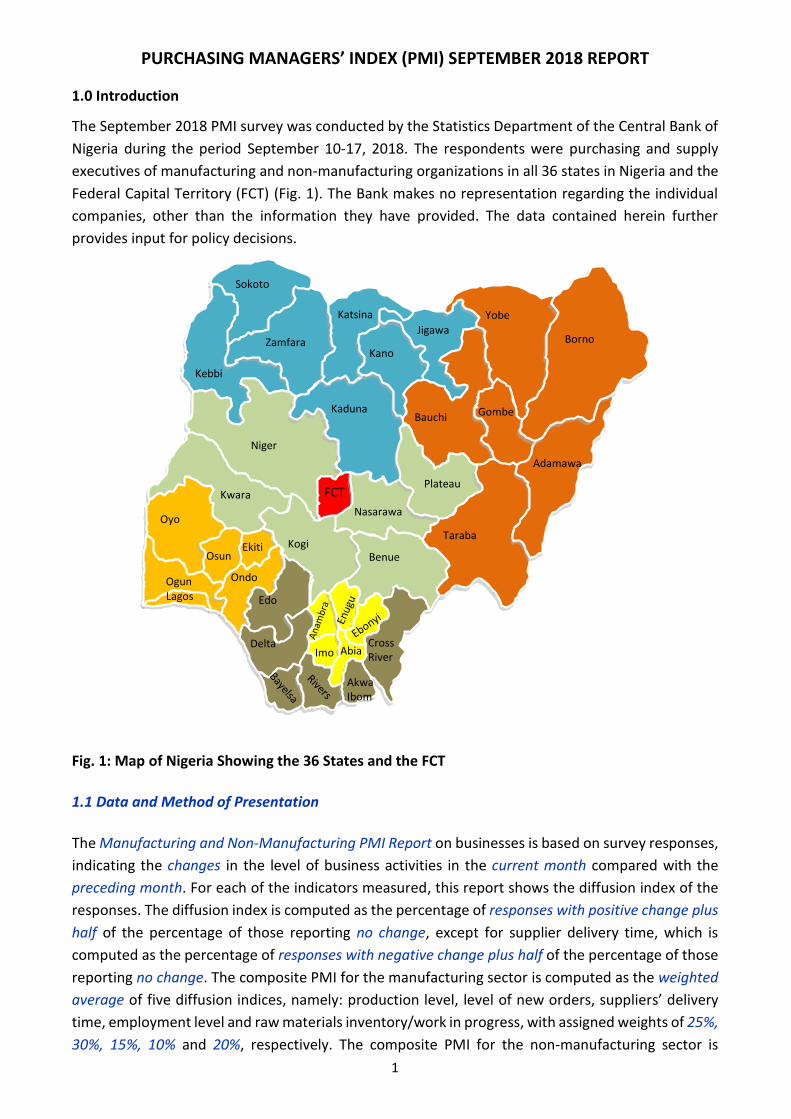
The September 2018 PMI survey was conducted by the Statistics Department of the Central Bank of
Nigeria during the period September 10-17, 2018. The respondents were purchasing and supply
executives of manufacturing and non-manufacturing organizations in all 36 states in Nigeria and the
Federal Capital Territory (FCT) (Fig. 1). The Bank makes no representation regarding the individual
companies, other than the information they have provided. The data contained herein further
provides input for policy decisions.
Fig. 1: Map of Nigeria Showing the 36 States and the FCT
1.1 Data and Method of Presentation
The Manufacturing and Non-Manufacturing PMI Report on businesses is based on survey responses,
indicating the changes in the level of business activities in the current month compared with the
preceding month. For each of the indicators measured, this report shows the diffusion index of the
responses. The diffusion index is computed as the percentage of responses with positive change plus
half of the percentage of those reporting no change, except for supplier delivery time, which is
computed as the percentage of responses with negative change plus half of the percentage of those
reporting no change. The composite PMI for the manufacturing sector is computed as the weighted
average of five diffusion indices, namely: production level, level of new orders, suppliers’ delivery
time, employment level and raw materials inventory/work in progress, with assigned weights of 25%,
30%, 15%, 10% and 20%, respectively. The composite PMI for the non-manufacturing sector is
Sokoto
Zamfara
Kebbi
Katsina
Kano
Jigawa
Kaduna
Yobe
Bauchi
Borno
Gombe
Adamawa
Plateau
Taraba
Nasarawa
Niger
Kwara
KogiBenue
Oyo
Ogun
OsunEkiti
Ondo
Lagos Edo
DeltaImo
AkwaIbom
AbiaCross River
FCT

2
computed from four diffusion indices, namely: business activity, level of new orders, employment
level and raw materials inventory, with equal weights of 25% each.
A composite PMI above 50 points indicates that the manufacturing/non-manufacturing economy is generally expanding, 50 points indicates no change and below 50 points indicates that it is generally contracting. The subsectors reporting growth are listed in the order of highest to lowest growth, while those reporting contraction are listed in the order of the highest to the lowest contraction.
2.0 Manufacturing PMI Report
Production level, new orders employment level and inventories
grew at a slower rate; supplier delivery time grew at a faster rate in
September 2018
The Manufacturing PMI in the month of September stood at 56.2 index points, indicating expansion
in the manufacturing sector for the eighteenth consecutive month. (Fig. 3 and Table 1). The index
however grew at a slower rate when compared to the index in the previous month. Of the 14
subsectors surveyed, 10 reported growth in the review month in the following order: Electrical
equipment; Printing & related
support activities; Transportation
equipment; Nonmetallic mineral
products; Chemical &
pharmaceutical products;
Fabricated metal products;
Furniture & related products;
Textile, apparel, leather & footwear;
Food, beverage & tobacco products;
and Plastics & rubber products. The
Petroleum & coal products;
Cement; Paper products; and
Primary metal subsectors declined
in the review month.

3
2.1 Production Level
At 58.4 points, the production level
index for the manufacturing sector
grew for the nineteenth consecutive
month in September 2018. The index
indicated a slower growth in the
current month, when compared to its
level in the preceding month. Ten of
the 14 manufacturing subsectors
recorded increase in production level, 1
remained unchanged while 3 declined
(Fig. 4 and Table 2).
2.2 New Orders
At 55.3 points, the new orders index
grew for the eighteenth consecutive
month, indicating increase in new
orders in September 2018. Nine
subsectors reported growth, 2
remained unchanged, while 3
contracted in the review month (Fig. 5
and Table 3).
2.3 Supplier Delivery Time
The manufacturing supplier delivery
time index stood at 56.1 points in
September 2018, indicating faster
supplier delivery time for the sixteenth
consecutive month. Eleven subsectors
recorded improved suppliers’ delivery
time, 2 remained unchanged while 1
reported worsening delivery times (Fig.
6 and Table 4).

4
2.4 Employment Level
The employment level index in
September 2018 stood at 54.9 points,
indicating growth in employment level
for the seventeenth consecutive
month. Of the 14 subsectors, 12
reported increased employment level,
1 remained unchanged while 1
reported reduced employment level in
the review month (Fig. 7 and Table 5).
2.5 Raw material Inventories
The Manufacturing sector inventories
index grew for the eighteenth
consecutive month in September
2018. At 55.9 points, the index grew at
a slower rate when compared to its
level in the previous month. Ten of the
14 subsectors recorded growth, while
4 recorded decline in raw material
inventories (Fig. 8 and Table 6).
3.0 Non-Manufacturing PMI Report
Business activity, new orders,
employment level and inventories
grew at a slower rate in September
2018

5
The composite PMI for the non-
manufacturing sector stood at
56.5 points in September 2018,
indicating expansion in the Non-
manufacturing PMI for the
seventeenth consecutive
month. The index grew at a
slower rate when compared to
that in August 2018. Fifteen of
the 17 subsectors recorded
growth in the following order:
Educational services;
Management of companies;
Information & communication;
Agriculture; Finance &
insurance; Water supply, sewage & waste management; Wholesale/Retail trade; Real estate rental
& leasing; Utilities; Accommodation & food services; Transportation & warehousing; Electricity, gas,
steam & air conditioning supply; Professional, scientific, & technical services; Health care & social
assistance; and Repair, Maintenance/Washing of Motor Vehicles. The Arts, Entertainment &
Recreation subsector remained unchanged, while construction subsector recorded contraction in the
review period (Fig. 10 and Table 7).
3.1 Business Activity
At 58.1 points, the business
activity index grew for the
eighteenth consecutive month,
indicating expansion in non-
manufacturing business activity
in September 2018. The index
grew at a slower rate when
compared to its level in the
previous month. Twelve
subsectors recorded growth in
business activity, 3 remained
unchanged while 2 declined in
the review month (Fig 11 Table
8).

6
3.2 New Orders
At 55.8 points, new orders index
grew for the eighteenth
consecutive month in September
2018. Of the 17 subsectors, 13
reported growth, 1 remained
unchanged, while 3 recorded a
decline (Fig 12 Table 9).
3.3 Employment Level
The employment level Index for
the non-manufacturing sector
stood at 55.4 points, indicating
growth in employment for the
seventeenth consecutive month.
Thirteen subsectors recorded
growth, 1 remained unchanged
while 3 recorded decline in the
review month (Fig 13 Table 10).
3.4 Non-manufacturing
Inventory
At 56.8 points, non-
manufacturing inventory index
grew for the seventeenth
consecutive month, indicating
growth in inventories in the
review period. Thirteen
subsectors recorded higher
inventories, subsector 1 remained
unchanged while 3 declined in
September 2018 (Fig 14 Table 11).

7
APPENDICES
Table 1: Manufacturing at a Glance
Table 2: Production at a Glance
Index
Series
Index*
August
Series
Index*
September
Difference Direction
Rate
of
Change
Trend**
(Months)
Composite PMI \1 57.1 56.2 -0.9 Growing Slower 18
Production level 59.3 58.4 -0.9 Growing Slower 19
New orders 56.9 55.3 -1.6 Growing Slower 18
Supplier delivery time 55.9 56.1 0.2 Growing Faster 16
Employment level 55.5 54.9 -0.6 Growing Slower 17
Raw materials/WIP Inventory 57.1 55.9 -1.2 Growing Slower 18
New Export Orders 39.7 37.1 -2.6 Declining Faster 43
Output Prices 50.1 52.4 2.3 Growing Faster 33
Input Prices 59.3 57.5 -1.8 Growing Slower 51
Quantity of Purchases 50.1 49.4 -0.7 Declining From Expansion 1
Outstanding Business/Backlog of Work 43.1 42.2 -0.9 Declining Faster 10
Stock of Finished Goods 50.7 50.5 -0.2 Growing Slower 6
Manufacturing Sub-SectorsCement 61.3 46.6 -14.7 Declining From Expansion 1
Chemical & pharmaceutical products 59.0 58.7 -0.3 Growing Slower 8
Electrical equipment 67.5 63.8 -3.7 Growing Slower 8
Fabricated metal products 56.9 58.7 1.8 Growing Faster 3
Food, beverage & tobacco products 53.4 55.3 1.9 Growing Faster 24
Furniture & related products 60.8 57.7 -3.1 Growing Slower 4
Nonmetallic mineral products 62.4 59.4 -3.0 Growing Slower 4
Paper products 58.3 48.4 -9.9 Declining From Expansion 1
Petroleum & coal products 59.2 44.2 -15.0 Declining From Expansion 1
Plastics & rubber products 60.7 55.2 -5.5 Growing Slower 2
Primary metal 53.0 49.2 -3.8 Declining From Expansion 1
Printing & related support activities 55.6 61.7 6.1 Growing Faster 6
Textile, apparel, leather & footwear 60.3 57.1 -3.2 Growing Slower 19
Transportation equipment 49.5 61.7 12.2 Growing From Contraction 1
** Number of month moving in current direction
\1 The composite PMI is a weighted average of the following diffusion indices: production level, new orders, supplier deliveries, employment
level and inventories. The weights assigned to these variables are 25%, 30%, 15%, 10% and 20% respectively.
*The series index is a diffusion index defined as a weighted percentage of high, same and low with 1.0, 0.5 and 0.0 as weights respectively.
Index
Series
Index
August
Series
Index
September
Difference Direction
Rate
of
Change
Trend
(Months)
PRODUCTION PMI 59.3 58.4 -0.9 Growing Slower 19Appliances & components 100.0 100.0 0.0 Growing Flat 6
Cement 87.5 42.9 -44.6 Declining From Expansion 1
Chemical & pharmaceutical products 63.6 63.2 -0.4 Growing Slower 8
Electrical equipment 75.0 62.5 -12.5 Growing Slower 8
Fabricated metal products 58.6 65.0 6.4 Growing Faster 3
Food, beverage & tobacco products 53.2 57.4 4.2 Growing Faster 24
Furniture & related products 66.1 64.3 -1.8 Growing Slower 4
Nonmetallic mineral products 69.0 64.7 -4.3 Growing Slower 3
Paper products 60.0 36.4 -23.6 Declining From Expansion 1
Petroleum & coal products 83.3 50.0 -33.3 No Change From Expansion 1
Plastics & rubber products 63.6 52.3 -11.3 Growing Slower 2
Primary metal 46.4 42.3 -4.1 Declining Faster 2
Printing & related support activities 55.6 68.4 12.8 Growing Faster 6
Textile, apparel, leather & footwear 55.3 58.8 3.5 Growing Faster 6
Transportation equipment 60.0 66.7 6.7 Growing Faster 3

8
Table 3: New Orders at a Glance
Table 4: Supplier Delivery Time at a Glance
Index
Series
Index
August
Series
Index
September
Difference Direction
Rate
of
Change
Trend
(Months)
NEW ORDERS PMI 56.9 55.3 -1.6 Growing Slower 18
Cement 62.5 50.0 -12.5 No Change From Expansion 1
Chemical & pharmaceutical products 55.7 59.2 3.5 Growing Faster 7
Electrical equipment 75.0 62.5 -12.5 Growing Slower 8
Fabricated metal products 57.1 55.0 -2.1 Growing Slower 3
Food, beverage & tobacco products 53.7 55.9 2.2 Growing Faster 24
Furniture & related products 62.5 57.1 -5.4 Growing Slower 4
Nonmetallic mineral products 57.1 61.8 4.7 Growing Faster 2
Paper products 65.0 45.5 -19.5 Declining From Expansion 1
Petroleum & coal products 33.3 16.7 -16.6 Declining Faster 2
Plastics & rubber products 63.6 52.3 -11.3 Growing Slower 2
Primary metal 50.0 42.3 -7.7 Declining From No Change 1
Printing & related support activities 61.1 65.8 4.7 Growing Faster 5
Textile, apparel, leather & footwear 63.2 55.9 -7.3 Growing Slower 4
Transportation equipment 30.0 50.0 20.0 No Change From Contraction 1
Index
Series
Index
August
Series
Index
September
Difference Direction
Rate
of
Change
Trend
(Months)
SUPPLIER DELIVERY TIME PMI 55.9 56.1 0.2 Growing Faster 16
Cement 62.5 58.3 -4.2 Growing Slower 2
Chemical & pharmaceutical products 59.1 57.9 -1.2 Growing Slower 3
Electrical equipment 58.3 62.5 4.2 Growing Faster 2
Fabricated metal products 61.4 51.7 -9.7 Growing Slower 7
Food, beverage & tobacco products 54.2 55.0 0.8 Growing Faster 3
Furniture & related products 46.4 57.1 10.7 Growing From Contraction 1
Nonmetallic mineral products 64.3 58.8 -5.5 Growing Slower 5
Paper products 65.0 68.2 3.2 Growing Faster 4
Petroleum & coal products 33.3 33.3 0.0 Declining Flat 3
Plastics & rubber products 59.1 61.4 2.3 Growing Faster 4
Primary metal 50.0 50.0 0.0 No Change Flat 2
Printing & related support activities 44.1 50.0 5.9 No Change From Contraction 1
Textile, apparel, leather & footwear 55.3 58.8 3.5 Growing Faster 13
Transportation equipment 90.0 66.7 -23.3 Growing Slower 3

9
Table 5: Employment Level at a Glance
Table 6: Raw Materials Inventory at a Glance
Index
Series
Index
August
Series
Index
September
Difference Direction
Rate
of
Change
Trend
(Months)
EMPLOYMENT LEVEL PMI 55.5 54.9 -0.6 Growing Slower 17Appliances & components 25.0 25.0 0.0 Declining Flat 6
Cement 37.5 42.9 5.4 Declining Slower 2
Chemical & pharmaceutical products 59.1 52.6 -6.5 Growing Slower 8
Electrical equipment 41.7 62.5 20.8 Growing From Contraction 1
Fabricated metal products 50.0 68.3 18.3 Growing From No Change 1
Food, beverage & tobacco products 53.3 52.5 -0.8 Growing Slower 5
Furniture & related products 58.9 51.8 -7.1 Growing Slower 5
Nonmetallic mineral products 61.9 58.8 -3.1 Growing Slower 3
Paper products 50.0 54.5 4.5 Growing From No Change 1
Petroleum & coal products 66.7 66.7 0.0 Growing Flat 3
Plastics & rubber products 52.3 56.8 4.5 Growing Faster 2
Primary metal 64.3 57.7 -6.6 Growing Slower 3
Printing & related support activities 52.8 50.0 -2.8 No Change From Expansion 1
Textile, apparel, leather & footwear 68.4 52.9 -15.5 Growing Slower 2
Transportation equipment 40.0 66.7 26.7 Growing From Contraction 1
Index
Series
Index
August
Series
Index
September
Difference Direction
Rate
of
Change
Trend
(Months)
RAW MATERIALS INVENTORY PMI 57.1 55.9 -1.2 Growing Slower 18
Cement 37.5 35.7 -1.8 Declining Faster 2
Chemical & pharmaceutical products 56.8 59.2 2.4 Growing Faster 4
Electrical equipment 91.7 75.0 -16.7 Growing Slower 10
Fabricated metal products 58.6 45.0 -13.6 Declining From Expansion 1
Food, beverage & tobacco products 51.9 54.5 2.6 Growing Faster 24
Furniture & related products 67.9 55.4 -12.5 Growing Slower 7
Nonmetallic mineral products 59.5 41.2 -18.3 Declining From Expansion 1
Paper products 40.0 45.5 5.5 Declining Slower 2
Petroleum & coal products 100.0 83.3 -16.7 Growing Slower 8
Plastics & rubber products 63.6 59.1 -4.5 Growing Slower 2
Primary metal 60.7 69.2 8.5 Growing Faster 3
Printing & related support activities 61.8 73.7 11.9 Growing Faster 4
Textile, apparel, leather & footwear 55.3 62.5 7.2 Growing Faster 12
Transportation equipment 40.0 66.7 26.7 Growing From Contraction 1

10
Table 7: Non-Manufacturing at a Glance
Table 8: Business activity at a Glance
Index
Series
Index
August
Series
Index
September
Difference Direction
Rate
of
Change
Trend
(Months)
Composite PMI \1 58.0 56.5 -1.5 Growing Slower 17
Business Activity 59.3 58.1 -1.2 Growing Slower 18
Level of new orders/customers/incoming business 56.9 55.8 -1.1 Growing Slower 18
Level of employment 56.7 55.4 -1.3 Growing Slower 17
Inventory 58.9 56.8 -2.1 Growing Slower 17
Average price of Inputs (volume weighted) 50.8 50.2 -0.6 Growing Slower 35
Level of outstanding business/ Backlog of work 43.3 41.5 -1.8 Declining Faster 51
New Exports orders 40.1 40.3 0.2 Declining Slower 51
Imports 40.3 41.3 1.0 Declining Slower 51
Inventory (sentiments) 44.8 45.7 0.9 Declining Slower 51
Non-manufacturing sub-sectors Accommodation & food services 54.4 55.9 1.5 Growing Faster 3
Agriculture 69.8 60.2 -9.6 Growing Slower 28
Arts, Entertainment & Recreation 58.8 50.0 -8.8 No Change From Expansion 1
Construction 49.6 47.5 -2.1 Declining Faster 2
Educational services 60.9 65.9 5.0 Growing Faster 3
Electricity, gas, steam & air conditioning supply 53.7 53.1 -0.6 Growing Slower 5
Finance & insurance 59.5 59.4 -0.1 Growing Slower 19
Health care & social assistance 57.8 52.5 -5.3 Growing Slower 17
Information & communication 65.0 61.9 -3.1 Growing Slower 18
Management of companies 55.0 64.8 9.8 Growing Faster 2
Professional, scientific, & technical services 48.3 52.8 4.5 Growing From Contraction 1
Real estate rental & leasing 58.1 56.8 -1.3 Growing Slower 7
Repair, Maintenance/Washing Of Motor Vehicles… 65.4 50.8 -14.6 Growing Slower 4
Transportation & warehousing 55.3 55.7 0.4 Growing Faster 5
Utilities 42.9 56.3 13.4 Growing From Contraction 1
Water supply, sewage & waste management 62.5 57.7 -4.8 Growing Slower 7
Wholesale/Retail trade 60.0 57.3 -2.7 Growing Slower 16
\1 The composite PMI is a simple average of the following diffusion (series) indices: business activity, new orders, employment level and inventories
Index
Series
Index
August
Series
Index
September
Difference Direction
Rate
of
Change
Trend
(Months)
BUSINESS ACTIVITY PMI 59.3 58.1 -1.2 Growing Slower 18
Accommodation & food services 57.2 57.0 -0.2 Growing Slower 3
Agriculture 70.7 64.8 -5.9 Growing Slower 28
Arts, Entertainment & Recreation 62.1 50.0 -12.1 No Change From Expansion 1
Construction 47.1 44.3 -2.8 Declining Faster 2
Educational services 61.3 73.3 12.0 Growing Faster 13
Electricity, gas, steam & air conditioning supply 53.7 47.5 -6.2 Declining From Expansion 1
Finance & insurance 60.8 61.5 0.7 Growing Faster 18
Health care & social assistance 55.5 50.0 -5.5 No Change From Expansion 1
Information & communication 71.2 67.3 -3.9 Growing Slower 18
Management of companies 58.8 71.9 13.1 Growing Faster 2
Professional, scientific, & technical services 43.3 52.3 9.0 Growing From Contraction 1
Real estate rental & leasing 66.3 58.6 -7.7 Growing Slower 5
Repair, Maintenance/Washing Of Motor Vehicles… 69.2 50.0 -19.2 No Change From Expansion 1
Transportation & warehousing 56.3 55.0 -1.3 Growing Slower 3
Utilities 43.8 62.5 18.7 Growing From Contraction 1
Water supply, sewage & waste management 65.6 57.7 -7.9 Growing Slower 5
Wholesale/Retail trade 58.2 60.4 2.2 Growing Faster 3

11
Table 9: New Orders at a Glance
Table 10: Employment at a Glance
Table 11: Inventory at a Glance
Index
Series
Index
August
Series
Index
September
Difference Direction
Rate
of
Change
Trend
(Months)
NEW ORDERS PMI 56.9 55.8 -1.1 Growing Slower 18
Accommodation & food services 55.7 53.5 -2.2 Growing Slower 3
Agriculture 72.4 68.5 -3.9 Growing Slower 5
Arts, Entertainment & Recreation 50.0 50.0 0.0 No Change Flat 2
Construction 51.4 40.0 -11.4 Declining From Expansion 1
Educational services 66.1 63.3 -2.8 Growing Slower 3
Electricity, gas, steam & air conditioning supply 57.4 57.5 0.1 Growing Faster 2
Finance & insurance 60.2 63.4 3.2 Growing Faster 19
Health care & social assistance 57.4 44.6 -12.8 Declining From Expansion 1
Information & communication 65.4 65.6 0.2 Growing Faster 18
Management of companies 50.0 62.5 12.5 Growing From No Change 1Professional, scientific, & technical services 43.3 52.3 9.0 Growing From Contraction 1
Real estate rental & leasing 50.0 55.7 5.7 Growing From No Change 1
Repair, Maintenance/Washing Of Motor Vehicles… 65.4 40.0 -25.4 Declining From Expansion 1
Transportation & warehousing 50.0 52.5 2.5 Growing From No Change 1
Utilities 27.8 56.3 28.5 Growing From Contraction 1
Water supply, sewage & waste management 65.6 53.8 -11.8 Growing Slower 4
Wholesale/Retail trade 57.6 58.5 0.9 Growing Faster 16
Index
Series
Index
August
Series
Index
September
Difference Direction
Rate
of
Change
Trend
(Months)
EMPLOYMENT LEVEL PMI 56.7 55.4 -1.3 Growing Slower 17
Accommodation & food services 50.0 57.5 7.5 Growing From No Change 1
Agriculture 69.0 59.3 -9.7 Growing Slower 17
Arts, Entertainment & Recreation 59.1 53.7 -5.4 Growing Slower 3
Construction 48.6 48.6 0.0 Declining Flat 2
Educational services 59.7 65.0 5.3 Growing Faster 3
Electricity, gas, steam & air conditioning supply 53.7 57.5 3.8 Growing Faster 5
Finance & insurance 54.9 53.6 -1.3 Growing Slower 16
Health care & social assistance 59.3 58.0 -1.3 Growing Slower 16
Information & communication 60.4 50.0 -10.4 No Change From Expansion 1
Management of companies 50.0 59.4 9.4 Growing From No Change 1
Professional, scientific, & technical services 53.3 47.7 -5.6 Declining From Expansion 1
Real estate rental & leasing 58.1 54.3 -3.8 Growing Slower 4
Repair, Maintenance/Washing Of Motor Vehicles… 65.4 66.7 1.3 Growing Faster 11
Transportation & warehousing 58.3 60.0 1.7 Growing Faster 6
Utilities 44.4 43.8 -0.6 Declining Faster 2
Water supply, sewage & waste management 59.4 65.4 6.0 Growing Faster 3
Wholesale/Retail trade 62.0 52.8 -9.2 Growing Slower 4
Index
Series
Index
August
Series
Index
September
Difference Direction
Rate
of
Change
Trend
(Months)
INVENTORY PMI 58.9 56.8 -2.1 Growing Slower 17
Accommodation & food services 54.7 55.6 0.9 Growing Faster 3
Agriculture 67.2 48.1 -19.1 Declining From Expansion 1
Arts, Entertainment & Recreation 64.1 46.2 -17.9 Declining From Expansion 1
Construction 51.5 57.1 5.6 Growing Faster 3
Educational services 56.7 62.1 5.4 Growing Faster 3
Electricity, gas, steam & air conditioning supply 50.0 50.0 0.0 No Change Flat 2
Finance & insurance 61.9 59.2 -2.7 Growing Slower 8
Health care & social assistance 59.3 57.1 -2.2 Growing Slower 17
Information & communication 63.2 64.6 1.4 Growing Faster 5
Management of companies 61.1 65.6 4.5 Growing Faster 2Professional, scientific, & technical services 53.3 59.1 5.8 Growing Faster 10
Real estate rental & leasing 58.1 58.6 0.5 Growing Faster 7
Repair, Maintenance/Washing Of Motor Vehicles… 61.5 46.7 -14.8 Declining From Expansion 1
Transportation & warehousing 56.5 55.3 -1.2 Growing Slower 4
Utilities 55.6 62.5 6.9 Growing Faster 2
Water supply, sewage & waste management 59.4 53.8 -5.6 Growing Slower 10
Wholesale/Retail trade 62.0 57.6 -4.4 Growing Slower 14

12
Table 12: Manufacturing PMI Data Series
Mo
nth
CO
MP
OS
ITE
PM
I
Pro
du
ctio
n
Lev
el
Ne
w O
rde
rs
Su
pp
lie
r
De
liv
ery
Tim
e
Em
plo
ym
en
t
Lev
el
Ra
w M
ate
ria
ls
Inv
en
tory
Ne
w E
xp
ort
Ord
ers
Ou
tpu
t P
rice
s
Inp
ut
Pri
ces
Qu
an
tity
of
Pu
rch
ase
s
Ba
cklo
g o
f
Wo
rk
Sto
ck o
f
Fin
ish
ed
Go
od
s
Jul '14 51.3 55.2 53.0 46.4 46.9 52.9 43.6 50.6 54.2 53.3 46.4 47.2
Aug '14 49.7 49.7 51.2 49.9 45.9 52.2 40.8 48.6 52.7 50.8 45.4 48.6
Sep '14 54.0 57.4 57.6 46.4 49.3 55.7 45.4 49.3 52.9 55.1 46.9 49.8
Oct '14 51.9 55.1 55.3 46.2 46.8 52.4 45.9 49.7 56.7 57.1 50.5 51.7
Nov '14 52.2 55.1 56.9 45.1 47.2 51.7 46.0 53.3 60.9 56.0 50.0 47.6
Dec '14 49.8 51.2 51.1 49.7 46.8 48.4 44.6 53.6 56.3 51.4 47.5 51.1
Jan '15 50.2 50.4 49.3 51.3 51.1 49.3 47.7 48.7 55.6 52.5 48.8 45.5
Feb '15 53.0 57.4 54.7 43.8 50.0 56.4 50.1 54.0 60.9 58.0 50.7 53.7
Mar '15 48.9 52.1 48.9 47.8 46.4 47.1 38.1 50.1 56.4 48.7 44.5 46.5
Apr '15 52.0 56.9 54.1 42.7 48.9 53.9 43.0 50.2 54.4 53.0 48.3 48.7
May '15 49.4 53.6 49.7 44.6 48.0 48.0 36.9 51.6 59.0 50.5 44.9 45.6
Jun '15 49.5 51.5 50.8 42.0 48.5 53.3 40.0 49.2 56.7 53.0 45.3 49.3
Jul '15 47.8 49.7 46.2 43.5 48.4 52.6 40.1 47.9 55.0 51.7 45.2 45.3
Aug '15 48.4 51.0 50.1 43.1 44.8 52.4 37.6 49.0 53.1 50.2 43.7 46.1
Sep '15 50.7 54.9 52.1 46.8 47.1 49.0 40.3 47.5 52.8 51.0 42.5 43.2
Oct '15 49.2 52.0 49.3 42.7 48.4 53.1 39.8 49.1 53.8 48.3 45.6 46.8
Nov '15 51.2 55.4 52.9 47.3 45.5 52.2 38.7 46.2 52.8 51.0 46.0 46.9
Dec '15 51.2 55.4 52.7 45.2 47.5 52.7 38.0 48.6 56.5 54.5 45.1 46.4
Jan 16 47.2 49.3 46.2 48.4 46.0 45.8 38.3 52.6 56.7 49.9 44.2 46.3
Feb '16 45.5 45.0 43.0 52.8 45.0 44.7 39.2 53.0 57.0 42.8 38.5 44.4
Mar '16 45.9 46.6 43.0 50.6 45.5 47.1 37.8 56.4 60.9 41.6 41.2 43.8
Apr '16 43.7 42.7 41.8 52.2 42.0 43.0 36.3 63.9 67.8 43.6 42.6 41.6
May '16 45.8 47.9 42.7 50.2 45.7 43.9 38.7 59.6 68.4 42.7 37.0 40.1
Jun '16 41.9 40.2 37.0 55.6 42.2 39.4 35.3 61.4 70.0 39.0 40.2 36.0
Jul '16 44.1 43.0 42.4 51.7 43.8 41.4 38.5 60.8 64.2 41.6 41.9 39.0
Aug '16 42.1 40.5 37.5 57.4 40.4 40.0 31.2 64.1 69.8 39.9 38.3 38.3
Sep '16 42.5 40.9 38.7 55.6 41.2 40.9 26.3 66.5 74.0 42.8 37.1 42.4
Oct '16 44.1 42.3 40.3 57.7 42.2 42.9 37.3 65.2 71.8 43.5 39.2 39.9
Nov '16 46.0 46.9 45.1 53.2 40.6 46.1 39.6 65.7 71.2 48.1 45.2 42.0
Dec '16 52.0 57.6 51.8 47.9 48.6 51.6 37.2 70.4 73.2 52.7 45.3 48.5
Jan '17 48.2 51.3 47.9 48.5 45.3 46.3 33.1 67.9 71.4 48.4 43.6 46.9
Feb '17 44.6 45.2 44.0 48.7 41.7 44.8 38.4 69.9 70.9 47.7 43.2 43.9
Mar '17 47.7 50.8 45.6 51.3 43.6 49.1 38.5 65.0 68.3 50.1 43.6 45.1
Apr '17 51.1 58.5 50.1 47.5 46.6 50.6 37.7 65.1 69.2 45.1 40.0 46.4
May '17 52.5 58.7 50.5 49.9 50.7 50.8 37.6 61.3 68.4 46.1 42.3 51.8
June '17 52.9 58.2 51.0 50.3 51.1 52.3 32.6 62.7 66.6 46.2 43.9 49.1
July '17 54.1 59.3 52.7 51.3 51.8 53.6 37.5 60.4 64.1 48.0 42.1 48.5
Aug '17 53.6 57.4 52.3 52.0 51.5 54.9 36.7 58.8 64.9 49.0 47.9 51.6
Sep '17 55.3 58.8 53.5 55.4 52.8 56.4 30.4 58.2 65.7 49.4 51.9 50.4
Oct '17 55.0 58.4 52.8 55.5 53.1 56.5 35.5 55.4 62.7 49.6 50.8 50.0
Nov '17 55.9 59.3 54.3 56.0 53.7 57.1 37.6 54.0 64.3 48.1 50.0 48.8
Dec '17 59.3 63.2 60.0 57.4 53.9 61.1 40.2 54.3 63.4 53.6 45.7 47.4
Jan '18 57.3 59.6 58.3 56.8 53.3 57.7 35.1 55.0 63.3 49.1 42.9 45.4
Feb '18 56.3 57.8 55.6 57.0 53.9 58.1 42.0 55.9 65.4 54.3 37.6 53.3
Mar '18 56.7 59.1 56.1 56.6 53.3 59.4 36.4 52.1 61.1 54.1 42.1 48.7
Apr '18 56.9 58.6 55.8 57.4 55.0 59.5 37.6 51.3 62.4 52.9 41.4 51.1
May '18 56.5 58.8 54.9 57.5 55.2 58.1 40.1 53.9 61.8 50.8 38.5 55.8
June '18 57.0 59.2 56.2 56.5 55.4 57.7 37.6 53.8 61.9 47.6 38.0 51.1
July '18 56.8 59.0 55.8 56.8 55.0 57.4 39.4 52.3 60.7 51.1 40.7 51.3
Aug '18 57.1 59.3 56.9 55.9 55.5 57.1 39.7 50.1 59.3 50.1 43.1 50.7
Sep '18 56.2 58.4 55.3 56.1 54.9 55.9 37.1 52.4 57.5 49.4 42.2 50.5
13
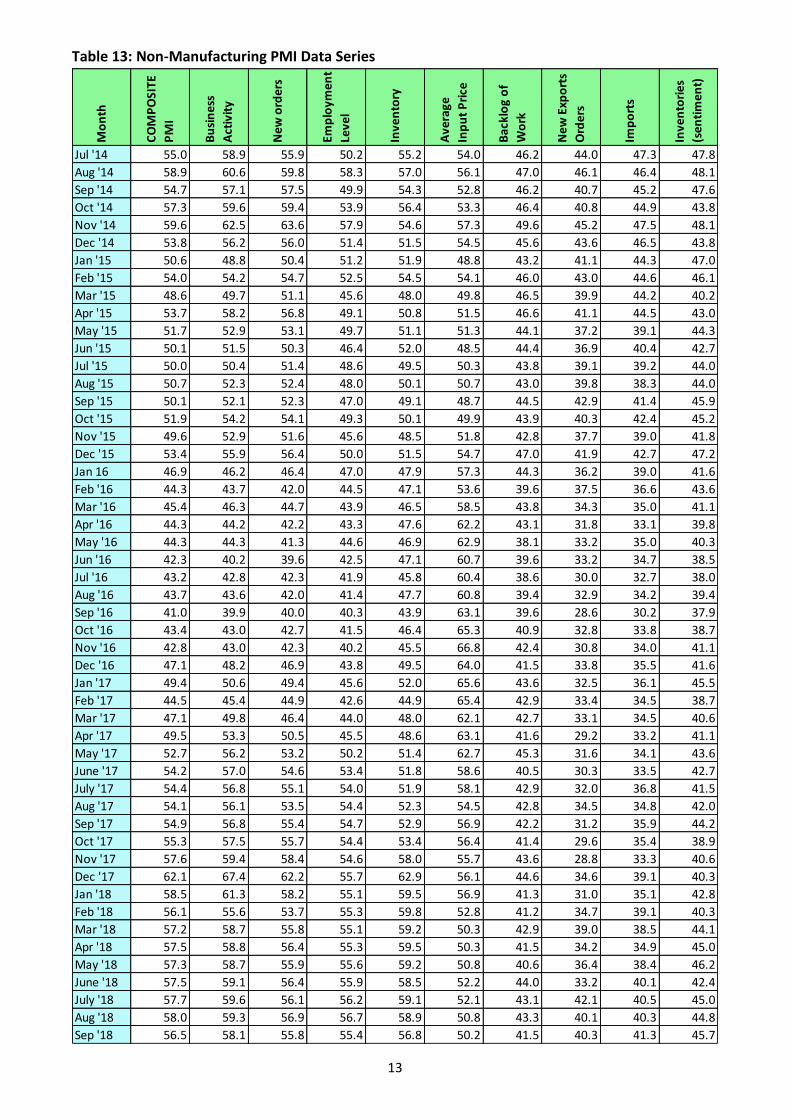
Table 13: Non-Manufacturing PMI Data Series
Mo
nth
CO
MP
OSI
TE
PM
I
Bu
sin
ess
Act
ivit
y
Ne
w o
rde
rs
Emp
loym
en
t
Leve
l
Inve
nto
ry
Ave
rage
Inp
ut
Pri
ce
Bac
klo
g o
f
Wo
rk
Ne
w E
xpo
rts
Ord
ers
Imp
ort
s
Inve
nto
rie
s
(se
nti
me
nt)
Jul '14 55.0 58.9 55.9 50.2 55.2 54.0 46.2 44.0 47.3 47.8
Aug '14 58.9 60.6 59.8 58.3 57.0 56.1 47.0 46.1 46.4 48.1
Sep '14 54.7 57.1 57.5 49.9 54.3 52.8 46.2 40.7 45.2 47.6
Oct '14 57.3 59.6 59.4 53.9 56.4 53.3 46.4 40.8 44.9 43.8
Nov '14 59.6 62.5 63.6 57.9 54.6 57.3 49.6 45.2 47.5 48.1
Dec '14 53.8 56.2 56.0 51.4 51.5 54.5 45.6 43.6 46.5 43.8
Jan '15 50.6 48.8 50.4 51.2 51.9 48.8 43.2 41.1 44.3 47.0
Feb '15 54.0 54.2 54.7 52.5 54.5 54.1 46.0 43.0 44.6 46.1
Mar '15 48.6 49.7 51.1 45.6 48.0 49.8 46.5 39.9 44.2 40.2
Apr '15 53.7 58.2 56.8 49.1 50.8 51.5 46.6 41.1 44.5 43.0
May '15 51.7 52.9 53.1 49.7 51.1 51.3 44.1 37.2 39.1 44.3
Jun '15 50.1 51.5 50.3 46.4 52.0 48.5 44.4 36.9 40.4 42.7
Jul '15 50.0 50.4 51.4 48.6 49.5 50.3 43.8 39.1 39.2 44.0
Aug '15 50.7 52.3 52.4 48.0 50.1 50.7 43.0 39.8 38.3 44.0
Sep '15 50.1 52.1 52.3 47.0 49.1 48.7 44.5 42.9 41.4 45.9
Oct '15 51.9 54.2 54.1 49.3 50.1 49.9 43.9 40.3 42.4 45.2
Nov '15 49.6 52.9 51.6 45.6 48.5 51.8 42.8 37.7 39.0 41.8
Dec '15 53.4 55.9 56.4 50.0 51.5 54.7 47.0 41.9 42.7 47.2
Jan 16 46.9 46.2 46.4 47.0 47.9 57.3 44.3 36.2 39.0 41.6
Feb '16 44.3 43.7 42.0 44.5 47.1 53.6 39.6 37.5 36.6 43.6
Mar '16 45.4 46.3 44.7 43.9 46.5 58.5 43.8 34.3 35.0 41.1
Apr '16 44.3 44.2 42.2 43.3 47.6 62.2 43.1 31.8 33.1 39.8
May '16 44.3 44.3 41.3 44.6 46.9 62.9 38.1 33.2 35.0 40.3
Jun '16 42.3 40.2 39.6 42.5 47.1 60.7 39.6 33.2 34.7 38.5
Jul '16 43.2 42.8 42.3 41.9 45.8 60.4 38.6 30.0 32.7 38.0
Aug '16 43.7 43.6 42.0 41.4 47.7 60.8 39.4 32.9 34.2 39.4
Sep '16 41.0 39.9 40.0 40.3 43.9 63.1 39.6 28.6 30.2 37.9
Oct '16 43.4 43.0 42.7 41.5 46.4 65.3 40.9 32.8 33.8 38.7
Nov '16 42.8 43.0 42.3 40.2 45.5 66.8 42.4 30.8 34.0 41.1
Dec '16 47.1 48.2 46.9 43.8 49.5 64.0 41.5 33.8 35.5 41.6
Jan '17 49.4 50.6 49.4 45.6 52.0 65.6 43.6 32.5 36.1 45.5
Feb '17 44.5 45.4 44.9 42.6 44.9 65.4 42.9 33.4 34.5 38.7
Mar '17 47.1 49.8 46.4 44.0 48.0 62.1 42.7 33.1 34.5 40.6
Apr '17 49.5 53.3 50.5 45.5 48.6 63.1 41.6 29.2 33.2 41.1
May '17 52.7 56.2 53.2 50.2 51.4 62.7 45.3 31.6 34.1 43.6
June '17 54.2 57.0 54.6 53.4 51.8 58.6 40.5 30.3 33.5 42.7
July '17 54.4 56.8 55.1 54.0 51.9 58.1 42.9 32.0 36.8 41.5
Aug '17 54.1 56.1 53.5 54.4 52.3 54.5 42.8 34.5 34.8 42.0
Sep '17 54.9 56.8 55.4 54.7 52.9 56.9 42.2 31.2 35.9 44.2
Oct '17 55.3 57.5 55.7 54.4 53.4 56.4 41.4 29.6 35.4 38.9
Nov '17 57.6 59.4 58.4 54.6 58.0 55.7 43.6 28.8 33.3 40.6
Dec '17 62.1 67.4 62.2 55.7 62.9 56.1 44.6 34.6 39.1 40.3
Jan '18 58.5 61.3 58.2 55.1 59.5 56.9 41.3 31.0 35.1 42.8
Feb '18 56.1 55.6 53.7 55.3 59.8 52.8 41.2 34.7 39.1 40.3
Mar '18 57.2 58.7 55.8 55.1 59.2 50.3 42.9 39.0 38.5 44.1
Apr '18 57.5 58.8 56.4 55.3 59.5 50.3 41.5 34.2 34.9 45.0
May '18 57.3 58.7 55.9 55.6 59.2 50.8 40.6 36.4 38.4 46.2
June '18 57.5 59.1 56.4 55.9 58.5 52.2 44.0 33.2 40.1 42.4
July '18 57.7 59.6 56.1 56.2 59.1 52.1 43.1 42.1 40.5 45.0
Aug '18 58.0 59.3 56.9 56.7 58.9 50.8 43.3 40.1 40.3 44.8
Sep '18 56.5 58.1 55.8 55.4 56.8 50.2 41.5 40.3 41.3 45.7