Embed Size (px)
Citation preview

103INTERSERVE ANNUAL REPORT 2014 FINANCIAL STATEMENTS INdEPENdENT AUdITOR’S REPORT
OVERVIEW
GO
VERNA
NCE
FINA
NCIA
L STATEMEN
TS STRATEG
IC REPORT
Independent auditor’s reportto the members of Interserve Plc
Our opinion on the financial statements is unmodified In our opinion:
• the financial statements give a true and fair view of the state of the Group’s and of the parent company’s affairs as at 31 December 2014 and of the Group’s profit for the year then ended;
• the Group financial statements have been properly prepared in accordance with International Financial Reporting Standards (IFRSs) as adopted by the European Union;
• the parent company financial statements have been properly prepared in accordance with applicable law and United Kingdom Accounting Standards (United Kingdom Generally Accepted Accounting Practice); and
• the financial statements have been prepared in accordance with the requirements of the Companies Act 2006 and, as regards the Group financial statements, Article 4 of the IAS Regulation.
What we have audited:Interserve Plc’s financial statements comprise the Consolidated Income Statement, the Consolidated Statement of Comprehensive Income, the Consolidated and Parent Company Balance Sheets, the Consolidated Statement of Changes in Equity, the Consolidated Cash Flow Statement and the related notes.
The financial reporting framework that has been applied in the preparation of the Group financial statements is applicable law and IFRSs as adopted by the European Union. The financial reporting framework that has been applied in the preparation of the parent company financial statements is United Kingdom Generally Accepted Accounting Practice.
Our assessment of risk Without modifying our opinion, we highlight the following matters that are, in our judgement, likely to be most important to users’ understanding of our audit. Our audit procedures relating to these matters were designed in the context of our audit of the Group financial statements as a whole and not to express an opinion on individual transactions, account balances or disclosures.

Independent auditor’s report continued
104 INTERSERVE ANNUAL REPORT 2014 FINANCIAL STATEMENTS INdEPENdENT AUdITOR’S REPORT
Audit risk How we responded to the riskRevenue recognition and contract accountingSee note 1 on page 116 and pages 70 and 71 of the Audit Committee Report.
Revenue is recognised throughout the Group as the fair value of consideration receivable in respect of provision of services and construction contracts and the rental and sale of equipment. Provision is made for expected contract losses as soon as they are foreseen.
Determining the amount of revenue to be recognised, costs to complete and assessment of any other costs arising, the impact of any changes in scope of work, together with the level of recoverable work-in-progress and receivables requires significant management judgement and estimates.
We therefore identified revenue recognition and contract accounting as a significant risk.
Our audit work included, but was not limited to:
• testing key controls, where applicable, over the recognition of revenue and the allocation of costs to the contracts, including those over contract execution, invoicing, collections, cost approvals and cost allocations;
• selecting a sample of contracts in progress determined by reference to materiality and other risk factors including loss-making contracts and contracts with aged work-in-progress and debtor balances and testing of management’s application of the contractual terms and conditions, recalculating revenue recognised under the percentage of completion method based on costs incurred to date (where applicable) and testing a sample of costs recorded on projects;
• challenging management’s assertion relating to the expected costs to complete by reference to supporting documentation such as customer certifications, forecast models and comparing previous cost estimates against actual results and examining variation and claim agreements;
• rationalising revenues against contracted amounts and reconciled differences to variations that were invoiced during the period;
• testing a sample of revenue items for each stream, covering both hire and sale revenue, agreeing items selected for testing through to supporting documentation;
• reviewing management’s assessment of forward loss provisions recorded on longer term contracts, including challenging management on the judgements inherent within their contract forecasts, understanding the basis for claims revenue projections and projected cost savings, review of historical experience and comparing against expected outcomes; and
• investigating the recovery of trade receivables and work-in-progress balances, by reference to post-balance sheet cash collection, certifications and correspondence from customers, review of subsequent and historical credit notes and examining the Group’s historical experience of recovery.
Acquisition of Initial FacilitiesSee note 12 on page 127 and page 71 of the Audit Committee Report.
On 18 March 2014 the Group acquired the facilities services business of Rentokil Initial Plc for a cash consideration of £245.7 million. As a result of this acquisition, the Group recorded intangible assets and goodwill of £87.8 million and £140.3 million respectively.
Determining the fair value of intangible assets and goodwill arising from the acquisition required fair-value adjustments to be made to the net assets acquired and the application of a valuation model to determine the fair value of the identifiable intangible assets. The valuation model includes certain assumptions which are judgemental in nature including estimates of future revenue, growth rates, customer retention rates and discount rates.
We therefore identified the determination and valuation of the intangible assets and goodwill arising from the acquisition as a significant risk.
Our audit work included, but was not limited to:
• agreeing purchase consideration to purchase agreements and bank accounts;
• testing the validity of a sample of fair-value adjustments made to the opening balance sheet and ensuring the quantum of the adjustments was appropriate;
• testing a sample of acquisition and integration-related costs incurred and ensuring that their accounting treatment and disclosure was appropriate;
• recalculating the valuation of recorded intangible assets, including the benchmarking of valuation assumptions and estimates to industry data and independent review by our own valuation specialists; and
• re-perform the calculation of goodwill recognised on acquisition.
MAC_RF66456_A_P05 tp.indd 104 20/03/2015 11:17

105INTERSERVE ANNUAL REPORT 2014 FINANCIAL STATEMENTS INdEPENdENT AUdITOR’S REPORT
OVERVIEW
GO
VERNA
NCE
FINA
NCIA
L STATEMEN
TS STRATEG
IC REPORT
Audit risk How we responded to the riskGoodwill impairment reviewSee note 13 on page 128 and page 71 of the Audit Committee Report.
The directors are required to make an annual assessment to determine whether the Group’s goodwill, which stands at £401.4 million, including £140.3 million from the Initial acquisition at 31 December 2014, is impaired.
The process for assessing whether an impairment exists under IAS 36 Impairment of assets is complex. The process of determining fair value through a value in use calculation, the forecast cash flows related to cash generating units (CGUs) and the determination of the appropriate discount rate and other assumptions to be applied can be highly judgemental and can significantly impact the results of the impairment review.
We therefore identified the impairment review of goodwill to be a significant risk.
Our audit procedures included, but were not limited to:
• obtaining management’s assessment of the relevant cash generating units used in the impairment calculation and comparing those to our understanding of the business units and operating structure of the Group and recalculating the arithmetical accuracy of those calculations;
• testing the assumptions utilised in the impairment models, including growth rates, discount rates and terminal values. We involved our specialist valuation team to consider whether the assumptions used were appropriate to the relevant CGU’s circumstances and where possible, benchmarked these assumptions against available industry data;
• re-performing the sensitivity analysis performed by management in respect of the key assumptions such as discount and growth rates to ensure the assumptions were not aggressive; and
• testing the accuracy of management’s forecasting through a comparison of budget to actual data and historical variance trends and reviewing the cash flows for exceptional or unusual items or assumptions.
Defined benefit retirement schemes See note 30 on pages 146 to 149 and page 71 of the Audit Committee Report.
The Group has a number of defined benefit pension plans that provide benefits to a significant number of current and former employees. At 31 December 2014 the defined benefit pension scheme net deficit was £4.8 million. The gross value of pension scheme assets and liabilities which form the net deficit amount to £920.1 million and £924.9 million respectively.
The measurement of the liabilities in accordance with IAS 19 (Revised) Employee benefits involves significant judgement and their valuation is subject to complex actuarial assumptions. Small variations in those actuarial assumptions can lead to a materially different value of pension liabilities being recognised within the Group financial statements.
We therefore identified the defined benefit obligation as a significant risk.
Our audit work included, but was not restricted to:
• testing the appropriateness of the valuation methodologies and their inherent actuarial assumptions by benchmarking key assumptions to available market data such as discount rates, growth rates and mortality rates. We also utilised the expertise of our actuarial specialists in order to review the assumptions used and the calculation methods employed in the calculation of the obligation;
• testing the accuracy of underlying membership data utilised by the Group’s actuaries for the purpose of calculating the scheme liabilities by selecting a sample of employees and agreeing pertinent data such as date of birth, gender and date of membership to underlying records; and
• considering the appropriateness of the accounting treatment applied to the buy-in contract as described in note 30 of the financial statements.
Our application of materiality and an overview of the scope of our audit MaterialityWe apply the concept of materiality in planning and performing our audit, in evaluating the effect of any identified misstatements and in forming our opinion. For the purpose of determining whether the financial statements are free from material misstatement, we define materiality as the magnitude of a misstatement or an omission from the financial statements or related disclosures that would make it probable that the judgement of a reasonable person relying on the information would have been changed or influenced by the misstatement or omission. We also determine a level of performance materiality, which we use to determine the extent of testing needed, to reduce to an appropriately low level the probability that the aggregate of uncorrected and undetected misstatements exceeds materiality for the financial statements as a whole.
We determined materiality for the Group financial statements as a whole to be £4.0 million, which is approximately 4 per cent of adjusted profit before tax (excluding exceptional items and amortisation of purchased intangibles), as this is a key performance measure used by the Board of Directors to report to investors on the financial performance of the Group. We set an underlying performance materiality threshold of 70 per cent of Group materiality to direct and focus our audit testing. We chose this threshold
MAC_RF66456_A_P05 tp.indd 105 20/03/2015 11:17

Independent auditor’s report continued
106 INTERSERVE ANNUAL REPORT 2014 FINANCIAL STATEMENTS INdEPENdENT AUdITOR’S REPORT
Our application of materiality and an overview of the scope of our audit continued
Materiality continuedbased on our assessment of the control environment obtained during our risk assessment procedures. The audits undertaken for Group reporting purposes, of the components noted below, were carried out to a materiality level that did not exceed our level of performance materiality.
We agreed with the Audit Committee that we would report to them misstatements above £200,000 identified during our audit, which represents 5 per cent of materiality. We would report misstatements identified below that amount if there were qualitative factors that would warrant the attention of the Audit Committee.
Overview of the scope of our auditOur audit approach was based on a thorough understanding of the Group’s business and is risk-based. An interim visit was conducted before the year end at all significant components of the Group to complete advance substantive audit procedures and to evaluate the Group’s internal controls environment including its IT systems. The components of the Group were evaluated by the group audit team based on a measure of materiality considering each as a percentage of total Group assets, revenues and profit before taxes, to assess the significance of the component and to determine the planned audit response. For those components that were deemed significant, either a full scope or targeted audit approach was determined based on their relative materiality to the Group and our assessment of the audit risk. For significant components requiring a full scope approach we evaluated and tested controls over the financial reporting systems identified as part of our risk assessment, reviewed the accounts production process and addressed critical accounting matters. We sought, wherever possible, to rely on the effectiveness of the Group’s internal controls in order to reduce substantive testing. We then undertook substantive testing on significant transactions and material account balances.
In order to address the audit risks described above as identified during our planning procedures, we performed a full-scope audit of the consolidated financial statements of the parent company, Interserve Plc, and of the Group’s operations throughout the United Kingdom. The operations that were subject to full-scope audit procedures make up 90.7 per cent of total revenues. Statutory audits of subsidiaries are performed to lower materiality where applicable.
While the majority of the operations are located within the United Kingdom, the Group has material operations spanning the globe. Through an analysis of these operations we determined that targeted audit procedures should be carried out in Oman, Qatar, the United Arab Emirates, Ireland, Spain, Saudi Arabia, India, Australia, South Africa, New Zealand, Hong Kong, the Philippines and the United States of America. These targeted procedures addressed the significant risks described above. Those components subjected to targeted audit procedures comprise 8.6 per cent of total revenues.
In total our full scope and targeted procedures covered 99.3 per cent of total revenues and 95.3 per cent of total profit before tax.
The remaining operations of the Group were subjected to analytical procedures over the balance sheet and income statements of the related entities with a focus on applicable risks identified above and the significance to the Group’s balances.
Detailed audit instructions were issued to the auditors of the reporting components where a full scope or targeted audit approach had been identified. The instructions detailed the significant risks that should be addressed through the audit procedures and indicated certain information required to be reported back to the group audit team. The group audit team performed site visits in the United Kingdom, Oman, Qatar and the United Arab Emirates, which included a review of the work performed by the component auditors. Where targeted components outside of the UK were not physically visited a review of working papers was conducted. The group audit team communicated with all component auditors throughout the planning, fieldwork and concluding stages of the local audits.
Other reporting required by regulationOur opinion on other matters prescribed by the Companies Act 2006 is unmodifiedIn our opinion:
• the part of the Directors’ Remuneration Report to be audited has been properly prepared in accordance with the Companies Act 2006; and
• the information given in the Strategic Report and Directors’ Report for the financial year for which the financial statements are prepared is consistent with the financial statements.

107INTERSERVE ANNUAL REPORT 2014 FINANCIAL STATEMENTS INdEPENdENT AUdITOR’S REPORT
OVERVIEW
GO
VERNA
NCE
FINA
NCIA
L STATEMEN
TS STRATEG
IC REPORT
Matters on which we are required to report by exceptionWe have nothing to report in respect of the following:
Under the International Standards on Accounting (UK and Ireland), we are required to report to you if, in our opinion, information in the Annual Report is:
• materially inconsistent with the information in the audited financial statements; or
• apparently materially incorrect based on, or materially inconsistent with, our knowledge of the Group acquired in the course of performing our audit; or
• otherwise misleading.
In particular, we are required to report to you if:
• we have identified any inconsistencies between our knowledge acquired during the audit and the directors’ statement that they consider the Annual Report is fair, balanced and understandable; or
• the Annual Report does not appropriately disclose those matters that were communicated to the Audit Committee which we consider should have been disclosed.
Under the Companies Act 2006 we are required to report to you if, in our opinion:
• adequate accounting records have not been kept by the parent company, or returns adequate for our audit have not been received from branches not visited by us; or
• the parent company financial statements and the part of the Directors’ Remuneration Report to be audited are not in agreement with the accounting records and returns; or
• certain disclosures of directors’ remuneration specified by law are not made; or
• we have not received all the information and explanations we require for our audit.
Under the Listing Rules, we are required to review:
• the directors’ statement, set out on page 47, in relation to going concern; and
• the part of the Corporate Governance statement relating to the Company’s compliance with the ten provisions of the UK Corporate Governance Code specified for our review.
Responsibilities for the financial statements and the auditWhat an audit of financial statements involves:
A description of the scope of an audit of financial statements is provided on the Financial Reporting Council’s website at www.frc.org.uk/auditscopeukprivate.
Our responsibilities and those of the directors:
As explained more fully in the Directors’ Responsibility Statement set out on page 102, the directors are responsible for the preparation of the financial statements and for being satisfied that they give a true and fair view. Our responsibility is to audit and express an opinion on the financial statements in accordance with applicable law and International Standards on Auditing (UK and Ireland). Those standards require us to comply with the Auditing Practices Board’s Ethical Standards for Auditors.
Who we are reporting to:
This report is made solely to the Company’s members, as a body, in accordance with Chapter 3 of Part 16 of the Companies Act 2006. Our audit work has been undertaken so that we might state to the Company’s members those matters we are required to state to them in an auditor’s report and for no other purpose. To the fullest extent permitted by law, we do not accept or assume responsibility to anyone other than the Company and the Company’s members as a body, for our audit work, for this report, or for the opinions we have formed.
Simon Lowe Senior Statutory Auditor for and on behalf of Grant Thornton UK LLP Statutory Auditor, Chartered Accountants London, United Kingdom 26 February 2015

Consolidated income statementfor the year ended 31 December 2014
108 INTERSERVE ANNUAL REPORT 2014 FINANCIAL STATEMENTS CONSOLIdATEd INCOME STATEMENT
Year ended 31 december 2014 Year ended 31 december 2013
Notes
Before exceptional
items and amortisation
of acquired intangible
assets £million
Exceptional items and
amortisation of acquired intangible
assets £million
Total £million
Before exceptional
items and amortisation of acquired intangible
assets £million
Exceptional items and
amortisation of acquired intangible
assets £million
Total £million
Continuing operations
Revenue including share of associates and joint ventures 2 3,305.3 – 3,305.3 2,581.9 – 2,581.9
Less: Share of associates and joint ventures (392.3) – (392.3) (389.3) – (389.3)
Consolidated revenue 2 2,913.0 – 2,913.0 2,192.6 – 2,192.6
Cost of sales (2,583.7) – (2,583.7) (1,927.0) – (1,927.0)
Gross profit 329.3 – 329.3 265.6 – 265.6
Administration expenses (228.7) – (228.7) (196.2) – (196.2)
Amortisation of acquired intangible assets 4 – (24.4) (24.4) – (8.8) (8.8)
Other exceptional items 5 – (19.8) (19.8) – (2.6) (2.6)
Total administration expenses (228.7) (44.2) (272.9) (196.2) (11.4) (207.6)
Loss on disposal of property and investments 5 – – – – (1.5) (1.5)
Operating profit 100.6 (44.2) 56.4 69.4 (12.9) 56.5
Share of result of associates and joint ventures 16 16.6 – 16.6 17.3 – 17.3
Amortisation of acquired intangible assets 4 – (0.1) (0.1) – (0.1) (0.1)
Total share of result of associates and joint ventures 16.6 (0.1) 16.5 17.3 (0.1) 17.2
Total operating profit 117.2 (44.3) 72.9 86.7 (13.0) 73.7
Investment revenue 7 5.0 – 5.0 3.6 – 3.6
Finance costs 8 (16.0) – (16.0) (9.2) – (9.2)
Profit before tax 106.2 (44.3) 61.9 81.1 (13.0) 68.1
Tax (charge)/credit 9 (18.7) 6.7 (12.0) (15.0) 1.9 (13.1)
Profit for the year 87.5 (37.6) 49.9 66.1 (11.1) 55.0
Attributable to:
Equity holders of the parent 83.0 (37.6) 45.4 61.3 (11.1) 50.2
Non-controlling interests 4.5 – 4.5 4.8 – 4.8
87.5 (37.6) 49.9 66.1 (11.1) 55.0
Earnings per share 11
Basic 32.2p 39.1p
diluted 31.7p 38.2p

OVERVIEW
GO
VERNA
NCE
FINA
NCIA
L STATEMEN
TS STRATEG
IC REPORT
Consolidated statement of comprehensive incomefor the year ended 31 December 2014
109INTERSERVE ANNUAL REPORT 2014 FINANCIAL STATEMENTS CONSOLIdATEd STATEMENT OF COMPREhENSIVE INCOME
Notes
Year ended 31 december
2014 £million
Year ended 31 December
2013 £million
Profit for the year 49.9 55.0
Items that will not be reclassified subsequently to profit or loss:
Actuarial (losses)/gains on defined benefit pension schemes 30 (15.7) 21.3
Deferred tax on above items taken directly to equity 9 3.1 (7.3)
(12.6) 14.0
Items that may be reclassified subsequently to profit or loss:
Exchange differences on translation of foreign operations 12.8 (13.0)
Gains on cash flow hedging instruments (excluding joint ventures) 5.6 0.8
Deferred tax on above items taken directly to equity 9 (2.0) 1.3
Net impact of Items relating to joint-venture entities 11.6 2.3
28.0 (8.6)
Other comprehensive income net of tax 15.4 5.4
Total comprehensive income 65.3 60.4
Attributable to:
Equity holders of the parent 60.7 55.7
Non-controlling interests 4.6 4.7
65.3 60.4

Consolidated balance sheetat 31 December 2014
110 INTERSERVE ANNUAL REPORT 2014 FINANCIAL STATEMENTS CONSOLIdATEd BALANCE ShEET
Notes
31 december 2014
£million
31 December 2013
£million
31 December 2012
£million
Non-current assetsGoodwill 13 401.4 248.0 226.3
Other intangible assets 14 123.1 38.6 39.5
Property, plant and equipment 15 195.3 155.9 137.8
Interests in joint-venture entities 16/32 42.7 20.6 7.6
Interests in associated undertakings 16 77.2 73.9 76.6
Deferred tax asset 17 - 21.0 33.5
839.7 558.0 521.3
Current assetsAssets classified as held for sale 16 - - 51.2
Inventories 18 48.6 30.7 24.6
Trade and other receivables 20 679.4 486.1 432.0
Cash and deposits 21 82.1 79.7 76.8
810.1 596.5 584.6
Total assets 1,649.8 1,154.5 1,105.9
Current liabilitiesBank overdrafts 21 (5.5) (27.4) (19.8)
Trade and other payables 23 (748.7) (592.3) (555.5)
Current tax liabilities (1.0) (5.3) (4.2)
Short-term provisions 26 (29.2) (18.1) (24.2)
(784.4) (643.1) (603.7)
Net current assets/(liabilities) 25.7 (46.6) (19.1)
Non-current liabilitiesBorrowings 21 (344.7) (90.0) (30.0)
Trade and other payables 24 (14.8) (13.5) (13.2)
Long-term provisions 26 (19.5) (29.9) (27.1)
Retirement benefit obligation 30 (4.8) (7.7) (101.1)
Deferred tax liabilities 17 (2.0) - -
(385.8) (141.1) (171.4)
Total liabilities (1,170.2) (784.2) (775.1)
Net assets 479.6 370.3 330.8
Equity Share capital 27 14.4 12.9 12.7
Share premium account 115.3 115.0 113.1
Capital redemption reserve 0.1 0.1 0.1
Merger reserve 121.4 49.0 49.0
Hedging and revaluation reserve 19.5 2.4 (0.7)
Translation reserve 35.0 22.3 35.2
Investment in own shares (3.0) (2.9) (1.4)
Retained earnings 165.3 161.6 116.5
Equity attributable to equity holders of the parent 468.0 360.4 324.5
Non-controlling interests 11.6 9.9 6.3
Total equity 479.6 370.3 330.8
These financial statements were approved by the Board of Directors on 26 February 2015. Signed on behalf of the Board of Directors
A M Ringrose T P haywood director director

OVERVIEW
GO
VERNA
NCE
FINA
NCIA
L STATEMEN
TS STRATEG
IC REPORT
Consolidated statement of changes in equityat 31 December 2014
111INTERSERVE ANNUAL REPORT 2014 FINANCIAL STATEMENTS CONSOLIdATEd STATEMENT OF ChANGES IN EqUITY
Share capital
£million
Share premium £million
Capital redemption
reserve £million
Merger reserve1 £million
hedging and
revaluation reserve2 £million
Translation reserve £million
Investment in own shares3
£million
Retained earnings £million
Attributable to equity
holders of the parent
£million
Non- controlling
interests £million
Total £million
Balance at 1 January 2013 12.7 113.1 0.1 49.0 (0.7) 35.2 (1.4) 116.5 324.5 6.3 330.8
Profit for the year – – – – – – – 50.2 50.2 4.8 55.0
Other comprehensive income – – – – 3.1 (12.9) – 15.3 5.5 (0.1) 5.4
Total comprehensive income – – – – 3.1 (12.9) – 65.5 55.7 4.7 60.4
Dividends paid – – – – – – – (26.2) (26.2) (2.9) (29.1)
Shares issued 0.2 1.9 – – – – – – 2.1 – 2.1
Acquisition – – – – – – – – – 1.8 1.8
Purchase of Company shares – – – – – – (2.7) – (2.7) – (2.7)
Company shares used to settle share-based payment obligations – – – – – – 1.2 (0.5) 0.7 – 0.7
Share-based payments – – – – – – – 6.3 6.3 – 6.3
Transactions with owners 0.2 1.9 – – – – (1.5) (20.4) (19.8) (1.1) (20.9)
Balance at 31 december 2013 12.9 115.0 0.1 49.0 2.4 22.3 (2.9) 161.6 360.4 9.9 370.3
Profit for the year – – – – – – – 45.4 45.4 4.5 49.9
Other comprehensive income – – – – 17.1 12.7 – (14.5) 15.3 0.1 15.4
Total comprehensive income – – – – 17.1 12.7 – 30.9 60.7 4.6 65.3
Dividends paid – – – – – – – (31.5) (31.5) (2.9) (34.4)
Shares issued 1.5 0.3 – 72.4 – – – – 74.2 – 74.2
Purchase of Company shares – – – – – – (1.3) – (1.3) – (1.3)
Company shares used to settle share-based payment obligations – – – – – – 1.2 (0.1) 1.1 – 1.1
Share-based payments – – – – – – – 4.4 4.4 – 4.4
Transactions with owners 1.5 0.3 – 72.4 – – (0.1) (27.2) 46.9 (2.9) 44.0
Balance at 31 december 2014 14.4 115.3 0.1 121.4 19.5 35.0 (3.0) 165.3 468.0 11.6 479.6
On 5 March 2014, 12,897,771 ordinary shares were issued and placed at a price of 580p per share. The net proceeds after costs were £73.7 million. The placing utilised a structure whereby a special-purpose entity issued redeemable preference shares in consideration for the receipt of the cash proceeds (net of issue costs) arising from the placing. The Company’s ordinary shares were issued as consideration for the transfer to it of the shares, which it did not already own, in the special-purpose entity. As a result, in the opinion of the directors, the placing qualified for merger relief under section 612 of the Companies Act 2006 so that the £72.4 million excess of the value of the acquired shares in the special-purpose entity over the nominal value of the ordinary shares issued by the Company was credited to the Company’s merger reserve.
1 The £121.4 million merger reserve represents £16.4 million premium on the shares issued on the acquisition of Robert M. Douglas Holdings Plc in 1991, £32.6 million premium on the shares issued on the acquisition of MacLellan Group Plc in 2006 and £72.4 million premium on the shares placed to partially fund the acquisition of Initial Facilities during the period.
2 The hedging and revaluation reserve includes £27.6 million relating to the revaluation of available-for-sale financial assets within the joint ventures (2013: £6.5 million).
3 The investment in own shares reserve represents the cost of shares in Interserve Plc held by the trustees of the How Group, Bandt and Interserve Employee Benefit Trusts. The market value of these shares at 31 December 2014 was £4.8 million (2013: £5.3 million).

Consolidated cash flow statement for the year ended 31 December 2014
112 INTERSERVE ANNUAL REPORT 2014 FINANCIAL STATEMENTS CONSOLIdATEd CASh FLOw STATEMENT
Notes
Year ended 31 december
2014 £million
Year ended 31 December
2013 £million
Operating activities
Total operating profit 72.9 73.7
Adjustments for:
Amortisation of acquired intangible assets 14 24.4 8.8
Amortisation of capitalised software development 14 3.7 1.9
Depreciation of property, plant and equipment 15 35.6 31.9
(Profit)/loss on disposal of property and investments 5 - 1.5
Other non-cash exceptional items 5 1.4 0.5
Pension contributions in excess of the income statement charge (18.2) (18.5)
Share of results of associates and joint ventures (16.5) (17.2)
Charge relating to share-based payments 29 3.4 5.5
Gain on disposal of plant and equipment - hire fleet (12.1) (13.4)
Gain on disposal of plant and equipment - other (0.1) –
Operating cash flows before movements in working capital 94.5 74.7
Increase in inventories (13.4) (4.5)
Increase in receivables (73.6) (14.6)
Increase/(decrease) in payables 33.7 (0.6)
Cash generated by operations before changes in hire fleet 41.2 55.0
Capital expenditure - hire fleet 15 (47.0) (29.8)
Proceeds on disposal of plant and equipment - hire fleet 16.7 18.0
Cash generated by operations 10.9 43.2
Taxes paid (10.2) (5.7)
Net cash from operating activities 0.7 37.5
Investing activities
Interest received 4.7 3.5
Dividends received from associates and joint ventures 16a 17.8 13.7
Proceeds on disposal of plant and equipment - non-hire fleet 0.9 0.2
Capital expenditure - non-hire fleet 14/15 (24.9) (22.1)
Purchase of businesses 12 (243.7) (49.1)
Investment in joint-venture entities 16b (10.4) (10.6)
Costs of disposal of investments 5 - (0.2)
Receipt of loan repayment - Investments 16b 0.3 -
Net cash used in investing activities (255.3) (64.6)
Financing activities
Interest paid (16.0) (7.8)
Dividends paid to equity shareholders 10 (31.5) (26.2)
Dividends paid to minority shareholders (2.9) (2.9)
Proceeds from issue of shares and exercise of share options 75.2 3.3
Purchase of own shares (1.3) (2.7)
Proceeds from US private placement 207.2 -
Increase in bank loans 47.5 60.0
Movement in obligations under finance leases (0.1) (0.3)
Net cash from financing activities 278.1 23.4

113INTERSERVE ANNUAL REPORT 2014 FINANCIAL STATEMENTS CONSOLIdATEd CASh FLOw STATEMENT
OVERVIEW
GO
VERNA
NCE
FINA
NCIA
L STATEMEN
TS STRATEG
IC REPORT
Notes
Year ended 31 december
2014 £million
Year ended 31 December
2013 £million
Net increase/(decrease) in cash and cash equivalents 23.5 (3.7)
Cash and cash equivalents at beginning of period 52.3 57.0
Effect of foreign exchange rate changes 0.8 (1.0)
Cash and cash equivalents at end of period 76.6 52.3
Cash and cash equivalents comprise
Cash and deposits 82.1 79.7
Bank overdrafts (5.5) (27.4)
76.6 52.3
Reconciliation of net cash flow to movement in net debt
Net increase/(decrease) in cash and cash equivalents 23.5 (3.7)
Proceeds from US private placement (207.2) -
Increase in bank loans (47.5) (60.0)
Movement in obligations under finance leases 0.1 0.3
Change in net debt resulting from cash flows (231.1) (63.4)
Effect of foreign exchange rate changes 0.8 (1.0)
Movement in net debt during the period (230.3) (64.4)
Net cash/(debt) - opening (38.6) 25.8
Net cash/(debt) - closing (268.9) (38.6)

Notes to the consolidated financial statementsfor the year ended 31 December 2014
114 INTERSERVE ANNUAL REPORT 2014 FINANCIAL STATEMENTS NOTES TO ThE CONSOLIdATEd FINANCIAL STATEMENTS
1. Basis of preparation and accounting policies
Basis of preparation
The Interserve Plc consolidated financial statements have been prepared in accordance with International Financial Reporting Standards (“IFRS”) and comply with the IFRS and related interpretations (SIC and IFRIC interpretations) as adopted by the European Union.
(a) Adoption of new and revised standards
In the current year, the following new and revised standards and interpretations have been adopted and affected the amounts reported in these financial statements:
IFRS 10 Consolidated financial statements IFRS 11 Joint arrangementsIFRS 12 Disclosures of interests in other entitiesIAS 27 Separate financial statementsIAS 28 Investments in associates and joint venturesIAS 32 Offsetting financial assets and financial liabilities IAS 39 Novation of derivatives and continuation of hedge accounting
These do not materially impact the Group.
At the date of authorisation of these Group financial statements, the following standards and interpretations were in issue but not yet effective, and therefore have not been applied in these Group financial statements:
IFRS 9 Financial instrumentsThe impact of the sections of IFRS 9 currently issued will result in the Group’s project finance interests that are currently treated by the joint-venture companies as being available-for-sale, being treated as a debt carried at “fair value through profit or loss” or “amortised cost”. As a result, movements in the fair value will no longer be taken to “Other comprehensive income”.
IFRS 15 Revenue from contracts with customersThe new standard will replace IAS 18 Revenue and IAS 11 Construction contracts. It will become effective for accounting periods on or after 1 January 2017, at the earliest. In advance of its adoption, the Group will conduct a systematic review of all existing major contracts to ensure that the impact and effect of the new standard is fully understood, and changes to the current accounting procedures are highlighted and acted upon.
Except for IFRS 9 and IFRS 15 noted above, the directors do not currently anticipate that the adoption of any other standard and interpretation that has been issued but is not yet effective will have a material impact on the financial statements of the Group in future periods.
(b) Critical accounting judgements and key sources of estimation and uncertainty
In the preparation of the consolidated financial statements management makes certain judgements and estimates that impact the financial statements. While these judgements are continually reviewed the facts and circumstances underlying these judgements may change resulting in a change to the estimates that could impact the results of the Group. In particular:
Revenue and margin recognitionThe policy for revenue recognition on long-term and service contracts is set out in notes 1(d) and (e). Judgements are made on an ongoing basis with regard to the recoverability of amounts due, liabilities arising and the requirement for forward loss provisions. Regular forecasts are compiled on the outcomes of these types of contracts, which require assessments and judgements relating to the recovery of pre-contract costs, changes in work scopes, contract programmes and maintenance liabilities.
PFI financial assets and derivative financial instrumentsThe Group’s interests in PFI/PPP investments are classified as “available-for-sale” financial assets by the joint-venture entities. The fair value of these financial assets is measured at each balance sheet date by discounting the future cash flows allocated to the financial asset. The discount rate used is based on long-term LIBOR plus a margin to reflect the risk associated with each project.
The Group’s PFI/PPP joint-venture and associate companies use derivative financial instruments to manage the interest rate risk to which the concessions are exposed within their long-term contractual agreements. These derivatives are initially recognised as assets and liabilities at their fair value and subsequently remeasured at each balance sheet date at their fair value. The fair value of derivatives, assessed by discounting future cash flows, constantly changes in response to prevailing market conditions.
Measurement of impairment of goodwill and intangible assetsAs set out in notes 1(b) and (h) the carrying value of goodwill and intangible assets is reviewed for impairment at least annually. In determining whether goodwill is impaired an estimation of the value in use of the cash generating unit (CGU) to which the goodwill has been allocated is required. This calculation of value in use requires estimates to be made relating to the timing and amount of future cash flows expected from the CGU, and suitable discount rates based on the Group’s weighted average cost of capital adjusted to reflect the specific economic environment of the relevant CGU.

115INTERSERVE ANNUAL REPORT 2014 FINANCIAL STATEMENTS NOTES TO ThE CONSOLIdATEd FINANCIAL STATEMENTS
OVERVIEW
GO
VERNA
NCE
FINA
NCIA
L STATEMEN
TS STRATEG
IC REPORT
Retirement benefit obligationsIn accordance with IAS 19 Employee benefits, the Group has disclosed in note 30 the assumptions used in calculating the defined benefit obligations. In the calculation a number of assumptions around future salary increases, increase in pension benefits, mortality rates, inflation and discount rates have been made. Small changes in these assumptions can lead to significant changes to the overall scheme liabilities, as disclosed in note 30. Judgement is also exercised in establishing the fair value of retirement benefit assets, most notably the valuation of the buy-in contract to insure some of the benefits of a subset of the pension membership of the Scheme provided by the insurer.
Property, plant and equipmentThe rental fleet in Equipment Services has a significant carrying value (see note 15). The great majority of equipment in the rental fleet is depreciated on a straight-line basis to a residual value of zero over 10 years. Asset lives are reviewed regularly in light of technological change, prospective utilisation and the physical condition of the assets. Due to the transportable nature of the rental fleet, the review for potential impairment is performed on a global basis.
Carrying value of trade and other receivables Allowance for doubtful debt and provisions against other receivables, including amounts due on construction contracts and carrying value of accrued income, are made on a specific basis, based on estimates of irrecoverability determined by market knowledge and past experience.
Acquisition accountingA number of judgements and estimates are necessary in establishing the opening net asset position, fair-value adjustments and the value of intangible assets in respect of businesses acquired. These include estimates of future revenue, growth rates, customer retention rates and discount rates.
Accounting policies
Interserve Plc (the Company) is a company incorporated in the United Kingdom and bound by the Companies Act 2006. The consolidated financial statements comprise the Company and its subsidiaries (together referred to as the Group) and the Group’s interest in joint ventures and associates. These financial statements are presented in pounds sterling which is the currency of the primary economic environment in which the Group operates. Foreign operations are included in accordance with the policies set out below.
These financial statements have been prepared on a historical cost basis, except for the revaluation of certain financial instruments.
The financial statements are prepared on a going concern basis. As disclosed on page 47 the directors believe that the Group has adequate resources to continue in operational existence for the foreseeable future.
The significant accounting policies adopted by the directors are set out below and have been applied consistently in dealing with items which are considered material to the Group’s financial statements.
(a) Basis of consolidation
The Group financial statements incorporate the financial statements of the Company and entities controlled by the Company (its subsidiaries). The results, assets and liabilities of associates and joint-venture entities are accounted for under the equity method of accounting. The results of subsidiaries acquired or disposed of during the year are included from the effective date of acquisition or until the effective date of disposal respectively.
Non-controlling interests in the net assets of the consolidated subsidiaries are identified separately from the Group’s equity interest therein. Non-controlling interests consist of those interests at the date of the original business combination and the minority’s share of the changes in equity since the date of the combination.
All intra-group transactions, balances, income and expenses are eliminated on consolidation.
Where necessary, adjustments are made to the financial statements of the associates, joint ventures and any newly acquired subsidiaries to bring their accounting policies into line with those used by the Group. When an entity has an accounting reference date other than 31 December, due to the influence of a co-shareholder or customer requirements, the consolidation includes management accounts, prepared using these Group accounting policies, drawn up for the year ended 31 December.
Where a Group company is party to a jointly-controlled operation, that company proportionately accounts for its share of the income and expenditure, assets, liabilities and cash flows on a line-by-line basis. Such arrangements are reported in the consolidated financial statements on the same basis.

Notes to the consolidated financial statements continued
116 INTERSERVE ANNUAL REPORT 2014 FINANCIAL STATEMENTS NOTES TO ThE CONSOLIdATEd FINANCIAL STATEMENTS
1. Basis of preparation and accounting policies continued
(b) Business combinations
Business combinations are accounted for using the acquisition accounting method. The cost of the acquisition is measured at the aggregate of the fair values, at the date of acquisition, of assets given, liabilities incurred or assumed and equity instruments issued by the Group in exchange for control of the acquired company. The acquired company’s identifiable assets, liabilities and contingent liabilities are recognised at their fair value as at the acquisition date. Before the adoption of IFRS 3 (revised), the cost of acquisition included any costs directly attributable to the business combination. Costs incurred on acquisitions completed since 1 January 2010, the date of adoption of the revision to IFRS 3, are expensed.
Goodwill arising on consolidation represents the excess of the cost of acquisition over the Group’s interest in the fair value of the identifiable assets and liabilities of a subsidiary at the date of acquisition. Goodwill is recognised as an asset and reviewed for impairment at least annually. Any impairment is recognised immediately in the income statement and is not subsequently reversed.
On disposal of a subsidiary, associate or jointly-controlled entity, the attributable amount of goodwill is included in the determination of the profit or loss on disposal.
Goodwill arising on acquisitions before the date of transition to IFRS has been retained at the previous UK GAAP value at that date, subject to being subsequently tested for impairment. Goodwill written off to reserves under UK GAAP prior to 1998 has not been reinstated and is not included in determining any subsequent profit or loss on disposal. Goodwill arising on the acquisition of shares in associated undertakings is included within investments in associated undertakings.
The interest of minority shareholders in the acquired company is initially measured at the minorities’ proportion of the net fair value of the assets, liabilities and contingent liabilities recognised.
(c) Foreign currency
Transactions denominated in foreign currency are translated at the rates ruling at the dates of the transactions.
Monetary assets and liabilities denominated in foreign currencies at the balance sheet date are translated at the rates ruling at that date. These translation differences are dealt with in the profit for the year.
The financial results and cash flows of foreign subsidiaries, associated undertakings and joint ventures are translated into sterling at the average rate of exchange for the year. The balance sheets are translated into sterling at the closing rate of exchange, and the difference arising from the translation of the opening net assets and financial results for the year at the closing rate is taken directly to reserves.
(d) Revenue
Revenue is measured at the fair value of the consideration received or receivable for goods and services provided, net of trade discounts, value added and similar sales-based taxes, after eliminating revenue within the Group.
Revenue is recognised as follows:
• Construction contracts - by reference to services performed to date as a percentage of total services to be performed (see note 1(e))
• Service contracts – the value of work carried out during the year as services are provided, including amounts not invoiced
• Equipment sales – at the time of delivery
• Equipment hire – on a straight-line basis over the hire period in accordance with contractual arrangements
(e) Contract accounting
Where the outcome of a contract can be estimated reliably, revenue and costs are recognised by reference to the stage of completion of the contract activity at the balance sheet date (determined by surveys of work performed by quantity surveyors in conjunction with clients). Where the outcome of a contract cannot be estimated reliably, revenue is only recognised to the extent that it is probable that it will be recoverable. Profit is only recognised on a construction contract when the final outcome can be assessed with reasonable certainty. Expected losses are recognised immediately.

117INTERSERVE ANNUAL REPORT 2014 FINANCIAL STATEMENTS NOTES TO ThE CONSOLIdATEd FINANCIAL STATEMENTS
OVERVIEW
GO
VERNA
NCE
FINA
NCIA
L STATEMEN
TS STRATEG
IC REPORT
(f) Other intangible assets
Intangible assets acquired as part of an acquisition of a business are stated at fair value less accumulated amortisation and any impairment losses, provided that the fair value can be measured reliably on initial recognition.
Operating software acquired as part of a related item of hardware is capitalised within property, plant and equipment along with the hardware acquired. Other software licences acquired are capitalised, along with the cost to bring the software into use, within intangible assets.
Other intangible assets are amortised over their useful economic lives on a straight-line basis, typically between three and ten years.
(g) Property, plant and equipment
(i) Owned property, plant and equipment - tangible fixed assets are carried at historical cost less any accumulated depreciation and any impairment losses. Properties in the course of construction are carried at cost less any recognised impairment loss. Depreciation is charged so as to write off the cost of assets over their expected useful lives.
Depreciation is provided on a straight-line or reducing-balance basis at rates ranging between:
Straight line Reducing balance Freehold land Nil – Freehold buildings 2% to 7% – Leasehold property over the period of the lease – Plant and equipment 10% to 50% 11.5% to 38%
(ii) Property, plant and equipment held under finance leases are capitalised and depreciated over their expected useful lives. The finance charges are allocated over the primary period of the lease in proportion to the capital element outstanding.
(h) Impairment of tangible and other intangible assets
The Group reviews, at least annually, the carrying amounts of its tangible and intangible assets compared to their recoverable amounts to determine whether those assets have suffered an impairment loss (see note 13). Where an impairment loss subsequently reverses, the carrying amount of the asset is increased to the revised estimate of its recoverable amount, but so that the increased carrying amount does not exceed the carrying amount that would have been determined had no impairment loss been recognised for the asset in prior years.
(i) Investments
Investments are held at fair value at the balance sheet date. Investments are financial assets and are classified as fair value through the profit or loss. Gains or losses arising from the changes in fair value are included in the income statement in the period in which they arise.
(j) Inventories
Inventories are stated at the lower of cost and net realisable value. The cost of inventories is calculated using the weighted average method. Net realisable value represents the estimated selling price less all estimated costs of completion and costs to be incurred in marketing, selling and distribution.
(k) Borrowing costs
Project-specific finance costs are capitalised until the asset becomes operational. All other borrowing costs are recognised in the income statement using the effective interest method.
(l) PFI bid costs and other pre-contract costs
In the case of PFI bid costs, on financial close of the project the Group recovers bid costs by charging a fee to the relevant project company. If the fee exceeds the amount held by the Group as an asset, the excess is credited to the balance sheet as deferred income and is released to the income statement over the construction and early start-up period. If the agreed fee is less than the amount held by the Group as an asset, the loss is recognised as soon as it is anticipated.
Other pre-contract costs are recognised as expenses as incurred, except that directly attributable costs are recognised as an asset when it is virtually certain that a contract will be obtained and the contract is expected to result in future net cash inflows. Virtual certainty of a contract award is a subjective assessment, but normally arises on appointment as preferred bidder or notification from the prospective customer of their intent to appoint Interserve.

Notes to the consolidated financial statements continued
118 INTERSERVE ANNUAL REPORT 2014 FINANCIAL STATEMENTS NOTES TO ThE CONSOLIdATEd FINANCIAL STATEMENTS
1. Basis of preparation and accounting policies continued
(m) Leases
Leases are classified as finance leases whenever the terms of the lease transfer substantially all risks and rewards of ownership to the lessee. All other leases are classified as operating leases.
Finance leases are capitalised at the inception of the lease at the fair value of the leased property or, if lower, at the present value of the minimum lease payments. Lease payments are apportioned between the finance charges and the reduction of the lease liability so as to achieve a constant rate of interest on the remaining balance of the liability. Finance charges are reflected in the income statement.
Operating lease payments are recognised as an expense in the income statement on a straight-line basis over the lease term.
(n) Provisions
Provisions are recognised when the Group has a present obligation (legal or constructive) as a result of a past event, it is probable that an outflow of resources embodying economic benefits will be required to settle the obligation and a reliable estimate can be made of the amount of the obligation. The expense relating to any provision is presented in the income statement net of any reimbursement. If the effect of the time value of money is material, provisions are discounted using an appropriate rate that takes into account the risks specific to the liability. Where discounting is used, the increase in the provision due to the passage of time is recognised as a finance cost.
(o) Financial instruments
Trade receivablesTrade receivables are initially measured at fair value. Appropriate allowances for estimated irrecoverable amounts are recognised in the income statement where there is objective evidence that the asset is impaired. Trade receivables are financial assets and classified as loans and receivables.
Cash and depositsCash and deposits comprise cash on hand and demand deposits and other short-term, highly liquid investments that are readily convertible to a known amount of cash and are subject to an insignificant risk of changes in value. Cash and deposits are financial assets and are classified as loans and receivables.
BorrowingsInterest-bearing bank loans and overdrafts are recorded at the proceeds received, net of direct issue costs. Finance charges, including premiums payable on settlement or redemption and direct issue costs, are accounted for on an accruals basis in the income statement and are added to the carrying amount of the instrument to the extent that they are not settled in the period in which they arise. Borrowings are measured at amortised cost.
Trade payablesTrade payables are other financial liabilities initially measured at fair value and subsequently measured at amortised cost using the effective interest rate method.
Equity instrumentsEquity instruments issued by the Company are recorded at the proceeds received, net of direct issue costs.
derivative financial instruments and hedge accountingFinancial assets and financial liabilities are recognised on the Group’s balance sheet when the Group becomes a party to the contractual provisions of the instrument.
Transactions in derivative financial instruments are for risk management purposes only. The Group uses derivative financial instruments to hedge its exposure to interest rate and foreign currency risk. To the extent that such instruments are matched to underlying assets or liabilities, they are accounted for using hedge accounting.
Derivatives are initially recognised at fair value at the date a derivative contract is taken out and subsequently remeasured at fair value at each balance sheet date. Changes in fair value of derivative instruments that are designated as, and effective as, hedges of future cash flows and net investments are recognised directly in the other comprehensive income statement. Any ineffective portion is recognised immediately in the income statement.
Amounts deferred in equity are recycled through the income statement in the same period in which the underlying hedged item is recognised in the income statement. However, when the transaction that is being hedged results in a non-financial asset or non-financial liability, the gains and losses previously accumulated in equity are transferred from equity and included in the initial measurement of the cost of that asset or liability. Hedge accounting is discontinued when the hedging instrument expires or is sold, terminated, or exercised, or no longer qualifies for hedge accounting. Any cumulative gain or loss on the hedging instrument recognised in equity at that time is retained in equity until the forecast transaction occurs. If a hedged transaction is no longer expected to occur, any cumulative gain or loss recognised in equity is transferred to the income statement for the period.

119INTERSERVE ANNUAL REPORT 2014 FINANCIAL STATEMENTS NOTES TO ThE CONSOLIdATEd FINANCIAL STATEMENTS
OVERVIEW
GO
VERNA
NCE
FINA
NCIA
L STATEMEN
TS STRATEG
IC REPORT
Changes in fair value of derivative instruments that do not qualify for hedge accounting, or have not been designated as hedges, are recognised in the income statement as they arise. These derivative instruments are designated as fair value through the profit or loss (FVTPL).
Derivatives embedded in other financial instruments or other host contracts are treated as separate derivatives when their economic risks and characteristics are not closely related to those of the host contracts and the host contracts are not carried at fair value.
(p) Share-based payments
The Group has applied the requirements of IFRS 2 Share-based payment.
The Group issues share-based payments to certain employees. The fair value determined at the grant date is expensed on a straight-line basis over the vesting period, based on the Group’s estimate of shares that will eventually vest. Fair value is measured by use of an appropriate valuation model. The Black-Scholes option pricing model has been used to value the share option plans and the Sharesave Scheme. A stochastic model has been used to value the Performance Share Plan.
(q) PFI projects
Treatment on consolidationThe Group’s investments in PFI jointly-controlled entities (“Joint ventures - PFI Investments”) are accounted for under the equity method.
Treatment in the underlying joint-venture entityThe joint-venture entities have determined the appropriate treatment of the principal assets of, and income streams from, PFI and similar contracts. The balance of risks and rewards derived from the underlying assets is not borne by the entities, and therefore the asset provided is accounted for as a financial asset and is classified as available-for-sale.
Income is recognised on PFI projects both as operating revenue and interest income: a proportion of total cash receivable is allocated to operating revenue by means of a margin on service costs taking account of operational risks, and interest income on the financial asset is recognised in the income statement using the effective interest method. The residual element is allocated to the amortisation of the financial asset.
The fair value of the financial asset is measured at each balance sheet date by computing the discounted future value of the cash flow allocated to the financial asset. Discount rates are determined using long-term interest rates, subject to a floor, plus risk factors specific to individual projects.
Gains and losses arising from changes in the fair value of available-for-sale financial assets are recognised directly in equity until the asset is disposed of or is determined to be impaired, at which time the cumulative gain or loss previously recognised in equity is included in the income statement for the period.
(r) Pensions
The Group has both defined benefit and defined contribution pension schemes for the benefit of permanent members of staff. For the defined benefit schemes the cost of providing benefits is determined using the projected unit credit method, with actuarial valuations being carried out at each balance sheet date.
Actuarial gains and losses are recognised in full in the period in which they occur. They are recognised directly in equity and presented in the statement of recognised income and expense.
For defined contribution schemes, the amount recognised in the income statement is equal to the contributions payable to the schemes during the year.
(s) Taxation
Current tax is provided at amounts expected to be paid (or recovered) using the tax rates and laws that have been enacted or substantively enacted by the balance sheet date. Deferred tax assets and liabilities are calculated at the rates at which they are likely to reverse in the tax jurisdiction to which they relate.
Deferred tax is provided in full on temporary differences which arise between the carrying value of an asset or liability and its tax base. Deferred tax assets are recognised to the extent that it is probable that there will be sufficient profits in the future to enable the assets to be utilised and reviewed at least annually. Deferred tax liabilities are normally recognised for all taxable temporary differences. Deferred tax assets and liabilities are not discounted.
Deferred tax is charged/credited to the income statement except to the extent that the underlying asset or liability is credited/charged to equity in which case the deferred tax follows that treatment to equity.
Deferred tax assets and liabilities are offset when there is a legally enforceable right to set off current tax assets against current tax liabilities and when they relate to income taxes levied by the same taxation authority and the Group intends to settle its current tax assets and liabilities on a net basis.

Notes to the consolidated financial statements continued
120 INTERSERVE ANNUAL REPORT 2014 FINANCIAL STATEMENTS NOTES TO ThE CONSOLIdATEd FINANCIAL STATEMENTS
1. Basis of preparation and accounting policies continued
(t) Exceptional items
Exceptional items are those that the Group consider to be non-recurring and significant in size or in nature. Exceptional items include: profit on disposals of PFI investments and related costs; and transaction and integration costs relating to the acquisition of businesses.
(u) Assets classified as held for sale
Assets (and disposal groups) classified as held for sale are measured at the lower of carrying amount and fair value less costs to sell.
Assets and disposal groups are classified as held for sale if their carrying amount will be recovered through a sale transaction rather than continuing for use. This condition is regarded as met only when the sale is highly probable and the asset (or disposal group) is available for immediate sale in its present condition. Management must be committed to the sale which should be expected to qualify for recognition as a completed sale within one year from the date of classification.
2. Revenue
An analysis of the Group’s revenue for the year is as follows:
Revenue including share of associates and joint
ventures Consolidated revenue
2014 £million
2013 £million
2014 £million
2013 £million
Continuing operations
Provision of services 1,913.3 1,395.3 1,758.8 1,248.8
Revenue from construction contracts 1,176.3 1,002.2 938.5 759.4
Equipment sales and leasing income 215.7 184.4 215.7 184.4
3,305.3 2,581.9 2,913.0 2,192.6
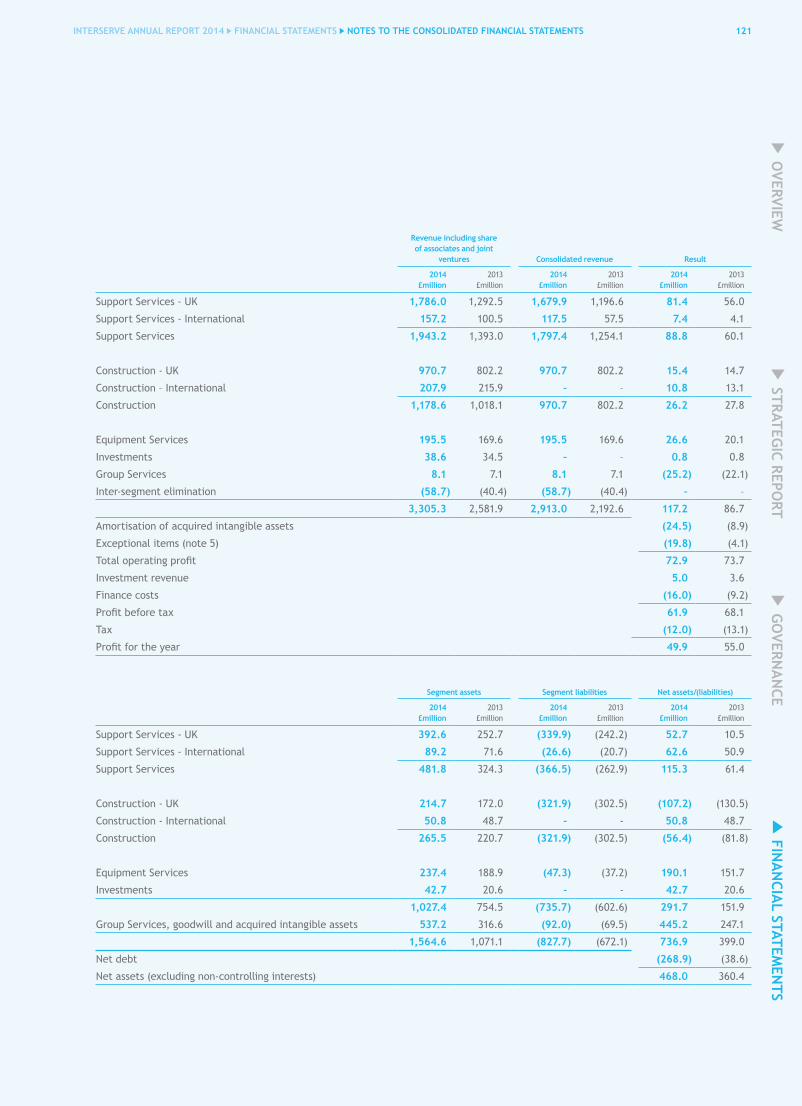
3. Business and geographical segments
(a) Business segments
The Group is organised into four operating divisions, as set out below. Information reported to the Executive Board for the purposes of resource allocation and assessment of segment performance is based on the products and services provided.
– Support Services: provision of outsourced support services to public- and private-sector clients, both in the UK and internationally.
– Construction: design, construction and maintenance of buildings and infrastructure, both in the UK and internationally.
– Equipment Services: design, hire and sale of formwork, falsework and associated access equipment.
– Investments: transaction structuring, and management of, the Group’s project finance activities. Investments’ segmental figures represent the Group’s share of the associated special-purpose companies.
Costs of central services, including those relating to managing our PFI investments and central bidding activities, are shown in “Group Services”.
121INTERSERVE ANNUAL REPORT 2014 FINANCIAL STATEMENTS NOTES TO ThE CONSOLIdATEd FINANCIAL STATEMENTS
OVERVIEW
GO
VERNA
NCE
FINA
NCIA
L STATEMEN
TS STRATEG
IC REPORT
Revenue including share of associates and joint
ventures Consolidated revenue Result
2014 £million
2013 £million
2014 £million
2013 £million
2014 £million
2013 £million
Support Services - UK 1,786.0 1,292.5 1,679.9 1,196.6 81.4 56.0
Support Services - International 157.2 100.5 117.5 57.5 7.4 4.1
Support Services 1,943.2 1,393.0 1,797.4 1,254.1 88.8 60.1
Construction - UK 970.7 802.2 970.7 802.2 15.4 14.7
Construction – International 207.9 215.9 – – 10.8 13.1
Construction 1,178.6 1,018.1 970.7 802.2 26.2 27.8
Equipment Services 195.5 169.6 195.5 169.6 26.6 20.1
Investments 38.6 34.5 – – 0.8 0.8
Group Services 8.1 7.1 8.1 7.1 (25.2) (22.1)
Inter-segment elimination (58.7) (40.4) (58.7) (40.4) – –
3,305.3 2,581.9 2,913.0 2,192.6 117.2 86.7
Amortisation of acquired intangible assets (24.5) (8.9)
Exceptional items (note 5) (19.8) (4.1)
Total operating profit 72.9 73.7
Investment revenue 5.0 3.6
Finance costs (16.0) (9.2)
Profit before tax 61.9 68.1
Tax (12.0) (13.1)
Profit for the year 49.9 55.0
Segment assets Segment liabilities Net assets/(liabilities)
2014 £million
2013 £million
2014 £million
2013 £million
2014 £million
2013 £million
Support Services - UK 392.6 252.7 (339.9) (242.2) 52.7 10.5
Support Services - International 89.2 71.6 (26.6) (20.7) 62.6 50.9
Support Services 481.8 324.3 (366.5) (262.9) 115.3 61.4
Construction - UK 214.7 172.0 (321.9) (302.5) (107.2) (130.5)
Construction - International 50.8 48.7 - - 50.8 48.7
Construction 265.5 220.7 (321.9) (302.5) (56.4) (81.8)
Equipment Services 237.4 188.9 (47.3) (37.2) 190.1 151.7
Investments 42.7 20.6 - - 42.7 20.6
1,027.4 754.5 (735.7) (602.6) 291.7 151.9
Group Services, goodwill and acquired intangible assets 537.2 316.6 (92.0) (69.5) 445.2 247.1
1,564.6 1,071.1 (827.7) (672.1) 736.9 399.0
Net debt (268.9) (38.6)
Net assets (excluding non-controlling interests) 468.0 360.4
122 INTERSERVE ANNUAL REPORT 2014 FINANCIAL STATEMENTS NOTES TO ThE CONSOLIdATEd FINANCIAL STATEMENTS
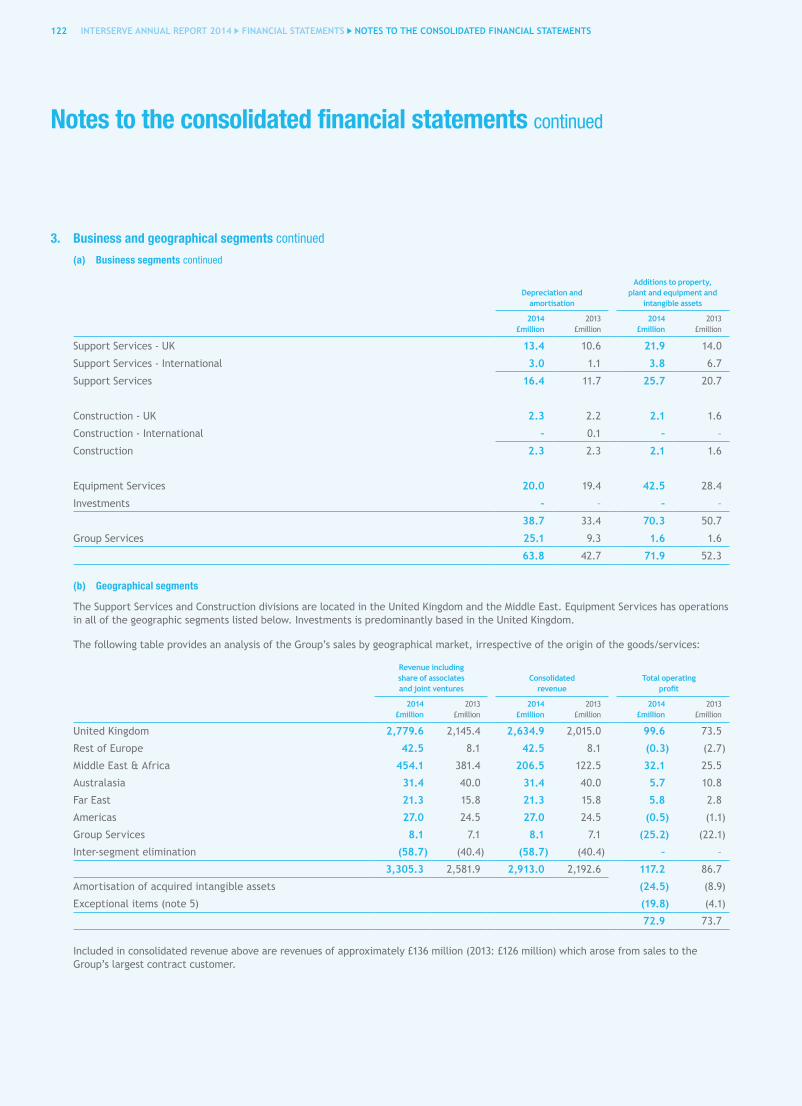
3. Business and geographical segments continued
(a) Business segments continued
Notes to the consolidated financial statements continued
depreciation and amortisation
Additions to property, plant and equipment and
intangible assets
2014 £million
2013 £million
2014 £million
2013 £million
Support Services - UK 13.4 10.6 21.9 14.0
Support Services - International 3.0 1.1 3.8 6.7
Support Services 16.4 11.7 25.7 20.7
Construction - UK 2.3 2.2 2.1 1.6
Construction - International – 0.1 – –
Construction 2.3 2.3 2.1 1.6
Equipment Services 20.0 19.4 42.5 28.4
Investments – – – –
38.7 33.4 70.3 50.7
Group Services 25.1 9.3 1.6 1.6
63.8 42.7 71.9 52.3
(b) Geographical segments
The Support Services and Construction divisions are located in the United Kingdom and the Middle East. Equipment Services has operations in all of the geographic segments listed below. Investments is predominantly based in the United Kingdom.
The following table provides an analysis of the Group’s sales by geographical market, irrespective of the origin of the goods/services:
Revenue including share of associates and joint ventures
Consolidated revenue
Total operating profit
2014 £million
2013 £million
2014 £million
2013 £million
2014 £million
2013 £million
United Kingdom 2,779.6 2,145.4 2,634.9 2,015.0 99.6 73.5
Rest of Europe 42.5 8.1 42.5 8.1 (0.3) (2.7)
Middle East & Africa 454.1 381.4 206.5 122.5 32.1 25.5
Australasia 31.4 40.0 31.4 40.0 5.7 10.8
Far East 21.3 15.8 21.3 15.8 5.8 2.8
Americas 27.0 24.5 27.0 24.5 (0.5) (1.1)
Group Services 8.1 7.1 8.1 7.1 (25.2) (22.1)
Inter-segment elimination (58.7) (40.4) (58.7) (40.4) – –
3,305.3 2,581.9 2,913.0 2,192.6 117.2 86.7
Amortisation of acquired intangible assets (24.5) (8.9)
Exceptional items (note 5) (19.8) (4.1)
72.9 73.7
Included in consolidated revenue above are revenues of approximately £136 million (2013: £126 million) which arose from sales to the Group’s largest contract customer.
123INTERSERVE ANNUAL REPORT 2014 FINANCIAL STATEMENTS NOTES TO ThE CONSOLIdATEd FINANCIAL STATEMENTS
OVERVIEW
GO
VERNA
NCE
FINA
NCIA
L STATEMEN
TS STRATEG
IC REPORT
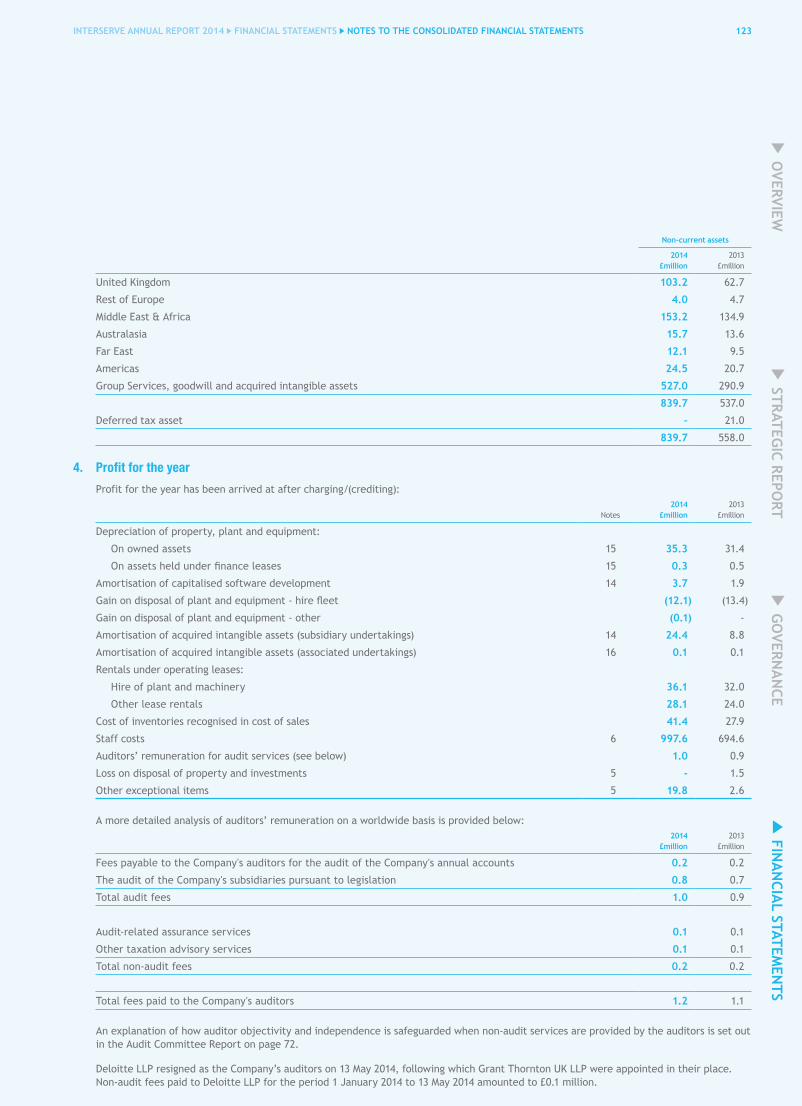
Non-current assets
2014 £million
2013 £million
United Kingdom 103.2 62.7
Rest of Europe 4.0 4.7
Middle East & Africa 153.2 134.9
Australasia 15.7 13.6
Far East 12.1 9.5
Americas 24.5 20.7
Group Services, goodwill and acquired intangible assets 527.0 290.9
839.7 537.0
Deferred tax asset – 21.0
839.7 558.0
4. Profit for the year
Profit for the year has been arrived at after charging/(crediting):
Notes2014
£million2013
£million
Depreciation of property, plant and equipment:
On owned assets 15 35.3 31.4
On assets held under finance leases 15 0.3 0.5
Amortisation of capitalised software development 14 3.7 1.9
Gain on disposal of plant and equipment - hire fleet (12.1) (13.4)
Gain on disposal of plant and equipment - other (0.1) -
Amortisation of acquired intangible assets (subsidiary undertakings) 14 24.4 8.8
Amortisation of acquired intangible assets (associated undertakings) 16 0.1 0.1
Rentals under operating leases:
Hire of plant and machinery 36.1 32.0
Other lease rentals 28.1 24.0
Cost of inventories recognised in cost of sales 41.4 27.9
Staff costs 6 997.6 694.6
Auditors’ remuneration for audit services (see below) 1.0 0.9
Loss on disposal of property and investments 5 - 1.5
Other exceptional items 5 19.8 2.6
A more detailed analysis of auditors’ remuneration on a worldwide basis is provided below:2014
£million2013
£million
Fees payable to the Company's auditors for the audit of the Company's annual accounts 0.2 0.2
The audit of the Company's subsidiaries pursuant to legislation 0.8 0.7
Total audit fees 1.0 0.9
Audit-related assurance services 0.1 0.1
Other taxation advisory services 0.1 0.1
Total non-audit fees 0.2 0.2
Total fees paid to the Company's auditors 1.2 1.1
An explanation of how auditor objectivity and independence is safeguarded when non-audit services are provided by the auditors is set out in the Audit Committee Report on page 72.
Deloitte LLP resigned as the Company’s auditors on 13 May 2014, following which Grant Thornton UK LLP were appointed in their place. Non-audit fees paid to Deloitte LLP for the period 1 January 2014 to 13 May 2014 amounted to £0.1 million.

Notes to the consolidated financial statements continued
124 INTERSERVE ANNUAL REPORT 2014 FINANCIAL STATEMENTS NOTES TO ThE CONSOLIdATEd FINANCIAL STATEMENTS
5. Exceptional items2014
£million2013
£million
Agreed valuation of transfer to pension scheme – 55.0
Transaction costs – (0.2)
Disposals – (51.2)
Profit on disposal of PFI assets – 3.6
Write–down of investment in Indian associate company, SSPDL Interserve Private Limited – (5.1)
Loss on disposal of property and investments – (1.5)
Transaction costs on the acquisition of Initial Facilities and esg (8.2) –
Integration costs on the acquisition of Initial Facilities (10.2) –
Earnout arrangements on the acquisition of Paragon Management UK Ltd (1.4) (0.5)
Bonus and share–based payments triggered by the exceptional profits on the disposals of PFI investments above – (2.1)
Other exceptional items (19.8) (2.6)
Exceptional items (19.8) (4.1)
6. Staff costs
The average number of full-time equivalent employees within each division during the year, including executive directors, was:
2014 Number
2013 Number
Support Services 37,040 21,511
Construction 2,488 2,463
Equipment Services 1,321 1,191
Group Services 242 218
41,091 25,383
Their aggregate remuneration comprised:2014
£million2013
£million
Wages and salaries 892.7 615.4
Social security costs 74.8 47.9
Share-based payments 3.4 7.8
Other pension costs (see below) 26.7 23.5
997.6 694.6
Defined benefit scheme current service costs (note 30) 8.0 7.4
Other UK - defined contribution 17.6 14.9
Other overseas - defined contribution 1.1 1.2
Pension costs 26.7 23.5
Detailed disclosures of directors’ aggregate and individual remuneration and share-based payments are given in the audited section of the Directors’ Remuneration Report on pages 90 to 101 and should be regarded as an integral part of this note.

125INTERSERVE ANNUAL REPORT 2014 FINANCIAL STATEMENTS NOTES TO ThE CONSOLIdATEd FINANCIAL STATEMENTS
OVERVIEW
GO
VERNA
NCE
FINA
NCIA
L STATEMEN
TS STRATEG
IC REPORT
7. Investment revenue2014
£million2013
£million
Bank interest 3.3 2.8
Interest income from joint-venture investments 0.8 0.6
Net return on defined benefit pension assets (note 30) 0.3 –
Other interest 0.6 0.2
5.0 3.6
8. Finance costs2014
£million2013
£million
Borrowings and overdrafts (16.0) (7.8)
Net interest cost on pension obligations (note 30) – (1.4)
(16.0) (9.2)
9. Tax2014
£million2013
£million
Current tax – UK 2.8 2.2
Current tax – overseas 4.3 5.0
Deferred tax (note 17) 4.9 5.9
Tax charge for the year A 12.0 13.1
Tax charge before prior period adjustments 11.9 14.0
Prior period adjustments – charges/(credits) 0.1 (0.9)
A 12.0 13.1
Profit before tax
Subsidiary undertakings' profit before tax B 53.6 52.4
Loss on disposal of property and investments – (1.5)
Non-tax–deductible transaction costs (8.2) –
Group share of profit after tax of associates and joint ventures 16.5 17.2
61.9 68.1
Effective tax, excluding one–offs, on subsidiary profits before tax A/B 22.4% 25.0%
UK corporation tax is calculated at 21.5% (2013: 23.2%) of the estimated taxable profit for the year. Taxation for other jurisdictions is calculated at the rates prevailing in the relevant jurisdictions.
The total charge for the year can be reconciled to the profit per the income statement as follows:
2014 2013
£million % £million %
Profit before tax 61.9 68.1
Tax at the UK income tax rate of 21.5% (2013: 23.2%) 13.3 21.5% 15.8 23.2%
Tax effect of expenses not deductible in determining taxable profit 1.5 2.4% 0.7 1.0%
Non-taxable exceptional items 2.8 4.5% 0.5 0.7%
Tax effect of share of results of associates (3.0) (4.8%) (4.0) (5.9%)
Effect of overseas tax rates and unrelieved losses (2.7) (4.4%) 1.0 1.5%
Prior period adjustments 0.1 0.2% (0.9) (1.3%)
Tax charge and effective tax rate for the year 12.0 19.4% 13.1 19.2%

Notes to the consolidated financial statements continued
126 INTERSERVE ANNUAL REPORT 2014 FINANCIAL STATEMENTS NOTES TO ThE CONSOLIdATEd FINANCIAL STATEMENTS
9. Tax continued
In addition to the income tax charged to the income statement, the following deferred tax charges/(credits) have been recorded directly to equity in the year:
2014 £million
2013 £million
Tax on actuarial losses/gains on pension liability (3.1) 4.3
Impact of change in corporation tax rate on pension liability – 3.0
Tax on fair value adjustment on cash flow hedging instruments – 0.2
Tax on the intrinsic value of share–based payments 2.0 (1.5)
Total (1.1) 6.0
10. Dividendsdividend per share
pence2014
£million2013
£million
Final dividend for the year ended 31 December 2012 14.1 – 17.6
Interim dividend for the year ended 31 December 2013 6.8 – 8.6
Final dividend for the year ended 31 December 2013 14.7 20.8 –
Interim dividend for the year ended 31 December 2014 7.5 10.7 –
Amount recognised as distribution to equity holders in the period 31.5 26.2
Proposed final dividend for the year ended 31 December 2014 15.5 22.3
The proposed final dividend is subject to approval by shareholders at the Annual General Meeting and has not been included as a liability in these financial statements.
11. Earnings per share
Calculation of earnings per share is based on the following data:
Earnings2014
£million2013
£million
Net profit attributable to equity holders of the parent (for basic and diluted basic earnings per share) 45.4 50.2
Adjustments:
Exceptional items 19.8 4.1
Amortisation of acquired intangible assets 24.5 8.9
Tax effect of above adjustments (6.7) (1.9)
Headline earnings (for headline and diluted headline earnings per share) 83.0 61.3
Number of shares2014
Number2013
Number
Weighted average number of ordinary shares for the purposes of basic and headline earnings per share 141,136,892 128,386,396
Effect of dilutive potential ordinary shares:
Share options and awards 2,109,620 3,154,762
Weighted average number of ordinary shares for the purposes of diluted basic and diluted headline earnings per share 143,246,512 131,541,158

127INTERSERVE ANNUAL REPORT 2014 FINANCIAL STATEMENTS NOTES TO ThE CONSOLIdATEd FINANCIAL STATEMENTS
OVERVIEW
GO
VERNA
NCE
FINA
NCIA
L STATEMEN
TS STRATEG
IC REPORT
Earnings per share 2014
pence2013
pence
Basic earnings per share 32.2 39.1
Diluted basic earnings per share 31.7 38.2
Headline earnings per share 58.8 47.7
Diluted headline earnings per share 57.9 46.6
12. Acquisitions
The Group made the following acquisitions in the year:
On 18 March 2014 the Group acquired 100% of the facilities services business (“Initial Facilities”) of Rentokil Initial Plc, for a cash consideration of £245.7 million. The acquisition strengthens the Support Services offering of Interserve, allowing the provision of a significantly enhanced service offering. The enlarged business offers a full range of services across all contract sizes and to both public- and private-sector customers.
On 5 December 2014 the Group acquired 100% of the share capital of ESG Holdings Limited (“esg”) for a cash consideration of £25.7 million. The acquisition strengthens Interserve’s position within the UK and Saudi Arabian skills and training markets. It also provides an increased presence in the Welfare-to-Work market where we are already active via Interserve Working Futures and Rehab Jobfit.
Preliminary fair value exercises have been performed, as set out below:
Assets acquired
Initial Facilities £million
esg £million
Total £million
Property, plant and equipment 6.6 3.2 9.8
Intangible assets 87.8 19.1 106.9
Cash balances 25.3 4.5 29.8
Inventories 3.3 - 3.3
Trade and other receivables 107.7 5.2 112.9
Trade and other payables (96.8) (13.4) (110.2)
Other liabilities (28.5) (4.8) (33.3)
Net assets 105.4 13.8 119.2
Goodwill 140.3 11.9 152.2
Consideration 245.7 25.7 271.4
Net cash outflow on acquisitions 220.4 21.2 241.6
The fair value adjustments relate to certain intangible assets and their associated deferred tax charge. These have been separately identified and recognised using appropriate valuation techniques based on the fair value of forecast future cash flows. The resultant goodwill from the acquisition represents the future economic benefits arising from assets that are not capable of being individually identified and separately recognised (for example the knowledge and expertise of the assembled workforce and the operating synergies that arise from the Group’s strengthened market position). None of the goodwill is expected to be deductible for income tax purposes.
Acquisition-related costs, included in exceptional costs, amounted to £8.2 million (see note 5).
Since acquisition on 18 March 2014, Initial Facilities has contributed £440.4 million to revenue and a £7.9 million loss after exceptional items. If the business had been acquired on 1 January 2014, it would have contributed revenues of £555.3 million and a loss after exceptional items of £5.6 million.
Since acquisition on 5 December 2014, esg has contributed £3.4 million in revenue and a £0.3 million loss after exceptional items. If the business had been acquired on 1 January 2014, it would have contributed revenues of £41.2 million and a loss after exceptional items of £3.3 million.
A further £2.1 million of cash was paid in the period relating to the 2013 acquisition of Adyard.

Notes to the consolidated financial statements continued
128 INTERSERVE ANNUAL REPORT 2014 FINANCIAL STATEMENTS NOTES TO ThE CONSOLIdATEd FINANCIAL STATEMENTS
13. Goodwill 2014
£million2013
£million
Cost
At 1 January 308.0 286.3
Additions (note 12) 152.2 22.1
Exchange movements 1.2 (0.4)
At 31 December 461.4 308.0
Accumulated impairment
At 1 January and 31 December 60.0 60.0
Carrying amount
At 31 December 401.4 248.0
Goodwill acquired in a business combination is allocated, at acquisition, to the cash generating units (CGUs) that are expected to benefit from that business combination as follows:
Construction £million
Support Services £million
Equipment Services £million
Total £million
At 1 January 2013 11.5 213.9 0.9 226.3
Additions 0.4 21.7 – 22.1
Exchange movements – (0.4) – (0.4)
At 31 December 2013 11.9 235.2 0.9 248.0
Additions – 152.2 – 152.2
Exchange movements – 1.2 – 1.2
At 31 December 2014 11.9 388.6 0.9 401.4
The Group tests goodwill annually for impairment, or more frequently if there are indications that goodwill might be impaired.
The recoverable amounts of the CGUs are determined from value in use calculations. The key assumptions for the value in use calculations are those regarding the discount rates, cash flows, growth rates and margins during the period. Management estimates discount rates using pre-tax rates that reflect current market assessments of the time value of money and the risks specific to the CGUs. The revenue growth rates are based on current Board-approved budgets and forecasts and are extrapolated based on expectations of changes in the market. The Group produces three-year plans and then projects a further year based on growth rates of 2.5%, followed by a terminal value based on a perpetuity calculated at a nominal 2.5% growth which does not exceed current market growth rates.
The rates used to discount the future cash flows range from 8.5% for Support Services (2013: 8.5%) to 9.5% for Construction and Equipment Services (2013: 8.5%) and are based on the Group’s pre-tax weighted average cost of capital.
As part of this annual review a sensitivity analysis was performed on the impairment test of each CGU, including an increase in the discount rate of up to 2.0%. No impairment in the carrying value of the goodwill in Support Services, Equipment Services or Construction would occur as a result of adopting this sensitivity.

129INTERSERVE ANNUAL REPORT 2014 FINANCIAL STATEMENTS NOTES TO ThE CONSOLIdATEd FINANCIAL STATEMENTS
OVERVIEW
GO
VERNA
NCE
FINA
NCIA
L STATEMEN
TS STRATEG
IC REPORT
14. Other intangible assetsAcquired
Computer software £million
Customer relationships
£millionOther
£millionTotal
£million
Cost
At 1 January 2013 8.4 67.2 1.4 77.0
Acquisitions – 8.0 1.7 9.7
Additions 0.2 – – 0.2
Exchange movements – (0.2) (0.1) (0.3)
At 31 December 2013 8.6 75.0 3.0 86.6
Acquisitions (note 12) 1.3 105.6 – 106.9
Additions 5.3 – – 5.3
Exchange movements – 0.7 – 0.7
At 31 December 2014 15.2 181.3 3.0 199.5
Accumulated amortisation
At 1 January 2013 4.4 31.8 1.3 37.5
Charge for the year 1.9 8.6 0.2 10.7
Exchange movements – (0.2) – (0.2)
At 31 December 2013 6.3 40.2 1.5 48.0
Charge for the year 3.7 24.1 0.3 28.1
Exchange movements – 0.3 – 0.3
At 31 December 2014 10.0 64.6 1.8 76.4
Carrying amount
At 31 December 2014 5.2 116.7 1.2 123.1
At 31 December 2013 2.3 34.8 1.5 38.6
At 1 January 2013 4.0 35.4 0.1 39.5
Useful lives5
years5-10
years3-5
years
The useful life and amortisation period of each group of intangible assets varies according to the underlying length of benefit expected to be received.

Notes to the consolidated financial statements continued
130 INTERSERVE ANNUAL REPORT 2014 FINANCIAL STATEMENTS NOTES TO ThE CONSOLIdATEd FINANCIAL STATEMENTS
15. Property, plant and equipment
(a) Movements
Land and buildings£million
hire fleet
£million
Other plant and
equipment£million
Total£million
Cost
At 1 January 2013 18.3 224.8 75.0 318.1
Additions 2.4 29.8 19.9 52.1
Acquisition of subsidiaries 4.5 - 5.3 9.8
Disposals (0.5) (24.0) (5.9) (30.4)
Exchange differences (0.9) (10.7) (3.2) (14.8)
At 31 December 2013 23.8 219.9 91.1 334.8
Additions 1.6 47.0 18.0 66.6
Acquisition of subsidiaries 0.5 - 9.3 9.8
Disposals (0.4) (18.3) (6.5) (25.2)
Exchange differences 0.3 3.7 3.4 7.4
At 31 December 2014 25.8 252.3 115.3 393.4
Accumulated depreciation
At 1 January 2013 9.8 116.1 54.4 180.3
Charge for the year 1.2 18.4 12.3 31.9
Eliminated on disposals (0.4) (19.3) (5.4) (25.1)
Exchange differences (0.6) (5.0) (2.6) (8.2)
At 31 December 2013 10.0 110.2 58.7 178.9
Charge for the year 1.8 19.6 14.2 35.6
Eliminated on disposals (0.3) (13.6) (6.0) (19.9)
Exchange differences 0.3 0.5 2.7 3.5
At 31 December 2014 11.8 116.7 69.6 198.1
Carrying amount
At 31 December 2014 14.0 135.6 45.7 195.3
At 31 December 2013 13.8 109.7 32.4 155.9
At 1 January 2013 8.5 108.7 20.6 137.8
The carrying amount of the Group’s plant and equipment includes an amount of £0.8 million (2013: £1.0 million) in respect of assets held under finance leases. Details of property, plant and equipment held under finance leases are shown in note 25.
(b) Carrying amount of land and buildings
31 december 2014
£million
31 December 2013
£million
Freehold:
Land at cost 3.7 2.7
Buildings at cost less depreciation 5.6 6.4
9.3 9.1
Leaseholds under 50 years at cost less depreciation 4.7 4.7
Total 14.0 13.8
(c) Future capital expenditure not provided for in the financial statements
31 december 2014
£million
31 December 2013
£million
Committed 3.5 1.8

131INTERSERVE ANNUAL REPORT 2014 FINANCIAL STATEMENTS NOTES TO ThE CONSOLIdATEd FINANCIAL STATEMENTS
OVERVIEW
GO
VERNA
NCE
FINA
NCIA
L STATEMEN
TS STRATEG
IC REPORT
16. Interests in associates and joint-venture entities
(a) Results of joint-venture entities and associated undertakings
The aggregate results of joint-venture entities and associated undertakings were as follows:
Year ended 31 december 2014 Year ended 31 December 2013
Joint ventures£million
Associates£million
Total£million
Joint ventures£million
Associates£million
Total£million
Revenues 172.1 720.9 893.0 134.1 716.4 850.5
Operating profit 4.7 30.1 34.8 5.7 31.1 36.8
Net interest receivable 0.3 0.2 0.5 (0.8) 0.4 (0.4)
Taxation (0.3) 1.1 0.8 (0.9) 1.6 0.7
Profit after tax 4.7 31.4 36.1 4.0 33.1 37.1
Less: Profit after tax attributable to non-Group interests (2.9) (16.6) (19.5) (2.4) (17.4) (19.8)
Profit after tax attributable to the Group 1.8 14.8 16.6 1.6 15.7 17.3
Group amortisation of acquired intangible assets - (0.1) (0.1) - (0.1) (0.1)
Contribution to Group total operating profit 1.8 14.7 16.5 1.6 15.6 17.2
Dividends paid to the Group (1.4) (16.4) (17.8) (1.6) (12.1) (13.7)
Retained result for the period attributable to the Group 0.4 (1.7) (1.3) - 3.5 3.5
(b) Joint-venture entities
(i) Results and net assets
The aggregate results of joint ventures were as follows: Year ended 31 december 2014 Year ended 31 December 2013
Support Services£million
Investments£million
Total£million
Support Services£million
Investments£million
Total£million
Revenues 22.5 149.6 172.1 22.5 111.6 134.1
Operating profit 2.1 2.6 4.7 1.7 4.0 5.7
Net interest receivable - 0.3 0.3 - (0.8) (0.8)
Taxation - (0.3) (0.3) (0.4) (0.5) (0.9)
Profit after tax 2.1 2.6 4.7 1.3 2.7 4.0
Less: Profit after tax attributable to non-Group interests (1.1) (1.8) (2.9) (0.5) (1.9) (2.4)
Profit after tax attributable to the Group 1.0 0.8 1.8 0.8 0.8 1.6
Group amortisation of acquired intangible assets - - - - - -
Contribution to Group total operating profit 1.0 0.8 1.8 0.8 0.8 1.6
Dividends paid to the Group (0.7) (0.7) (1.4) (1.1) (0.5) (1.6)
Retained result for the period attributable to the Group 0.3 0.1 0.4 (0.3) 0.3 -
There are no significant restrictions on the ability of joint ventures to pay dividends or repay loans if agreed by the shareholders.
MAC_RF66456_A_P05 tp.indd 131 20/03/2015 11:24

132 INTERSERVE ANNUAL REPORT 2014 FINANCIAL STATEMENTS NOTES TO ThE CONSOLIdATEd FINANCIAL STATEMENTS
16. Interests in associates and joint-venture entities continued
(b) Joint-venture entities continued
Notes to the consolidated financial statements continued
(i) Results and net assets continued
The net assets of joint-venture entities were as follows:
Year ended 31 december 2014 Year ended 31 December 2013
Support Services£million
Investments£million
Total£million
Support Services£million
Investments£million
Total£million
Non-current assets 0.1 266.0 266.1 0.2 179.1 179.3
Current assets 2.2 246.0 248.2 2.6 171.9 174.5
Current liabilities (2.3) (29.6) (31.9) (3.3) (18.0) (21.3)
Non-current liabilities - (391.1) (391.1) - (294.6) (294.6)
Net assets – 91.3 91.3 (0.5) 38.4 37.9
Less: Net assets attributable to non-Group interests – (48.6) (48.6) 0.3 (17.6) (17.3)
Net assets attributable to the Group – 42.7 42.7 (0.2) 20.8 20.6
Goodwill - - - - - -
Acquired intangible assets - - - - - -
Carrying value of net assets and goodwill – 42.7 42.7 (0.2) 20.8 20.6
The liabilities of the joint-venture entities principally relate to the non-recourse debt within those businesses as part of the construction of the underlying asset.
(ii) Movements in the year
Shares£million
Loans£million
Share of reserves£million
Total£million
At 1 January 2013 – 7.3 0.3 7.6
Acquisitions and advances – 10.6 – 10.6
Fair value adjustment to financial instruments and derivatives – – 2.4 2.4
Share of retained profits – – – –
At 31 December 2013 – 17.9 2.7 20.6
Acquisitions and advances – 10.4 – 10.4
Repayments to the Group – (0.3) – (0.3)
Fair value adjustment to financial instruments and derivatives – – 11.6 11.6
Share of retained profits – – 0.4 0.4
At 31 December 2014 – 28.0 14.7 42.7
Assets held for sale
At 1 January 2013 – 51.2 – 51.2
Disposals – (51.2) – (51.2)
At 31 December 2013 – – – –
Disposals – – – –
At 31 december 2014 – – – –
Further details of the Group’s investment in PPP/PFI schemes are included in note 32.
At 31 December 2014 the Group had a commitment for additional investment in joint-venture entities of £21.6 million (2013: £13.5 million).

133INTERSERVE ANNUAL REPORT 2014 FINANCIAL STATEMENTS NOTES TO ThE CONSOLIdATEd FINANCIAL STATEMENTS
OVERVIEW
GO
VERNA
NCE
FINA
NCIA
L STATEMEN
TS STRATEG
IC REPORT
(c) Associated undertakings
(i) Results and net assets
The aggregate results of the Group’s various associated undertakings were as follows:
Year ended 31 december 2014 Year ended 31 December 2013
Construction£million
Support Services£million
Total£million
Construction£million
Support Services£million
Total£million
Revenues 442.3 278.6 720.9 459.4 257.0 716.4
Operating profit 23.6 6.5 30.1 23.4 7.7 31.1
Net interest receivable 0.2 - 0.2 0.4 - 0.4
Taxation 2.1 (1.0) 1.1 2.6 (1.0) 1.6
Profit after tax 25.9 5.5 31.4 26.4 6.7 33.1
Less: Profit after tax attributable to non-Group interests (13.7) (2.9) (16.6) (14.0) (3.4) (17.4)
Profit after tax attributable to the Group 12.2 2.6 14.8 12.4 3.3 15.7
Group amortisation of acquired intangible assets - (0.1) (0.1) (0.1) - (0.1)
Contribution to Group total operating profit 12.2 2.5 14.7 12.3 3.3 15.6
Dividends paid to the Group (14.5) (1.9) (16.4) (9.4) (2.7) (12.1)
Retained result for the period attributable to the Group (2.3) 0.6 (1.7) 2.9 0.6 3.5
There are no significant restrictions on the ability of associates to pay dividends or repay loans if agreed by the shareholders.
Total net assets of the associated undertakings were as follows:
Year ended 31 december 2014 Year ended 31 December 2013
Construction£million
Support Services£million
Total£million
Construction£million
Support Services£million
Total£million
Non-current assets 34.5 27.1 61.6 37.7 26.5 64.2
Current assets 373.4 71.6 445.0 355.3 54.5 409.8
Current liabilities (259.1) (48.4) (307.5) (255.7) (34.8) (290.5)
Non-current liabilities (43.2) (3.7) (46.9) (36.2) (2.7) (38.9)
Net assets 105.6 46.6 152.2 101.1 43.5 144.6
Less: Net assets attributable to non-Group interests (56.0) (23.9) (79.9) (53.6) (22.1) (75.7)
Net assets attributable to the Group 49.6 22.7 72.3 47.5 21.4 68.9
Goodwill 1.2 3.5 4.7 1.2 3.5 4.7
Acquired intangible assets - 0.2 0.2 - 0.3 0.3
Carrying value of net assets and goodwill 50.8 26.4 77.2 48.7 25.2 73.9
(ii) Movements in the year
Shares£million
Loans£million
Share of reserves£million
Total£million
At 1 January 2013 10.7 9.4 56.5 76.6
Write-down of investment (4.8) (0.5) 0.2 (5.1)
Share of retained profits net of amortisation - - 3.5 3.5
Exchange differences - - (1.1) (1.1)
At 31 December 2013 5.9 8.9 59.1 73.9
Additions - - - -
Share of retained profits net of amortisation - - (1.7) (1.7)
Exchange differences - - 5.0 5.0
At 31 december 2014 5.9 8.9 62.4 77.2

Notes to the consolidated financial statements continued
134 INTERSERVE ANNUAL REPORT 2014 FINANCIAL STATEMENTS NOTES TO ThE CONSOLIdATEd FINANCIAL STATEMENTS
17. Deferred taxation
The following are the major deferred tax assets and (liabilities) recognised by the Group.
Retirement benefit
obligations£million
Acquired intangible
assets£million
Accelerated capital
allowances£million
Trading losses
£million
Other timing differences
£millionTotal
£million
At 1 January 2013 23.6 (8.0) 3.2 6.0 8.7 33.5
(Charge)/credit to income (6.0) 2.5 1.4 (3.9) 0.1 (5.9)
Acquisition of subsidiaries - (0.7) - - - (0.7)
(Charge)/credit to equity (7.3) - - - 1.3 (6.0)
Exchange differences - - 0.4 - (0.3) 0.1
At 31 December 2013 10.3 (6.2) 5.0 2.1 9.8 21.0
(Charge)/credit to income (6.7) 4.6 (2.8) (0.4) 0.4 (4.9)
Acquisition of subsidiaries - (21.1) - - 1.9 (19.2)
(Charge)/credit to equity 3.1 - - - (2.0) 1.1
Exchange differences - - - - - -
At 31 december 2014 6.7 (22.7) 2.2 1.7 10.1 (2.0)
Certain deferred tax assets and liabilities, as shown below, have been offset on the consolidated balance sheet.
31 december 2014
£million
31 December 2013
£million
Deferred tax liabilities (22.7) (6.2)
Deferred tax assets 20.7 27.2
(2.0) 21.0
No deferred tax asset has been recognised in respect of certain unused tax losses available for offset against future profits due to the unpredictability of future profit streams in those businesses. The accumulated tax value of these losses is £7.7 million (2013: £8.3 million) on gross losses of £38.6 million (2013: £41.4 million).
18. Inventories31 december
2014£million
31 December 2013
£million
31 December 2012
£million
Goods held for resale 40.1 27.5 24.0
Materials 8.5 3.2 0.6
48.6 30.7 24.6
19. Construction contracts
Balances related to contracts in progress at the balance sheet date were:
31 december 2014
£million
31 December 2013
£million
31 December 2012
£million
Amounts due from contract customers included in trade and other receivables (note 20) 81.5 58.2 50.9
Amounts due to contract customers included in trade and other payables (note 23) (34.0) (35.2) (20.6)
47.5 23.0 30.3
Contract costs incurred plus recognised profits less recognised losses to date 4,886.1 4,938.6 4,698.0
Less: progress billings (4,838.6) (4,915.6) (4,667.7)
47.5 23.0 30.3
At 31 December 2014, retentions held by customers for contract work amounted to £36.8 million (2013: £32.6 million) of which £8.9 million (2013: £7.0 million) is receivable after one year. Advances received were £34.0 million (2013: £35.2 million) of which £nil is repayable after one year (2013: £nil).

135INTERSERVE ANNUAL REPORT 2014 FINANCIAL STATEMENTS NOTES TO ThE CONSOLIdATEd FINANCIAL STATEMENTS
OVERVIEW
GO
VERNA
NCE
FINA
NCIA
L STATEMEN
TS STRATEG
IC REPORT
20. Trade and other receivables31 december
2014£million
31 December 2013
£million
31 December 2012
£million
Amounts recoverable from the sale of goods and services 418.0 290.8 270.1
Allowances for doubtful debts (49.2) (41.8) (30.5)
368.8 249.0 239.6
Amounts due from construction contract customers 81.5 58.2 50.9
Retentions 36.8 32.6 26.0
Other receivables 26.7 20.1 12.4
Prepayments and accrued income 165.6 126.2 103.1
679.4 486.1 432.0
Included in the above are the following amounts recoverable after more than one year:
31 december 2014
£million
31 December 2013
£million
31 December 2012
£million
Retentions 8.9 7.0 4.5
The directors consider that the carrying amount of trade and other receivables approximates their fair value. Trade and other receivables are included as part of the financial assets.
Average credit period taken on the sale of goods and services is 38 days (2013: 35 days). Allowances for doubtful debt are provided for on a specific basis, based on estimates of irrecoverability determined by market knowledge and past experience.
Ageing of trade receivables, not impaired but net of allowances for doubtful debt, is as follows:
31 december 2014
£million
31 December 2013
£million
31 December 2012
£million
Not more than one month past due 65.8 30.8 36.0
Between one and three months past due 26.0 16.6 14.3
Between three and six months past due 24.5 14.9 16.6
Greater than six months 17.1 6.3 10.4
Total past due but not impaired 133.4 68.6 77.3
Not past due 235.4 180.4 162.3
Total net receivables 368.8 249.0 239.6
The average age of the receivables past due but not impaired is 78 days (2013: 75 days).
Movement in allowance for doubtful debt is as follows:
2014£million
2013£million
Balance at 1 January 41.8 30.5
Acquisition of new subsidiaries 4.2 1.2
Amounts written off as uncollectable (23.3) (9.7)
Impairment losses recognised in the year 28.0 25.3
Amounts recovered during the year (2.6) (3.8)
Exchange differences 1.1 (1.7)
Balance at 31 December 49.2 41.8

Notes to the consolidated financial statements continued
136 INTERSERVE ANNUAL REPORT 2014 FINANCIAL STATEMENTS NOTES TO ThE CONSOLIdATEd FINANCIAL STATEMENTS
21. Cash, deposits and borrowings
Committed borrowing facilities
31 december 2014
£million
31 December 2013
£million
31 December 2012
£million
US Private Placement loan notes 207.2 – –
Bank facilities 250.0 250.0 245.0
Total committed borrowing facilities 457.2 250.0 245.0
On 20 June 2014, the Group announced the successful completion of a US$ 350 million issue of US Private Placement loan notes (“loan notes”), which have a weighted average maturity length of 10 years. The loan notes attract differing fixed rates of interest depending on their tenor. This has been swapped to a fixed sterling equivalent of £207.2 million, along with the associated interest payments, with the use of derivatives that have been designated as cash flow hedges that are held at fair value (see note 22(b)).
The loan notes are in addition to £250 million of committed bank facilities which mature in 2019.
The loan notes are subject to a fixed rate of interest. The majority of the remainder of the Group’s other borrowings bear interest at floating rates which are set according to published LIBOR rates. The remainder bear interest at rates that are determined by bank base rates. The Group seeks to control its exposure to changes in interest rates by using interest rate hedges (see note 22(c)).
Cash, deposits and borrowings:
31 december 2014
£million
31 December 2013
£million
31 December 2012
£million
Cash and deposits 82.1 79.7 76.8
Bank overdrafts (5.5) (27.4) (19.8)
Bank loans (137.5) (90.0) (30.0)
US Private Placement loan notes (207.2) - -
(350.2) (117.4) (49.8)
Finance leases (note 25) (0.8) (0.9) (1.2)
Total borrowings (351.0) (118.3) (51.0)
Net cash/(debt) (268.9) (38.6) 25.8
Cash and deposits comprise cash held by the Group and short-term bank deposits that have an original maturity of three months or less. Deposits receive interest at floating rates related to UK base rates.
Included within cash and deposits is £36.0 million (2013: £21.8 million) which is subject to various constraints on the Group’s ability to utilise these balances. These constraints relate to amounts held in project bank accounts, amounts held in accounts held in entities subject to minority interest shareholdings and the regulatory cash funding requirements relating to the Group’s captive insurance company.
Total borrowings are repayable as follows:
31 december 2014
£million
31 December 2013
£million
31 December 2012
£million
On demand or within one year 5.8 27.7 20.3
In the second year 0.3 0.3 0.3
In the third to fifth years inclusive 137.7 90.3 30.4
After more than five years 207.2 - -
351.0 118.3 51.0
Less: Amount due for settlement within 12 months (5.8) (27.7) (20.3)
Amount due for settlement after 12 months 345.2 90.6 30.7

137INTERSERVE ANNUAL REPORT 2014 FINANCIAL STATEMENTS NOTES TO ThE CONSOLIdATEd FINANCIAL STATEMENTS
OVERVIEW
GO
VERNA
NCE
FINA
NCIA
L STATEMEN
TS STRATEG
IC REPORT
Amounts are drawn down against facilities on a short-term basis but the ageing of the total amount borrowed is classified according to the maturity of the facilities. Contractual interest on bank loans, that will accrue between the year end and the date of rollover of the amounts drawn down, is £0.5 million and is all due for payment within one year (2013: £0.1 million within one year).
The analysis of utilisation of committed bank facilities is as follows:
31 december 2014
£million
31 December 2013
£million
31 December 2012
£million
Drawn facilities:
US Private Placement loan notes 207.2 - -
Bank loans 137.5 90.0 30.0
Undrawn facilities within one to two years - - -
Undrawn facilities within more than two years but not more than five years remaining 112.5 160.0 215.0
Total committed borrowing facilities 457.2 250.0 245.0
22. Financial risk management
Financial assets comprise trade and other receivables (excluding construction contracts, prepaid and accrued income), long-term debtors and cash and deposits. Financial assets and liabilities have fair values not materially different to the carrying values. Financial liabilities comprise trade and other payables (excluding construction contracts, accruals, deferred income and other tax and social security), bank borrowings, finance leases, loan notes, long-term creditors and interest rate hedges.
The Group has the following categories of financial assets and liabilities:
31 december 2014 31 December 2013
Other financial
assets£million
derivatives used for hedging£million
Total£million
Other financial
assets£million
Derivatives used for hedging£million
Total£million
Loans and receivables
Cash and deposits 82.1 - 82.1 79.7 - 79.7
Trade and other receivables (excluding construction contracts, prepaid and accrued income) 395.5 - 395.5 269.1 - 269.1
Currency exchange rate hedge - 5.4 5.4 - - -
Total financial assets 477.6 5.4 483.0 348.8 - 348.8
31 december 2014 31 December 2013
Other financial liabilities£million
derivatives used for hedging£million
Total£million
Other financial liabilities£million
Derivatives used for hedging£million
Total£million
Borrowings, overdrafts and finance leases 143.8 - 143.8 118.3 - 118.3
Loan notes 207.2 - 207.2 - - -
Trade and other payables (excluding construction contracts, accruals, deferred income and other tax and social security) 357.1 - 357.1 297.8 - 297.8
Interest rate hedge (non-PFI investments) - 0.1 0.1 - 0.3 0.3
Total financial liabilities 708.1 0.1 708.2 416.1 0.3 416.4
Trade and other receivables and trade and other payables are held at amortised cost. The directors consider these values to approximate their fair values. The interest rate hedges are recorded at fair value at each balance sheet date.

Notes to the consolidated financial statements continued
138 INTERSERVE ANNUAL REPORT 2014 FINANCIAL STATEMENTS NOTES TO ThE CONSOLIdATEd FINANCIAL STATEMENTS
22. Financial risk management continued
Financial instruments that are measured subsequent to initial recognition at fair value are grouped into three levels based on the degree to which the fair value is observable, as defined by IFRS 13:
– Level 1 fair value measurements are those derived from unadjusted quoted prices in active markets for identical assets and liabilities;
– Level 2 fair value measurements are those derived from inputs, other than quoted prices included within “Level 1”, that are observable either directly (i.e. as prices) or indirectly (i.e. derived from prices); and
– Level 3 fair value measurements are those derived from valuation techniques that include inputs for the asset or liability that are not based on observable market data.
Classification of financial assets/(liabilities) held at fair value according to the definitions set out in IFRS 13:
31 december 2014
£million
31 December 2013
£million
Level 2 5.3 (0.3)
Derivatives used for hedging financial liabilities are considered to be within the grouping referred to as “Level 2”. Their fair values are calculated based on the valuation models operated by the relevant counterparty bank, based on market interest rates in force on the date of valuation. The Level 2 financial derivatives are classified within other receivables and other payables.
No financial instruments have been transferred between Levels during the year.
Exposure to credit risk on liquid funds and derivative financial instruments is managed by the Group’s requirement to trade with counterparties with strong credit ratings as determined by international credit rating agencies. The transactional banking requirements are met by local banks in each location with significant cash balances being remitted to Group treasury where short-term cash surpluses or cash not available for use by the Group is deposited with investment grade rated banks.
(a) Currency exposures
Where material trade is transacted in non-local currency, the Company hedges the currency exposure and ordinarily this will be achieved with forward contracts.
Analysis of financial assets, excluding derivatives used for hedging, by currency:
31 december 2014 31 December 2013
Floating rates
£million
Fixed rates
£million
Non-interest bearing£million
Total£million
Floating rates
£million
Fixed rates
£million
Non-interest bearing£million
Total£million
Sterling 49.7 - 285.8 335.5 50.6 - 203.5 254.1
US dollar 6.2 - 39.8 46.0 7.1 - 20.6 27.7
Euro 4.1 - 9.8 13.9 10.8 - 1.2 12.0
Australian dollar 2.7 - 5.0 7.7 2.1 - 7.7 9.8
Dirham 6.5 - 22.1 28.6 0.9 - 11.5 12.4
Other 12.9 - 33.0 45.9 8.2 - 24.6 32.8
82.1 - 395.5 477.6 79.7 - 269.1 348.8

139INTERSERVE ANNUAL REPORT 2014 FINANCIAL STATEMENTS NOTES TO ThE CONSOLIdATEd FINANCIAL STATEMENTS
OVERVIEW
GO
VERNA
NCE
FINA
NCIA
L STATEMEN
TS STRATEG
IC REPORT
Analysis of financial liabilities, excluding derivatives used for hedging, by currency:
31 december 2014 31 December 2013
Floating rates
£million
Fixed rates
£million
Non-interest bearing£million
Total£million
Floating rates
£million
Fixed rates
£million
Non-interest bearing£million
Total£million
Sterling 141.3 0.8 315.5 457.6 115.1 0.9 265.3 381.3
US dollar - 207.2 18.7 225.9 - - 17.2 17.2
Euro - - 2.0 2.0 - - 1.1 1.1
Australian dollar - - 1.9 1.9 - - 1.3 1.3
Dirham - - 15.6 15.6 1.2 - 10.6 11.8
Other 1.7 - 3.4 5.1 1.1 - 2.3 3.4
143.0 208.0 357.1 708.1 117.4 0.9 297.8 416.1
Weighted average interest rates excluding amortisation of arrangement fees and bank margin 0.5% 4.8% 0.5% 1.6%
Where the Group has overseas operations, the revenues and costs of the business will typically be denominated in local currency. Gains and losses arising on retranslation of monetary assets and liabilities that are not denominated in the functional currency of individual Group companies are recognised in the income statement. The Group enters into forward foreign exchange contracts to manage material currency exposures that arise on cash flows from sales or purchases not denominated in functional currencies immediately those sales or purchases are contracted. Taking into account the effect of forward contracts, Group companies did not have a material exposure to foreign exchange gains or losses on monetary assets and monetary liabilities denominated in foreign currencies at 31 December 2014.
The Group does not hedge anticipated future sales and purchases.
Gains and losses arising on the retranslation of foreign operations’ net assets into the consolidation currency are recognised directly in equity. The Group does not hedge these translation differences.
The Group’s exposure to fluctuations in exchange rates is shown below where a change in value of foreign currencies against sterling would have the following impact on the results of the Group.
A 1% change in exchange rates results in:
31 december 2014
£million
31 December 2013
£million
Change in profit 0.3 0.2
Change in reserves/net assets 1.6 1.4
A 1% change in the Qatari rial exchange rate would result in a £0.1 million change in profit and a £0.5 million change in reserves/net assets.
(b) Market price risk – currency exchange rate hedges
The Group seeks to control its exposure to changes in currency rates by using currency rate swaps to limit the impact on the interest charge in the income statement. Contracts in place at the year end were as follows:
31 december 2014 31 December 2013
Nominal value
US$ million MaturityExchange
rate
Nominal value
US$ million MaturityExchange
rate
Currency exchange rate hedges 85.0 2021 1.69 n/a n/a n/a
155.0 2024 1.69
110.0 2026 1.69
350.0
The fair value of currency exchange rate hedges at 31 December 2014 is estimated at £5.4 million (2013: n/a). The contracts are designated as cash flow hedges and to the extent that the hedges are effective hedges, changes in their fair value are recognised directly in equity. The fair values of the hedge instruments are calculated and provided by respective counterparty banks. No charges have gone through the income statement in the year (2013: n/a) in respect of changes in the fair value of the hedges. A gain of £5.4 million (2013: n/a) was booked to other comprehensive income in respect to changes in fair value of the hedges.

Notes to the consolidated financial statements continued
140 INTERSERVE ANNUAL REPORT 2014 FINANCIAL STATEMENTS NOTES TO ThE CONSOLIdATEd FINANCIAL STATEMENTS
22. Financial risk management continued
(c) Market price risk – interest rate hedges
The Group seeks to control its exposure to changes in interest rates by using interest rate swaps to limit the impact on the interest charge in the income statement. Contracts in place at the year end were as follows:
31 december 2014 31 December 2013
Nominal value
£million Maturity Strike price
Nominal value
£million Maturity Strike price
Interest rate swaps Current 20.0 2015 1.50% Current 20.0 2015 1.50%
Current 10.0 2015 1.58% Current 10.0 2015 1.58%
The fair value of interest rate hedges at 31 December 2014 is estimated at (£0.1) million (2013: (£0.3) million). The contracts are designated as cash flow hedges and to the extent that the hedges are effective hedges, changes in their fair value are recognised directly in equity. The fair values of the hedge instruments are calculated using computer valuation models operated by counterparty banks. No charges have gone through the income statement in the year (2013: £nil) in respect of changes in the fair value of the hedges. A gain of £0.2 million (2013: gain of £0.8 million) was charged through other comprehensive income in respect to changes in fair value of the hedges.
The use of interest rate caps and swaps, where appropriate, diminishes the impact of an interest rate change. The impact of a 1% change in interest rate to the Group’s results is shown in the table below.
A 1% change in exchange rates results in:
31 december 2014
£million
31 December 2013
£million
Change in profit 1.4 0.9
(d) Credit risk
The Group’s principal financial assets are bank balances and cash, trade and other receivables and investments, which represent the Group’s maximum exposure to credit risk in relation to financial assets.
The Group’s credit risk is primarily attributable to its trade receivables. The amounts presented in the balance sheet are net of allowances for doubtful receivables, estimated by the Group’s management based on prior experience and their assessment of the current economic environment. To manage this risk, credit references are taken and where appropriate parent company guarantees and letters of credit are sought along with monthly monitoring of age and recoverability of trade receivables.
Apart from receivables due from customers related to HM Government, the Group has no significant concentration of credit risk, with exposure spread over a number of counterparties and customers.
(e) Liquidity risk
The Group seeks to maintain sufficient facilities to ensure that it has access to funding to meet current and anticipated future funding requirements determined from budgets and medium-term plans.
The maturity of financial assets and liabilities, with the exception of interest rate hedges above, are discussed in the specific asset and liability footnotes.
(f) Capital risk
The Group manages its capital to ensure that entities in the Group will be able to continue as going concerns, whilst seeking to optimise the debt and equity balance, in order to maximise the return to stakeholders. The capital structure of the Group consists of net debt, which includes cash, deposits and borrowings (note 21), and equity attributable to equity holders of the parent.
The Group has, over recent years, had a policy of progressively increasing dividends paid to shareholders. The Group may adjust the capital structure of the Group by returning capital to shareholders, issue new shares or sell assets to reduce debt.
The Group is not subject to externally imposed capital requirements but is subject to covenants in its loan agreements which seek to maintain the level of debt and interest that the Group may take on at serviceable levels by reference to the Group’s earnings which ultimately limits the amount of debt that the Group can take on.

141INTERSERVE ANNUAL REPORT 2014 FINANCIAL STATEMENTS NOTES TO ThE CONSOLIdATEd FINANCIAL STATEMENTS
OVERVIEW
GO
VERNA
NCE
FINA
NCIA
L STATEMEN
TS STRATEG
IC REPORT
23. Trade and other payables - amounts falling due within one year31 december
2014£million
31 December 2013
£million
31 December 2012
£million
Obligations under finance leases (note 25) 0.3 0.3 0.5
Trade payables 278.4 252.5 214.0
Advances received 34.0 35.2 20.6
Other taxation and social security 73.6 37.3 33.8
Other payables 63.6 31.5 34.9
Accruals and deferred income 298.8 235.5 251.7
748.7 592.3 555.5
24. Trade and other payables - amounts falling due after more than one year31 december
2014£million
31 December 2013
£million
31 December 2012
£million
Obligations under finance leases (note 25) 0.5 0.6 0.7
Trade payables 0.5 0.4 0.6
Other payables 13.8 12.5 11.9
14.8 13.5 13.2
The carrying amount of trade and other payables approximates to their fair value.
The average credit period taken for trade purchases is 52 days (2013: 61 days).
Ageing of amounts payable excluding advances, finance leases, accruals and deferred income is as follows:31 december
2014£million
31 December 2013
£million
31 December 2012
£million
Less than one year 415.6 321.3 282.7
Between one and two years 14.3 12.9 12.5
429.9 334.2 295.2
25. Obligations under finance and operating leases
(a) Finance leases
Minimum lease payments
Present value of minimum
lease payments
2014£million
2013£million
2014£million
2013£million
Amounts payable under finance leases:
Within one year 0.4 0.3 0.3 0.3
In the second to fifth years inclusive 0.5 0.7 0.5 0.6
0.9 1.0 0.8 0.9
Less: future finance charges (0.1) (0.1) n/a n/a
Present value of lease obligations 0.8 0.9 0.8 0.9
Certain of the Group’s plant and equipment is held under finance leases. The average lease term is five to six years. For the year ended 31 December 2014 the average effective borrowing rate was 3.0% (2013: 3.2%). Interest rates are fixed at the contract date. All leases are on a fixed repayment basis and no arrangements have been entered into for contingent rental payments.
All finance lease obligations are denominated in sterling.
The carrying amount of the Group’s finance lease obligations approximate their fair value.
The Group’s obligations under finance leases are secured by the lessors’ charges over the leased assets.

Notes to the consolidated financial statements continued
142 INTERSERVE ANNUAL REPORT 2014 FINANCIAL STATEMENTS NOTES TO ThE CONSOLIdATEd FINANCIAL STATEMENTS
25. Obligations under finance and operating leases continued
(b) Operating leases
At the balance sheet date, the Group had outstanding commitments for future minimum lease payments under non-cancellable operating leases, which fall due as follows:
31 december 2014 31 December 2013
Land and buildings£million
Other£million
Total£million
Land and buildings£million
Other£million
Total£million
Within one year 12.6 14.8 27.4 12.9 10.6 23.5
In the second to fifth years inclusive 27.3 14.0 41.3 27.7 12.9 40.6
After five years 10.9 - 10.9 12.6 0.3 12.9
50.8 28.8 79.6 53.2 23.8 77.0
The majority of leases of land and buildings are subject to rent reviews at periodic intervals of between three and five years and are based on market rates.
26. ProvisionsContract
provisions£million
Other£million
Total£million
At 1 January 2013 40.5 10.8 51.3
Additional provision in the year 10.3 2.8 13.1
Acquisitions - 3.3 3.3
Release (10.8) (0.1) (10.9)
Utilisation of provision (5.8) (2.5) (8.3)
Exchange differences - (0.5) (0.5)
At 31 December 2013 34.2 13.8 48.0
Additional provision in the year 7.5 2.7 10.2
Acquisitions (note 12) 12.1 1.9 14.0
Release (11.5) (1.5) (13.0)
Utilisation of provision (8.8) (2.0) (10.8)
Exchange differences - 0.3 0.3
At 31 december 2014 33.5 15.2 48.7
31 december 2014
£million
31 December 2013
£million
31 December 2012
£million
Included in current liabilities 29.2 18.1 24.2
Included in non-current liabilities 19.5 29.9 27.1
48.7 48.0 51.3
The impact of discounting is not material.
Contract provisions include costs of site clearance, remedial costs and other contractual provisions. These are expected to be utilised on final settlement of the relevant contracts.

143INTERSERVE ANNUAL REPORT 2014 FINANCIAL STATEMENTS NOTES TO ThE CONSOLIdATEd FINANCIAL STATEMENTS
OVERVIEW
GO
VERNA
NCE
FINA
NCIA
L STATEMEN
TS STRATEG
IC REPORT
27. Share capital31 december
2014£million
31 December 2013
£million
31 December 2012
£million
Issued and fully paid:
143,917,617 ordinary shares of 10p each (2013: 129,053,768 ordinary shares of 10p each) 14.4 12.9 12.7
Sharesthousands
Share capital£million
At 1 January 2014 126,846.9 12.7
Share awards issued in 2013 2,206.8 0.2
At 31 December 2013 129,053.7 12.9
Equity placing 12,897.8 1.3
Share awards issued in 2014 1,966.1 0.2
At 31 December 2014 143,917.6 14.4
12,897,771 ordinary shares, being 9.99% of the existing share capital, were issued at 580.0p on 5 March 2014 via an equity placing, raising gross proceeds of £74.8 million to partially fund the acquisition of Initial Facilities (see note 12).
Awards were granted during the year as indicated below. Exercise and vesting details are stated in the Directors’ Remuneration Report on pages 94 to 98. Outstanding options and awards over shares in the Company at 31 December 2014 were as follows:
31 december 2014 31 December 2013
date of grant
Subscription price per 10p
share
Number of beneficiaries
including directors
Number of shares
Number of beneficiaries
including directors
Number of shares
(a) Executive share option scheme
26 May 2004 253.25p - - 3 71,000
14 March 2005 359.33p 8 342,042 10 375,744
342,042 446,744
(b) Performance Share Plan
20 April 2011 Nil 7 107,413 59 1,957,437
11 April 2012 Nil 96 2,492,832 100 2,547,448
9 April 2013 Nil 96 1,508,872 100 1,541,431
13 May 2014 Nil 121 1,432,377 - -
27 May 2014 Nil 2 15,828 - -
5,557,322 6,046,316
(c) Sharesave Scheme 14 May 2010 214.50p - - 5 2,030
15 April 2011 231.00p 4 1,326 717 273,468
5 April 2012 238.00p 939 345,388 1,088 399,058
4 April 2013 398.00p 1,324 292,318 1,572 345,945
9 April 2014 511.00p 2,157 667,222 - -
30 September 2014 529.00p 2,117 626,248 - -
1,932,502 1,020,501

Notes to the consolidated financial statements continued
144 INTERSERVE ANNUAL REPORT 2014 FINANCIAL STATEMENTS NOTES TO ThE CONSOLIdATEd FINANCIAL STATEMENTS
28. Contingent liabilities
The Company and its subsidiaries are, from time to time, parties to legal proceedings and claims which arise in the ordinary course of business. Appropriate provision has been made in these accounts for all material uninsured liabilities resulting from proceedings that are, in the opinion of the directors, likely to materialise.
The Company and certain subsidiary undertakings have, in the normal course of business, given performance guarantees and provided indemnities to third parties in relation to performance bonds and other contract-related guarantees. These relate to the Group’s own contracts and to the Group’s share of the contractual obligations of certain joint ventures and associated undertakings. The Group acts as guarantor for the following:
Maximum guarantee Amounts utilised
2014£million
2013£million
2014£million
2013£million
Joint ventures and associates
Borrowings 16.2 13.6 0.6 0.3
Bonds and guarantees 205.1 177.0 115.9 102.0
221.3 190.6 116.5 102.3
29. Share-based payments
Under the Group’s share-based incentive schemes the following expense was charged:
2014£million
2013£million
Performance Share Plan 3.0 5.4
Sharesave Scheme 0.4 0.1
Total charge 3.4 5.5
Cash settled 0.5 0.6
Equity settled 2.9 4.9
Total charge 3.4 5.5
(a) Executive share option scheme
The executive share option scheme provides for a grant price equal to the average quoted market price of the Group’s shares on the date of grant. The vesting period was generally three to four years. If the options remain unexercised after a period of 10 years from the date of grant, the options lapse. Furthermore, options are normally forfeited if the employee leaves the Group before the options vest.
2014 2013
Options number
weighted average exercise
price £
Options number
Weighted average exercise
price£
Options granted since 7 November 2002:
Outstanding at beginning of period 446,744 3.42 1,104,727 3.16
Exercised during the period (104,702) 2.87 (642,429) 2.97
Lapsed during the period - - (15,554) 3.59
Outstanding and exercisable at the end of the period 342,042 3.59 446,744 3.42
The average share price during the year was £6.25. The outstanding options at the end of the period have an exercise price of £3.59 and have a remaining contractual life of 0.2 years.
The inputs to the Black-Scholes models in respect of the grants up to 2005 are set out in the 2010 Annual Report and Financial Statements. There have been no grants under these schemes since 2005.

145INTERSERVE ANNUAL REPORT 2014 FINANCIAL STATEMENTS NOTES TO ThE CONSOLIdATEd FINANCIAL STATEMENTS
OVERVIEW
GO
VERNA
NCE
FINA
NCIA
L STATEMEN
TS STRATEG
IC REPORT
(b) Performance Share Plan
The Performance Share Plan is a “free” share award with an effective exercise price of £nil. For certain participants, one-third of their award is subject to a Total Shareholder Return (TSR) performance condition with performance compared to a comparator group. All awards are subject to an Earnings per Share (EPS) performance condition. The performance period is three years. Further details of these conditions are set out in the Directors’ Remuneration Report on page 96. Awards are normally forfeited if the employee leaves the Group before the awards vest.
2014Awardsnumber
2013Awardsnumber
Outstanding at beginning of period 6,046,316 6,140,423
Granted during the period 1,487,285 1,546,315
Exercised during the period (1,753,963) (1,564,400)
Lapsed during the period (222,316) (76,022)
Outstanding at the end of the period 5,557,322 6,046,316
Exercisable at the end of the period 107,413 -
The remaining weighted average contractual life is 3.1 years (2013: 1.5 years).
The Group engaged external consultants to calculate the fair value of these awards at the date of grant. The valuation model used to calculate the fair value of the awards granted under this plan was a stochastic valuation model, the inputs of which are detailed below:
2014grants
2013grants
2012grants
Weighted average share price 694.0p 466.1p 275.8p
Weighted average exercise price 0p 0p 0p
Expected volatility 23.1% 26.4% 33.0%
Expected life 3 years 3 years 3 years
Risk-free rate 1.1% 0.3% 0.5%
Expected dividend yield 0.0% 0.0% 0.0%
Average fair value of award per share 462.5p 348.6p 220.0p
(c) Sharesave Scheme
The Sharesave Scheme is an all-employee HMRC-approved share scheme. The scheme involves employees saving a set amount from their salary for a period of three years. At the end of the three-year period the employee is offered the opportunity to purchase shares based on the amount saved at an option price set at the start of the period. The option price for the 2012, 2013 and 2014 grants was set at a 20% discount of the average share price over five days’ trading prior to the offer date of the scheme.
2014 2013
Options number
weighted average exercise
price £
Options number
Weighted average exercise
price £
Outstanding at beginning of period 1,020,501 2.90 1,155,913 2.24
Granted during the period 1,347,926 5.19 363,839 3.98
Exercised during the period (273,733) 2.35 (344,377) 2.08
Lapsed during the period (162,192) 3.76 (154,874) 2.29
Outstanding at the end of the period 1,932,502 4.51 1,020,501 2.90
Exercisable at the end of the period 1,326 2.31 2,030 2.14
The outstanding options at the end of the period had a weighted average exercise price of £4.51 (2013: £2.90) and had a remaining weighted average contractual life of 2.6 years (2013: 1.5 years).

146 INTERSERVE ANNUAL REPORT 2014 FINANCIAL STATEMENTS NOTES TO ThE CONSOLIdATEd FINANCIAL STATEMENTS
29. Share-based payments continued
(c) Sharesave Scheme continued
Notes to the consolidated financial statements continued
The inputs into the Black-Scholes model are as follows:
2014grants
2013grants
2012grants
Share price at date of grant 646.5p 469.5p 276.4p
Exercise price 520.3p 398.0p 238.0p
Expected volatility 23.2% 27.2% 32.4%
Expected life 3 years 3 years 3 years
Risk-free rate 0.7% 0.9% 1.3%
Expected dividend yield 4.9% 6.3% 7.6%
Fair value of award per share 113.5p 72.5p 45.5p
Expected volatility was determined by calculating the historical volatility of the Group’s share price over the previous two years. The expected life used in the model has been adjusted, based on management’s best estimate, for the effects of non-transferability, exercise restrictions and behavioural considerations.
30. Defined benefit retirement schemes
The principal pension schemes within the Group have been valued for the purposes of IAS 19 Employee benefits. For each of these pension schemes valuation information has been updated by Lane Clark & Peacock LLP, qualified independent actuaries, to take account of the requirements of IAS 19 in order to assess the liabilities of the various schemes as at 31 December 2014.
Actuarial gains and losses are recognised in full in the period in which they occur. As permitted by IAS 19, actuarial gains and losses are recognised outside profit or loss and presented in other comprehensive income. The liability recognised in the balance sheet represents the present value of the various defined benefit obligations, as reduced by the fair value of plan assets. The cost of providing benefits is determined using the Projected Unit Credit Method.
The Group contributes to various defined benefit pension schemes in the UK and overseas. By far the most significant arrangement is the Interserve Pension Scheme in the UK, where benefits are generally related to service and final salary. The Group operates a defined contribution plan for new hires, with membership of the defined benefit arrangements only permitted when specific contract terms require defined benefit provision. Contributions to the defined contribution arrangements are in addition to those set out below and are charged directly to profit and loss.
The current funding target for the Group’s defined benefit schemes is to maintain assets equal to the value of the accrued benefits based on projected salaries (where relevant). The regulatory framework in the UK requires the Trustees and Group to agree upon the assumptions underlying the funding target, and then to agree upon the necessary contributions required to recover any deficit at the valuation date. There is a risk to the Group that adverse experience could lead to a requirement for the Group to make considerable contributions to recover any deficit.
29. Share-based payments

147INTERSERVE ANNUAL REPORT 2014 FINANCIAL STATEMENTS NOTES TO ThE CONSOLIdATEd FINANCIAL STATEMENTS
OVERVIEW
GO
VERNA
NCE
FINA
NCIA
L STATEMEN
TS STRATEG
IC REPORT
The following table sets out the key IAS 19 assumptions used to assess the present value of the defined benefit obligation. The assumptions shown are in relation to the Interserve Pension Scheme, which represents 92% of the total defined benefit obligation. The life expectancy assumptions shown relate to the vast majority of the membership of that scheme. Alternative assumptions have been used for the less material arrangements where the specific nature of those schemes deems it appropriate to do so. The weighted average duration of the expected benefit payments for the schemes is around 17 years.
2014 2013 2012
Significant actuarial assumptions
Retail price inflation 3.10% pa 3.40% pa 3.00% pa
Discount rate 3.60% pa 4.50% pa 4.40% pa
Post-retirement mortality (expectancy of life in years)
Male currently aged 65 87.5 87.4 87.3
Female currently aged 65 89.5 89.4 89.3
Male aged 65 in 20 years' time 89.3 89.2 89.1
Female aged 65 in 20 years' time 91.0 90.9 90.9
Other related actuarial assumptions
Consumer price index 2.10% pa 2.40% pa 2.30% pa
Pension increases in payment:
LPI/RPI 3.00%/3.10% pa 3.30%/3.40% pa 2.90%/3.00% pa
Fixed 5% 5.00% pa 5.00% pa 5.00% pa
3% or RPI if higher (capped at 5%) 3.60% pa 3.70% pa 3.50% pa
General salary increases 2.10-2.60% pa 2.40-2.90% pa 2.30-2.80% pa
The amount included in the balance sheet arising from the Group’s obligations in respect of the various pension schemes is as follows:
2014£million
2013£million
2012£million
2011£million
2010£million
Present value of defined benefit obligation 924.9 826.9 799.3 695.0 642.3
Fair value of schemes' assets (920.1) (819.2) (698.2) (638.8) (590.8)
Liability recognised in the balance sheet 4.8 7.7 101.1 56.2 51.5
The change in the net liabilities recognised in the balance sheet is comprised as follows:
2014£million
2013£million
Opening net liability 7.7 101.1
Expense charges to profit and loss 9.2 10.7
Amount recognised outside profit and loss 15.7 (21.3)
Employer contributions (27.8) (82.8)
Closing net liability 4.8 7.7
Indicative change in defined benefit obligation
Sensitivity2014
£million2013
£million
Sensitivity to significant actuarial assumptions
Price inflation +/0.5% pa +/-55 +/-50
Discount rate +/0.5% pa +/-73 +/-67
Post retirement mortality (expectancy of life in years) 1 year increase +30 +25
The sensitivities shown above reflect only the change in the assessed defined benefit obligation. In practice any movement in assumptions is likely to be accompanied by a partially offsetting change in asset values, and the corresponding overall impact on the net liability is therefore likely to be lower than the amounts above.

Notes to the consolidated financial statements continued
148 INTERSERVE ANNUAL REPORT 2014 FINANCIAL STATEMENTS NOTES TO ThE CONSOLIdATEd FINANCIAL STATEMENTS
30. Defined benefit retirement schemes continued
The amounts recognised in the income statement are as follows:
2014£million
2013£million
Employer’s part of current service cost 8.0 7.4
Administration costs 1.6 1.9
Bulk transfer (0.1) -
Net interest (income)/expense (0.3) 1.4
Total expense recognised in the income statement 9.2 10.7
The current service cost and administration costs are included within operating profit. The interest cost is included within financing costs.
The current allocation of the schemes’ assets is as follows:
31 december 2014 31 December 2013 31 December 2012
Current allocation
Fair value £million
Current allocation
Fair value £million
Current allocation
Fair value £million
Equities (quoted) 21% 190.7 17% 140.8 17% 115.5
Alternative investments (primarily unquoted) 13% 120.7 14% 114.1 14% 94.6
Property (unquoted) 4% 37.4 3% 25.5 3% 23.5
Insurance policies (unquoted) 40% 371.6 1% 10.1 1% 9.4
Government bonds (quoted) 11% 96.8 22% 179.6 24% 169.6
Corporate bonds (quoted) 0% 2.7 21% 171.9 25% 175.0
Infrastructure (unquoted) 10% 90.0 15% 122.5 9% 64.5
Cash and other (primarily unquoted) 1% 10.2 7% 54.7 7% 46.1
Total 100% 920.1 100% 819.2 100% 698.2
The cash item includes the profit or loss on the Interserve Pension Scheme’s investment in equity futures. As a result of this investment the Group has additional exposure to £109.4 million of equity performance as at 31 December 2014 (2013: £99.5 million). Around 70% of the Group’s direct equity investments are in relation to UK equities (2013: 81%). Holdings in Government bonds are predominantly index-linked. Alternative investments include diversified growth funds, fund of hedge funds and emerging market multi-asset funds (primarily unquoted).
During 2014 the Trustee of the Interserve Pension Scheme entered a buy-in contract to insure some of the benefits of a subset of the pension membership of the Scheme. The policy has been valued as the replacement cost at the accounting date, as provided by the insurer, with the exception of a proportion of the policy (around 3%) which precisely matches the corresponding member benefits. This small matching element has been valued at the same amount as the defined benefit obligation in respect of the matched benefits. Overall, this buy-in contract protects the Group from risks associated with approximately 35% of the Scheme’s defined benefit obligation.
The infrastructure holding is predominantly the portfolio of PFI investments transferred by Interserve Plc to the Interserve Pension Scheme in November 2009 and January 2013. The schemes have not directly invested in any of the Group’s other financial instruments nor in other assets or properties used by the Group.
A reconciliation of the present value of the defined benefit obligation is as follows:
2014£million
2013£million
Opening defined benefit obligation 826.9 799.3
Employer’s part of current service cost 8.0 7.4
Interest cost 36.4 34.3
Contributions by schemes' participants 0.4 0.4
Actuarial loss/(gain) due to:
Changes in financial assumptions 95.4 11.2
Changes in demographic assumptions 1.2 6.9
Experience on defined benefit obligations (9.5) 1.2
Benefits paid (36.4) (34.0)
Bulk transfers 2.5 0.2
Closing defined benefit obligation 924.9 826.9
30. Defined benefit retirement schemes

149INTERSERVE ANNUAL REPORT 2014 FINANCIAL STATEMENTS NOTES TO ThE CONSOLIdATEd FINANCIAL STATEMENTS
OVERVIEW
GO
VERNA
NCE
FINA
NCIA
L STATEMEN
TS STRATEG
IC REPORT
A reconciliation of the fair value of the schemes’ assets is as follows:
2014£million
2013£million
Opening fair value of the schemes' assets 819.2 698.2
Interest on schemes' assets 36.7 32.9
Actual return on schemes' assets less interest on schemes' assets 71.4 40.6
Contributions by the employer 27.8 82.8
Contributions by schemes' participants 0.4 0.4
Benefits paid (36.4) (34.0)
Administration costs (1.6) (1.9)
Bulk transfers 2.6 0.2
Closing fair value of the schemes' assets 920.1 819.2
Based on current contribution rates and payroll, the Group expects to contribute £25.1 million to the various defined benefit arrangements during 2015. This includes deficit contributions to the Interserve Pension Scheme of £12.9 million.
The Group has assessed that no further liability arises under IFRIC 14 IAS 19 - The limit on a defined benefit asset, minimum funding requirements and their interaction on the basis that the scheme rules allow the Company an unconditional right to refunds assuming the gradual settlement of plan liabilities over time until all members have left the scheme.
31. Related party transactions
Transactions between the Company and its subsidiaries, which are related parties, have been eliminated on consolidation and are not disclosed in this note. Transactions between the Group and its associates are disclosed below.
During the year, Group companies entered into the following transactions with related parties who are not members of the Group:
Sales of goods and services
Purchases of goods and services
Amounts due from related parties
Amounts owed to related parties
2014£million
2013£million
2014£million
2013£million
2014£million
2013£million
2014£million
2013£million
Joint-venture entities 2.5 1.2 - - 0.4 0.1 - -
Associates 137.6 127.6 0.8 1.0 21.2 32.2 0.5 16.2
Sales and purchases of goods and services to related parties were made on normal trading terms.
The amounts outstanding are unsecured and will be settled in cash. No guarantees have been given or received in respect of the outstanding balances. No provisions have been made for doubtful debts in respect of the amounts owed by related parties.
Key management personnel are considered to be the directors of Interserve Plc. Dividends totalling £0.2 million (2013: £0.1 million) were paid in the year in respect of ordinary shares held by the Company’s directors. Other amounts paid to key management personnel are given in the audited section of the Directors’ Remuneration Report on pages 90 to 101.

Notes to the consolidated financial statements continued
150 INTERSERVE ANNUAL REPORT 2014 FINANCIAL STATEMENTS NOTES TO ThE CONSOLIdATEd FINANCIAL STATEMENTS
32. Investments in joint ventures – arrangements
The composition of investment in joint ventures can be summarised as follows:
(a) PFI/PPP arrangements that have reached financial close at 31 December 2014 include:
Interserve services dates
Share of equity/ sub-debt
% £million
Total capital
required £millionContract design/build Operate
whole-life value
£million Status AwardedFully
operationalContract
end
Custodial
Addiewell Prison yes yes 73 operational mid-2006 late 2008 2033 33 2.9 100.0
Central/local government
West Yorkshire Police yes yes 170 operational mid-2012 mid-2014 2039 50 4.0 112.5
Derby Waste yes yes 145 construction Q3 2014 - 2042 50 17.5 190.8
health
Alder Hey Hospital yes yes 100 construction Q2 2013 - 2045 20 3.3 200.0
Scottish National Blood Transfusion yes yes 43 construction Q4 2014 - 2042 50 1.6 43.0
29.3
Invested to date
Shares -
Loans 10.2
Remaining commitment 19.1
29.3
Interserve’s share of the capital commitments of the joint ventures above amounts to £67.6 million (2013: £26.4 million).
(b) Non-PFI/PPP arrangements:
Share of equity/ sub-debt
% £millionContract description
Haymarket Property development venture in central Edinburgh 50/100 21.3
Rehab Jobfit Employment-related support services to the Department for Work and Pensions 49/n/a -
21.3
Invested to date
Shares -
Loans 17.8
Remaining commitment 3.5
21.3
Interserve’s share of the capital commitments of the joint ventures above amounts to £3.5 million (2013: £7.9 million).

151INTERSERVE ANNUAL REPORT 2014 FINANCIAL STATEMENTS NOTES TO ThE CONSOLIdATEd FINANCIAL STATEMENTS
OVERVIEW
GO
VERNA
NCE
FINA
NCIA
L STATEMEN
TS STRATEG
IC REPORT
33. Reconciliation of non-statutory measures
The Group uses a number of key performance indicators to monitor the performance of its business.
This note reconciles these key performance indicators to individual lines in the financial statements.
(a) Headline pre-tax profit
2014£million
2013 £million
2012£million
Profit before tax 61.9 68.1 179.8
Adjusted for:
Amortisation of acquired intangible assets 24.4 8.8 6.0
Share of associates amortisation of acquired intangible assets 0.1 0.1 0.4
Exceptional items 19.8 4.1 (110.9)
Headline pre-tax profit 106.2 81.1 75.3
(b) Operating cash flow
2014£million
2013 £million
2012£million
Cash generated by operations 10.9 43.2 33.7
Adjusted for:
Pension contributions in excess of income statement charge 18.2 18.5 28.8
Other exceptional items cash impact 18.4 2.1 4.0
Proceeds on disposal of plant and equipment - non-hire fleet 0.9 0.2 1.8
Capital expenditure - non-hire fleet (24.9) (22.1) (10.7)
Operating cash flow 23.5 41.9 57.6
(c) Free cash flow
2014£million
2013 £million
2012£million
Operating cash flow 23.5 41.9 57.6
Adjusted for:
Pension contributions in excess of income statement charge (18.2) (18.5) (28.8)
Taxes paid (10.2) (5.7) (10.7)
Dividends received from associates and joint ventures 17.8 13.7 19.8
Interest received 4.7 3.5 8.4
Interest paid (16.0) (7.8) (9.6)
Effect of foreign exchange rate change 0.8 (1.0) (0.2)
Free cash flow 2.4 26.1 36.5
(d) Operating cash conversion
2014£million
2013 £million
2012£million
Operating cash flow 23.5 41.9 57.6
Operating profit, before exceptional items and amortisation of acquired intangible assets 100.6 69.4 53.0
Full-year operating cash conversion 23.4% 60.4% 108.7%
Three-year rolling operating cash flow 123.0 163.6 165.8
Three-year rolling operating profit, before exceptional items and amortisation of acquired intangible assets 223.0 165.8 137.6
Operating cash conversion, three-year rolling average 55.2% 98.7% 120.5%

Notes to the consolidated financial statements continued
152 INTERSERVE ANNUAL REPORT 2014 FINANCIAL STATEMENTS NOTES TO ThE CONSOLIdATEd FINANCIAL STATEMENTS
33. Reconciliation of non-statutory measures continued
(e) Gross operating cash conversion
2014£million
2013 £million
2012£million
Operating cash flow 23.5 41.9 57.6
Dividends received from associates and joint ventures 17.8 13.7 19.8
Gross operating cash flow 41.3 55.6 77.4
Operating profit, before exceptional items and amortisation of acquired intangible assets 100.6 69.4 53.0
Share of results of associates and joint ventures, before exceptional items and amortisation of acquired intangible assets 16.6 17.3 25.4
Total operating profit, before exceptional items and amortisation of acquired intangible assets 117.2 86.7 78.4
Full-year gross operating cash conversion 35.2% 64.1% 98.7%
Three-year rolling gross operating cash flow 174.3 217.7 238.3
Three-year rolling total operating profit before exceptional items and amortisation of acquired intangible assets 282.3 236.4 221.9
Gross operating cash conversion, three-year rolling average 61.7% 92.1% 107.4%
(f) Gross revenue
2014£million
2013 £million
2012£million
Consolidated revenue 2,913.0 2,192.6 1,958.4
Share of revenues of associates and joint ventures 392.3 389.3 411.2
Gross revenue 3,305.3 2,581.9 2,369.6
(g) Operating margins
2014£million
2013 £million
2012£million
Total operating profit before exceptional items and amortisation of acquired intangible assets 117.2 86.7 78.4
Gross revenue 3,305.3 2,581.9 2,369.9
Total operating margin 3.5% 3.4% 3.3%

OVERVIEW
GO
VERNA
NCE
FINA
NCIA
L STATEMEN
TS STRATEG
IC REPORT
Company balance sheetat 31 December 2014
153INTERSERVE ANNUAL REPORT 2014 FINANCIAL STATEMENTS COMPANy bALANCE ShEET 153INTERSERVE ANNUAL REPORT 2014 FINANCIAL STATEMENTS COMPANy bALANCE ShEET
OVERVIEW
GO
VERNA
NCE
FINA
NCIA
L STATEMEN
TS STRATEG
IC REPORT
Company balance sheetat 31 December 2014
Notes2014
£million2013
£million
Fixed assets
Tangible fixed assets E 4.2 3.7
Interests in associated undertakings F 2.7 2.7
Investments G 0.3 0.3
Investments in subsidiary undertakings H 463.9 463.9
471.1 470.6
Current assets
Debtors:
Due within one year I 154.3 127.1
Due after one year I 3.4 5.8
Cash at bank and in hand 27.6 23.7
185.3 156.6
Creditors: amounts falling due within one year
Bank overdrafts and loans (122.1) (136.3)
Trade creditors (0.4) (0.3)
Other creditors J (60.4) (95.4)
Short-term provisions K (0.2) (0.1)
(183.1) (232.1)
Net current assets/(liabilities) 2.2 (75.5)
Total assets less current liabilities 473.3 395.1
Creditors: amounts falling due after more than one year
Other creditors L (6.5) (6.5)
Long-term provisions K (0.2) -
Net assets 466.6 388.6
Capital and reserves
Called-up share capital N 14.4 12.9
Share premium account O 115.3 115.0
Capital redemption reserve O 0.1 0.1
Acquisition reserve O 180.9 108.5
Profit and loss account O 155.9 152.1
Shareholders’ funds P 466.6 388.6
These financial statements were approved by the Board of Directors on 26 February 2015. Signed on behalf of the Board of Directors
A M Ringrose T P haywoodDirector Director
Company number: 00088456

Notes to the Company financial statementsfor the year ended 31 December 2014
154 INTERSERVE ANNUAL REPORT 2014 FINANCIAL STATEMENTS NOTES TO ThE COMPANy FINANCIAL STATEMENTS
Notes to the Company financial statementsfor the year ended 31 December 2014
154 INTERSERVE ANNUAL REPORT 2014 FINANCIAL STATEMENTS NOTES TO ThE COMPANy FINANCIAL STATEMENTS
A) Accounting policies
The financial statements have been prepared in accordance with applicable United Kingdom law and accounting standards. The accounting policies have been applied consistently throughout the year and the previous year.
The particular policies adopted by the directors are described below.
Going concern
The directors have made enquiries and have a reasonable expectation that the Company has adequate resources to continue in existence for the foreseeable future. For this reason they continue to adopt the going concern basis in preparing the financial statements.
Basis of accounting
These financial statements have been prepared in accordance with the historical cost convention.
Foreign currency
Transactions denominated in foreign currency are translated at the rates ruling at the dates of the transactions. Monetary assets and liabilities denominated in foreign currencies at the balance sheet date are translated at the rates ruling at that date. These translation differences are dealt with in the profit for the year.
Property, plant and equipment
Tangible fixed assets are carried at cost less any accumulated depreciation and any impairment losses. Depreciation is provided on a straight-line basis at rates ranging between:
Freehold land NilFreehold buildings 2%Leasehold property Over period of leaseComputer hardware 33.3%Computer software 33.3%Furniture and office equipment 33.3%Plant and equipment 10% to 20%
The costs of operating leases are charged to the profit and loss account as they accrue.
Provisions
Provisions are recognised when the Company has a present obligation (legal or constructive) as a result of a past event, it is probable that an outflow of resources embodying economic benefits will be required to settle the obligation and a reliable estimate can be made of the amount of the obligation. Where the Company expects some or all of a provision to be reimbursed, the reimbursement is recognised as a separate asset but only when the reimbursement is virtually certain. The expense relating to any provision is presented in the income statement net of any reimbursement. If the effect of the time value of money is material, provisions are discounted using an appropriate rate that takes into account the risks specific to the liability. Where discounting is used, the increase in the provision due to the passage of time is recognised as a finance cost.
Investments
Investments are stated at cost less provision for any impairment in value.
Pensions
The Company operates a pension scheme for the benefit of permanent members of staff, the Interserve Pension Scheme. This contains defined benefit and defined contribution pension sections. The Company also set up a new defined contribution section of the Interserve Pension Scheme with effect from 1 November 2002. Actuarial valuations of the Interserve Pension Scheme are carried out every three years.
For the purposes of FRS 17 Retirement benefits, the Company is unable to identify its share of the underlying assets and liabilities in the main Group Scheme, the Interserve Pension Scheme, on a consistent and reasonable basis. Therefore, the Company will account for contributions to the scheme as if it were a defined contribution scheme. Note 30 to the Annual Report and Financial Statements of the Group sets out details of the IAS 19 net pension liability of £4.8 million for the Company (2013: £7.7 million).
For defined contribution schemes, the amount recognised in the profit and loss account is equal to the contributions payable to the schemes during the year.
The defined benefit scheme was closed on 31 December 2009 with the exception of passport members. All non-passport members transferred to the defined contribution scheme as at 1 January 2010.

155INTERSERVE ANNUAL REPORT 2014 FINANCIAL STATEMENTS NOTES TO ThE COMPANy FINANCIAL STATEMENTS
OVERVIEW
GO
VERNA
NCE
FINA
NCIA
L STATEMEN
TS STRATEG
IC REPORT
Taxation
Current tax is provided at amounts expected to be paid (or recovered) using the tax rates and laws that have been enacted or substantively enacted by the balance sheet date.
Deferred tax is provided in full on timing differences which result in an obligation at the balance sheet date to pay more tax, or a right to pay less tax, at a future date, at rates expected to apply when they crystallise based on current tax rates and law. Timing differences arise from the inclusion of items of income and expenditure in taxation computations in periods different from those in which they are included in the financial statements. Deferred tax is not provided on timing differences arising from the revaluation of fixed assets where there is no commitment to sell the asset, or on unremitted earnings of subsidiaries or associates where there is no commitment to remit these earnings. Deferred tax assets are recognised to the extent that it is regarded as more likely than not that they will be recovered. Deferred tax assets and liabilities are not discounted.
Financial instruments
DebtorsDebtors are measured at fair value. Appropriate allowances for estimated irrecoverable amounts are recognised in the income statement where there is objective evidence that the asset is impaired.
Cash and cash equivalentsCash and cash equivalents comprise cash on hand, demand deposits and other short-term highly liquid investments that are readily convertible to a known amount of cash and are subject to an insignificant risk of changes in value.
bank borrowingsInterest-bearing bank loans and overdrafts are recorded at the proceeds received, net of direct issue costs. Finance charges, including premiums payable on settlement or redemption and direct issue costs, are accounted for on an accruals basis in the income statement and are added to the carrying amount of the instrument to the extent that they are not settled in the period in which they arise.
CreditorsCreditors are measured at fair value.
Equity instrumentsEquity instruments issued by the Company are recorded at the proceeds received, net of direct issue costs.
Derivative financial instruments and hedge accountingFinancial assets and financial liabilities are recognised on the Group’s balance sheet when the Company becomes a party to the contractual provisions of the instrument. Transactions in derivative financial instruments are for risk management purposes only. The Company uses derivative financial instruments to hedge its exposure to interest rate and foreign currency risk. To the extent that such instruments are matched to underlying assets or liabilities, they are accounted for using hedge accounting. Derivatives are initially recognised at fair value at the date a derivative contract is taken out and subsequently remeasured at fair value at each balance sheet date. Changes in fair value of derivative instruments that are designated as, and effective as, hedges of future cash flows and net investments are recognised directly in the other income statement. Any ineffective portion is recognised immediately in the income statement. Amounts deferred in equity are recycled through the income statement in the same period in which the underlying hedged item is recognised in the income statement. However, when the transaction that is being hedged results in a non-financial asset or non-financial liability, the gains and losses previously accumulated in equity are transferred from equity and included in the initial measurement of the cost of that asset or liability. Hedge accounting is discontinued when the hedging instrument expires or is sold, terminated, or exercised, or no longer qualifies for hedge accounting. Any cumulative gain or loss on the hedging instrument recognised in equity at that time is retained in equity until the forecast transaction occurs. If a hedged transaction is no longer expected to occur, any cumulative gain or loss recognised in equity is transferred to the income statement for the period.
Changes in fair value of derivative instruments that do not qualify for hedge accounting, or have not been designated as hedges, are recognised in the income statement as they arise. These derivative instruments are designated as fair value through the profit or loss. Derivatives embedded in other financial instruments or other host contracts are treated as separate derivatives when their economic risks and characteristics are not closely related to those of the host contracts and the host contracts are not carried at fair value.
Share-based payments The Company has applied the requirements of FRS 20 Share-based payment. In accordance with the transitional provisions, FRS 20 has been applied to all grants of equity instruments after November 2002 that were unvested as at January 2004. The Company issues share-based payments to certain employees of the Group headed by the Company. The fair value determined at the grant date is expensed on a straight-line basis over the vesting period, based on the Company’s estimate of shares that will eventually vest. Fair value for grants pre-2006 was measured by the use of the Black-Scholes model and subsequently a stochastic model was used. Note 29 to the Annual Report and Financial Statements of the Group sets out details of the share-based payments. The total value of equity-settled share-based payments is credited to the profit and loss reserve of the Company. Share-based payments to employees of subsidiaries of the Company are recharged to the relevant employer and the recharged income is credited to the profit and loss account of the Company.

Notes to the Company financial statements continued
156 INTERSERVE ANNUAL REPORT 2014 FINANCIAL STATEMENTS NOTES TO ThE COMPANy FINANCIAL STATEMENTS
A) Accounting policies continued
Exemptions
The Company’s financial statements are included in the Interserve Plc consolidated financial statements for the year ended 31 December 2014. As permitted by section 408 of the Companies Act 2006, the Company has not presented its own profit and loss account. The Company has also taken advantage of the exemption from presenting a cash flow statement under the terms of FRS 1 Cash flow statements. The Company is also exempt under the terms of FRS 8 Related party disclosures from disclosing transactions with other wholly-owned members of the Interserve Group. The Interserve Plc consolidated financial statements for the year ended 31 December 2014 contain financial instrument disclosures which comply with FRS 29 Financial instruments: disclosures. The Company has therefore taken advantage of the exemption in FRS 29 not to present separate financial instrument disclosures for the Company.
B) Profit for the year
Interserve Plc reported a profit after taxation for the financial year ended 31 December 2014 of £33.3 million (2013: 12.1 million).
The auditors’ remuneration for audit services to the Company was £0.2 million (2013: £0.1 million).
C) Employees
The average number of persons employed, being full-time equivalents, by the Company during the year, including directors, was 153 (2013: 130).
The costs incurred in respect of these employees were:
2014£million
2013£million
Wages and salaries 10.9 9.4
Social security costs 1.2 0.8
Share-based payments 2.7 3.0
Pension costs 0.7 0.7
15.5 13.9
2014£million
2013£million
Share-based payments to employees of the Company 2.7 2.8
Share-based payments to employees of subsidiaries 0.7 2.7
Group share-based payment charge 3.4 5.5
Cash settled 0.5 0.6
Equity settled 2.9 4.9
Group share-based payment charge 3.4 5.5
Directors’ remuneration
Detailed disclosures of directors’ aggregated individual remuneration and share-based payments included in the above analysis are given in the audited section of the Directors’ Remuneration Report on pages 90 to 101 and should be regarded as an integral part of this note.
D) Dividends2014
£million2013
£million
Amounts recognised as distributions to equity holders in the period:
Final dividend for the year ended 31 December 2013 of 14.7p (2012: 14.1p) per share 20.8 17.9
Interim dividend for the year ended 31 December 2014 of 7.5p (2013: 6.8p) per share 10.7 8.7
31.5 26.6
Proposed final dividend for the year ended 31 December 2014 of 15.5p per share 22.3
The proposed final dividend is subject to approval by shareholders at the Annual General Meeting and has not been included as a liability in these financial statements.
MAC_RF66456_B_P05 tp.indd 156 20/03/2015 12:21

157INTERSERVE ANNUAL REPORT 2014 FINANCIAL STATEMENTS NOTES TO ThE COMPANy FINANCIAL STATEMENTS
OVERVIEW
GO
VERNA
NCE
FINA
NCIA
L STATEMEN
TS STRATEG
IC REPORT
E) Tangible fixed assets
(a) Movement during the year
Land and buildings£million
Other£million
Total£million
Cost
At 1 January 2014 4.4 4.9 9.3
Additions 1.1 0.4 1.5
Disposals (0.1) - (0.1)
At 31 December 2014 5.4 5.3 10.7
Depreciation
At 1 January 2014 2.2 3.4 5.6
Charge in year 0.1 0.8 0.9
At 31 December 2014 2.3 4.2 6.5
Net book value
At 31 December 2014 3.1 1.1 4.2
At 31 December 2013 2.2 1.5 3.7
(b) Land and buildings
2014£million
2013£million
Net book value of land and buildings
Freehold:
Land at cost 2.0 1.0
Buildings at cost less depreciation - -
2.0 1.0
Leaseholds over 50 years at cost less depreciation 1.1 1.2
Total 3.1 2.2
(c) Operating leases
The Company had annual commitments under non-cancellable operating leases that expire as follows:
Land and buildings Other
2014£million
2013£million
2014£million
2013£million
Within one year - 0.3 0.1 0.1
Within two to five years - - 0.1 0.1
After five years 1.1 1.1 - -
1.1 1.4 0.2 0.2
The majority of leases of land and buildings are subject to rent reviews at periodic intervals of between three and five years.
F) Investment in associate undertakings2014
£million2013
£million
Investment 2.7 2.7
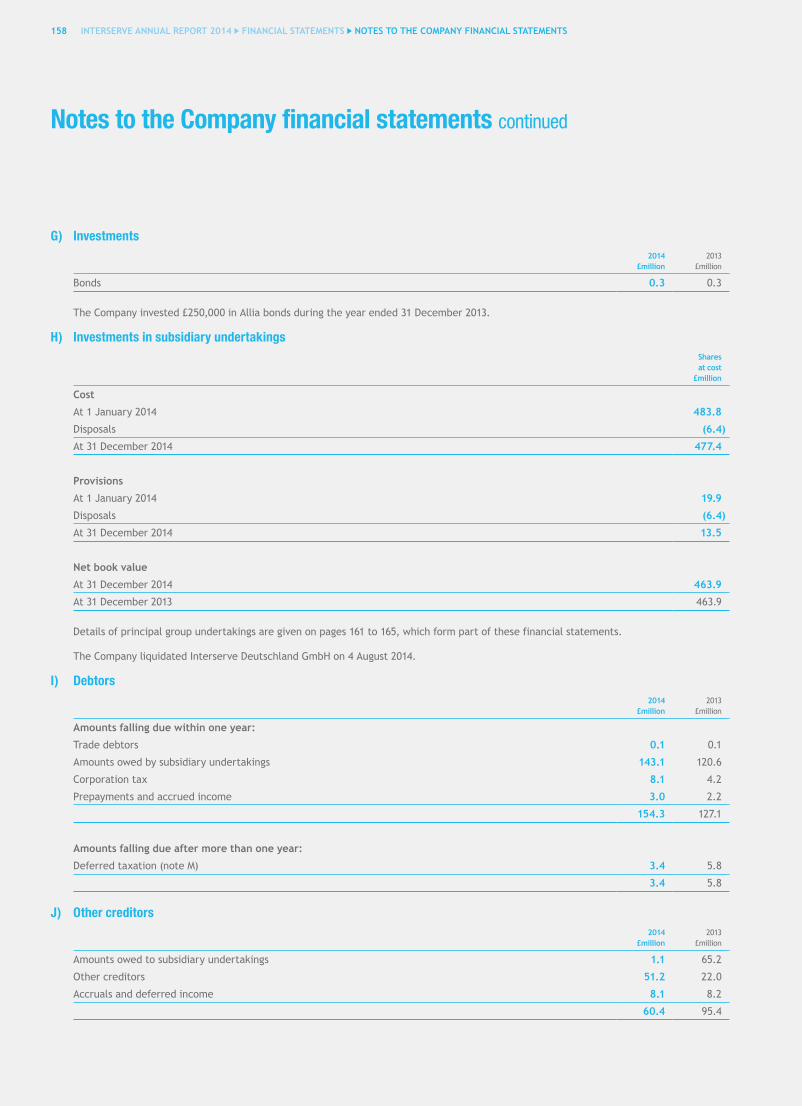
Notes to the Company financial statements continued
158 INTERSERVE ANNUAL REPORT 2014 FINANCIAL STATEMENTS NOTES TO ThE COMPANy FINANCIAL STATEMENTS
G) Investments2014
£million2013
£million
Bonds 0.3 0.3
The Company invested £250,000 in Allia bonds during the year ended 31 December 2013.
H) Investments in subsidiary undertakingsShares at cost
£million
Cost
At 1 January 2014 483.8
Disposals (6.4)
At 31 December 2014 477.4
Provisions
At 1 January 2014 19.9
Disposals (6.4)
At 31 December 2014 13.5
Net book value
At 31 December 2014 463.9
At 31 December 2013 463.9
Details of principal group undertakings are given on pages 161 to 165, which form part of these financial statements.
The Company liquidated Interserve Deutschland GmbH on 4 August 2014.
I) Debtors2014
£million2013
£million
Amounts falling due within one year:
Trade debtors 0.1 0.1
Amounts owed by subsidiary undertakings 143.1 120.6
Corporation tax 8.1 4.2
Prepayments and accrued income 3.0 2.2
154.3 127.1
Amounts falling due after more than one year:
Deferred taxation (note M) 3.4 5.8
3.4 5.8
J) Other creditors2014
£million2013
£million
Amounts owed to subsidiary undertakings 1.1 65.2
Other creditors 51.2 22.0
Accruals and deferred income 8.1 8.2
60.4 95.4

159INTERSERVE ANNUAL REPORT 2014 FINANCIAL STATEMENTS NOTES TO ThE COMPANy FINANCIAL STATEMENTS
OVERVIEW
GO
VERNA
NCE
FINA
NCIA
L STATEMEN
TS STRATEG
IC REPORT
K) Provisions2014
£million2013
£million
At 1 January (0.1) (0.2)
Additions (0.4) -
Provision utilisation 0.1 0.1
At 31 December (0.4) (0.1)
Included in current liabilities (0.2) (0.1)
Included in non-current liabilities (0.2) -
L) Other creditors – amounts falling due after more than one year2014
£million2013
£million
Other creditors 6.5 6.5
M) Deferred taxation asset2014
£million2013
£million
Movement in year
At 1 January 5.8 4.3
Provided in the year - 1.5
Utilised in the year (2.4) -
At 31 December 3.4 5.8
The source of the balance on deferred tax account is as follows:
Accelerated capital allowances - -
Other timing differences 3.4 5.8
At 31 December 3.4 5.8
N) Share capital2014
£million2013
£million
Allotted and fully paid
143,917,617 ordinary shares of 10p each (2013: 129,053,768 ordinary shares of 10p each) 14.4 12.9
Awards were granted during the year as indicated in note 27 to the Annual Report and Financial Statements of the Group.

Notes to the Company financial statements continued
160 INTERSERVE ANNUAL REPORT 2014 FINANCIAL STATEMENTS NOTES TO ThE COMPANy FINANCIAL STATEMENTS
O) Reserves
Sharepremium£million
Capitalredemption
reserve£million
Acquisitionreserve£million
Profit andloss reserve
£millionTotal
£million
At 1 January 2014 115.0 0.1 108.5 152.1 375.7
Profit for the financial year (note B) - - - 33.3 33.3
Shares issued 0.3 - 72.4 - 72.7
Dividends paid (note D) - - - (31.5) (31.5)
Fair value adjustment - - - 0.2 0.2
Investment in own shares - - - (1.3) (1.3)
Deferred tax on items taken directly to equity - - - (2.0) (2.0)
Company shares used to settle share-based payments 0.7 0.7
Share-based payments - - - 4.4 4.4
At 31 December 2014 115.3 0.1 180.9 155.9 452.2
A gain of £0.2 million (2013: £0.6 million) was recorded in the profit and loss reserve in respect of changes in the fair value of interest rate hedges.
P) Reconciliation of movement in shareholders’ funds
£million
Profit for the financial year attributable to the members of Interserve Plc 33.3
Dividends (31.5)
1.8
Shares issued 74.2
Share-based payments 4.4
Company shares used to settle share-based payments 0.7
Deferred tax on items taken directly to equity (2.0)
Investment in own shares (1.3)
Fair value adjustments on hedging 0.2
Net increase to shareholders’ funds 78.0
Shareholders’ funds at 31 December 2013 388.6
Shareholders’ funds at 31 December 2014 466.6
Q) Contingent liabilities
At 31 December 2014, there were guarantees given in the ordinary course of business of the Company. The Company has given guarantees covering bank overdrafts in its subsidiary and associated undertakings. At 31 December 2014, these amounted to £2.2 million (2013: £2.6 million). The Company has provided a guarantee to the Interserve Pension Scheme for future contributions due from subsidiary undertakings amounting to £250.0 million (2013: £250.0 million) in respect of the past funding deficit. In addition, contributions will also be payable in respect of future service benefits.
The Company has given guarantees in respect of borrowing and guarantee facilities made available to joint-venture and associated undertakings for sums not exceeding £13.7 million (2013: £11.3 million) in respect of borrowings and £171.4 million (2013: £145.2 million) in respect of guarantees. At 31 December 2014, £0.6 million (2013: £0.3 million) had been utilised in borrowings and £98.1 million (2013: £89.4 million) in guarantees.

161INTERSERVE ANNUAL REPORT 2014 FINANCIAL STATEMENTS PRINCIPAL GROUP UNDERTAKINGS
Principal subsidiaries, associated undertakings, jointly‑controlled entities and jointly‑controlled operations
OVERVIEW
GO
VERNA
NCE
FINA
NCIA
L STATEMEN
TS STRATEG
IC REPORT
The principal subsidiaries, associated undertakings, jointly-controlled entities and jointly-controlled operations of the Group listed below are those that, in the opinion of the directors, principally affect the figures shown in the financial statements as at 31 December 2014. A full list of Group companies will be annexed to the next annual return of Interserve Plc. Except where shown:
(a) the principal operations of each company are conducted in its country of incorporation or registration;
(b) the shareholdings of all subsidiaries relate to ordinary share capital and are equivalent to the percentage of voting rights held by the Group;
(c) the equity capital of all subsidiaries, associated undertakings, jointly-controlled entities and jointly-controlled operations are held by subsidiary undertakings of Interserve Plc;
(d) the accounting reference date is 31 December; and
(e) the consolidated financial statements include the results for the twelve months to 31 December even if the accounting reference date is different.
Principal activities
Country of incorporation or registration
Group holding
(A) Principal subsidiaries
Support Services
Adyard Abu Dhabi LLC Engineering, fabrication works, marine repairs and other related works for the oil and gas industry, both offshore and onshore
United Arab Emirates 100%
ESG Holdings Ltd Provision of education, apprenticeship and skills services
England 100%
First Security (Guards) Ltd1 Provision of a range of security manpower and associated support services
England & Wales 100%
Interserve Catering Services Ltd Provision of catering services England & Wales 100%
Interserve Centro Especial de Empleo, SL Supply of labour for Spanish contracts Spain 100%
Interserve (Defence) Ltd Property and facilities management services to the Ministry of Defence and other clients in the defence sector
England & Wales 100%
Interserve Environmental Services Ltd Provision of asbestos services relating to surveying, record management and removal of asbestos materials
England & Wales 100%
Interserve (Facilities Management) Ltd Facilities management services to a range of clients in the public and private sectors
England & Wales 100%
Interserve (Facilities Services-Slough) Ltd2 3 Provision of comprehensive management and maintenance services to Slough Borough Council
England & Wales 100%
Interservefm Ltd4 Holding company England & Wales 100%
Interserve FS (UK) Ltd Provision of contract cleaning and related services England & Wales 100%
Interserve Healthcare Ltd Provision of healthcare services at home through the delivery of care packages, as well as the supply of nurses and care staff to establishments such as NHS hospital trusts and care homes
England & Wales 100%
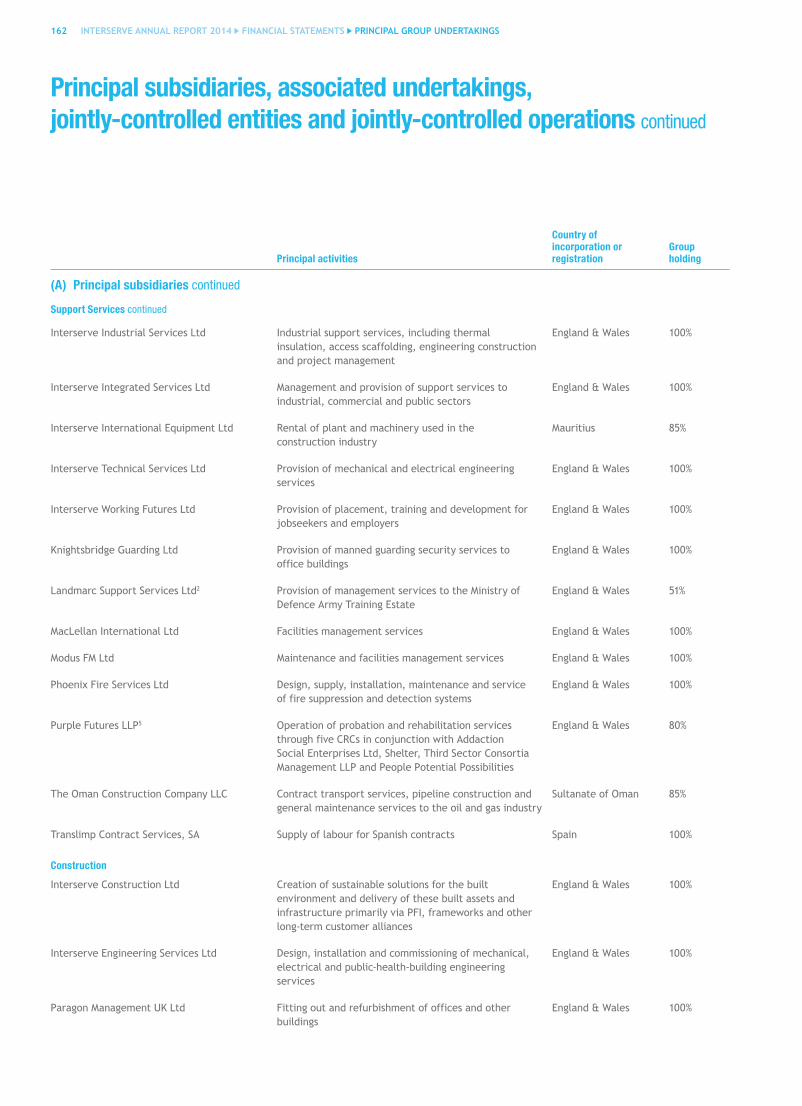
162 INTERSERVE ANNUAL REPORT 2014 FINANCIAL STATEMENTS PRINCIPAL GROUP UNDERTAKINGS
Principal subsidiaries, associated undertakings, jointly‑controlled entities and jointly‑controlled operations continued
Principal activities
Country of incorporation or registration
Group holding
(A) Principal subsidiaries continued
Support Services continued
Interserve Industrial Services Ltd Industrial support services, including thermal insulation, access scaffolding, engineering construction and project management
England & Wales 100%
Interserve Integrated Services Ltd Management and provision of support services to industrial, commercial and public sectors
England & Wales 100%
Interserve International Equipment Ltd Rental of plant and machinery used in the construction industry
Mauritius 85%
Interserve Technical Services Ltd Provision of mechanical and electrical engineering services
England & Wales 100%
Interserve Working Futures Ltd Provision of placement, training and development for jobseekers and employers
England & Wales 100%
Knightsbridge Guarding Ltd Provision of manned guarding security services to office buildings
England & Wales 100%
Landmarc Support Services Ltd2 Provision of management services to the Ministry of Defence Army Training Estate
England & Wales 51%
MacLellan International Ltd Facilities management services England & Wales 100%
Modus FM Ltd Maintenance and facilities management services England & Wales 100%
Phoenix Fire Services Ltd Design, supply, installation, maintenance and service of fire suppression and detection systems
England & Wales 100%
Purple Futures LLP5 Operation of probation and rehabilitation services through five CRCs in conjunction with Addaction Social Enterprises Ltd, Shelter, Third Sector Consortia Management LLP and People Potential Possibilities
England & Wales 80%
The Oman Construction Company LLC Contract transport services, pipeline construction and general maintenance services to the oil and gas industry
Sultanate of Oman 85%
Translimp Contract Services, SA Supply of labour for Spanish contracts Spain 100%
Construction
Interserve Construction Ltd Creation of sustainable solutions for the built environment and delivery of these built assets and infrastructure primarily via PFI, frameworks and other long-term customer alliances
England & Wales 100%
Interserve Engineering Services Ltd Design, installation and commissioning of mechanical, electrical and public-health-building engineering services
England & Wales 100%
Paragon Management UK Ltd Fitting out and refurbishment of offices and other buildings
England & Wales 100%

163INTERSERVE ANNUAL REPORT 2014 FINANCIAL STATEMENTS PRINCIPAL GROUP UNDERTAKINGS
OVERVIEW
GO
VERNA
NCE
FINA
NCIA
L STATEMEN
TS STRATEG
IC REPORT
162 INTERSERVE ANNUAL REPORT 2014 FINANCIAL STATEMENTS PRINCIPAL GROUP UNDERTAKINGS
Principal activities
Country of incorporation or registration
Group holding
Equipment Services
Rapid Metal Developments (Australia) Pty Ltd Equipment hire and sales Australia 100%
Rapid Metal Developments (NZ) Ltd Equipment hire and sales New Zealand 100%
RMD Kwikform (Al Maha) Qatar WLL6 Equipment hire and sales Qatar 49%
RMD Kwikform Chile SA Equipment hire and sales Chile 100%
RMD Kwikform Hong Kong Ltd7 Equipment hire and sales Hong Kong SAR 100%
RMD Kwikform Ltd Equipment hire and sales England & Wales 100%
RMD Kwikform Middle East LLC8 Equipment hire and sales Emirate of Sharjah 49%
RMD Kwikform North America Inc Equipment hire and sales USA 100%
RMD Kwikform Oman LLC Equipment hire and sales Sultanate of Oman 70%
RMD Kwikform Philippines, Inc7 Equipment hire and sales Philippines 100%
RMD Kwikform Saudi Arabia LLC Equipment hire and sales Kingdom of Saudi Arabia
100%
RMD Kwikform (South Africa) (Proprietary) Ltd
Equipment hire and sales Republic of South Africa
100%
Group Services
Interserve Finance Ltd Group funding entity England & Wales 100%
Interserve Finance (Switzerland) Sàrl Intra-group financing company Switzerland 100%
Interserve Group Holdings Ltd7 Holding company England & Wales 100%
Interserve Holdings Ltd Holding company England & Wales 100%
Interserve Insurance Company Ltd Insurance Guernsey 100%
Interserve Investments Ltd Holding company England & Wales 100%

164 INTERSERVE ANNUAL REPORT 2014 FINANCIAL STATEMENTS PRINCIPAL GROUP UNDERTAKINGS
Principal subsidiaries, associated undertakings, jointly‑controlled entities and jointly‑controlled operations continued
Principal activities
Country of incorporation or registration
Issued share capital
Group holding
(B) Associated undertakings
Support Services
Khansaheb Group LLC Facilities management and maintenance services
United Arab Emirates
3,000 shares of 1,000 UAE Dirhams
49%
Madina Group WLL Fabrication, engineering and maintenance solutions for the oil, gas and petrochemical industries, both on and off shore
Qatar 1,000 shares of 1,000 Qatari Riyals
49%
Construction
Douglas OHI LLC Civil engineering and building Sultanate of Oman 100,000 shares of 10 Omani Rials
49%
Gulf Contracting Co WLL Civil engineering, building and maintenance services
Qatar 1,000 shares of 1,000 Qatari Riyals
49%
How United Services WLL Installation, testing and commissioning of building services; maintenance and facilities services
Qatar 9,000 shares of 1,000 Qatari Riyals
49%
Khansaheb Civil Engineering LLC Civil engineering, building and maintenance services
United Arab Emirates
11,000 shares of 1,000 UAE Dirhams
45%
Khansaheb Hussain LLC Civil engineering, building and maintenance services
United Arab Emirates
1,000 shares of 1,000 UAE Dirhams
49%
Principal activitiesAddress of principal place(s) of business
Group holding
(C) Jointly-controlled entities
Jointly-controlled entities are where strategic and operating decisions of an incorporated joint venture require unanimous consent of the parties sharing control.
Support Services
PriDE (SERP) Ltd2 Estate management services under the Ministry of Defence South East Regional Prime Contract
Aldershot, Hampshire, England 50%
Rehab Jobfit LLP Employment-related support services to the Department for Work and Pensions
Twyford, Reading, England 49%
Sussex Estates and Facilities LLP9 Provision of facilities management services to the University of Sussex
Falmer, East Sussex, England 35%

165INTERSERVE ANNUAL REPORT 2014 FINANCIAL STATEMENTS PRINCIPAL GROUP UNDERTAKINGS
OVERVIEW
GO
VERNA
NCE
FINA
NCIA
L STATEMEN
TS STRATEG
IC REPORT
164 INTERSERVE ANNUAL REPORT 2014 FINANCIAL STATEMENTS PRINCIPAL GROUP UNDERTAKINGS
Principal activitiesAddress of principal place(s) of business
Group holding
Investments
Addiewell Prison Ltd2 Design, build, finance and operation of Addiewell Prison
HMP Addiewell, West Lothian, Scotland 33%
Alder Hey (Special Purpose Vehicle) Ltd2
Design, build, finance and operation of a Children’s Health Park at Alder Hey Hospital, Liverpool
Alder Hey Hospital, Liverpool, England 20%
Edinburgh Haymarket Developments Ltd
Finance, construction and development of retail, hotel, car parking and office accommodation
The Haymarket, Edinburgh, Scotland 50%
Resource Recovery Solutions (Derbyshire) Ltd2
Construction and operation of a new waste treatment facility in Derby
Derby, England 50%
Seacole National Centre Ltd Construction and maintenance of a new National Centre of Excellence for the Scottish National Blood Transfusion Service
Heriot-Watt Research Park, Edinburgh, Scotland 50%
West Yorkshire PFI Operational Training & Accommodation Ltd2
Design, build, finance and operation of two new divisional headquarters, custody suites and a specialist operational training facility for the West Yorkshire Police Authority
Elland Road, Leeds, England;Havertop Lane, Normanton, Wakefield, England;Carr Gate, Wakefield, England
50%
(D) Jointly-controlled operations
Construction
KMI Plus Water Joint Venture Water project framework for United Utilities
Wigan, Lancashire, England 31%
KMI Water Joint Venture Water project framework for United Utilities
Wigan, Lancashire, England 33%
Notes:1 Issued share capital consists of 200 ‘A’ deferred shares of 50 pence each, 99,800 ‘B’ deferred shares of 50 pence each and 200 ordinary shares of 1 pence each.
2 Accounting reference date is 31 March.
3 Issued share capital consists of 100 ordinary shares of £1 each and 100 deferred shares of £1 each.
4 Issued share capital consists of 15,000,000 redeemable ordinary shares of £1 each, 6,158 ordinary shares of 1 US cent each and 2 deferred shares of £1 each.
5 Accounting reference date is 31 October.
6 The Group has the right to appoint and remove the General Manager giving it control over the strategic and operating decisions of the company. It is therefore consolidated as a subsidiary undertaking. Issued share capital consists of 200 shares of 1,000 Qatari Riyals each.
7 Shareholding held directly by Interserve Plc.
8 The Group has the right to appoint the Manager and thus exercises control over the strategic and operating decisions of the company. It is therefore consolidated as a subsidiary undertaking. Issued share capital consists of 500 shares of 1,000 UAE Dirhams each.
9 Accounting reference date is 31 July.

166 INTERSERVE ANNUAL REPORT 2014 FINANCIAL STATEMENTS FIVE-YEAR ANALYSIS
Five-year analysis (unaudited)
2014 £million
2013 £million
2012 £million
2011 £million
2010 £million
Revenue including share of associates and joint venturesSupport Services - UK 1,786.0 1,292.5 1,215.4 1,069.6 1,098.7 Support Services - International 157.2 100.5 31.3 25.9 23.7
Support Services 1,943.2 1,393.0 1,246.7 1,095.5 1,122.4
Construction - UK 970.7 802.2 737.2 731.1 754.3 Construction - International 207.9 215.9 201.6 223.7 239.2
Construction 1,178.6 1,018.1 938.8 954.8 993.5
Equipment Services 195.5 169.6 167.5 154.3 139.9 Investments 38.6 34.5 81.0 160.2 106.6 Group Services 8.1 7.1 - - - Inter-segment elimination (58.7) (40.4) (64.4) (45.2) (47.0)
3,305.3 2,581.9 2,369.6 2,319.6 2,315.4
Consolidated revenueSupport Services - UK 1,679.9 1,196.6 1,118.1 1,007.3 1,024.8 Support Services - International 117.5 57.5 - - -
Support Services 1,797.4 1,254.1 1,118.1 1,007.3 1,024.8
Construction - UK 970.7 802.2 737.2 731.1 754.3 Construction - International - - - - -
Construction 970.7 802.2 737.2 731.1 754.3
Equipment Services 195.5 169.6 167.5 154.3 139.9 Group Services 8.1 7.1 - - - Inter-segment elimination (58.7) (40.4) (64.4) (45.2) (47.0)
2,913.0 2,192.6 1,958.4 1,847.5 1,872.0
Headline profitSupport Services - UK 81.4 56.0 44.3 36.4 25.1 Support Services - International 7.4 4.1 3.7 3.6 3.4
Support Services 88.8 60.1 48.0 40.0 28.5
Construction - UK 15.4 14.7 14.6 18.0 24.5 Construction - International 10.8 13.1 14.3 16.6 22.8
Construction 26.2 27.8 28.9 34.6 47.3
Equipment Services 26.6 20.1 16.0 13.6 14.4 Investments 0.8 0.8 6.6 6.0 4.2 Group Services (25.2) (22.1) (21.1) (22.9) (22.2)
Total operating profit 117.2 86.7 78.4 71.3 72.2
Investment revenue 5.0 3.6 8.4 5.7 3.8
Finance costs (16.0) (9.2) (11.5) (9.7) (10.8)
106.2 81.1 75.3 67.3 65.2
Earnings per share, penceBasic EPS 32.2 39.1 130.0 42.7 37.0 Headline EPS 58.8 47.7 45.3 46.1 40.3
Dividend per share, penceInterim 7.5 6.8 6.4 6.0 5.6 Final 15.5 14.7 14.1 13.0 12.4
FIVE-YEAR ANALYSIS
MAC_RF66456_D_P05 tp.indd 166 20/03/2015 11:38

167167INTERSERVE ANNUAL REPORT 2014 FINANCIAL STATEMENTS FIVE-YEAR ANALYSIS
OVERVIEW
GO
VERNA
NCE
FINA
NCIA
L STATEMEN
TS STRATEG
IC REPORT
166 INTERSERVE ANNUAL REPORT 2014 FINANCIAL STATEMENTS FIVE-YEAR ANALYSIS
2014 £million
2013 £million
2012 £million
2011 £million
2010 £million
Balance sheetIntangible assets 524.5 286.6 265.8 221.2 228.3 Property, plant and equipment 195.3 155.9 137.8 139.7 149.0 Interests in joint ventures 42.7 20.6 7.6 103.3 60.1 Interests in associated undertakings 77.2 73.9 76.6 77.2 61.7 Deferred tax asset - 21.0 33.5 23.4 16.5
Non-current assets 839.7 558.0 521.3 564.8 515.6
Assets held for sale - - 51.2 - - Inventories 48.6 30.7 24.6 22.2 19.6 Trade and other receivables 679.4 486.1 432.0 380.1 386.1 Cash and deposits 82.1 79.7 76.8 46.1 67.6
Bank overdrafts and loans (5.5) (27.4) (19.8) (19.3) (35.2)Trade and other payables (749.7) (597.6) (559.7) (498.6) (496.7)Short-term provisions (29.2) (18.1) (24.2) (28.7) (20.2)
Net current assets/(liabilities) 25.7 (46.6) (19.1) (98.2) (78.8)
Bank loans (344.7) (90.0) (30.0) (70.0) (85.0)Trade and other payables (14.8) (13.5) (13.2) (13.3) (15.8)Long-term provisions (19.5) (29.9) (27.1) (26.3) (26.9)Deferred tax liability (2.0) - - - -Retirement benefit obligation (4.8) (7.7) (101.1) (56.2) (51.5)
Non-current liablilites (385.8) (141.1) (171.4) (165.8) (179.2)
Net assets 479.6 370.3 330.8 300.8 257.6
Cash flowOperating cash flows before movements in working capital 94.5 74.7 39.5 35.6 31.6 Movement in working capital (53.3) (19.7) 0.2 9.5 (21.5)Changes in hire fleet (30.3) (11.8) (6.0) 3.0 15.1 Taxes paid (10.2) (5.7) (10.7) (3.2) (6.3)
Net cash from operating activities 0.7 37.5 23.0 44.9 18.9
Acquisitions and investments (253.8) (59.9) 63.0 (19.3) (32.6)Net capital expenditure - non-hire fleet (24.0) (21.9) (8.9) (8.5) (5.6)Dividends from joint ventures and associates 17.8 13.7 19.8 20.6 32.1 Interest received 4.7 3.5 8.4 4.4 3.8
Net cash used in investing activities (255.3) (64.6) 82.3 (2.8) (2.3)
Interest paid (16.0) (7.8) (9.6) (6.7) (6.4)Dividends paid (34.4) (29.1) (27.0) (25.5) (24.8)Other (including share issues) 73.9 0.6 1.5 - (2.2)
Net cash used in financing activities excluding debt 23.5 (36.3) (35.1) (32.2) (33.4)
Effect of foreign exchange 0.8 (1.0) (0.2) (0.3) 0.3
Movement in net debt (230.3) (64.4) 70.0 9.6 (16.5)
Closing net cash/(debt) (268.9) (38.6) 25.8 (44.2) (53.8)
FIVE-YEAR ANALYSIS
MAC_RF66456_D_P05 tp.indd 167 20/03/2015 11:38

168 INTERSERVE ANNUAL REPORT 2014 FINANCIAL STATEMENTS SHAREHOLDER INFORMATION
Shareholder information
Financial calendar 2015Final results announcement for the year ended 31 December 2014 26 February 2015Publication of Annual Report and Financial Statements 30 March 2015Annual General Meeting 12 May 2015Final dividend payable (record date 7 April 2015) 20 May 2015Half-year results announcement for the six months ended 30 June 2015 12 August 2015Publication of Half-Year Report Late August 2015Interim dividend payable October 2015
The Company will keep under review the appropriateness of issuing other trading updates to the market during the course of the year.
Share price
As at 31 December 2014 557.5pLowest for the year ended 31 December 2014 531.5pHighest for year ended 31 December 2014 745.0p
The current price of the Company’s shares is available on the Company’s website at www.interserve.com.
Analysis of registered shareholdingsHolders Shares
Number % Number %
Notifiable interests 3 0.07 36,479,931 25.35Banks, institutions and nominees 1,197 26.54 98,527,021 68.46Private shareholders 3,309 73.39 8,910,665 6.19Total as at 26 February 2015 4,509 100.00 143,917,617 100.00
Shareholder services
Capita is our registrar and they offer many services to make managing your shareholding easier and more efficient:
(a) Share Portal
The Share Portal is a secure online site where you can manage your shareholding quickly and easily. You can:
• View your holding and get an indicative valuation• Change your address• Elect to receive shareholder communications by email rather than by post• View your dividend payment history• Make dividend payment choices• Register your proxy voting instruction
Just visit www.capitashareportal.com. All you need is your investor code, which can be found on your share certificate or your dividend tax voucher.
(b) Customer Support Centre
Alternatively, you can contact Capita’s Customer Support Centre which is available to answer any queries you have in relation to your shareholding:
By email: [email protected] phone: +44 (0)20 8639 3399 (lines are open 9.00am to 5.30pm, Monday to Friday)By post: Shareholder Administration, Capita Asset Services, The Registry, 34 Beckenham Road, Beckenham, Kent BR3 4TU

169169INTERSERVE ANNUAL REPORT 2014 FINANCIAL STATEMENTS SHAREHOLDER INFORMATION
OVERVIEW
GO
VERNA
NCE
FINA
NCIA
L STATEMEN
TS STRATEG
IC REPORT
168 INTERSERVE ANNUAL REPORT 2014 FINANCIAL STATEMENTS SHAREHOLDER INFORMATION
(c) Sign up to electronic communications
By signing up to receive your shareholder communications by email, you will help us to save paper and receive your shareholder information quickly and securely. Registering for electronic communications is very straightforward. Just visit www.capitashareportal.com. All you need is your investor code, which can be found on your share certificate or your dividend tax voucher.
(d) Dividend payment options
• Re-invest your dividends Capita’s Dividend Re-investment Plan is a convenient way to build up your shareholding by using your cash dividends to purchase additional shares. The plan is provided by Capita IRG Trustees Limited which is authorised and regulated by the Financial Conduct Authority. For more information and an application pack please call +44 (0)20 8639 3402 (lines are open from 9am to 5.30pm, Monday to Friday). Alternatively you can email [email protected] or log on to www.capitashareportal.com (click on ‘Reinvest your dividends’ and follow the onscreen instructions).
The value of shares and income from them can fall as well as rise and you may not recover the amount of money you invest. Past performance should not be seen as indicative of future performance. This arrangement should be considered as part of a diversified portfolio.
• Elect to have your dividends paid direct into your bank account This means that:
• your dividend reaches your bank account on the payment date;• it is more secure – cheques can sometimes get lost in the post; and• you don’t have the inconvenience of depositing a cheque and waiting for it to clear.
You can sign up for this service by logging on to www.capitashareportal.com (click on ‘Dividends’ and follow the onscreen instructions) or by contacting the Customer Support Centre.
• Choose to receive your next dividend in your local currency Capita has partnered with Deutsche Bank to provide you with a service that will convert your sterling dividends into your local currency at a competitive rate. You can choose to receive payment directly into your bank account, or alternatively, you can be sent a currency draft. For further information contact Capita on +44 (0)20 8639 3405 (lines are open 9.00am to 5.30pm, Monday to Friday) or by email – [email protected].
(e) Buy and sell shares
A quick and easy way to buy and sell shares is provided by Capita Asset Services. There is no need to pre-register and there are no complicated application forms to fill in. You can also access a wealth of stock market news and information free of charge. For further information on this service, or to buy and sell shares, visit www.capitadeal.com or call +44 (0)20 3367 2686 (lines are open 8.00am to 4.30pm, Monday to Friday).
This is not a recommendation to buy and sell shares and this service may not be suitable for all shareholders. The price of shares can go down as well as up and you are not guaranteed to get back the amount you originally invested. Terms, conditions and risks apply. Capita Asset Services is a trading name of Capita IRG Trustees Limited which is authorised and regulated by the Financial Conduct Authority. This service is only available to private shareholders resident in the EEA, the Channel Islands and the Isle of Man.
Share registration and associated services are provided by Capita Registrars Limited (registered in England, No.2605568). Regulated services are provided by Capita IRG Trustees Limited (registered in England, No.2729260). The registered office of each of these companies is The Registry, 34 Beckenham Road, Beckenham, Kent BR3 4TU.
Donate your shares to charity
If you have only a small number of shares which are uneconomical to sell, you may wish to donate them to charity free of charge through ShareGift (Registered Charity 1052686). Find out more at www.sharegift.org.uk or by telephoning +44 (0)20 7930 3737.
170 INTERSERVE ANNUAL REPORT 2014 FINANCIAL STATEMENTS SHAREHOLDER INFORMATION
Shareholder information
Beneficial owners of shares with ‘‘information rights’’
Please note that beneficial owners of shares who have been nominated by the registered holder of those shares to receive information rights under section 146 of the Companies Act 2006 are required to direct all communications to the registered holder of their shares rather than to the Company’s Registrar, Capita Asset Services, or to the Company directly.
Capital gains tax/capitalisation changes
The market value of the Company’s shares as at 31 March 1982 for the purpose of capital gains tax was 16.67p per share. This has been adjusted to take account of all capitalisation changes to 26 February 2015, as indicated below, other than the rights issue in 1986 (one new share for every three existing shares at 140p per share).
22 June 1982 - sub-division of each £1 share into four shares of 25p; bonus issue of two new 25p shares for each £1 share held;
10 June 1983 - bonus issue of one new share of 25p for every four shares held; and
31 October 1997 - share split of five new 10p shares for every two 25p shares held.
Beware of share fraud
in recent years many companies have become aware that their shareholders have received unsolicited telephone calls or correspondence concerning investment matters. These are typically from overseas-based ‘‘brokers’’ who target UK shareholders offering to sell them what often turn out to be worthless or high-risk shares in US or UK investments. These operations are commonly known as “boiler rooms”. The “brokers” can be very persistent and extremely persuasive. Shareholders are advised to be very wary of any unsolicited advice, offers to buy shares at a discount or offers of free reports into the Company.
You can find out more information on how share fraud works and how to avoid it on the Financial Conduct Authority website at www.fca.org.uk/scams. You can also call the FCA Consumer Helpline on 0800 111 6768.
Details of all share dealing facilities that the Company endorses are detailed above.
Please note that any electronic address provided in this document to communicate with the Company may not be used for any purpose other than that expressly stated.

171171
OVERVIEW
GO
VERNA
NCE
FINA
NCIA
L STATEMEN
TS STRATEG
IC REPORT
170 INTERSERVE ANNUAL REPORT 2014 FINANCIAL STATEMENTS SHAREHOLDER INFORMATION INTERSERVE ANNUAL REPORT 2014 FINANCIAL STATEMENTS NOTES
Notes

172 INTERSERVE ANNUAL REPORT 2014 FINANCIAL STATEMENTS NOTES
NotesNotes


![· 2019-02-13 · n m - k = T S n b !S b ST* m 8 9 * n 3 ]j $ N Q 8 m *: f $ " &fv ST* $ = 5 _` ( ; < &](https://img.dokumen.tips/doc/110x75/5e3d5a8a39628654336dd5a8/2019-02-13-n-m-k-t-s-n-b-s-b-st-m-8-9-n-3-j-n-q-8-m-f-fv.jpg)


