Embed Size (px)
Citation preview
Increasing Production with Better Well
Placement in Unconventional Shale Reservoirs
David Hinz
Global Advisor –Imaging and LWD
Interpretation
Halliburton - Formation and Reservoir
Solutions
1

2 © 2012 HALLIBURTON. ALL RIGHTS RESERVED.
Presentation Outline
What happens when you assume the “frac will get it”
Current Best Practice in North America
Geomechnical Properties that affect Production
Using Data through the Life Cycle
– Drilling
– Completion
– Stimulation
– Production
Summary and conclusion

3 © 2012 HALLIBURTON. ALL RIGHTS RESERVED.
Modeland, N., Buller, D. and Chong, K.K. 2011. Statistical Analysis of Completion Methodology on Production in the Haynesville Shale. Paper SPE 144120
presented at the SPE North American Unconventional Gas Conference and Exhibition, The Woodlands, Texas, 14-16 June
8 Month Cum vs # of Stages (Entire Play)
Non Core Area
Core Area
What happens when you assume the “frac will get it”

4 © 2012 HALLIBURTON. ALL RIGHTS RESERVED.
8 Month Cum vs # of Stages (Core Area)
Core Area
Modeland, N., Buller, D. and Chong, K.K. 2011. Statistical Analysis of Completion Methodology on Production in the Haynesville Shale. Paper SPE 144120
presented at the SPE North American Unconventional Gas Conference and Exhibition, The Woodlands, Texas, 14-16 June
What happens when you assume the “frac will get it”

5 © 2012 HALLIBURTON. ALL RIGHTS RESERVED.
8 Month Cum vs # of Stages (Bull Bayou Field)
Core Area
Modeland, N., Buller, D. and Chong, K.K. 2011. Statistical Analysis of Completion Methodology on Production in the Haynesville Shale. Paper SPE 144120
presented at the SPE North American Unconventional Gas Conference and Exhibition, The Woodlands, Texas, 14-16 June
What happens when you assume the “frac will get it”

6 © 2012 HALLIBURTON. ALL RIGHTS RESERVED.
Fig. 10 - Frac Finding Costs for Project Wells
$-
$0.10
$0.20
$0.30
$0.40
$0.50
$0.60
$0.70
$0.80
1 3 5 7 9 11 13 15 17 19 21 23 25 27 29 31
Well List
Fra
c F
ind
ing
Co
sts
, $
/EU
R m
cf Pre-Reservoir Description Usage
Average = $0.21 STD Dev = $0.18
Post-Reservoir Description Usage
Average = $0.10 STD Dev = $0.05
1998
Old Problem
Old Solution
SPE 39918 Schubarth et al. 1998

7 © 2012 HALLIBURTON. ALL RIGHTS RESERVED.
Presentation Outline
What happens when you assume the “frac will get it”
Current Best Practice in North America
Geomechnical Properties that affect Production
Using Data through the Life Cycle
– Drilling
– Completion
– Stimulation
– Production
Summary and conclusion

8 © 2012 HALLIBURTON. ALL RIGHTS RESERVED.
Open Hole Logging
Coring
– Characterize the Reservoir
– Define the Target
Dfit or MiniFrac
Drill an Evaluation Well

9 © 2012 HALLIBURTON. ALL RIGHTS RESERVED.
SPE 152580
Drill a Horizontal / High Angle Well
LWD consists of Gamma Ray
Well is geosteered to stratigraphy
Pattern match gamma response to offset logs

10 © 2012 HALLIBURTON. ALL RIGHTS RESERVED.
Complete the Well
Equally spaced packers or perf intervals
Spacing between intervals has been decreasing
from 400’ (122m) to as low as 100’ (30m).

11 © 2012 HALLIBURTON. ALL RIGHTS RESERVED.
Stimulate the Well
Stimulation Design is a one size fits all approach,
iterated on empirical data.

12 © 2012 HALLIBURTON. ALL RIGHTS RESERVED.
Presentation Outline
What happens when you assume the “frac will get it”
Current Best Practice in North America
Geomechnical Properties that affect Production
Using Data through the Life Cycle
– Drilling
– Completion
– Stimulation
– Production
Summary and conclusion

13 © 2012 HALLIBURTON. ALL RIGHTS RESERVED.
Shale Brittleness Index
Rickman et al. Paper SPE 115258

14 © 2012 HALLIBURTON. ALL RIGHTS RESERVED.
Dynamic Young’s
modulus
Rock Mechanics from Sonic
Poisson’s ratio
Convert to Static:
Brittleness Index: Rickman et al. SPE 115258
Mullen et al. SPE 108139
𝑩𝑹𝑰𝑻 = 𝑬𝒔 + 𝝁
𝟐

15 © 2012 HALLIBURTON. ALL RIGHTS RESERVED.
For Anisotropic Media:
𝐵𝑅𝐼𝑇 = 100(𝐸𝑣 − 𝐸𝑣_𝑚𝑖𝑛)
(𝐸𝑣_𝑚𝑎𝑥 − 𝐸𝑣_𝑚𝑖𝑛)+
100(𝜇𝑣 − 𝜇𝑣_𝑚𝑎𝑥)
(𝜇𝑣_𝑚𝑖𝑛−𝜇𝑣_𝑚𝑎𝑥)/2
𝐹𝑟𝑎𝑐𝑖𝑛𝑑𝑒𝑥 = 𝐵𝑅𝐼𝑇𝑖𝑛𝑑𝑒𝑥 / 𝑇𝐼𝑉𝑟𝑎𝑡𝑖𝑜
𝑇𝐼𝑉𝑟𝑎𝑡𝑖𝑜 = 𝐷𝑇𝑆𝑠𝑙𝑜𝑤
𝐷𝑇𝑆𝑓𝑎𝑠𝑡
Mavko, G. et al. The Rock Physics Handbook 2009
Buller, D. et al. 2010 SPE 132990 Petrophysical Evaluation for Enhancing Hydraulic Stimulation in Horizontal Shale Gas Wells

16 © 2012 HALLIBURTON. ALL RIGHTS RESERVED.
Post Frac Production Log – day 45, well flowing 9MM
Buller, D., Suparman, F., Kwong, S., Spain, D. and Miller, M. 2010. A Novel Approach to Shale-Gas Evaluation Using a Cased-Hole Pulsed Neutron Tool.
Brittleness Index vs Gas Production

17 © 2012 HALLIBURTON. ALL RIGHTS RESERVED.
Higher Clay Interval
Near WellBore Region
3’ (1m)
Lower Clay Interval
Buller, D. et al. 2010 SPE 132990 Petrophysical Evaluation for Enhancing Hydraulic Stimulation in Horizontal Shale Gas Wells
Frac Results

18 © 2012 HALLIBURTON. ALL RIGHTS RESERVED.
Presentation Outline
What happens when you assume the “frac will get it”
Current Best Practice in North America
Geomechnical Properties that affect Production
Using Data through the Life Cycle
– Drilling
– Completion
– Stimulation
– Production
Summary and conclusion

19 © 2012 HALLIBURTON. ALL RIGHTS RESERVED.
LWD Horizontal Dipole Sonic Dual Shear Detection, DTSslow & DTSfast
TIVratio = DTSslow / DTSfast
Low TIV ratio = more brittle,
higher fracture complexity
High TIV ratio = more ductile,
less fracture complexity
Buller, D. et al. 2010 SPE 132990 Petrophysical Evaluation for Enhancing Hydraulic Stimulation in Horizontal Shale Gas Wells

20 © 2012 HALLIBURTON. ALL RIGHTS RESERVED.
Haynesville #1
Buller, D. et al. 2010 SPE 132990 Petrophysical Evaluation for Enhancing Hydraulic Stimulation in Horizontal Shale Gas Wells

21 © 2012 HALLIBURTON. ALL RIGHTS RESERVED.
Haynesville #2
Prop 62.2%
Prop 85.3%
Prop 79%
Prop 29.5%
Prop 2.6%
Prop 89.5%
Prop 100%
Prop 3%
Prop 35%
Prop 55.4%
768 376 0 0 0 0 0 0 0 0 0 162 15 379 64 137 298 1 0 0 0 0 0 0 0 301 0 214 67 1 137 0 0 0 100 768 266 0 7 408
Buller, D. et al. 2010 SPE 132990 Petrophysical Evaluation for Enhancing Hydraulic Stimulation in Horizontal Shale Gas Wells

22 © 2012 HALLIBURTON. ALL RIGHTS RESERVED.
Haynesville #1 – 9 of 10 Water Fracs Placed – PL rate 8.2 MMCF/D
Haynesville #2 – 6 of 10 Fracs Placed > 50% – PL rate 4.5 MMCF/D

23 © 2012 HALLIBURTON. ALL RIGHTS RESERVED.
Horizontal Cased Hole Pulsed Neutron Log
– Haynesville Shale
Brittleness Index, Fracture Ease, Effective Porosity, Free Gas, & TOC
Horizontal In & Out of Primary
Target Interval Free Gas
Stress
Fracture
Ease
Brittleness Index
Lithology Effective
Porosity
CHI Model Triple Combo Data

24 © 2012 HALLIBURTON. ALL RIGHTS RESERVED.
Evenly spaced stages Unevenly spaced stages
Horizontal Cased Hole Pulsed Neutron Log
– Haynesville Shale

25 © 2012 HALLIBURTON. ALL RIGHTS RESERVED.
Shale Completion Strategy: Based on Formation
Brittleness Index
Low High Low
High Low High
Proppant Concentration
Fluid Volume
Proppant Volume
Youngs Modulus
7 E 6
6 E 6
5 E 6
4 E 6
3 E 6
2 E 6
1 E 6
SPE 115258
Haynesville
Marcellus
Barnett
Eagleford
Brittleness Fluid System Fracture Geometry
Fracture Width
Closure Profile
Proppant
Concentration
Fluid
Volume
Proppant
Volume
70% Slick Water Low High Low
60% Slick Water
50% Hybrid
40% Linear
30% X-Linked
20% X-Linked
10% X-Linked High Low High
Brittleness Fluid System Fracture Geometry
Fracture Width
Closure Profile
Proppant
Concentration
Fluid
Volume
Proppant
Volume
70% Slick Water Low High Low
60% Slick Water
50% Hybrid
40% Linear
30% X-Linked
20% X-Linked
10% X-Linked High Low High
Hybrid
26 © 2012 HALLIBURTON. ALL RIGHTS RESERVED.
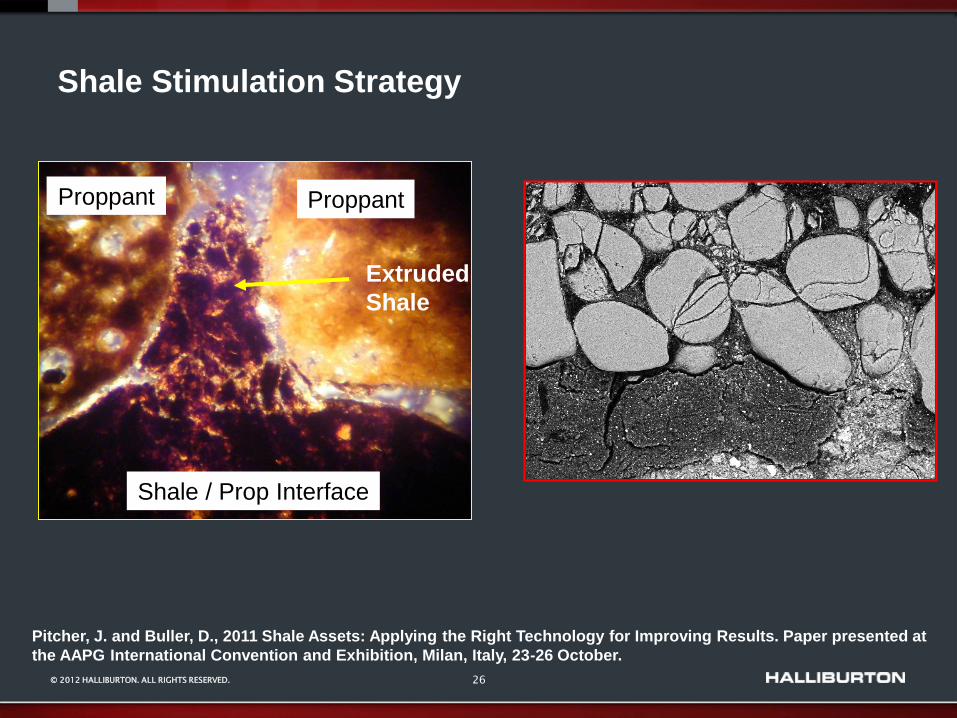
Shale Stimulation Strategy
Shale / Prop Interface
Proppant Proppant
Extruded
Shale
Pitcher, J. and Buller, D., 2011 Shale Assets: Applying the Right Technology for Improving Results. Paper presented at
the AAPG International Convention and Exhibition, Milan, Italy, 23-26 October.

27 © 2012 HALLIBURTON. ALL RIGHTS RESERVED.
Summary and Conclusion
Shale reservoirs are statistical plays
Well placement strategy dictated by geomechanics
Geosteering enhances production by maximizing
fracable reservoir contact
Data acquired while drilling has a long shelf life
– Data used in completion and stimulation optimization

28 © 2012 HALLIBURTON. ALL RIGHTS RESERVED.
Thank You
Спасибо
Gracias
Merci
谢谢你
Grazie
Takk
شكراً جزيالً
Sağol
ありがとう
Obrigado
David Hinz Global Advisor – Imaging and LWD Interpretation Halliburton - Formation and Reservoir Solutions