Embed Size (px)
Citation preview

CYP2J3 attenuates insulin resistance
Increased CYP2J3 Expression Reduces Insulin Resistance in
Fructose-treated Rats and db/db Mice
Xizhen Xu
1, Chun Xia Zhao
1, Luyun Wang
1, Ling Tu
1, Xiaosai Fang
1, Changlong Zheng
1,
Matthew L. Edin2, Darryl C. Zeldin
2, and Dao Wen Wang
1
1Department of Internal Medicine and The Institute of Hypertension, Tongji Hospital, Tongji
Medical College of Huazhong University of Science and Technology, Wuhan 430030, People’s
Republic of China; 2Division of Intramural Research, National Institute of Environmental Health
Sciences, National Institutes of Health, Research Triangle Park, North Carolina 27709.
Running title: CYP2J3 attenuates insulin resistance
Corresponding Author:
Dao Wen Wang, M.D., Ph.D.
Email address: [email protected]
Additional information for this article can be found in an online appendix at
http://diabetes.diabetesjournals.org
Submitted 27 August 2009 and accepted 21 December 2009.
This is an uncopyedited electronic version of an article accepted for publication in Diabetes. The American Diabetes Association, publisher of Diabetes, is not responsible for any errors or omissions in this version of the manuscript or any version derived from it by third parties. The definitive publisher-authenticated version will be available in a future issue of Diabetes in print and online at
http://diabetes.diabetesjournals.org.
Diabetes Publish Ahead of Print, published online January 12, 2010
Copyright American Diabetes Association, Inc., 2010

CYP2J3 attenuates insulin resistance
2
Objective: Accumulating evidence suggests that cytochrome P450 (CYP) epoxygenases
metabolize arachidonic acid into epoxyeicosatrienoic acids (EETs) which play crucial and
diverse roles in cardiovascular homeostasis. The anti-inflammatory, anti-hypertensive and
pro-proliferative effects of EETs suggest a possible beneficial role for EETs on insulin resistance
and diabetes.
Research design and methods: This study investigated the effects of CYP2J3 epoxygenase gene
therapy on insulin resistance and blood pressure in diabetic db/db mice and in a model of
fructose-induced hypertension and insulin resistance in rats.
Results: CYP2J3 gene delivery in vivo increased EET generation, reduced blood pressure and
reversed insulin resistance as determined by plasma glucose levels, insulin resistance index
(HOMA-IR) and Glucose Tolerance Test (GTT). Furthermore, CYP2J3 treatment prevented
fructose-induced decreases in insulin receptor signaling and phosphorylation of AMP-activated
protein kinases (AMPK) in liver, muscle, heart, kidney and aorta. Thus, overexpression of
CYP2J3 protected against diabetes and insulin resistance in peripheral tissues through activation
of insulin receptor and AMPK pathways.
Conclusions: These results highlight the beneficial roles of the CYP epoxygenase-EET system in
diabetes and insulin resistance.

CYP2J3 attenuates insulin resistance
3
rachidonic acid (AA) is
liberated from cell membranes
by phospholipases in response
to various stimuli and is subsequently
metabolized by three different enzyme
pathways, namely the cyclooxygenase, the
lipoxygenase, and the cytochrome P450 (CYP)
epoxygenase pathways. Metabolism of AA
via CYP epoxygenases produces four
different cis-epoxyeicosatrienoic acids (EETs):
5,6-, 8,9-, 11,12-, and 14,15-EET. Human
P450 2J2 (CYP2J2) and its rat homolog
CYP2J3 are predominant enzymes
responsible for the oxidation of endogenous
arachidonic acid pools in cardiac myocytes,
vascular endothelium, pancreas, and other
tissues where they exert regulatory effects in
normal and pathophysiological processes
(1-4).
Accumulating evidence suggests that
EETs play crucial and diverse roles in
cardiovascular homeostasis. AA epoxygenase
metabolites stimulate endothelial cell growth
and angiogenesis via mitogen-activated
protein kinase (MAPK) and
phosphatidylinositol 3-kinase (PI3K)/AKT
signaling pathways, and to some extent, the
endothelial nitric oxide (NO) synthase
(eNOS) pathway (5). Moreover, EETs
upregulate eNOS in bovine aortic endothelial
cells via activation of MAPK, protein kinase
C, PI3K/AKT and MAPK signaling pathways
(6; 7). CYP epoxygenase overexpression,
which increases EET biosynthesis,
significantly protects endothelial cells from
apoptosis induced by tumor necrosis
factor-alpha (TNF-α), an effect that is
mediated, at least in part, through inhibition
of MAPK dephosphorylation and activation
of PI3K/AKT pathways (8). Furthermore,
CYP-derived eicosanoids are vasodilatory, at
least in part through their ability to activate
eNOS and NO release (9).
Considerable experimental evidence
suggests that eNOS-derived NO is a pivotal
regulator of blood pressure, vascular tone, and
vascular homeostasis (10-14). Experimental
evidence also suggests that NO is involved in
the pathogenesis of diabetes and insulin
resistance. NADPH oxidases in the vascular
wall are activated in diabetes mellitus, leading
to enhanced degradation of NO and the
production of reactive oxygen species (15).
Uncoupling of eNOS has been demonstrated
in animal models of diabetes (16), and
endogenous nitric oxide synthase inhibitors
including asymmetric dimethylarginine
(ADMA) are an important cause of vascular
insulin resistance (17). Cumulatively, these
data indicate that diabetes and insulin
resistance are characterized, to some degree,
by endothelial dysfunction, altered eNOS
expression and NO production. Insulin
mediates its effects through binding to insulin
receptors and triggering downstream
signaling pathways, of which the most
important is the PI3K/AKT pathway. This
pathway is involved in a variety of insulin
responses including protection from apoptosis
and transport of glucose through cell
membranes in endothelial cells (8; 18).
We hypothesized that overexpression of
CYP2J3 and the subsequent increase in
production of EETs might be beneficial in
attenuating hypertension and insulin
resistance. Thus, the present study
investigated the effects and underlying
mechanisms of CYP2J3 gene therapy on
insulin resistance and diabetes in
fructose-induced insulin resistance in rats, and
in diabetic db/db mice.
RESEARCH DESIGN AND METHODS
Materials and reagents: Materials were
obtained from the following suppliers:
Antibodies involved in this study were from
Santa Cruz Biotechnology Inc. (Santa Cruz,
CA); the rabbit polyclonal anti-CYP2J3
antibody was developed in our lab as
described (4); Fructose, glucose,
triglyceride and cholesterol reagents from
Ningbo Cicheng Biocompany (Ningbo,
A

CYP2J3 attenuates insulin resistance
4
China); Rat/Mouse Insulin ELISA Kit from
Linco Research, Inc (St. Charles, Missouri);
14,15-DHET ELISA Kit from Detroit R&D
Inc. (Detroit, MI); Guanosine 3',5'-cyclic
monophosphate (cGMP) and adenosine
3',5'-cyclic monophosphate (cAMP) ELISA
kit from Cayman Chemical, Ann Arbor, MI.
All other chemicals and reagents were
purchased from Sigma-Aldrich unless
otherwise specified. Full-length CYP2J3
cDNA was cloned from rat liver RNA and
then subcloned into the pcDNA plasmid
vector in sense [CYP2J3(+)] and antisense
[CYP2J3(-)] orientations.
Animals: All animal experimental protocols
complied with standards stated in the NIH
Guidelines for the Care and Use of
Laboratory Animals and were approved by
The Academy of Sciences of China. Male
Sprague-Dawley rats weighing 200 ± 20
grams and male C57BL/6 and db/db mice (8
weeks old) were obtained from the
Experimental Animal Center of Shanghai
(Shanghai, PRC). Animals were treated as
described previously (19) before experiments.
Fructose feeding and gene delivery
protocols: Following a one-week adaptation
period (i.e. beginning at week 0), rats were
fed normal rat chow and either normal water
(n=32) or water containing 10% fructose
(n=24) for a total of 5 weeks. Systolic blood
pressure was measured weekly until week 6,
and gene delivery protocols were undertaken
at week 3 as described previously (19).
For the mouse study, C57BL/6 and
db/db mice were anesthetised with diethyl
ether and received a sublingual vein injection
of plasmid at a dose of 5 mg/kg body weight.
C57BL/6 mice received either empty pcDNA
(C57BL/6+pcDNA), CYP2J3(+)
(C57BL/6+CYP2J3(+)), or 0.9% NaCl
(C57BL/6 Normal) (n=8 per group), and
db/db mice similarly received either pcDNA
(db/db+pcDNA), CYP2J3(+)
(db/db+CYP2J3(+)), or 0.9% NaCl (db/db
Normal) (n=8 per group).
Blood pressure measurement: Systolic
blood pressure was measured weekly in
conscious rats with a manometer-tachometer
(Rat Tail NIBP System, ADI Instruments,
Australia) using the tail-cuff method as
described previously (19).
Rat serum and urine analyses: Serum and
urine samples from all rats were collected.
Fasting serum levels of insulin, glucose,
sodium, potassium, magnesium, cholesterol,
triglycerides, LDL-C and HDL-C as well as
urine levels of sodium, potassium, and
magnesium were assessed as described
previously (19). Similarly, serum and urine
samples from all mice were collected, and
serum levels of insulin, glucose, cholesterol,
triglycerides, LDL-C and HDL-C were
assessed. Serum levels of alanine
aminotransferase, urea and creatinine in rats
were also measured on an AEROSET Clinical
Chemistry System (Abbott Laboratories) to
evaluate renal and liver function. Additional
details are provided in the online supplement,
which is available at
http://diabetes.diabetesjournals.org.
Glucose tolerance test: Two weeks after
gene delivery, C57BL/6 and db/db mice were
fasted overnight (for 16 h) and then injected
intraperitoneally with D-glucose (20%
solution; 2 g/kg body weight). At 0, 30, 60
and 120 min after glucose administration,
blood samples were taken from the cavernous
sinus with a capillary while under ether
anaesthesia. Plasma glucose and insulin levels
were determined using methods identical to
those used for serum samples in rats
(described in detail in the online
supplementary methods).
Evaluation of urine 14,15-DHET by
ELISA: To assess in vivo EET production, an
ELISA kit (Detroit R&D) was used to
determine concentrations of the stable EET
metabolite 14,15-dihydroxyeicosatrienoic
acid (14,15-DHET) in the urine of rats and
mice. 14,15-DHET was quantified by ELISA
CYP2J3 attenuates insulin resistance
5
according to the manufacturer's instructions as
previously described (7).
RT-PCR analysis of aortic ET-1 and
ETA-R mRNA: Total RNA was extracted
from frozen rat aortas using TRIZOL reagent
and used to assess mRNA levels of ET-1 and
ETA-R. The following oligonucleotide
primers were used for amplification of the
ET-1 and ETA-R cDNAs from
reverse-transcribed aortic RNA.
ET-1 (forward):
5’-AAGCGTTGCTCCTGCTCCTCC-3’
ET-1 (reverse):
5’-TTCCCTTGGTCTGGTCTTTGTG-3’
ETA-R (forward):
5’-TGCTCAACGCCACGACCAAGT-3’
ETA-R (reverse):
5’-GGTGTTCGCTGAGGGCAATCC-3’
Amplification was performed on an ABI7500
PCR system (Applied Biosystems, Darmstadt,
Germany) following incubation with Moloney
murine leukemia virus reverse transcriptase at
42°C for 15 min. A preheating step of 5 min
at 95°C was followed by 40 cycles consisting
of 30 s at 95°C, 20 s at 60°C and 20 s at 72°C.
PCR products were electrophoresed on 1.5%
agarose gels. The quantities of specific ET-1
and ETA-R transcripts were normalized to
levels of glyceraldehyde-3-phosphate
dehydrogenase (GAPDH) transcripts to
control for RNA quality and amount.
Western blot analysis: Two weeks after gene
injection, rats and mice from each group were
anesthetised with pentobarbital (100 mg/kg
i.p.) and skeletal muscles, aortas, hearts,
kidneys and livers were excised, frozen in
liquid nitrogen and stored at -80°C. Western
blotting was performed as described
previously (19). Expression was quantified by
densitometry and normalized to β-actin
expression. All groups were then normalized
to their respective controls and bar graphs
represent quantification of at least three
independent experiments.
Evaluation of urinary cAMP and cGMP by
ELISA: Urinary cAMP and cGMP levels
were measured by ELISA as previously
described (20; 21).
Statistical analysis: Continuous data were
expressed as means ± S.E.M. Comparisons
between groups were performed by a one-way
analysis of variance. Two-way analysis of
variance was used to examine differences in
response to treatments and between groups,
with post hoc analyses performed using the
Student-Newman-Keuls method. Statistical
significance was defined as P < 0.05.
RESULTS
Blood pressure and metabolic changes in
fructose-treated rats: All rats in the study
were assessed for a variety of physiological
parameters 3 weeks after receiving either
control or fructose-containing drinking water.
As expected, consumption of
fructose-containing water resulted in
significantly increased systolic blood
pressure, significantly increased levels of
serum insulin, serum triglyceride, urine
potassium, urine magnesium and urine
volume, and significantly decreased urine
osmolarity (all P<0.05) (Table 1, Figure 1 and
Supplemental Table S1). Insulin resistance
(HOMA-IR) also was significantly increased
in fructose-treated rats (P<0.05) (Table 1).
These data indicate that fructose
administration induced hypertension, insulin
resistance, and hypoosmolar diuresis as
described previously (19).
Effects of CYP2J3 gene delivery on
CYP2J3 protein expression and on
fructose-induced hypertension and
pathophysiological changes in rats: Two
weeks after gene delivery (i.e. at week 5 of
the study), CYP2J3 protein levels were
increased in the aorta, heart, liver and kidney
of fructose-treated CYP2J3(+)
(F+CYP2J3(+)) rats compared to
fructose-treated rats injected with CYP2J3(-)
or with the empty pcDNA vector (Figure 1A).
Importantly, CYP2J3 functionality was
demonstrated by the nearly 4-fold increase in

CYP2J3 attenuates insulin resistance
6
urinary 14,15-DHET levels in rats injected
with CYP2J3(+) compared to those injected
with CYP2J3(-) or with the empty pcDNA
vector (Figure 1B).
Injection of CYP2J3(+) to
fructose-treated rats resulted in decreased
systolic blood pressure 1, 2 and 3 weeks after
injection (i.e. at weeks 4, 5 and 6 of the study)
compared to that observed in fructose-treated
rats injected with the control pcDNA or
CYP2J3(-) vectors (Figure 1C). The
maximum reduction in blood pressure in
F+CYP2J3(+) rats was observed 2 weeks
after injection (i.e. at week 5 of the study)
when blood pressure reached a level similar to
those observed in rats drinking normal water
(Figure 1C). No changes in blood pressure
compared to saline-injected rats were
observed in normal drinking water-treated rats
administered pcDNA, CYP2J3(+) or
CYP2J3(-) (Figure 1C). These data indicate
that CYP2J3 overexpression reduced
hypertension in fructose-treated rats but had
no effect on blood pressure in normal control
rats.
Other physiological and biochemical
parameters related to hypertension and
hyperinsulinemia were assessed in 8 rats per
experimental group 2 weeks after gene
delivery (week 5) (Table 2 and Supplemental
Table S2). Compared to values in the normal
water-treated groups, serum insulin, insulin
resistance (HOMA-IR), serum triglycerides,
urine volume, urine potassium and urine
magnesium levels were all higher, while urine
osmolarity was lower in fructose-treated rats
injected with the empty pcDNA vector
(F+pcDNA group; all P<0.05) (Table 2 and
Supplemental Table S2). With the exception
of serum triglyceride levels, all of these
changes were prevented by injection of
fructose-treated rats with CYP2J3(+), but not
with CYP2J3(-) (Table 2 and Supplemental
Table S2). These data indicate that CYP2J3
overexpression markedly attenuated
fructose-induced insulin resistance in rats but
that it had no effect on these parameters in
normal water-treated rats.
Compared to values in the normal
water-treated groups, serum alanine
aminotransferase, urea nitrogen and creatinine
showed no significant changes in
fructose-treated rats injected with the empty
pcDNA vector (F+pcDNA group; all P>0.05).
Compared to values in rats injected with
empty pcDNA vector, serum alanine
aminotransferase, urea nitrogen and creatinine
were not significantly changed in rats injected
with CYP2J3(+) (Supplemental Table S3).
These data indicate that CYP2J3
overexpression has no detrimental effects on
rat renal and liver function.
Effects of CYP2J3 gene delivery on rat
insulin receptor signaling and eNOS, ET-1
and ETA-R expression: PI3K is recruited to
insulin receptor substrate (IRS) signaling
complexes through binding of Src homology
2 domains in its 85-kDa regulatory subunit to
specific phosphotyrosine residues in IRS-1, a
process that leads to activation of the PI3K
p110 catalytic subunit (22). To investigate the
signaling mechanisms through which CYP2J3
attenuates fructose-induced insulin resistance,
we evaluated the expression of IRS-1
associated with the insulin signaling cascade
in rat liver and skeletal muscle. Compared to
levels in normal controls rats, fructose
drinking resulted in significantly decreased
IRS-1 levels in liver and skeletal muscle
(Figures 2A and 2B). Phospho-Y989-IRS-1
levels were similarly decreased in liver and
skeletal muscle, whereas
phospho-S307-IRS-1 was significantly
increased (Supplemental Figures S1A and
S1B). Administration of CYP2J3(+)
significantly reversed the changes in IRS-1
and phospho-IRS-1 levels induced by fructose
both in liver and skeletal muscle (Figures 2A
and 2B; Supplemental Figures S1A and S1B).
Compared to expression in
corresponding control animals, eNOS protein
expression was down-regulated in aorta, liver
CYP2J3 attenuates insulin resistance
7
and skeletal muscle in fructose-treated rats;
this effect was not observed in
fructose-treated rats injected with CYP2J3(+)
(Figure 2C; Supplemental Figure S1C and
S1D). Similar changes in eNOS expression
and effects of CYP2J3(+) were observed in
rat heart and kidney (data not shown). These
data suggest that CYP2J3(+) treatment
restored eNOS activity and support previous
observations of a beneficial effect of eNOS
against fructose-induced hypertension and
hyperinsulinemia (23).
The expression of ET-1 and ETA-R
mRNA transcripts in rat aortas was
determined by RT-PCR 2 weeks after gene
delivery in order to examine the effects of
fructose feeding and CYP2J3 gene delivery
on the endothelin pathway, which has been
shown to play a role in blood pressure
homeostasis. Fructose administration resulted
in significant increases in aortic ET-1 and
ETA-R mRNA levels (Figures 2D and 2E).
These changes were prevented in rats
administered CYP2J3(+), but not in rats
administered CYP2J3(-).
Effects of CYP2J3 gene delivery on
CYP2J3 protein expression and on
pathophysiological changes and glucose
tolerance in db/db mice: Similar to
observations in fructose-fed rats, levels of
CYP2J3 protein were increased in the aorta,
heart, liver and kidney in diabetic db/db mice
2 weeks after injection with CYP2J3(+)
compared to levels observed after injection
with the empty pcDNA vector (Figure 3A).
Functionality of the CYP2J3 protein in db/db
mice was demonstrated by the nearly 5-fold
increase in urinary 14,15-DHET levels both in
C57BL/6 and db/db mice injected with
CYP2J3(+) compared to those injected with
the empty pcDNA vector (Figure 3B).
The diabetic phenotype of db/db mice
(injected with the empty pcDNA vector) was
confirmed by significantly higher levels of
serum glucose, serum insulin, insulin
resistance (HOMA-IR), serum triglycerides,
serum cholesterol and urine volume in these
animals compared to those in C57BL/6 mice
(all P<0.05; Table 3 and Supplemental Table
S4). Injection of CYP2J3(+) significantly
reduced insulin resistance (HOMA-IR) and
urine volume in db/db mice, whereas injection
of the empty pcDNA vector did not (Table 3
and Supplemental Table S4). Although not all
parameters of the diabetic phenotype in db/db
mice were reversed by CYP2J3(+) treatment,
these data provide further evidence that
CYP2J3 can attenuate insulin resistance in
this animal model.
A glucose tolerance test was performed
in C57BL/6 and db/db mice 2 weeks after
gene delivery. Fasting plasma glucose levels
before glucose loading and plasma glucose
levels after glucose loading were not altered
by the various gene therapy treatments in
C57BL/6 mice (Figure 3C). Compared to
levels in C57BL/6 mice, fasting plasma
glucose levels before glucose loading and
plasma glucose levels after glucose loading
were significantly higher in all db/db mouse
groups. However, the glucose levels before
and after glucose loading in db/db+CYP2J3(+)
mice were significantly less than those in the
db/db control and db/db+pcDNA groups
(P<0.05) (Figure 3C). A similar profile for
fasting plasma insulin levels and for plasma
insulin levels after glucose loading was
observed, with db/db+CYP2J3(+) mice
having levels lower than those of the other
db/db groups but higher than those of all of
the C57BL/6 groups at all time points
assessed (Figure 3D). These data indicate that
CYP2J3 gene delivery attenuated insulin
resistance and has anti-diabetic effects in
db/db mice.
Effects of CYP2J3 gene delivery on
activation of mouse insulin receptor
signaling and eNOS phosphorylation:
Similar to the effects of fructose drinking on
rats, S307 IRS-1 phosphorylation was
significantly increased and Y989-IRS-1
phosphorylation was significantly decreased

CYP2J3 attenuates insulin resistance
8
in livers of db/db control and db/db+pcDNA
mice relative to C57BL/6 mice (Figure 4A).
Similar effects were observed in skeletal
muscle (Supplemental Figure S2A).
Administration of CYP2J3(+) to db/db mice
prevented these changes in both tissues
(Figure 4A; Supplemental Figure S2A).
The effects of CYP2J3(+) treatment on
the phosphorylation status of eNOS were
examined in liver and skeletal muscle. The
level of phospho-T495-eNOS was higher but
phospho-S1177-eNOS was lower in livers of
db/db mice compared to C57BL/6 mice
(Figure 4B). CYP2J3 gene delivery prevented
the downregulation of phospho-S1177-eNOS
but had no impact on phospho-T495-eNOS
(Figure 4B). Similar results were found in
skeletal muscle (Supplemental Figure S3B),
heart and kidney (data not shown). These
results suggest that CYP2J3(+) treatment in
db/db mice altered eNOS phosphorylation
status.
Effects of CYP2J3 gene delivery on
intracellular signaling pathways in rats and
mice: To investigate potential mechanisms
underlying the observed effects of CYP2J3(+)
treatment in rats, the protein expression levels
of a variety of intracellular signaling pathway
molecules were investigated in liver, skeletal
muscle, heart and kidney of rats and mice in
all treatment groups 2 weeks following gene
delivery. The signaling molecules that were
assessed included PI3K, phosphorylated AKT
(P-T308-AKT), phosphorylated AMPK
(P-T172-AMPK), and phosphorylated p42/44
MAPK (P-MAPK). A similar pattern of
expression was observed for all 4 molecules
in all 4 tissues that were examined.
Specifically, tissue protein levels of the
specified signaling molecules were
significantly decreased in fructose-treated rats
and db/db mice compared to levels in normal
water-fed rats and C57BL/6 mice,
respectively. The only fructose-treated rats or
db/db mice in which these decreases were not
observed were those that had been injected
with CYP2J3(+). PI3K (P110) expression
level data for rat and mouse liver are shown in
Figures 5A and 5B, while data for PI3K in rat
and mouse liver and skeletal muscle and for
P-AKT, AMPK and P-MAPK are shown in
Supplemental Figures S4, S5, and S6.
CYP2J3(+) injection reversed changes in
protein expression and phosphorylation seen
in db/db mice or induced by fructose in rats.
The notable exception to this pattern was that
of P-MAPK in rat tissues, in which fructose
feeding did not result in a decreased level of
P-MAPK; however, CYP2J3(+) injection
nonetheless increased expression of P-MAPK
(Supplemental Figures S6A and S6B). Similar
results were found for all of these signaling
molecules in heart and kidney of rats and
mice (data not shown). These data suggest
that reversal of insulin resistance by
CYP2J3(+) treatment was associated with
restoration of these important intracellular
signaling molecules to normal levels.
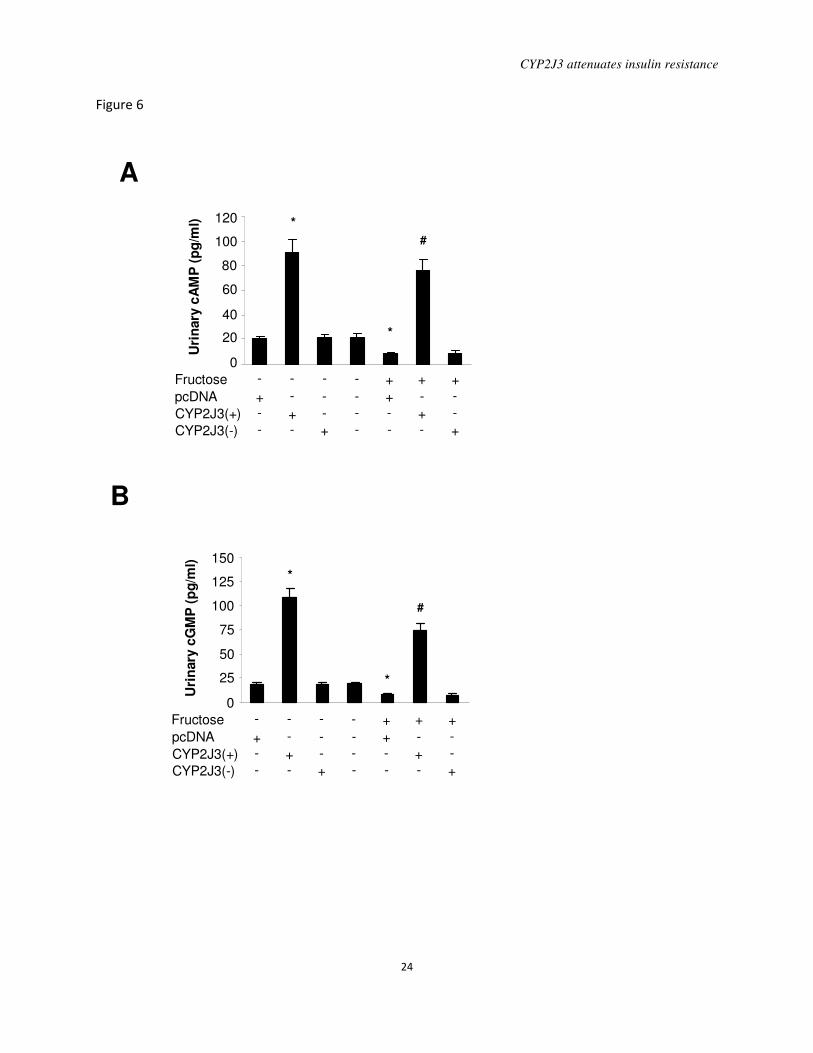
Effects of CYP2J3 gene delivery on urinary
cAMP and cGMP levels: To investigate
potential mechanisms underlying the
observed effects of CYP2J3 on the
upregulation of AMPK phosphorylation,
cAMP and cGMP levels were determined in
urine of rats in all treatment groups two
weeks following gene delivery. Compared to
rats treated with normal water, the
concentration of urinary cAMP and cGMP
decreased significantly in rats with fructose
water treatment. Interestingly, CYP2J3 gene
delivery significantly increased urinary cAMP
and cGMP level in rats treated with both
normal water and fructose water (Figure 6A
and 6B). These data indicate that CYP2J3
overexpression induced a significant increase
in urine cAMP and cGMP secretion, which
may result from G-protein-coupled receptor
(GPCR) activation by EETs.
DISCUSSION
This study was undertaken to examine
the effects of CYP2J3 gene delivery on

CYP2J3 attenuates insulin resistance
9
insulin resistance and diabetes in
fructose-induced insulin resistant rats and
db/db diabetic mice. Results showed that a
single intravenous injection of CYP2J3 in the
eukaryotic expression plasmid pcDNA
reduced blood pressure in fructose-fed rats
and improved sensitivity to insulin in
peripheral tissues and organs in both animal
models. CYP2J3 overexpression significantly
reduced blood pressure with upregulated
eNOS expression and downregulated ET-1
and ETA expression. Furthermore, CYP2J3
overexpression significantly improved insulin
resitance in fructose-induced insulin resistant
rats and db/db diabetic mice, at least in part
through eNOS, IRS-1 and PI3K/AKT
signaling pathways, as well as AMPK
signaling pathways in liver, muscle, heart and
kidney. These data provide direct evidence
that CYP2J3-derived EETs may alleviate
insulin resistance through a variety of
beneficial effects on critical intracellular
signaling pathways.
Previous studies have demonstrated that
rats treated with high-fructose drinking water
develop systemic hypertension,
hyperinsulinemia, and hypertriglyceridemia
(24). While the pathophysiological
mechanisms responsible for elevated blood
pressure and hyperinsulinemia in
fructose-treated animals are not completely
understood, elevated sympathetic nervous
system activity, impaired
endothelium-dependent dilation, reduction of
capillary permeability, elevated vascular
expression of ET-1 and ETA receptor genes,
decreased eNOS activity, and increased salt
absorption by the intestine and kidney have
all been implicated (12; 23; 25).
Polymorphisms in CYP2J2 (the human
homolog of CYP2J3) have been associated
with essential hypertension (26), and reduced
renal CYP-derived eicosanoid synthesis has
been reported in rats with high fat
diet-induced hypertension (27). Furthermore,
EETs have direct vasodilatory activity (28;
29). In the present study, CYP2J3
overexpression significantly elevated urinary
levels of 14,15-DHET in rats and mice, and
attenuated fructose-induced changes in eNOS,
ET-1 and ETA-R expression in rats. These
effects may underlie the beneficial effects of
CYP2J3 overexpression on blood pressure
and hyperinsulinemia that we observed.
Fructose induces inflammatory changes
in human aortic endothelial cells and vessel
walls in rats (30; 31). Cytokines such as
TNF-α induce insulin resistance in
endothelial cells via a p38 mitogen-activated
protein kinase-dependent pathway (32). This
inflammatory signaling is relevant to diabetes,
as TNF receptor 1 blockade protects Wistar
rats from diet-induced obesity and insulin
resistance (33). Physiological concentrations
of EETs or overexpression of CYP2J2
decrease cytokine-induced endothelial cell
adhesion molecule expression, indicating that
EETs have anti-inflammatory properties
independent of their
membrane-hyperpolarizing effects (34).
Furthermore, increased NO release improves
insulin resistance in fructose-treated rats (23;
35). Potassium depletion in rats exacerbates
endothelial dysfunction and lowers the
bioavailability of NO, which blocks insulin
activity and causes insulin resistance (35). We
observed that CYP2J3 expression resulted in
a significant reduction in urine volume and
urine potassium in fructose-treated rats. This
suggests a potential ameliorative effect of
CYP2J3 treatment against
hypertension-related end organ (kidney)
damage and attenuation of insulin resistance.
The precise molecular mechanisms for
attenuation of insulin resistance in CYP2J3
injected, fructose-treated rats remain to be
elucidated. Recent studies indicate that the
ability of insulin to vasodilate skeletal muscle
vasculature is mediated by
endothelium-derived NO (36). These actions
may partially explain our observation of
improved insulin sensitivity following

CYP2J3 attenuates insulin resistance
10
CYP2J3 gene delivery. In addition, we
observed effects on insulin signaling in
tissues directly involved in insulin sensitivity
(37-40), including liver, muscle, heart and
kidney, as well as in an islet cell line. Our
data show that insulin-dependent signaling
was significantly inhibited in fructose-treated
rats and db/db mice, but dramatically reversed
by CYP2J3 overexpression. These results
indicate that CYP2J3 overexpression
potentiates insulin receptor signaling in liver,
muscle, heart and kidney and thus improves
insulin sensitivity.
We also evaluated the phosphorylation
status of AMPK. Small molecule-mediated
activation of AMPK improves insulin
resistance in ob/ob mice (41) and represents a
promising approach for the treatment of
type-2 diabetes and the metabolic syndrome
(42). We found that CYP2J3 overexpression
resulted in a significant increase in AMPK
phosphorylation which may contribute to the
EET-mediated alleviation of diabetes and
insulin resistance we observed. CYP2J3
overexpression induced a significant increase
in urine cAMP and cGMP secretion, which
may result from G-protein-coupled receptor
(GPCR) activation by EETs. Thus,
EET-induced GPCR activation may play an
important role in EET-mediated AMPK
activation and insulin sensitization. Taken
together, these data suggest that the
improvement of insulin resistance after
CYP2J3 gene delivery was due, at least in
part, to increased activation of
IR/IRS-1/PI3K/AKT and AMPK signaling
pathways (43), as well as the upregulation of
eNOS.
In conclusion, we have demonstrated
alleviation of insulin resistance and diabetes
by CYP2J3 gene therapy in db/db diabetic
mice and a model of fructose-induced insulin
resistance in rats. These effects were
associated with increased insulin sensitivity in
peripheral tissues and organs via upregulation
of systemic eNOS and activation of the
IRS-1/PI3K/AKT and AMPK signaling
pathways in muscle, liver, heart, kidney and
aorta. However, the more precise mechanisms
need to be further investigated. The ability of
CYP epoxygenase delivery to exert a broad
spectrum of beneficial effects in these animal
models warrants further investigation of this
approach in the treatment of hypertension
associated with insulin resistance and diabetes
in humans.
ACKNOWLEDGEMENTS
This work was supported in part by funds
from the National Education Ministration
project, Nature Science Foundation
Committee projects (No. 30930039 and
30700377), Wuhan project, 973 program
(2007CB512004, 2006CB50380), and by the
Intramural Research Program of the NIH,
National Institute of Environmental Health
Sciences. Xizhen Xu, Chun Xia Zhao and
Luyun Wang contributed equally to this work.
The authors wish to thank Dr. Jeffrey Card for
assistance with the editing of this manuscript.
We also wish to thank Dr. Stavros
Garantziotis and Michael Fessler for helpful
comments during the preparation of this
manuscript.

CYP2J3 attenuates insulin resistance
11
REFERENCES
1. Wu S, Moomaw CR, Tomer KB, Falck JR, Zeldin DC: Molecular cloning and expression of
CYP2J2, a human cytochrome P450 arachidonic acid epoxygenase highly expressed in heart. J
Biol Chem 271:3460-3468, 1996
2. Zeldin DC, Foley J, Boyle JE, Moomaw CR, Tomer KB, Parker C, Steenbergen C, Wu S:
Predominant expression of an arachidonate epoxygenase in islets of Langerhans cells in human
and rat pancreas. Endocrinology 138:1338-1346, 1997
3. Zeldin DC, Foley J, Goldsworthy SM, Cook ME, Boyle JE, Ma J, Moomaw CR, Tomer KB,
Steenbergen C, Wu S: CYP2J subfamily cytochrome P450s in the gastrointestinal tract:
expression, localization, and potential functional significance. Mol Pharmacol 51:931-943, 1997
4. Wu S, Chen W, Murphy E, Gabel S, Tomer KB, Foley J, Steenbergen C, Falck JR, Moomaw
CR, Zeldin DC: Molecular cloning, expression, and functional significance of a cytochrome
P450 highly expressed in rat heart myocytes. J Biol Chem 272:12551-12559, 1997
5. Wang Y, Wei X, Xiao X, Hui R, Card JW, Carey MA, Wang DW, Zeldin DC: Arachidonic
acid epoxygenase metabolites stimulate endothelial cell growth and angiogenesis via
mitogen-activated protein kinase and phosphatidylinositol 3-kinase/Akt signaling pathways. J
Pharmacol Exp Ther 314:522-532, 2005
6. Wang H, Lin L, Jiang J, Wang Y, Lu ZY, Bradbury JA, Lih FB, Wang DW, Zeldin DC:
Up-regulation of endothelial nitric-oxide synthase by endothelium-derived hyperpolarizing factor
involves mitogen-activated protein kinase and protein kinase C signaling pathways. J Pharmacol
Exp Ther 307:753-764, 2003
7. Jiang JG CC, Card JW, Yang S, Chen JX, Fu XN, Ning YG, Xiao X, Zeldin DC, Wang DW.:
Cytochrome P450 2J2 promotes the neoplastic phenotype of carcinoma cells and is up-regulated
in human tumors. Cancer Res 65:4707-4715, 2005
8. Yang S, Lin L, Chen JX, Lee CR, Seubert JM, Wang Y, Wang H, Chao ZR, Tao DD, Gong JP,
Lu ZY, Wang DW, Zeldin DC: Cytochrome P-450 epoxygenases protect endothelial cells from
apoptosis induced by tumor necrosis factor-alpha via MAPK and PI3K/Akt signaling pathways.
Am J Physiol Heart Circ Physiol 293:H142-151, 2007
9. Hercule HC, Schunck W-H, Gross V, Seringer J, Leung FP, Weldon SM, da Costa Goncalves
AC, Huang Y, Luft FC, Gollasch M: Interaction Between P450 Eicosanoids and Nitric Oxide in
the Control of Arterial Tone in Mice. 2008, p. ATVBAHA.108.171298
10. Desjardins F, Balligand JL: Nitric oxide-dependent endothelial function and cardiovascular
disease. Acta Clin Belg 61:326-334, 2006
11. Huang PL, Huang Z, Mashimo H, Bloch KD, Moskowitz MA, Bevan JA, Fishman MC:
Hypertension in mice lacking the gene for endothelial nitric oxide synthase. Nature 377:239-242,
1995
12. Miatello R, Risler N, Castro C, Gonzalez S, Ruttler M, Cruzado M: Aortic smooth muscle
cell proliferation and endothelial nitric oxide synthase activity in fructose-fed rats. Am J
Hypertens 14:1135-1141, 2001
13. Alexander MY, Brosnan MJ, Hamilton CA, Downie P, Devlin AM, Dowell F, Martin W,
Prentice HM, O'Brien T, Dominiczak AF: Gene transfer of endothelial nitric oxide synthase
improves nitric oxide-dependent endothelial function in a hypertensive rat model. Cardiovasc
Res 43:798-807, 1999
14. Alexander MY BM, Hamilton CA, Fennell JP, Beattie EC, Jardine E, Heistad DD,
Dominiczak AF: Gene transfer of endothelial nitric oxide synthase but not Cu/Zn superoxide
dismutase restores nitric oxide availability in the SHRSP. Cardiovasc Res 47:609-617, 2000
CYP2J3 attenuates insulin resistance
12
15. Guzik TJ, Mussa S, Gastaldi D, Sadowski J, Ratnatunga C, Pillai R, Channon KM:
Mechanisms of increased vascular superoxide production in human diabetes mellitus: role of
NAD(P)H oxidase and endothelial nitric oxide synthase. Circulation 105:1656-1662, 2002
16. Satoh M, Fujimoto S, Haruna Y, Arakawa S, Horike H, Komai N, Sasaki T, Tsujioka K,
Makino H, Kashihara N: NAD(P)H oxidase and uncoupled nitric oxide synthase are major
sources of glomerular superoxide in rats with experimental diabetic nephropathy. Am J Physiol
Renal Physiol 288:F1144-1152, 2005
17. Toutouzas K RM, Stefanadi E, Stefanadis C: Asymmetric dimethylarginine (ADMA) and
other endogenous nitric oxide synthase (NOS) inhibitors as an important cause of vascular
insulin resistance. Horm Metab Res 40:655-659, 2008
18. Sowers JR: Insulin resistance and hypertension. Am J Physiol Heart Circ Physiol
286:H1597-1602, 2004
19. Zhao C, Wang P, Xiao X, Chao J, Chao L, Wang DW, Zeldin DC: Gene therapy with human
tissue kallikrein reduces hypertension and hyperinsulinemia in fructose-induced hypertensive
rats. Hypertension 42:1026-1033, 2003
20. Schneemann A, Dijkstra BG, van den Berg TJ, Kamphuis W, Hoyng PF: Nitric
oxide/guanylate cyclase pathways and flow in anterior segment perfusion. Graefes Arch Clin
Exp Ophthalmol 240:936-941, 2002
21. Tu L, Xu X, Wan H, Zhou C, Deng J, Xu G, Xiao X, Chen Y, Edin ML, Voltz JW, Zeldin
DC, Wang DW: Delivery of recombinant adeno-associated virus-mediated human tissue
kallikrein for therapy of chronic renal failure in rats. Hum Gene Ther 19:318-330, 2008
22. Virkamaki A, Ueki K, Kahn CR: Protein-protein interaction in insulin signaling and the
molecular mechanisms of insulin resistance. J Clin Invest 103:931-943, 1999
23. Zhao CX, Xu X, Cui Y, Wang P, Wei X, Yang S, Edin ML, Zeldin DC, Wang DW:
Increased Endothelial Nitric Oxide Synthase Expression Reduces Hypertension and
Hyperinsulinemia in Fructose-treated Rats. J Pharmacol Exp Ther, 2008
24. Thorburn AW, Storlien LH, Jenkins AB, Khouri S, Kraegen EW: Fructose-induced in vivo
insulin resistance and elevated plasma triglyceride levels in rats. Am J Clin Nutr 49:1155-1163,
1989
25. Singh AK, Amlal H, Haas PJ, Dringenberg U, Fussell S, Barone SL, Engelhardt R, Zuo J,
Seidler U, Soleimani M: Fructose-induced hypertension: essential role of chloride and fructose
absorbing transporters PAT1 and Glut5. Kidney Int 74:438-447, 2008
26. Wu SN, Zhang Y, Gardner CO, Chen Q, Li Y, Wang GL, Gao PJ, Zhu DL: Evidence for
association of polymorphisms in CYP2J2 and susceptibility to essential hypertension. Ann Hum
Genet 71:519-525, 2007
27. Wang MH, Smith A, Zhou Y, Chang HH, Lin S, Zhao X, Imig JD, Dorrance AM:
Downregulation of renal CYP-derived eicosanoid synthesis in rats with diet-induced
hypertension. Hypertension 42:594-599, 2003
28. Campbell WB GD, Pratt PF, Harder DR: Identification of epoxyeicosatrienoic acids as
endothelium-derived hyperpolarizing factors. Circ Res 78:415-423, 1996
29. McGiff JC: Cytochrome P-450 metabolism of arachidonic acid. Annu Rev Pharmacol
Toxicol 31:339-369, 1991
30. Glushakova O, Kosugi T, Roncal C, Mu W, Heinig M, Cirillo P, Sanchez-Lozada LG,
Johnson RJ, Nakagawa T: Fructose induces the inflammatory molecule ICAM-1 in endothelial
cells. J Am Soc Nephrol 19:1712-1720, 2008
CYP2J3 attenuates insulin resistance
13
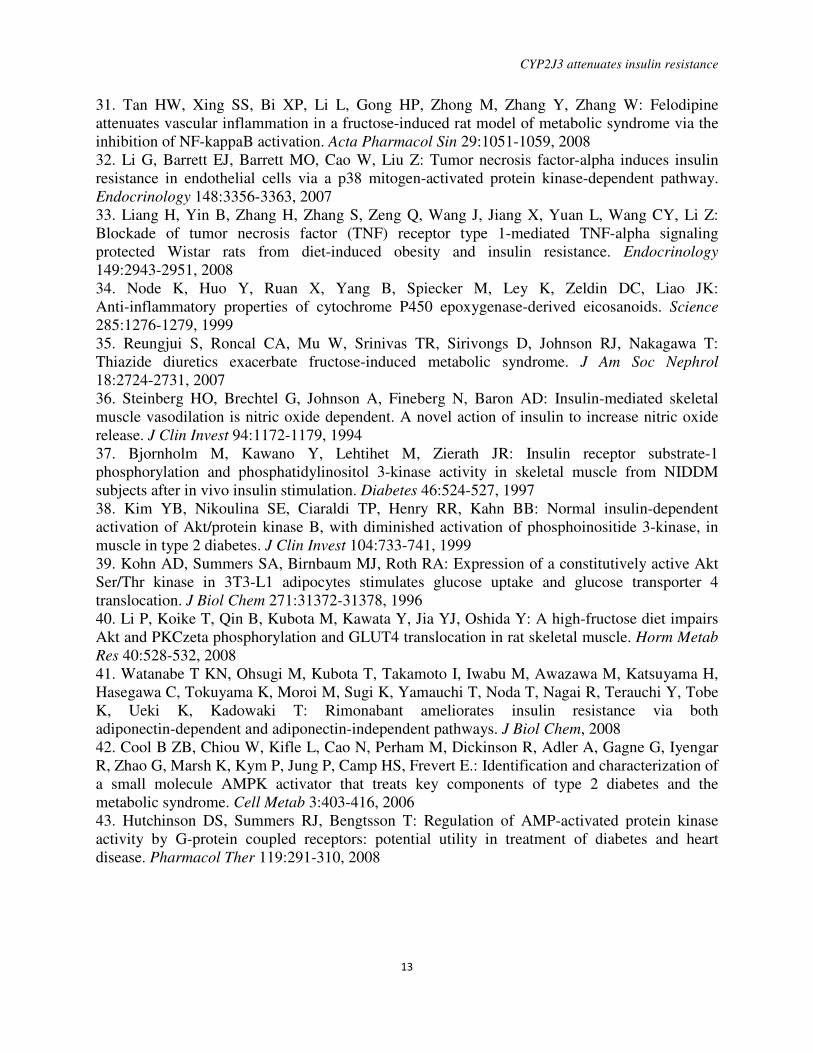
31. Tan HW, Xing SS, Bi XP, Li L, Gong HP, Zhong M, Zhang Y, Zhang W: Felodipine
attenuates vascular inflammation in a fructose-induced rat model of metabolic syndrome via the
inhibition of NF-kappaB activation. Acta Pharmacol Sin 29:1051-1059, 2008
32. Li G, Barrett EJ, Barrett MO, Cao W, Liu Z: Tumor necrosis factor-alpha induces insulin
resistance in endothelial cells via a p38 mitogen-activated protein kinase-dependent pathway.
Endocrinology 148:3356-3363, 2007
33. Liang H, Yin B, Zhang H, Zhang S, Zeng Q, Wang J, Jiang X, Yuan L, Wang CY, Li Z:
Blockade of tumor necrosis factor (TNF) receptor type 1-mediated TNF-alpha signaling
protected Wistar rats from diet-induced obesity and insulin resistance. Endocrinology
149:2943-2951, 2008
34. Node K, Huo Y, Ruan X, Yang B, Spiecker M, Ley K, Zeldin DC, Liao JK:
Anti-inflammatory properties of cytochrome P450 epoxygenase-derived eicosanoids. Science
285:1276-1279, 1999
35. Reungjui S, Roncal CA, Mu W, Srinivas TR, Sirivongs D, Johnson RJ, Nakagawa T:
Thiazide diuretics exacerbate fructose-induced metabolic syndrome. J Am Soc Nephrol
18:2724-2731, 2007
36. Steinberg HO, Brechtel G, Johnson A, Fineberg N, Baron AD: Insulin-mediated skeletal
muscle vasodilation is nitric oxide dependent. A novel action of insulin to increase nitric oxide
release. J Clin Invest 94:1172-1179, 1994
37. Bjornholm M, Kawano Y, Lehtihet M, Zierath JR: Insulin receptor substrate-1
phosphorylation and phosphatidylinositol 3-kinase activity in skeletal muscle from NIDDM
subjects after in vivo insulin stimulation. Diabetes 46:524-527, 1997
38. Kim YB, Nikoulina SE, Ciaraldi TP, Henry RR, Kahn BB: Normal insulin-dependent
activation of Akt/protein kinase B, with diminished activation of phosphoinositide 3-kinase, in
muscle in type 2 diabetes. J Clin Invest 104:733-741, 1999
39. Kohn AD, Summers SA, Birnbaum MJ, Roth RA: Expression of a constitutively active Akt
Ser/Thr kinase in 3T3-L1 adipocytes stimulates glucose uptake and glucose transporter 4
translocation. J Biol Chem 271:31372-31378, 1996
40. Li P, Koike T, Qin B, Kubota M, Kawata Y, Jia YJ, Oshida Y: A high-fructose diet impairs
Akt and PKCzeta phosphorylation and GLUT4 translocation in rat skeletal muscle. Horm Metab
Res 40:528-532, 2008
41. Watanabe T KN, Ohsugi M, Kubota T, Takamoto I, Iwabu M, Awazawa M, Katsuyama H,
Hasegawa C, Tokuyama K, Moroi M, Sugi K, Yamauchi T, Noda T, Nagai R, Terauchi Y, Tobe
K, Ueki K, Kadowaki T: Rimonabant ameliorates insulin resistance via both
adiponectin-dependent and adiponectin-independent pathways. J Biol Chem, 2008
42. Cool B ZB, Chiou W, Kifle L, Cao N, Perham M, Dickinson R, Adler A, Gagne G, Iyengar
R, Zhao G, Marsh K, Kym P, Jung P, Camp HS, Frevert E.: Identification and characterization of
a small molecule AMPK activator that treats key components of type 2 diabetes and the
metabolic syndrome. Cell Metab 3:403-416, 2006
43. Hutchinson DS, Summers RJ, Bengtsson T: Regulation of AMP-activated protein kinase
activity by G-protein coupled receptors: potential utility in treatment of diabetes and heart
disease. Pharmacol Ther 119:291-310, 2008

CYP2J3 attenuates insulin resistance
14
Table 1. Physiological parameters determined in rats after 3 weeks of administration of control
or fructose-containing drinking water.
Variable Control Group (n=32) Fructose-treated Group (n=24)
Glucose (mmol/L) 4.91 ± 0.2 5.62 ± 0.4
Triglyceride (mmol/L) 0.45±0.12 1.18±0.47*
Insulin (mIU/l) 17.74±0.59 49.11±0.42**
HOMA-IR 4.21±0.56 14.24±0.86**
Body weight (g) 254 ± 33 267 ± 26
*P<0.05 vs. control group; **P<0.001 vs. control group.
Table 2. Physiological parameters determined in rats 2 weeks following injection of empty
pcDNA3.1 vector, pcDNA-2J3(+) or pcDNA-2J3(-).
Treatment Group
Normal Water-treated Fructose-treated
Variable N+
pcDNA3.1
N+
p2J3(+)
N+
p2J3(-)
Normal F+
pcDNA3.1
F+
p2J3(+)
N+
p2J3(-)
Glucose
(mmol/L)
5.36±0.68 6.99±0.06 5.69±0.86 5.09±0.36 6.55±0.58 6.44±0.68 6.85±0.99
Triglyceride
(mmol/L)
0.61±0.22 0.63±0.39 0.45±0.18 0.53±0.09 1.04±0.89* 1.30±0.13 1.26±0.4
Insulin (mIU/L) 22.65±0.94 18.16±0.81 18.83±0.44 20.5±0.64 49.71±0.71*
19.48±0.18#
60.25±0.08**
HOMA-IR 5.26±0.82 4.16±0.36 6.64±0.61 5.06±0.26 14.25±0.02* 5.40±0.59
# 24.28±0.04
**
Body weight (g) 310±34 311±49 307±35 299±40 297±49 303 ± 31 341 ± 65
*P<0.05 vs. N+pcDNA3.1 group; #P<0.05 vs. F+pcDNA3.1 group; **P<0.05 vs. F+p2J3(+) group; n=8
per group.
Table 3. Physiological parameters determined in mice 2 weeks following injection of empty
pcDNA3.1 vector or pcDNA-2J3(+).
Variable C57BL/6 C57BL/6+
pcDNA3.1
C57BL/6+
p2J3(+)
db/db db/db+
pcDNA3.1
db/db+
p2J3(+)
Glucose (mmol/L) 10.48±0.57 9.78±0.38 9.70±0.60 21.99±1.83* 23.19±2.51
* 23.15±2.36
Triglyceride
(mmol/L)
1.2±0.15 1.5±0.22 1.43±0.14 2.26±0.28* 2.63±0.0.32
* 2.57±0.37
Insulin (mIU/L) 2.06±0.35 2.13±0.36 1.46±0.31 7.66±1.33*
7.25±0.87*
8.25±1.96
Fasting Glucose
(mmol/L)
5.54±0.33 5.67±0.26 5.18±0.40 17.52±3.20* 18.80±2.35
* 12.65±1.14
#
Fasting Insulin
(ng/mL)
0.23±0.02 0.22±0.03 0.23±0.01 2.49±0.57* 2.618±0.19
* 1.43±0.36
#
HOMA-IR 0.053±0.006 0.055±0.005 0.052±0.002 2.19±0.72* 2.26±0.45
* 0.81±0.24
#
Body weight (g) 25.48±0.61 25.45±0.68 25.27±0.47 45.16±0.91 45.06±0.97 45.78±1.57
*P<0.05 vs. C57BL/6 group; #P<0.05 vs. db/db+pcDNA3.1 group; n=8 per group.

CYP2J3 attenuates insulin resistance
15
TABLE LEGENDS
Table 1. Physiological parameters determined in rats after 3 weeks of administration of
normal or fructose-containing drinking water. Fasting triglyceride, insulin levels and HOMA-IR
were increased in fructose-treated rats after 3 weeks of administration of fructose-containing
drinking water. Values shown are mean ± SEM from each group of rats, respectively.* P<0.05
compared to rats treated with water, **P<0.01 compared to rats treated with water.
Table 2. Physiological parameters determined in rats 2 weeks following injection of
empty pcDNA3.1 vector, pcDNA-2J3(+) or pcDNA-2J3(-). Compared to values in the normal
water-treated groups, serum insulin, insulin resistance (HOMA-IR), and serum triglycerides
levels were all higher in fructose-treated rats injected with the empty pcDNA vector (F+pcDNA
group). With the exception of serum triglyceride levels, all of these changes were prevented by
injection of fructose-treated rats with CYP2J3(+), but not CYP2J3(-).*P<0.05 vs. N+pcDNA3.1
group; #P<0.05 vs. F+pcDNA3.1 group; **P<0.05 vs. F+p2J3(+) group; n=8 per group.
Table 3. Physiological parameters determined in mice 2 weeks following injection of
empty pcDNA3.1 vector or pcDNA-2J3(+). Serum glucose, serum insulin, insulin resistance
(HOMA-IR) and serum triglycerides levels were significantly higher in diabetic phenotype of
db/db mice (injected with the empty pcDNA vector) compared to those in C57BL/6 mice.
Injection of CYP2J3(+) significantly reduced insulin resistance (HOMA-IR) in db/db mice,
whereas injection of the empty pcDNA vector did not. *P<0.05 vs. C57BL/6 group; #P<0.05
vs. db/db+pcDNA3.1 group; n=8 per group.
FIGURE LEGENDS
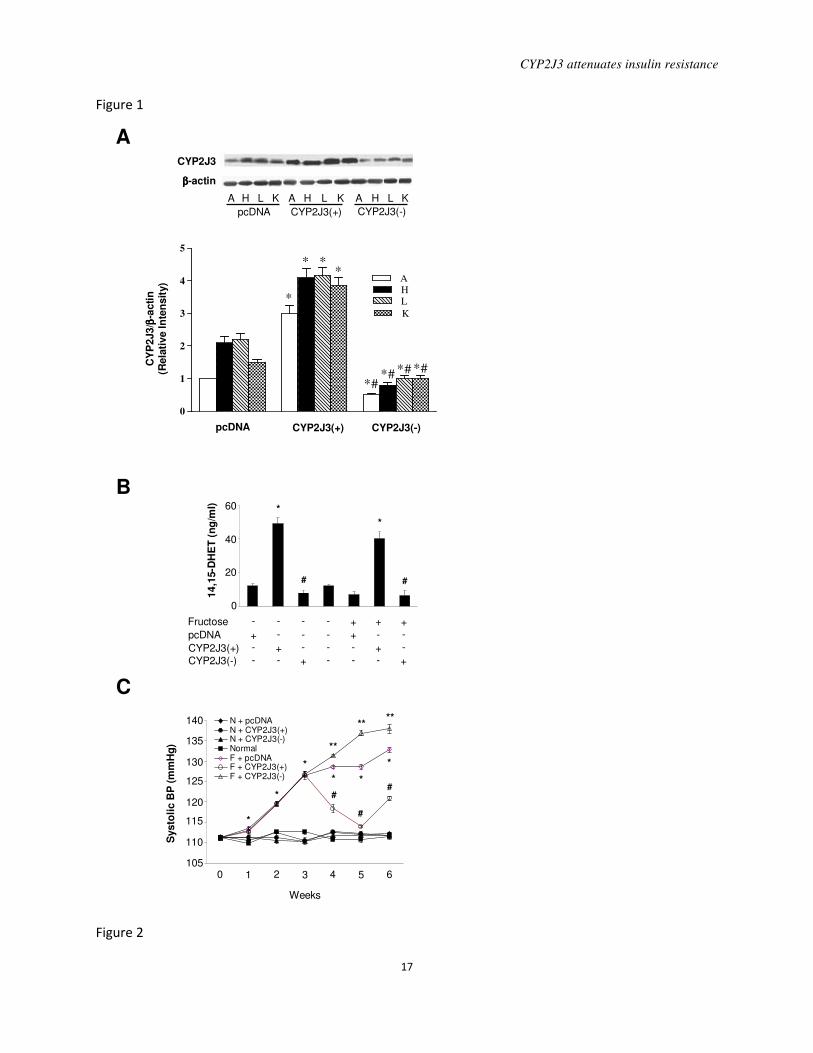
Figure 1. Effects of CYP2J3 gene delivery on CYP2J3 protein expression, urinary
14,15-DHET levels, and fructose-induced hypertension in rats. A, CYP2J3 protein levels were
increased in aorta (A), heart (H), liver (L) and kidney (K) of fructose-treated rats 2 weeks
following injection of CYP2J3(+) but not following injection of CYP2J3(-) or empty vector
(pcDNA). B, Urinary 14,15-DHET levels were increased in control and fructose-treated rats
injected with CYP2J3(+) compared to rats injected with CYP2J3(-) or empty vector (pcDNA). *
P<0.01 vs. pcDNA; # P<0.01 vs. CYP2J3(+); n=8 per group. C, The elevation of systolic blood
pressure observed in fructose-treated rats was decreased 1, 2 and 3 weeks after injection of
CYP2J3(+) (at weeks 4, 5 and 6 of the study) but not after injection with CYP2J3(-) or empty
vector (pcDNA). Values shown are mean ± SEM from each group of rats, respectively.* P<0.01
compared to rats treated without fructose, #P<0.01 compared to rats treated with fructose,
**P<0.01 compared to rats treated with CYP2J3(+); n=4 to 10 per group per time point.
Figure 2. Expression of IRS-1, eNOS, ET-1 and ETA-R in fructose treated rats. Fructose
administration to rats resulted in significantly decreased IRS-1 protein levels in liver (A) and
skeletal muscle (B) and significantly decreased eNOS protein levels in aorta (C). These effects
were inhibited by injection of CYP2J3(+), but not by injection of CYP2J3(-). Representative
western blots are shown above graphs summarizing densitometric quantification. * P<0.05 vs.
N+pcDNA; # P<0.05 vs. F+pcDNA; ** P<0.05 vs. F+ CYP2J3(+); n=8 per group. Levels of
ET-1 (D) and ETA-R (E) transcripts relative to GAPDH were assessed by RT-PCR in aortic
tissue samples from 3 rats from each treatment group at week 5 of the study. Representative
RT-PCR of ET-1 or ETA-R mRNA expression and corresponding densitometric quantification of
three experiments are shown. Values shown are mean ± SEM. *P<0.05 vs. N+pcDNA3.1; #P<0.05 vs. F+pcDNA3.1;
**P<0.05 vs. F+pcDNA-CYP2J3(+). Effects of CYP2J3 gene
delivery on rat insulin receptor signaling and eNOS expression. Fructose administration to rats
CYP2J3 attenuates insulin resistance
16
resulted in significantly decreased eNOS protein levels in aorta (C), and decreased IRS-1 protein
levels in liver (D) and skeletal muscle (E). These effects were inhibited by injection of
CYP2J3(+), but not by injection of CYP2J3(-). Representative western blots are shown above
graphs summarizing densitometric quantification. * P<0.05 vs. N+pcDNA; # P<0.05 vs.
F+pcDNA; ** P<0.05 vs. F+ CYP2J3(+); n=8 per group.
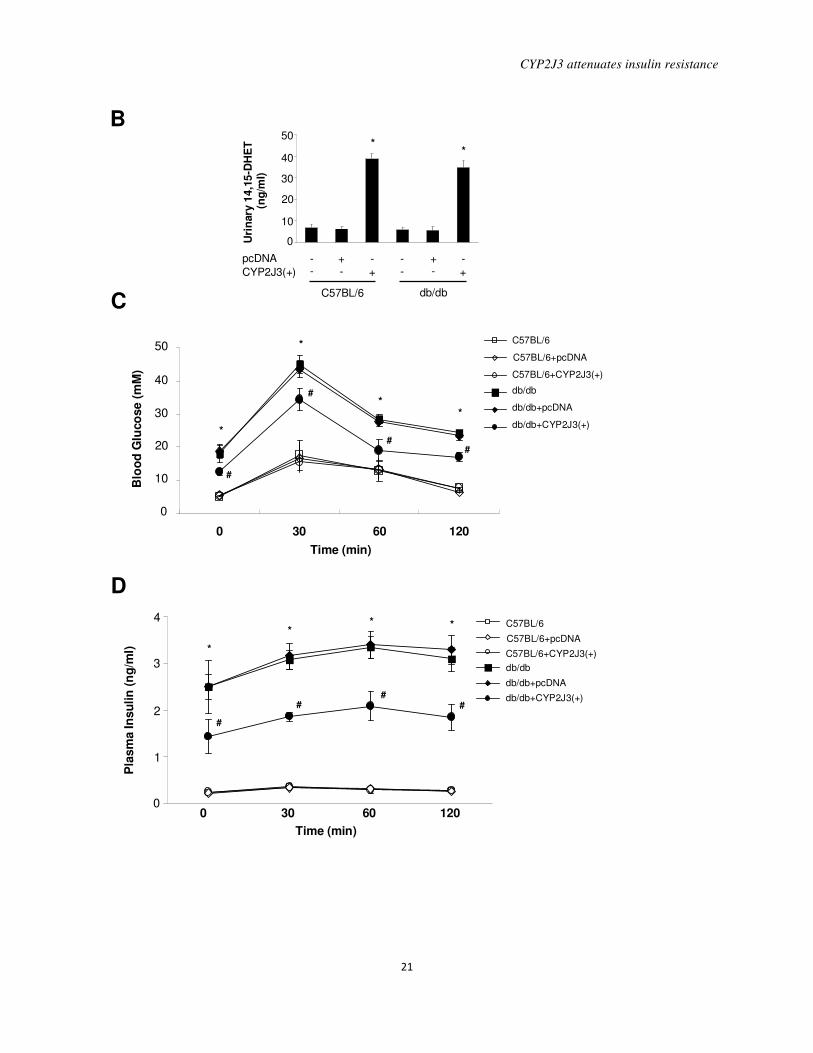
Figure 3. Effects of CYP2J3 gene delivery on CYP2J3 protein expression, urinary
14,15-DHET levels and glucose tolerance in db/db mice. A, Levels of CYP2J3 protein were
increased in the aorta (A), heart (H), liver (L) and kidney (K) in diabetic db/db mice 2 weeks
after injection with CYP2J3(+) compared to levels observed after injection with the empty
pcDNA vector. B, Urinary 14,15-DHET levels were increased in C57BL/6 and db/db mice
injected with CYP2J3(+) compared to those injected with the empty pcDNA vector. * P<0.05 vs.
control and pcDNA-treated mice of corresponding genotype; n=8 per group. Blood glucose (C)
and plasma insulin (D) levels before and up to 120 min after a single glucose challenge were
elevated in db/db mice and decreased by injection with CYP2J3(+). No such reduction was
observed in db/db mice injected with empty vector (pcDNA). * P<0.05 vs. C57BL/6; # P<0.05
vs. db/db+pcDNA; n=8 per group.
Figure 4. Effects of CYP2J3 gene delivery on activation of mouse insulin receptor
signaling and eNOS phosphorylation. A, Relative to levels in C57BL/6 mice, Y989-IRS-1
phosphorylation was significantly decreased and S307-IRS-1 phosphorylation significantly
increased in livers of db/db Normal and db/db+pcDNA mice. These changes were prevented in
db/db mice injected with CYP2J3(+). Representative western blots are shown above graphs
summarizing densitometric quantification. * P<0.05 vs. C57BL/6; # P<0.05 vs. db/db+pcDNA;
n=8 per group. B, Levels of pS1177-eNOS in liver were lower and levels of pT495-eNOS were
higher in db/db mice than in C57BL/6 mice. The downregulation of pS1177-eNOS was inhibited
by injection with CYP2J3(+) whereas no effect was observed on pT495-eNOS. Representative
western blots are shown above graphs summarizing densitometric quantification. * P<0.05 vs.
C57BL/6; # P<0.05 vs. db/db+pcDNA; n=8 per group.
Figure 5. Effects of CYP2J3 gene delivery on liver PI3K expression in fructose-treated
rats and mice. A, Decreased liver PI3K protein levels were observed in fructose-treated rats and
this was prevented by injection of CYP2J3(+), but not by injection of CYP2J3(-) or empty vector
(pcDNA). * P<0.05 vs. N+pcDNA; # P<0.05 vs. F+pcDNA; ** P<0.05 vs. F+CYP2J3(+); n=8
per group. B, Liver PI3K protein levels were decreased in db/db mice compared to C57BL/6
mice. This decrease was prevented by injection of CYP2J3(+) but not by injection of empty
vector (pcDNA). * P<0.05 vs. C57BL/6 group; # P<0.05 vs. db/db+pcDNA; n=8 per group. For
both (A) and (B), representative western blots are shown above graphs summarizing
densitometric quantification.
Figure 6. Effects of CYP2J3 gene delivery on urinary cAMP and cGMP levels. A, Levels
of urinary cAMP were increased in rats two weeks after injection with CYP2J3(+) compared to
levels observed after injection with the empty pcDNA3.1 vector. B, Urinary cGMP levels were
increased in rats injected with CYP2J3(+) compared to those injected with the empty pcDNA
vector. * P<0.05 vs. pcDNA-treated and normal water-treated rats; # P<0.05 vs. pcDNA-treated
and fructose-treated rats; n=8 per group.
CYP2J3 attenuates insulin resistance
17
Figure 1
A
C
B
CYP2J3
ββββ-actin
pcDNA CYP2J3(-)CYP2J3(+)
A KH L A KLH A KH L
Fructose
14
,15-D
HE
T (
ng
/ml)
0
20
40
60
pcDNA
CYP2J3(-)
CYP2J3(+)
-
-
-
-
-
-
-
-
-
-
-
-
-
-
-
-
-
-
-+
+
+
+
+
+
+
+
+
*
*
##
N + pcDNAN + CYP2J3(+)N + CYP2J3(-)NormalF + pcDNAF + CYP2J3(+)F + CYP2J3(-)
Systo
lic B
P (
mm
Hg
)
110
120
130
140
115
125
135
1051 2 3 40 5 6
Weeks
*
*
#
**
*
#
**
*
#
**
*
*
PcDNA CYP2J3(+) CYP2J3(-)0
1
2
3
4
5
AHL
K
*
* **
*#*# *# *#
CY
P2
J3
/β-a
cti
n(R
ela
tive
In
ten
sit
y)
pcDNA CYP2J3(-)CYP2J3(+)
CY
P2J3/ ββ ββ
-acti
n(R
ela
tive In
ten
sit
y)
Figure 2

CYP2J3 attenuates insulin resistance
18
A
B
C eNOS
ββββ-actin
Fructose
Ao
rta e
NO
S/ ββ ββ
-acti
n(R
ela
tiv
e In
ten
sit
y) 1.25
pcDNA
CYP2J3(-)
CYP2J3(+)
-
-
-
-
-
-
-
-
-
-
-
-
-
-
-
-
-
-
-+
+
+
+
+
+
+
+
+
1.00
0.75
0.50
0.25
0
*
**
#
IRS-1
ββββ-actin
Fructose
Liv
er
IRS
-1/ ββ ββ
-ac
tin
(Rela
tiv
e In
ten
sit
y) 1.25
pcDNA
CYP2J3(-)
CYP2J3(+)
-
-
-
-
-
-
-
-
-
-
-
-
-
-
-
-
-
-
-+
+
+
+
+
+
+
+
+
1.00
0.75
0.50
0.25
0
***
#
IRS-1
ββββ-actin
Fructose
Mu
scle
IR
S-1
/ ββ ββ-a
cti
n(R
ela
tive In
ten
sit
y) 1.25
pcDNA
CYP2J3(-)
CYP2J3(+)
-
-
-
-
-
-
-
-
-
-
-
-
-
-
-
-
-
-
-+
+
+
+
+
+
+
+
+
1.00
0.75
0.50
0.25
0
***
#

CYP2J3 attenuates insulin resistance
19
D
E
Fructose
pcDNA
CYP2J3(-)
CYP2J3(+)
-
-
-
-
-
-
-
-
-
-
-
-
-
-
-
-
-
-
-+
+
+
+
+
+
+
+
+
ET
A/G
AP
DH
(Rel
Inte
ns
ity)
0
2
4
5
3
1
ETA
GAPDH
*
**
#
Fructose
pcDNA
CYP2J3(-)
CYP2J3(+)
-
-
-
-
-
-
-
-
-
-
-
-
-
-
-
-
-
-
-+
+
+
+
+
+
+
+
+
ET
-1/G
AP
DH
(Rel
Inte
nsit
y)
0
2
4
5
3
1
ET-1
GAPDH
*
**
#

CYP2J3 attenuates insulin resistance
20
Figure 3
CYP2J3
ββββ-actin
db/db + pcDNA db/db + CYP2J3(+)
A KH L A KLH
A
db/db+PcDNA db/db+CYP2J3(+)0
1
2
3
4
5 AHLK
*
* * *
CY
P2
J3
/β-a
cti
n(R
ela
tive I
nte
nsi
ty)
CY
P2J3/ ββ ββ
-ac
tin
(Re
lati
ve In
ten
sit
y)
db/db + pcDNA db/db + CYP2J3(+)
CYP2J3 attenuates insulin resistance
21
B
C
D
CYP2J3(+)
pcDNA- --
- - +
++
+
0
10
30
50
Uri
nary
14,1
5-D
HE
T(n
g/m
l)
20
40
- --
C57BL/6 db/db
**
Series1
C57BL/6+pcDNA3.1
C57BL/6+pcDNA-2J3(+)
db/db
db/db+pcDNA3.1
db/db+pcDNA-2J3(+)
0
10
30
50
Blo
od
Glu
co
se (
mM
)
20
40
0 1206030
Time (min)
C57BL/6
C57BL/6+pcDNA
C57BL/6+CYP2J3(+)
db/db
db/db+pcDNA
db/db+CYP2J3(+)*
*
**
##
#
#
C57BL/6
C57BL/6+pcDNA3.1
C57BL/6+pcDNA-2J3(+)
db/db
db/db+pcDNA3.1
db/db+pcDNA-2J3(+)
0
2
4
Pla
sm
a In
su
lin
(n
g/m
l)
1
3
0 1206030
Time (min)
C57BL/6
C57BL/6+pcDNA
C57BL/6+CYP2J3(+)
db/db
db/db+pcDNA
db/db+CYP2J3(+)
*
** *
##
#
#

CYP2J3 attenuates insulin resistance
22
Figure 4
A
pS307-IRS-1
pY989-IRS-1
IRS-1
1.5
CYP2J3(+)
pcDNA- --
- - +
++
+
- --
C57BL/6 db/db
0
1.0
IRS
-1(p
S30
7)/
IRS
-1(R
ela
tiv
e In
ten
sit
y)
0.5
* *
#
BpS1177-eNOS
pT495-eNOS
eNOS
CYP2J3(+)
pcDNA- --
- - +
++
+
0
1.0
1.5
pS
11
77-e
NO
S/e
NO
S(R
ela
tive
In
ten
sit
y)
0.5
- --
C57BL/6 db/db
0
2
3
pT
49
5-e
NO
S/e
NO
S(R
ela
tiv
e I
nte
ns
ity)
1
4
5
* *
#
* *
* *
#
IRS
-1(p
Y9
89)/
IRS
-1(R
ela
tiv
e I
nte
ns
ity)
0
1
2
3
4
5

CYP2J3 attenuates insulin resistance
23
Figure 5
A
B
PI3K
ββββ-actin
Fructose
pcDNA
CYP2J3(-)
CYP2J3(+)
-
-
-
-
-
-
-
-
-
-
-
-
-
-
-
-
-
-
-+
+
+
+
+
+
+
+
+
0
1.0
1.5
Liv
er
PI3
K/ ββ ββ
-acti
n(R
ela
tive I
nte
nsit
y)
0.5
2.0
*
#
**
PI3K
ββββ-actin
CYP2J3(+)
pcDNA- --
- - +
++
+
- --
C57BL/6 db/db
0
1.0
1.5
Liv
er
PI3
K/ ββ ββ
-acti
n(R
ela
tiv
e I
nte
ns
ity)
0.5*
#
*
CYP2J3 attenuates insulin resistance
24
Figure 6
A
B
Fructose
Uri
nary
cG
MP
(p
g/m
l)
125
pcDNA
CYP2J3(-)
CYP2J3(+)
-
-
-
-
-
-
-
-
-
-
-
-
-
-
-
-
-
-
-+
+
+
+
+
+
+
+
+
100
75
50
25
0
*
*
#
150
Fructose
Uri
nary
cA
MP
(pg
/ml)
100
pcDNA
CYP2J3(-)
CYP2J3(+)
-
-
-
-
-
-
-
-
-
-
-
-
-
-
-
-
-
-
-+
+
+
+
+
+
+
+
+
80
60
40
20
0
*
*
#
120