Embed Size (px)
Citation preview

HAL Id: hal-00328329https://hal.archives-ouvertes.fr/hal-00328329
Submitted on 10 Oct 2008
HAL is a multi-disciplinary open accessarchive for the deposit and dissemination of sci-entific research documents, whether they are pub-lished or not. The documents may come fromteaching and research institutions in France orabroad, or from public or private research centers.
L’archive ouverte pluridisciplinaire HAL, estdestinée au dépôt et à la diffusion de documentsscientifiques de niveau recherche, publiés ou non,émanant des établissements d’enseignement et derecherche français ou étrangers, des laboratoirespublics ou privés.
Increase of the aerosol hygroscopicity by aqueous mixingin a mesoscale convective system: a case study from the
AMMA campaignS. Crumeyrolle, L. Gomes, Pierre Tulet, A. Matsuki, Alfons Schwarzenboeck,
K. Crahan
To cite this version:S. Crumeyrolle, L. Gomes, Pierre Tulet, A. Matsuki, Alfons Schwarzenboeck, et al.. Increase of theaerosol hygroscopicity by aqueous mixing in a mesoscale convective system: a case study from theAMMA campaign. Atmospheric Chemistry and Physics Discussions, European Geosciences Union,2008, 8 (3), pp.10057-10103. �hal-00328329�

ACPD
8, 10057–10103, 2008
MCS impact on
aerosol
hygroscopicity
during AMMA
S. Crumeyrolle et al.
Title Page
Abstract Introduction
Conclusions References
Tables Figures
◭ ◮
◭ ◮
Back Close
Full Screen / Esc
Printer-friendly Version
Interactive Discussion
Atmos. Chem. Phys. Discuss., 8, 10057–10103, 2008
www.atmos-chem-phys-discuss.net/8/10057/2008/
© Author(s) 2008. This work is distributed under
the Creative Commons Attribution 3.0 License.
AtmosphericChemistry
and PhysicsDiscussions
Increase of the aerosol hygroscopicity by
aqueous mixing in a mesoscale
convective system: a case study from the
AMMA campaign
S. Crumeyrolle1, L. Gomes
1, P. Tulet
1, A. Matsuki
2, A. Schwarzenboeck
2, and
K. Crahan1
1GAME/CNRM,METEO-FRANCE – CNRS, Toulouse, France
2Laboratoire de Meteorologie Physique, Clermont-Ferrand, France
Received: 6 March 2008 – Accepted: 23 April 2008 – Published: 29 May 2008
Correspondence to: S. Crumeyrolle ([email protected])
Published by Copernicus Publications on behalf of the European Geosciences Union.
10057

ACPD
8, 10057–10103, 2008
MCS impact on
aerosol
hygroscopicity
during AMMA
S. Crumeyrolle et al.
Title Page
Abstract Introduction
Conclusions References
Tables Figures
◭ ◮
◭ ◮
Back Close
Full Screen / Esc
Printer-friendly Version
Interactive Discussion
Abstract
Aerosol properties were measured during an airborne campaign experiment that took
place in July 2006 in West Africa within the framework of the African Monsoon Multidis-
ciplinary Analyses (AMMA). The goal of the present study was to determine the main
microphysical processes that affect the aerosols during the passage of a mesoscale5
convective system (MCS) over the region of Niamey in Niger. A main difference in
the aerosol profiles measured before and after the passage of the MCS was found for
a layer located between 1300 and 3000 m where the aerosol concentration has dras-
tically decreased after the passage of the MCS. Concurrently, a significant increase
of the cloud condensation nuclei fraction was also observed during the post-MCS pe-10
riod in the same layer. Moreover, the results of the elemental composition analyses
of individual particles collected in this layer after the MCS passage have shown higher
contributions of sulfate, nitrate and chloride to the total aerosol. A mesoscale atmo-
spheric model with on-line dust parameterization and Lagrangian backtrajectories was
used to interpret the impact of the MCS on the aerosol properties. The results of the15
simulation show that the MCS 1) generates dust particles at the surface in front of
the system and washout particles behind, 2) modifies the aerosol mixing state through
cloud processing, and 3) enhances CCN activity of particles through the coating of
soluble material.
1 Introduction20
The interactions between aerosols and clouds have a large influence on the role of
aerosols in climate change. These interactions mainly depend on the particles char-
acteristics (concentration, size, composition, hygroscopic properties, mixing state) and
the type of clouds involved (continental or maritime, convective or stratiform, cold or
warm). In addition, these interactions are complex because the aerosol characteris-25
tics can be modified by in-cloud processes. Indeed, the atmospheric aerosols affect
10058

ACPD
8, 10057–10103, 2008
MCS impact on
aerosol
hygroscopicity
during AMMA
S. Crumeyrolle et al.
Title Page
Abstract Introduction
Conclusions References
Tables Figures
◭ ◮
◭ ◮
Back Close
Full Screen / Esc
Printer-friendly Version
Interactive Discussion
cloud formation through their role as cloud condensation nuclei (CCN). In return, the
clouds affect the aerosol particles by changing their concentration in the atmosphere
through various scavenging processes or by modifying their properties through various
chemical reactions that take place in the drops (or in ice crystals).
There have been few field observations and measurements related to the impact of5
cloud formation on the evolution of aerosol properties. Levin et al. (1996) searching to
identify the effects of dust and sulfate on cloud formation, found that dust particles were
coated with sulfate due to in-cloud processing. A few results obtained from modeling
studies mention the role of clouds in modifying aerosols. For example, using a numer-
ical model, Yin et al. (2002) showed that insoluble mineral dust can become effective10
CCN after passing through a convective cloud. In order to study the processes involved
in the interactions between convective clouds and mineral dust, Africa is probably a well
designed region for obtaining field observations and measurements.
In Africa, precipitation mostly occurs in the form of mesoscale convective systems
(MCS) during the monsoon season when air masses bring a variety of aerosol types15
from different sources. The air mass circulation is formed by south and north trade
winds converging toward the Inter Tropical Discontinuity (ITD). The continental north
easterly trade is called Harmattan and the south westerly trade is called monsoon flux.
These two major fluxes create two distinct layers characterized by different aerosol
properties: the monsoon layer (ML) and the Saharan Air Layer (SAL) (Carlson and20
Prospero, 1972; Prospero and Carlson, 1972). In the ML, the monsoon flux trans-
ports marine air masses over the continent where they are mixed with anthropogenic,
biogenic and other sources of aerosols. The monsoon layer is affected by the land sur-
face on diurnal time-scales, through convection and shallow cumulus clouds in the well
mixed boundary layer. During their transport, mixed aerosols are modified and their25
properties are highly dependent on the mixing. North of the ITD and above the ML
is the SAL, which can be characterized by high dust content, consistent with low visi-
bility (Karyampudi et al., 1999). The SAL is decoupled from the surface below and is
more closely linked to the desert regions (Parker et al., 2005). The presence of aerosol
10059

ACPD
8, 10057–10103, 2008
MCS impact on
aerosol
hygroscopicity
during AMMA
S. Crumeyrolle et al.
Title Page
Abstract Introduction
Conclusions References
Tables Figures
◭ ◮
◭ ◮
Back Close
Full Screen / Esc
Printer-friendly Version
Interactive Discussion
in the SAL is connected to long range transport from Sahelian and Saharan regions.
However, the formation of convective systems can entrain humid ML air into the SAL
and dry SAL air into the ML. This mesoscale process erodes the thickness of the SAL
and dries the monsoon layer (Parker et al., 2005). This process can also modify dust
particles and enhance their CCN activity when they re-enter subsequent clouds.5
The African Monsoon Multidisciplinary Analysis (AMMA) program was designed to
improve our knowledge on the African monsoon and its variability. A detailed descrip-
tion on the project is available at www.amma-international.org/. One of the objectives
of the project was to investigate the cloud-aerosol interactions and particularly the role
of aerosols in the African monsoon system. Several intensive campaigns of aerosol10
and cloud measurements were carried out between 1 June and 25 August 2006 in the
western African region by combining airborne and ground measurements.
The goal of the present study is to determine the main microphysical processes that
affect the aerosols during the passage of a convective system, by comparing the ver-
tical distribution and the physical and chemical properties of the aerosols before and15
after the convective system. For this purpose, airborne measurements were conducted
in July 2006 over Banizoumbou in Niger during a Mesoscale Convective System mis-
sion of the AMMA experiment.
This paper describes the results of profile measurements of aerosol and CCN con-
centration, aerosol size spectra and chemical composition during this period. Then, a20
mesoscale model with on-line dust parameterization and Lagrangian backtrajectories
was used to interpret the impact of the MCS on the aerosol properties. The synoptic
conditions and the MCS description are presented in Sect. 2. The airborne sampling
strategy is described in Sect. 3 as well as the data set of measured aerosol physical
and chemical properties. A mesoscale simulation using an explicit representation of25
cloud and aerosols processes is then presented in Sect. 4.
10060

ACPD
8, 10057–10103, 2008
MCS impact on
aerosol
hygroscopicity
during AMMA
S. Crumeyrolle et al.
Title Page
Abstract Introduction
Conclusions References
Tables Figures
◭ ◮
◭ ◮
Back Close
Full Screen / Esc
Printer-friendly Version
Interactive Discussion
2 Experimental strategy and instrumentation
The measurements were performed during the Special Observation Period #1a
(SOP1a) of the AMMA experiment on the ATR-42 aircraft operated by the Service
des Avions Francais Instruments pour la Recherche en Environnement (SAFIRE). The
aircraft was based at Niamey airport in Niger for the duration of the AMMA experiment5
and performed 11 research flights during this SOP of July 2006. Most of the flight pat-
terns were centered on the surface measurement site of Banizoumbou, located 70 km
east of Niamey. Sampling occurred on 1 and 2 July 2006, i.e. before and after the
passage of a MCS over Niger. The environmental conditions being the same during
both flights, any difference in the aerosol properties could be mainly attributed to the10
impact of the MCS.
2.1 Experimental strategy
Both flights were performed during early afternoon when the convective mixed layer is
growing relatively slowly. The flight plans (Fig. 1) were similar, i.e. same geographic
location and same period of the day (from 11:30 UTC to 15:30 UTC). During both15
flights, two vertical soundings were made, at the beginning and at the end of the flight,
providing a rapid characterization of the inversion level and of the vertical profile of
the thermodynamical and microphysical parameters. On 1 and 2 July, the ATR-42 flew
above Banizoumbou along a cross flight-track with horizontal dimension of about 60 km
(Fig. 1). The two axes of the cross flight-track were oriented North-South and West-20
East. Along these axes the ATR-42 flew at different altitudes, in the Boundary Layer
(BL) and in the Saharan Air Layer (SAL). During the first flight (1 July), the ATR-42
made five legs on each axis, two of them in the BL (400 m and 850 m) and three in the
SAL (1250 m, 2250 m, 2900 m). During the second flight (2 July), the ATR-42 made
five legs on each axis, three of them in the BL (400 m, 650 m, 850 m) and two in the25
SAL (2550 m, 3200 m).
10061

ACPD
8, 10057–10103, 2008
MCS impact on
aerosol
hygroscopicity
during AMMA
S. Crumeyrolle et al.
Title Page
Abstract Introduction
Conclusions References
Tables Figures
◭ ◮
◭ ◮
Back Close
Full Screen / Esc
Printer-friendly Version
Interactive Discussion
2.2 Instrumentation
Aerosol instrumentation was connected to the French community aerosol inlet (CAI)
installed on the ATR-42. This isokinetic and isoaxial inlet has a 50% detection efficiency
estimated at 2.5µm. A condensation particle counter (CPC TSI model 3025) was used
to measure total ambient aerosol concentration (CN) every 2 s for particles diameters5
ranging from 0.003 to 3µm, with an efficiency of 100% for particles ranging from 0.01
to 2µm and a relative uncertainty of 5%.
CCN measurements were made by using a static thermal-gradient diffusion cham-
ber (model 100-B, University of Wyoming) which operated similarly to the chamber
described by Snider and Brenguier (2000). CCN number concentrations were deter-10
mined every minute at a supersaturation (SS) between 0.2 and 1% and CCN spectra
were measured every five minutes. The instrument was calibrated just before the cam-
paign. Its detection limit is approximately 50 cm−3
and the overall measurement error
is about ±15% at 1% SS and ±30% at 0.2% SS.
Aerosol size distributions were measured using two instruments. A scanning mobility15
particle sizer (SMPS) was used to measure the number distribution of aerosol particles
with diameters from 0.02 to 0.3µm. This instrument consisted of a differential mobility
analyzer (DMA) as described by Villani et al. (2007) and a CPC (TSI model 3010) for
particle detection after the DMA. An optical particle sizer (OPS GRIMM model 1.108)
provide particle size distributions in the range 0.3 to 2µm equivalent optical diame-20
ter. Both instruments were also calibrated before the campaign. Data collected were
combined to provide a continuous size distribution between 0.02 and 2µm every 2 min.
A two-stage low-volume impactor with 50% aerodynamic cutoff diameters of 0.2 and
1.6µm was used to collect particles on electron microscope grids (Matsuki et al., 2003).
Some grids were coated in advance with a thick layer of carbon in order to identify the25
particle shape and elemental composition (single particle analysis). In addition, some
aerosol particle samples were collected on nitron-coated nitrocellulose films supported
by Ni grids in order to identify nitrate as described by Mamane and Gottlieb (1992).
10062

ACPD
8, 10057–10103, 2008
MCS impact on
aerosol
hygroscopicity
during AMMA
S. Crumeyrolle et al.
Title Page
Abstract Introduction
Conclusions References
Tables Figures
◭ ◮
◭ ◮
Back Close
Full Screen / Esc
Printer-friendly Version
Interactive Discussion
Sampling duration was between 2 and 5 min depending of the atmospheric load. The
morphology and chemical constituents of individual particles were analyzed using a
Scanning Electron Microscopy (SEM) with an energy dispersive X-ray spectrometer
(EDS). The ATR-42 was also equipped for the measurements of wind, turbulent fluxes,
and atmospheric state parameters.5
3 Description of the situation on 1–2 July 2006
3.1 Synoptic conditions
Figure 2 represents the height of the geopotential at 850 hPa on 1 July 2006,
12:00 UTC, calculated from the ECMWF analysis. From this figure, two structures
clearly appear: the north-west domain is dominated by high geopotential height10
(1580 m) while a low geopotential height (1470 m) is observed over Egypt and western
Lybia. The associated zonal pressure gradient is linked to strong northeasterly wind
(>8 m s−1
), as seen over Niger and Tchad. Over the center of Niger, the northeast-
erly air masses of the Harmattan (between 3 and 5 m s−1
) and the southwesterly air
masses of the monsoon flux (between 1 and 3 m s−1
) converge and depict the Inter-15
Tropical Discontinuity (ITD).
Figure 3 is the ECMWF analysis on 1 July 2006, at 12:00 UTC, for the water vapor
mixing ratio at 850 hPa. Larger values of the water mixing ratio (>12 g kg−1
) are associ-
ated with the monsoon flux while smaller values (<5 g kg−1
) characterize the Harmattan
flux. This figure shows an intrusion of moist air corresponding to the advection by the20
monsoon flux around 14◦N 5
◦E. This intrusion brings humidity and heat near the ITD
close to where a convective system occurs at 15:00 UTC. The presence of the wind
convergence, humidity and heat at low level allows the initiation and the propagation of
a convective system.
10063
ACPD
8, 10057–10103, 2008
MCS impact on
aerosol
hygroscopicity
during AMMA
S. Crumeyrolle et al.
Title Page
Abstract Introduction
Conclusions References
Tables Figures
◭ ◮
◭ ◮
Back Close
Full Screen / Esc
Printer-friendly Version
Interactive Discussion
3.2 MCS description
The initiation of the studied MCS occurs at the border between Niger and Nigeria
(15.04◦N and 5.91
◦E) around 15:00 UTC on 1 July 2006. This zone was highlighted
by the ECMWF analysis to be favorable to convection. The MCS-tracking (Mathon et
al., 2002) and Massachusetts Institute of technology (MIT) radar allowed us to watch5
the MCS formation and to follow its trajectory along West Africa (data available on the
AMMA Operational Center, aoc.amma-international.org/). Figure 4 is a representation
of the MCS-tracking and shows the evolution of the MCS at the time of its formation
(Fig. 4a), its maximum activity (Fig. 4b), and one day after its formation (Fig. 4c). The
MCS was over Banizoumbou (Niger) at midnight (2 July 2006, 00:00 UTC), and van-10
ished two days later over Guinea.
3.3 Surface conditions
For the AMMA special observation periods, late June–early July can be char-
acterized as a dry period (Janicot et al., 2008)1. The precipitation record
at Banizoumbou (http://aoc.amma-international.org/dir.php?current=20060930&dir=15
prod NIAMEY/observation/) indicates that the MCS passage on 1 July corresponds
to the first intense precipitation (17 mm). Dry conditions and low vegetation coverage
make the Sahelian-Saharan region prone to dust events especially when surface wind
speed exceeds a certain threshold. This threshold wind speed mainly depends on sur-
face roughness elements, grain size and soil moisture (Marticorena and Bergametti,20
1995).
1Janicot, S., Ali, A., Asencio, N., Berry, G., Bock, O., Bourles, B., Caniaux, G., Chauvin,
F., Deme, A., Kergoat, L., Lafore, J.-P., Lavaysse, C., Lebel, T., Marticorena, B., Mounier,
F., Nedelec, P., Redelsperger, J.-L., Ravegnani, F., Reeves, C. E., Roca, R., de Rosnay, P.,
Schlager, H., Sultan, B., Thorncroft, C., Tomasini, M., Ulanovsky, A., and ACMAD forecasters
team: Large-scale overview of the summer monsoon over West and Central Africa during the
AMMA field experiment in 2006, Ann. Geophys., submitted, 2008.
10064

ACPD
8, 10057–10103, 2008
MCS impact on
aerosol
hygroscopicity
during AMMA
S. Crumeyrolle et al.
Title Page
Abstract Introduction
Conclusions References
Tables Figures
◭ ◮
◭ ◮
Back Close
Full Screen / Esc
Printer-friendly Version
Interactive Discussion
4 Results
The CN and CCN concentrations and the aerosol size distribution were first used to
characterize the evolution of the hygroscopic properties of aerosols by comparing their
microphysical properties before and after the MCS passage. For both flights, except
during the time of the vertical sounding, the CCN and aerosol spectra were compared5
to estimate the efficiency of aerosol to serve as CCN. Thus, for the presentation of the
following graphs, the red (and blue) color corresponds to data measured before (and
after) the MCS passage. Moreover, it was observed that the MCS passage decreases
the height of the BL as the inversion descended from 1500 m to 800 m after the passage
of the MCS. Consequently, open symbols indicate data measured within the BL while10
solid symbols correspond to data measured above the boundary layer.
4.1 Aerosol concentration
Figure 5 shows concentrations for the total aerosol (CN) and the CCN (at a supersatu-
ration of 0.6%, CCN0.6) measured as a function of altitude during both flights. A strong
vertical gradient of CN concentration is observed in the vertical profile. On 1 July, the15
total aerosol concentration is about 2000 cm−3
within the BL and varies between 1500
and 500 cm−3
within the SAL. On 2 July, the average concentration is about 2200 cm−3
in the BL. Above the BL, the aerosol concentration decreases more rapidly than the
previous day to about 500 cm−3
at 3000 m. A main difference in the aerosol profiles is
noted for a layer located between 1300 and 3000 m where the CN concentration has20
drastically decreased after the passage of the MCS, suggesting a cloud processing. In
the BL, a large variability of the measurements is observed on both profiles, especially
during the second flight, after the MCS passage.
The CCN0.6 concentration profiles observed during both flights do not show such a
clear difference after the MCS passage but a vertical gradient of CCN0.6 concentration25
is also observed throughout the vertical profile. The CCN0.6 number concentrations
were relatively high in the BL with a mean value of 500 cm−3
comparable with val-
10065

ACPD
8, 10057–10103, 2008
MCS impact on
aerosol
hygroscopicity
during AMMA
S. Crumeyrolle et al.
Title Page
Abstract Introduction
Conclusions References
Tables Figures
◭ ◮
◭ ◮
Back Close
Full Screen / Esc
Printer-friendly Version
Interactive Discussion
ues typically measured in continental environments. Higher in altitude, the concentra-
tions resemble much more what is conventionally regarded as free troposphere values.
Above 3200 m, the CCN0.6 measurements were not available during the second flight
because of a failure of the CCN chamber.
To quantify the changes of the CN and CCN0.6 concentrations and characterize the5
relationship between CCN0.6 and total aerosol population in the atmospheric column,
the CCN0.6/CN ratio was introduced as a tool to follow the intensity of the interaction
between aerosols and clouds. When this ratio is 0, no activation of aerosols can occur
to form cloud droplets while when this ratio is 1, all aerosol particles can activate to
become droplets.10
The variation with altitude of the CCN0.6/CN ratio is shown on Fig. 6. In the BL,
before the MCS passage, the value of the CCN0.6/CN ratio ranged between 15 and
32%. In the SAL during the same day, this ratio was less than 20%. After the MCS
passage, the CCN0.6/CN ratio was less than 25% in the BL while, in the SAL, this ratio
increased to 50%. Figure 6 shows a significant increase of the CCN0.6 fraction within15
the SAL after the passage of the MCS, especially in the layer located between 1300
and 3000 m, while the ratio remained unchanged in the BL. Because the enhancement
in CCN0.6 activity is mainly a function of particle size and chemistry (Kohler, 1926),
these properties will be discussed in more detail below.
4.2 Aerosol size distribution20
Submicron aerosol size distribution were inverted using a software, developed by
the LaMP (Laboratoire de Meteorologie Physique, University of Clermont-Ferrand,
France), taking into account charging probabilities, counting efficiencies of the CPC
and transfer functions of the DMA. The number distributions measured during each
flight by combining the SMPS and the OPS were averaged to determine a mean dis-25
tribution for each layer (BL and SAL). From these mean number distributions, a mean
volume distribution was calculated for each layer as well. The mean distributions were
fitted by using multi-modal lognormal distributions that best represent the measured
10066

ACPD
8, 10057–10103, 2008
MCS impact on
aerosol
hygroscopicity
during AMMA
S. Crumeyrolle et al.
Title Page
Abstract Introduction
Conclusions References
Tables Figures
◭ ◮
◭ ◮
Back Close
Full Screen / Esc
Printer-friendly Version
Interactive Discussion
distributions. A maximum of three modes were used to describe the number and vol-
ume distributions. The parameters of each mode of the lognormal fit (number or vol-
ume concentration, median diameter and geometric standard deviation) are shown in
Tables 1 and 2, and the results are plotted on Fig. 7. The total aerosol concentrations
estimated by integrating the size distributions from the SMPS and the OPS was lower5
than the CPC3025 measurements because of the higher detection limit (10 nm versus
3 nm).
Aitken (Dp<0.1µm), accumulation (0.1<Dp<0.5µm) and coarse (Dp>0.5µm)
modes were present in both layers before and after the MCS passage. In addition, par-
ticles from a nucleation mode (Dp<0.02µm) were also observed in the SAL layer after10
the MCS passage (not shown). Airborne measurements have already found evidence
that new particle formation may occur near cloud boundaries (Roberts et al., 2001).
In general, the shape of the size distributions was almost the same and the contribu-
tion of each mode remained unchanged after the passage of the MCS. In particular,
for particles with diameter larger than 30 nm, no significant change of the aerosol size15
distribution appears in the SAL between both flights. This result suggests that the evo-
lution observed in the SAL regarding the CCN fraction cannot be attributed to a particle
growth in this layer due to the passage of the convective system. Therefore, since the
particle size cannot explain the enhancement of the CCN ratio observed in the SAL,
more knowledge on the chemical composition of the particles is necessary.20
As shown by Fig. 7, the volume distribution correlates well to the OPS measure-
ment, as the concentration of particles with diameter larger than 0.5µm increases
significantly in the BL after the MCS passage. This observation suggests an increased
concentration of dust that can be verified by an analysis of particle composition.
4.3 Single particle analysis25
Aerosol samples were collected periodically throughout the flights for analysis of their
composition using SEM-EDS. The distribution of the elemental composition of the par-
ticles as a function of size was determined by analyzing several tenths of particles
10067

ACPD
8, 10057–10103, 2008
MCS impact on
aerosol
hygroscopicity
during AMMA
S. Crumeyrolle et al.
Title Page
Abstract Introduction
Conclusions References
Tables Figures
◭ ◮
◭ ◮
Back Close
Full Screen / Esc
Printer-friendly Version
Interactive Discussion
from four samples. One was taken before the MCS passage in the SAL (at an alti-
tude of 2790 m) and the three others after the MCS passage (one in the BL at 394 m
and two in the SAL at 2493 and 3090 m). The analysis distinguished between fine
(0.2µm<Dp<1.6µm) and coarse fraction of particles (Dp>1.6µm) and the frequency
of occurrence of the main elements was determined. It has to be noted that particles5
smaller than 0.2µm were not analyzed for their chemical composition by EDS due to
the low signal-to-noise ratio when using a beam energy low enough to avoid evapora-
tion of the particles.
As expected, the most abundant component found in the BL after the MCS passage
was mineral dust (47%). Most of the X-ray spectra showed an abundance of Al, Si and10
Fe characteristic of the presence of crustal components. None of these dust particles
contained sulfur or chloride (which are common soluble elements measurable by the
EDS analyzer) suggesting that the BL was rather enriched with fresh emitted dust.
This dust abundance in the BL correlates with the increase of concentration of coarse
particles observed in the BL on Fig. 7b. This result indicates that dust particles of15
the coarse mode emitted during the passage of the MCS are sedimenting in the BL
after the passage of the MCS. However, dust is generally thought of as water insoluble.
Therefore, its efficiency to serve as CCN is rather low. The processing cannot be
fully described from the available observations but the presence of non hygroscopic
particles (like mineral dust) in the BL can explain that the CCN0.6 fraction remains the20
same in both flights. The other main components found on this sample were sulfate
particles (26%), biomass burning particles (13%) and carbon particles (4%). The sea-
salt particles were present in very low concentrations and the undetermined fraction of
particles represented about 10%.
According to the single particle analysis of the fine fraction, a large difference of25
composition is observed between the samples that were taken on carbon-coated grids
in the SAL during both flights. Before the MCS passage, most particles (48%) contain
Al and Si with a high percentage occurrence of iron, suggesting a mineral composition.
Among the other particles, the sulfate-containing particles represent only 12% of the
10068

ACPD
8, 10057–10103, 2008
MCS impact on
aerosol
hygroscopicity
during AMMA
S. Crumeyrolle et al.
Title Page
Abstract Introduction
Conclusions References
Tables Figures
◭ ◮
◭ ◮
Back Close
Full Screen / Esc
Printer-friendly Version
Interactive Discussion
total number of particles observed. The samples taken after the MCS passage reveal
a large change in the occurrence of components. Elements such as Al and Si were
found with lower frequencies in the accumulation mode of particles. Mineral dust parti-
cles represented only 18% of the particles while the frequency of occurrence of sulfate
particles increased markedly up to 43%. In addition, a significant number of dust par-5
ticles contained sulfur (33%) or chloride (11%), suggesting that, contrary to what was
observed in the BL, the surface properties of the mineral dust particles may have been
altered by a coating of soluble elements.
Large differences were also observed between the samples that were taken on
nitron-coated grids in the SAL, before and after the passage of the MCS. The parti-10
cles of the coarse fraction collected on nitron-coated grids were analyzed to identify
those containing nitrate (Mamane and Pueschel, 1980). Indeed, the nitron-coated sub-
strate captures and, after octanol vapor exposition, crystallizes nitrate on the substrate
surface. Nitrate, like sulfate or ammonium, is water soluble and can increase the ef-
ficiency of a particle to serve as CCN. However, several previous experimental anal-15
yses have indicated that sulfates are primarily found in the fine mode while nitrates
are predominantly found in the coarse fraction (>1µm) (Dentener et al., 1996; Murphy
and Thompson, 1997; Gard et al., 1998; Zhuang et al., 1998). Figure 8a and b show
photomicrographs of the nitron-coated substrates used to collect coarse particles on
1 July (at 2790 m) and on 2 July (at 3090 m), respectively. Figure 8b clearly shows20
the reactivity spot around large particles (visible at the center of the spot) surrounded
by elongated fibers that are characteristic of the chemical reaction of nitrate with the
nitron film. Figure 8a shows no such reaction of nitron substrate with the particles
(Isawa and Ono, 1979; Mamane and Pueschel, 1980; Mamane and Gottlieb, 1992).
Therefore, the single-particle analysis indicates the presence of nitrate on coarse par-25
ticles (mainly mineral dust) collected during the post-MCS period, suggesting a coating
of this ionic component. A modification of the surface properties of dust particles by
coating of a highly water soluble component like nitrate (Seinfeld and Pandis, 1998)
can enhance their hygroscopic properties (Levin et al., 1996). In addition, the high
10069

ACPD
8, 10057–10103, 2008
MCS impact on
aerosol
hygroscopicity
during AMMA
S. Crumeyrolle et al.
Title Page
Abstract Introduction
Conclusions References
Tables Figures
◭ ◮
◭ ◮
Back Close
Full Screen / Esc
Printer-friendly Version
Interactive Discussion
frequency of occurrence of nitrate in the aerosols of the SAL suggests that most of the
coarse particles are probably efficient CCN.
Levin et al. (1996) quoted different processes to explain the coating of soluble ma-
terials on core particles: coagulation of particles, gas to particles conversion, cloud
processing. In Niger, the major source of nitrate are the marine air masses transported5
in the BL, from the southwest, by the monsoon flux. However, in this study, the particle
coated with nitrate were collected at about 1500 m above the top of the BL. Thus, we
believe that a physico-chemical mechanism was able, first, to lift up nitrate particles
from the BL to the SAL, and secondly to mix particles and nitrates together.
Finally, all the observations described above have shown that strong aerosol mod-10
ifications (concentration profile, CCN0.6/CN, mixing state) have been caused by this
mechanism. A main difference in the aerosol profiles is shown for a layer located be-
tween 1300 and 3000 m where the CN concentration has drastically decreased after
the passage of the MCS. In this layer, a significant increase of the CCN0.6 fraction has
also been observed during the post-MCS period. Moreover, the results of the elemen-15
tal composition analyses of individual particles collected in this layer after the MCS
passage have shown a higher contribution of sulfate, nitrate and chloride to the total
aerosol (in internal and/or external mixing with mineral dust), all of which being soluble
and efficient CCN. We thus expect that MCS processing acted as a physico-chemical
mechanism that is responsible for the enhancement of the CCN0.6/CN ratio observed20
in the SAL during the post-MCS period. Thus, to complement the observations and
interpret the results, a simulation exercise was carried out.
5 Numerical modeling
5.1 Model description
To interpret these results, the meso-scale, non hydrostatic atmospheric model MesoNH25
was used in this study. This model has been jointly developed by CNRM (Meteo
10070

ACPD
8, 10057–10103, 2008
MCS impact on
aerosol
hygroscopicity
during AMMA
S. Crumeyrolle et al.
Title Page
Abstract Introduction
Conclusions References
Tables Figures
◭ ◮
◭ ◮
Back Close
Full Screen / Esc
Printer-friendly Version
Interactive Discussion
France) and Laboratoire d’Aerologie (CNRS) (Lafore et al., 1998). MesoNH simulates
small scale (LES type, horizontal resolution of a few meters) to synoptic scale (horizon-
tal resolution of several tens of kilometers) and can be run in a two-way nested mode in-
volving up to 8 nesting stages. Different sets of parameterization have been introduced
for convection (Bechtold et al., 2001), cloud microphysics (Pinty and Jabouille, 1998;5
Cohard and Pinty, 2000), turbulence (Bougeault and Lacarrere, 1989), biosphere-
atmosphere thermodynamic exchanges (ISBA) (Noilhan and Mahouf, 1996), urban-
atmosphere interactions (Masson, 2000), lightning processes (Barthe et al., 2005),
gaseous chemistry (Suhre et al., 1998; Tulet et al., 2003) and aerosol chemistry (Tulet
et al., 2005).10
Mineral dust emissions are parameterized by Grini et al. (2006). In this parame-
terization, the three dust aerosol populations proposed by Alfaro and Gomes (2001)
are generated and transported by the ORILAM lognormal aerosol scheme (Tulet et al.,
2005). Regarding emission processes, dust aerosols are mobilized using the Dust En-
trainment and Deposition model (DEAD) (Zender et al., 2003) which calculates dust15
fluxes from wind friction speeds. The physical basis of the model is taken from Marti-
corena and Bergametti (1995) where dust fluxes are calculated as a function of salta-
tion and sandblasting processes. Here, the emission of dust aerosols are calculated
directly from ISBA surface parameters, and then sent to the atmosphere consistent
with the fluxes of momentum, energy and humidity. Aerosol scavenging is explicitly20
determined according to a kinetic approach to calculate the aerosol mass transfer in
cloud and rain droplets as defined by Seinfeld and Pandis (1997), Pruppacher and Klett
(1978), and Tost et al. (2006). The in-cloud mass aerosol transfer into rain droplets by
autoconversion and accretion processes have been introduced as described by Pinty
and Jabouille (1998). The sedimentation of aerosol mass included in raindrops has25
been solved using a time splitting technique with an upstream differencing scheme of
the vertical sedimentation raindrops flux. The release of aerosols into the air due to
rain evaporation is assumed to be proportional to the water evaporated (Chin et al.,
2000).
10071

ACPD
8, 10057–10103, 2008
MCS impact on
aerosol
hygroscopicity
during AMMA
S. Crumeyrolle et al.
Title Page
Abstract Introduction
Conclusions References
Tables Figures
◭ ◮
◭ ◮
Back Close
Full Screen / Esc
Printer-friendly Version
Interactive Discussion
MesoNH uses the radiation code of ECMWF (Fouquart and Bonnel, 1980; Morcrette
and Fouquart, 1986; ECMWF, 2004) which computes the radiative fluxes of shortwave
and longwave radiations. Clouds and aerosols in the shortwave are taken into ac-
count using the Delta Eddington transformation (Joseph et al., 1976). Regarding the
shortwave effect, a refractive index of the dust aerosols was assigned according to that5
measured over the ground site of Djougou (Benin) during the AMMA campaign (Mallet
et al., 2008)2. To determine the origin of the simulated air masses, the model uses
lagrangian backtrajectories as detailed by Gheusi and Stein (2002).
5.2 Simulation configuration
The simulation begins at 00:00 UTC on 29 June 2006, and ends at 00:00 UTC on 310
July 2006. Three two-way nested grid domains were performed. The large domain
(36 km resolution) between 3.1◦S and 31.7
◦N in latitude and 25.64
◦W and 35.64
◦E
in longitude, gives a large scale synoptic view of west Africa. The first embedded do-
main (12 km resolution) is centered over Northwest Nigeria and covers a large part of
the AMMA campaign area (latitudes 4.3◦N and 17.6
◦N and longitudes 4.19
◦W and15
16.24◦E). The smallest embedded domain (3 km resolution) gives a fine scale view of
the Niger between 11.80◦N and 16.82
◦N in latitude and 0.10
◦E and 8.31
◦E in longi-
tude. The vertical resolution is composed of 60 stretched vertical levels reaching the
altitude of 34 000 m; 30 levels are located in the boundary layer between the surface
and 2000 m.20
Initialization and lateral boundary conditions of the large domain were taken from the
ECMWF analysis. Vegetation types came from the ECOCLIMAP data base (Masson et
al., 2003). The soil wetness index (SWI) was computed in offline mode using low level
atmospheric data from the ECMWF forecast model merged with satellite precipitation
2Mallet, M., Tulet, P., Serca, D., and Lohou, F.: A study of the impact of saharan dust on
the radiative forcing, surface energy budget and atmospheric dynamics over the west african
region in March 2006, J. Geophys. Res., submitted, 2008.
10072

ACPD
8, 10057–10103, 2008
MCS impact on
aerosol
hygroscopicity
during AMMA
S. Crumeyrolle et al.
Title Page
Abstract Introduction
Conclusions References
Tables Figures
◭ ◮
◭ ◮
Back Close
Full Screen / Esc
Printer-friendly Version
Interactive Discussion
data from the EPSAT-SG product (REF) and downwelling shortwave and longwave
atmospheric radiative fluxes from the LAND-SAF product (Trigo et al., 2008)3. This
forcing data was then used as an upper boundary condition to drive the ISBA land
surface model (Noilhan and Mahouf, 1996) from 2002–2006 in order to obtain a soil
moisture state which is more realistic than that obtained from the operational NWP5
model. Boone and deRosnay (2007) describe the forcing data and the methodology in
more details.
5.3 Comparison between simulation and observations
Figure 9a gives the Meteosat infrared picture on 2 July 2006 at 00:00 UTC and Fig. 9b
shows the brightness temperature (Chaboureau and Pinty, 2006) simulated by Meso-10
NH on 1 July 2006 at 19:00 UTC. Both simulations and MSG images show the devel-
opment of a multiple convective system over the Niamey region. The two more intense
systems are observed north and east of Banizoumbou. To follow their movement, the
trajectory analysis has been superimposed to the satellite image. The northern MCS
triggered east of the domain of Fig. 9b and propagated from north of Niamey to Burkina15
Faso (west of the domain). The second system observed east of Banizoumbou moved
slowly and disappeared south of Niamey. In our simulation, the two modeled systems
appear in the Niamey region 5 h sooner than those observed on the brightness temper-
ature map. The northern MCS evolves similarly to the observed one, but moves a bit
more south, passing over Banizoumbou and Niamey whereas the observed trajectory20
of this system remains north of these locations. The MCS located east of Banizoum-
bou is simulated 0.5◦
too far east and its propagation is quite different to the observed
one. Instead of disappearing, the system merges with the northern one when passing
south of Niamey. It is reasonable to estimate that the cycle of life of these two main
3Trigo, T. F., DaCamara, D. F., Viterbo, P., Roujean, J. L. Olesen, F., Camacho de Coca, F.,
Garcia-Haro, J., Geiger, B., Gellens-Meulenberghs, F., Melia, J., and Siljamo, N.: The satellite
application facility on land surface analysis, B. Am. Meteorol. Soc., submitted, 2008.
10073

ACPD
8, 10057–10103, 2008
MCS impact on
aerosol
hygroscopicity
during AMMA
S. Crumeyrolle et al.
Title Page
Abstract Introduction
Conclusions References
Tables Figures
◭ ◮
◭ ◮
Back Close
Full Screen / Esc
Printer-friendly Version
Interactive Discussion
systems is close enough to reality to use the simulation as a realistic tool to interpret
the data. Nevertheless, the time delay of 5 h between simulation and observation will
be taken into account in the following comparison.
The Atmospheric Radiation Measurement (ARM) ground site at Niamey airport
(www.archive.arm.gov/) was an observation site to analyze the MCS passage and val-5
idate the simulation results. Figure 10 shows the evolution of temperature (a), pres-
sure (b), wind speed (c) and accumulated rain water (d) observed and simulated by
MesoNH. The 5 h of delay between the real and the simulated MCS’s passage are
clearly retrieved on the surface field over Niamey by a decrease of the surface pres-
sure and temperature, and an increase of surface wind and accumulated rainfall. From10
20:00 UTC to 00:00 UTC on 1 July, the modeled and observed temperatures decrease
(−14◦K and −9
◦K, respectively) as the result of a MCS downdraft that generates a gust
front over Niamey (respectively 15.3 m s−1
and 14.8 m s−1
, Fig. 10c). On Fig. 10c, we
clearly see the passage of both MCS, at 19:00 UTC and 23:00 UTC, when the aver-
aged wind speed is about 15.3 m s−1
and 14.2 m s−1
, respectively. The ARM data, in15
accordance with the MCS trajectories seen on Fig. 9, indicates only one MCS pas-
sage at 00:00 UTC over Niamey. Before and after the MCS passage, the observed
and modeled wind speed are between 1 and 6 m s−1
. It is important to note that the
temperature decrease and the surface wind speed generated by the gust front are
similar in the observation and in the model. The modeled precipitation rate (3.4 mm)20
(Fig. 10d) confirms only one MCS passage over Niamey. The delay observed between
measured and simulated precipitation rates indicates that only the northern MCS pre-
cipitated. The simulated precipitation rate is higher than the observed precipitation
rate (2.2 mm) suggesting that Niamey is directly affected by the convective core of the
system in the simulation and mostly by the stratiform part of the system in reality.25
The modeled and the observed atmospheric pressures (Fig. 10b) are consistent dur-
ing the 15 first hours of the 1 July 2006. Just before the MCS passage, the pressure
value decreases to 984.3 hPa. From 1 July 18:00 UTC to 2 July 12:00 UTC, the mod-
eled pressure is systematically underestimated. We can note that the MCS passage
10074

ACPD
8, 10057–10103, 2008
MCS impact on
aerosol
hygroscopicity
during AMMA
S. Crumeyrolle et al.
Title Page
Abstract Introduction
Conclusions References
Tables Figures
◭ ◮
◭ ◮
Back Close
Full Screen / Esc
Printer-friendly Version
Interactive Discussion
perturbs the atmospheric pressure. 17 h after the MCS passage, the modeled pressure
compares well again with the observed pressure.
The aerosol number concentration measured as a function of altitude with the SMPS
and the OPS during the ATR flight on 2 July between 12:00 UTC and 16:00 UTC (i.e.
12 to 16 h after the MCS passage) were averaged and converted to mass concen-5
tration in order to give the mean profile of aerosol mass concentration for the zone
considered (i.e. 0.5◦
around Banizoumbou; see Fig. 4). These data are compared to
the vertical profile of dust mass concentration simulated over Banizoumbou on 2 July
at 07:00, 08:00, 09:00 and 10:00 UTC, i.e. 12 to 16 h after the passage of the simu-
lated MCS (Fig. 11a). A size cutoff of 2.5µm similar to the 50% detection efficiency of10
the aerosol inlet was applied to the calculation in order to compare simulated aerosol
profiles to airborne observations within a range of particles <2.5µm. In the boundary
layer, between the surface and 900 m of height, the observations highlight a well-mixed
layer with a steady concentration value of 60µg m−3
. In the other hand, simulated dust
mass concentrations range from 200µg m−3
at 07:00 UTC (not shown) to 50µg m−3
15
at 10:00 UTC within a boundary layer of 450 m in thickness. This corresponds to a
mean temporal value of 100µg m−3
. This overestimation can be interpreted as the
consequence of the difference between the BL height observed between 12:00 and
16:00 UTC and that simulated between 07:00 and 10:00 UTC. Indeed, in our simu-
lation the aerosols present in the boundary layer are confined in the 450 first meters20
above the surface instead of being more diluted in a 900 m thick layer. Applying a
dilution factor of 2 corresponding to the difference between both boundary layer thick-
ness, the mean computed aerosol concentration (50µg m−3
) becomes comparable to
the observation. Above the boundary layer, two distinctive layers are observed. The
first one, between 900 and 2800 m, corresponds to a well-mixed layer with an aerosol25
mass concentration ranging between 27 and 35µg m−3
. The upper layer, separated
from the intermediate layer by a maximum of 42µg m−3
at 2800 m, is characterized by
a linear decrease of the dust concentration with altitude. The simulation results provide
a similar vertical structure with the presence of three layers (Fig. 11a). An intermediate
10075

ACPD
8, 10057–10103, 2008
MCS impact on
aerosol
hygroscopicity
during AMMA
S. Crumeyrolle et al.
Title Page
Abstract Introduction
Conclusions References
Tables Figures
◭ ◮
◭ ◮
Back Close
Full Screen / Esc
Printer-friendly Version
Interactive Discussion
layer is also reproduced above the boundary layer with a quite constant concentration
of aerosol of 25µg m−3
at 700 m and 35µg m−3
at 2000 m. Taking into account that
this simulated layer is 400 m lower than the observed one, it is remarkable to note that
the model is able to reproduce the same thickness of about 2000 m and the order of
magnitude of the aerosol mass concentration. Above this layer, the simulation also5
reproduces the upper layer (corresponding to the SAL) with a decrease of the mass
concentration with altitude. An examination of the aerosol vertical profiles simulated
over various points around Banizoumbou (at 0.5◦
north, south, west and east of Ban-
izoumbou) describing the limit of the area sampled by the aircraft is also shown on
Fig. 11b. Small differences appear in the various simulated vertical structures, con-10
firming that the whole region around Banizoumbou was characterized by the presence
of three atmospheric layers 13 h after the MCS passage.
5.4 Air mass origin
The MesoNH tool allows us to determine the air mass origin using the lagrangian back-
trajectories analysis of Gheusi and Stein (2002). The interest of this lagrangian ap-15
proach is to transport position tracers that are able to precisely retrieve the trajectory
of the simulated air mass (all implicit processes parameterized in a mesoscale model
such as turbulence, convection, surface mixing, have been used to determine the evo-
lution of tracers). Figure 12 shows the obtained backtrajectories ending at various
altitudes (500 m, 1500 m, 2000 m, 3000 m and 5000 m) over Banizoumbou on 1 July20
2006, 07:00 UTC, before the MCS passage. Two distinct groups are clearly visible.
Group 1 is representative of air masses coming from Burkina-Faso that followed the
monsoon flux and stayed in the BL. An ascent from the surface occurred near Bani-
zoumbou. The monsoon flux mixed marine aerosols with continental pollution. Group
2 trajectories are characteristic of air masses originated from the Niger-Nigeria border25
(6.4◦E) and that followed the Harmattan flux. Trajectory altitudes at 3000 m and 5000 m
were stable during 8 h. Since the origin of the Harmattan flux is desert regions with few
anthropogenic influence, these air masses mainly transported dust particles.
10076

ACPD
8, 10057–10103, 2008
MCS impact on
aerosol
hygroscopicity
during AMMA
S. Crumeyrolle et al.
Title Page
Abstract Introduction
Conclusions References
Tables Figures
◭ ◮
◭ ◮
Back Close
Full Screen / Esc
Printer-friendly Version
Interactive Discussion
Prior to convective activity, these two air masses remained decoupled and estab-
lished two well marked layers over Banizoumbou. Therefore, over Banizoumbou the
upper layer was enriched by dust particles that are mostly hydrophobic, and in the
lower layer (monsoon flux) the particles were assumed to be hydrophilic due to the
mixing of marine and anthropogenic particles.5
Figure 13 shows the air mass backtrajectories ending over Banizoumbou at the same
altitudes as Fig. 12 on 2 July 2006, 07:00 UTC, 12 h after the MCS passage. The start
points of these backtrajectories were on 1 July 2006, 18:00 UTC and the MCS dissi-
pated at midnight over Burkina-Faso. The monsoon flux (group 1) and the Harmattan
flux (group 2) are, respectively, restored in the lower part of the BL and in the SAL.10
But a new group of air masses (group 3) appears between 1000 m and 2800 m from a
region located north of Banizoumbou where they have crossed the MCS a few hours
earlier (see Fig. 9). During the first 3 h, one of the air masses falls 4500 m, indicating
that the air mass follows the downdraft of the MCS. After the first 3 h, the altitude of the
group 3 air masses is stabilized in a layer where the airborne measurements indicated15
a decrease of CN concentration (see Fig. 5) and an increase of the CCN/CN ratio (see
Fig. 6).
5.5 MCS impact on aerosol dust distribution
Figure 14 is an horizontal view of the computed surface mass concentration of dust on
1 July at 19:00 UTC. This pattern was obtained by summing the three populations of20
particles emitted and transported by the model, and integrated over the whole domain
during the passage of the MCS. The area situated north of Niamey and Banizoum-
bou is characterized by high surface dust concentrations reaching 10 000µg m−3
and
5000µg m−3
, respectively. Chomette et al. (1999) used the infrared difference dust
index and the reanalysis from the ECMWF to determine the threshold wind speed for25
soil erosion in Sahelian-Saharan regions. In Niger, around Niamey, they found that
the wind speed must be higher than 6.5 m s−1
to generate emissions of dust particles.
In Fig. 10c, the average surface wind speed over the whole domain is less than this
10077

ACPD
8, 10057–10103, 2008
MCS impact on
aerosol
hygroscopicity
during AMMA
S. Crumeyrolle et al.
Title Page
Abstract Introduction
Conclusions References
Tables Figures
◭ ◮
◭ ◮
Back Close
Full Screen / Esc
Printer-friendly Version
Interactive Discussion
threshold of 6.5 m s−1
except around the MCS where a downdraft generates a gust front
with surface wind speed exceeding 15 m s−1
. These surface winds are largely strong
enough to move soil particles by saltation and generate high dust concentration in sur-
face as simulated by the model in front of the MCS. On the contrary, behind the MCS,
precipitation scavenges the particles and inhibits dust generation by increasing the soil5
moisture. Hence, the surface dust concentration decreases to about 500µg m−3
after
the passage of the MCS.
The backtrajectories of Fig. 13 showed that the air mass sampled by the aircraft
between 1000 m and 2800 m on 2 July, 12 h after the MCS passage, has crossed the
MCS in a region situated north of Banizoumbou. In order to better understand the10
processes in which aerosols could be involved during the convection that took place
north of Banizoumbou, a vertical cross section of the convective system is presented
on Fig. 15. This cross section corresponds to the horizontal trace shown on Fig. 14.
Figure 15a displays the vertical distribution of the cloud water mixing ratio (colored
areas) and the mixing ratio of rain (isolines).15
The simulation shows that the convective system was clearly mature with high
concentrations of liquid and ice water (2 g kg−1
at 5000 m and 4 g kg−1
at 16 000 m,
tropopause) and an important overshoot up to 18 000 m. The vertical wind speed
reached 20 m s−1
in the convective core. Under 5500 m, at altitudes sampled 12 h
latter by the aircraft, important precipitations occurred with a maximum of 3.4 g kg−1
at20
3700 m. The simulation also shows that evaporation is important, with a maximum of
60% of precipitation reaching the surface. Such precipitation generates intense surface
winds of 16 m s−1
at the base of the convective core, the gust front.
In addition, Fig. 15b gives the vertical dust mass concentration between the sur-
face and 4500 m along the same cross section. In the northern part of this cross25
section, the computed vertical profile is characterized by dust concentrations of about
500µg m−3
near the surface and 200µg m−3
between 600 and 3000 m. As shown
before, MesoNH simulates high dust concentrations reaching 5000µg m−3
in front of
the convective core, in a thin layer above the surface. An important fraction of this
10078

ACPD
8, 10057–10103, 2008
MCS impact on
aerosol
hygroscopicity
during AMMA
S. Crumeyrolle et al.
Title Page
Abstract Introduction
Conclusions References
Tables Figures
◭ ◮
◭ ◮
Back Close
Full Screen / Esc
Printer-friendly Version
Interactive Discussion
surface dust amount (500–1000µg m−3
) was lifted in the convective ascent. Where
precipitation occurred, the dust mass concentration decreases to 150µg m−3
. This im-
portant horizontal gradient of aerosol concentration between scavenged and dry zones
shows that an important mass of aerosols has been cloud-processed and evaporated
as explained by Tulet et al. (2008). Indeed, it is reasonable to assume that the internal5
circulation of the MCS can mix long range transported dust from the SAL (northern
part of the vertical cross section) with fresh dust generated by the MCS gust front and
soluble material contained in the monsoon flux of the boundary layer (see surface back-
trajectory of Sect. 5.4). This result is similar to the study of Levin et al. (1996) which
determined three conditions that involve cloud processing: particles in an aqueous10
phase, presence of soluble element, and evaporation of droplets. Cloud processing is
able to change the hygroscopicity of new particles by modifying their chemical compo-
sition (Meng and Seinfeld, 1994). Our results suggest that a cloud processing could
occur in this MCS event, given that all conditions were present. First, various types of
gas and particles provided by the monsoon flux are mixed in an aqueous environment15
with mineral dust produced by the MCS itself. The particles are then collected by cloud
drops that have originally been nucleated by soluble materials (like nitrates or sulfates)
brought by the monsoon flux. Upon evaporation (Fig. 15a), new aerosol particles hav-
ing an increased ability to act as CCN are formed in the SAL from mineral and soluble
compounds and left behind. Finally, the results of this simulation show that the African20
MCS’s create conditions which are highly favorable for cloud processing. Furthermore,
this process can explain the observations made in the SAL after the MCS passage
regarding the increase of the CCN/CN ratio and the chemical modification of aerosols
by coating of nitrate and other soluble material on coarse particles.
6 Conclusions25
This paper describes the increase of aerosol hygroscopicity by aqueous mixing in a
mesoscale convective system observed during the AMMA experiment by using a com-
10079

ACPD
8, 10057–10103, 2008
MCS impact on
aerosol
hygroscopicity
during AMMA
S. Crumeyrolle et al.
Title Page
Abstract Introduction
Conclusions References
Tables Figures
◭ ◮
◭ ◮
Back Close
Full Screen / Esc
Printer-friendly Version
Interactive Discussion
bination of airborne observations and simulation exercises. Airborne measurements of
aerosol characteristics were carried out 12 h before and 12 h after a mesoscale con-
vective system that passed over Banizoumbou, in Niger, on 2 July 2006 at 00:00 UTC.
The flight plans were the same in order to avoid differences in environmental condi-
tions. Observations were then explored using a mesoscale model simulation in order5
to explain the changes observed regarding aerosol properties.
Before the convection event, air mass backtrajectories show that two distinctive lay-
ers have been identified over Banizoumbou. In the BL (at low level), air masses came
from the monsoon flux. This layer is known to be associated with polluted gas and hy-
groscopic aerosols. Above the boundary layer, backtrajectories analyses show that the10
air masses came from the northeastern desert regions and contained mineral dust par-
ticles. Before the convection, both layers are disconnected and explain the difference in
the CCN/CN ratio observed. Indeed, dust particles in the SAL are mostly hydrophobic
while aerosols present in the BL are more hygroscopic.
After the convection event, a third intermediate layer located between about 100015
and 3000 m has been identified with air masses coming from a region north of Ban-
izoumbou. In this new layer, the CN concentration has decreased and a significant
increase by a factor of 4 of the CCN fraction is also observed during the post-MCS
period in comparison with the same ratio measured in the SAL before the convection.
Moreover, the results of the elemental composition analyses of individual particles col-20
lected in this layer after the MCS passage have shown a higher contribution of sulfate,
nitrate and chloride to the total aerosol (in internal and/or external mixing with mineral
dust), all of which being soluble and efficient CCN. On the other hand, in the BL, an
increasing of the volume concentration of coarse particles (mode centered on 2.59µm)
was also noted. In addition, the single particle analysis indicates a dominance of freshly25
emitted dust particles known to be rather hygroscopic. Thus, the CCN/CN ratio is kept
steady between the pre-MCS and post-MCS periods.
The simulation shows that this intermediate layer originates from a region where the
convective process generated an aqueous mixing of gas, aerosols within the monsoon
10080

ACPD
8, 10057–10103, 2008
MCS impact on
aerosol
hygroscopicity
during AMMA
S. Crumeyrolle et al.
Title Page
Abstract Introduction
Conclusions References
Tables Figures
◭ ◮
◭ ◮
Back Close
Full Screen / Esc
Printer-friendly Version
Interactive Discussion
flux, and mineral dust already present in the SAL or generated by the MCS gust front. In
agreement with Levin et al. (1996) and Meng and Seinfeld (1994), the simulation results
show that all conditions inside the MCS are highly favorable to a cloud processing.
Indeed, it is reasonable to assume that the MCS creates a soluble element coating
around dust particles that enhance their hygroscopic capacities.5
Finally, this study shows that convective systems can mix aerosols from different
origins and different layers in aqueous environment. Wet processes can modify ex-
ternally mixed aerosols into an internal mixing of particles for which the hygroscopic
characteristics increase. In addition, one peculiarity of the African MCS shown in this
study, is its capability to generate his own dust particles in the gust front and modify10
their physical and chemical properties in the atmosphere. This study also shows that a
realistic mesoscale modeling is a major tool to improve our knowledge on the complex
aerosol-cloud processes such as those observed during the AMMA campaign.
Acknowledgements. This work has been supported by the African monsoon multidisciplinary
analysis (AMMA) project. Based on a French initiative, AMMA was built by an international15
scientific group and is currently funded by a large number of agencies, especially from France,
UK, USA and Africa. The authors wish to thanks the SAFIRE (Service des Avions Francais
Instruments pour la Recherche en Environnement) for preparing and delivering the research
aircraft (ATR-42 and Falcon-20). The authors are grateful to A. Boone (CNRM) for the ISBA
scheme and C. Lac, I. Mallet for the Meso-NH assistance. Special Thanks to G. Roberts.20
10081

ACPD
8, 10057–10103, 2008
MCS impact on
aerosol
hygroscopicity
during AMMA
S. Crumeyrolle et al.
Title Page
Abstract Introduction
Conclusions References
Tables Figures
◭ ◮
◭ ◮
Back Close
Full Screen / Esc
Printer-friendly Version
Interactive Discussion
References
Alfaro, S. C. and Gomes, L.: Modeling mineral aerosol production by wind erosion: Emis-
sion intensities and aerosol size distributions in source areas, J. Geophys. Res., 106, D16,
18075–18084, 2001. 10071
Barthe, C., Molinie, G., and Pinty, J. P.: Description and first results of an explicit electrical5
scheme in a 3d cloud resolving model, Atmos. Res., 76, 1–4, 95–113, 2005. 10071
Bechtold, P., Bazile, E., Guichard, F., Mascart, P., and Richard, E.: A mass-flux convection
scheme for regional and global models, Quart. J. Roy. Meteor. Soc., 127, 869–886, 2001.
10071
Bougeault, P. and Lacarrere, P.: Parametrization of orography-induced turbulence in a meso-10
beta model, Mon. Wea. Rev., 117, 1872–1890, 1989. 10071
Boone, A. and deRosnay, P.: Towards the improved understanding of land-surface processes
and coupling with the atmosphere over west africa, iLEAPS Newletter, 3, 33–34, 2007. 10073
Carlson, T. N. and Prospero, J. M.: The large scale movements of saharan air outbreaks over
the northern equatorial atlantic, J. Appl. Meteorol., 11, 283–297, 1972. 1005915
Chaboureau, J.-P. and Pinty, J. P.: Validation of a cirrus parameterization with meteosat sec-
ond generation observations, Geophys. Res. Lett., 33, L03815, doi:10.1029/2005GL024725,
2006. 10073
Chomette, O., Legrand, M., and Marticorena, M.: Determination of the wind speed threshold for
the emission of desert dust using satellite remote sensing in the thermal infrared, J. Geophys.20
Res., 104, 31 207–31 215, 1999. 10077
Chin, M., Rood, R., Lin, S. J., Muller, J. F., and Thompson, A.: Atmospheric sulfur cycle sim-
ulated in the global model GOCARD: Model description and global properties, J. Geophys.
Res., 105, 24 671–24 687, 2000. 10071
Cohard, J. M. and Pinty, J. P.: A comprehensive two-moment warm microphysical bulk scheme,25
ii: 2d experiments with a non hysrostatic model, Q. J. Roy. Meteorol. Soc., 126, 1843–1859,
2000. 10071
Dentener, J. F., Carmichael, G. R., Zhang, Y., Lelieveld, J., and Crutzen, P. J.: Role of mineral
aerosol as a reactive surface in the global troposphere, J. Geophys. Res., 101, 22 869–
22 889, 1996. 1006930
ECMWF: IFS documentation. Technical report, ECMWF, ecmwf.int/research/ifsdocs/, 2004.
10072
10082

ACPD
8, 10057–10103, 2008
MCS impact on
aerosol
hygroscopicity
during AMMA
S. Crumeyrolle et al.
Title Page
Abstract Introduction
Conclusions References
Tables Figures
◭ ◮
◭ ◮
Back Close
Full Screen / Esc
Printer-friendly Version
Interactive Discussion
Fouquart, Y. and Bonnel, B.: Computation of solar heating of the Earth’s atmosphere: A new
parameterization, Beitr. Phys. Atmos., 53, 35–62, 1980. 10072
Gard, E. E., Kleeman, M. J., Gross, D. S., Hughes, L. S., Allen, J. O., Morrical, B. D., Fergen-
son, D. P., Dienes, T., Galli, M. E., Johnson, R. J., Cass, G. R., and Prather, K. A.: Direct
observation of heterogeneous chemistry in the atmosphere, Science, 279, 1184–1187, 1998.5
10069
Gheusi, F. and Stein, J.: Small-scale rainfall mechanisms for an idealized convective southerly
flow over the Alps, Quart. J. Roy. Meteor. Soc., 128A, 337–360, 2002. 10072, 10076
Grini, A., Tulet, P., and Gomes, L.: Dusty weather forecast using the mesonh atmospheric
model, J. Geophys. Res., 111, doi:10.1029/2005JD007007, 2006. 1007110
Isawa, Y. and Ono, A.: Nitron thin film method for detection of submicron nitrate particles and
its application to atmospheric aerosols, J. Meteorol. Soc. Japan, 57, 599–606, 1979. 10069
Joseph, J. H., Wiscombe, W. J., and Weinman, J. A.: The Delta-Eddington Approximation for
Radiative Flux Transfer, J. of Aer. Sci., 33, 2452–2459, 1976. 10072
Karyampudi, V. M., Palm, S. P., Reagen, J. A., Fang, H., Grant, W. B., Hoff, R. M., Moulin,15
C., Pierce, H. F., Torres, O., Browell, E. V., and Melfi, S. H.: Validation of the Saharan dust
plume conceptual model using lidar, Meteosat, and ECMWF data, B. Am. Meteorol. Soc.,
80, 1045–1075, 1999. 10059
Kohler, H.: Zur Thermodynamic der Kondensation an hygroskopischen Kernen und Bemerkun-
gen uber das Zusammenfliessen der Tropfen, Medd. Met. Hydr. Anst. Stockholm, 3, 8, 1926.20
10066
Lafore, J. P., Stein, J., Asencio, N., Bougeault, P., Ducrocq, V., Duron, J., Fischer, C., Hereil,
P., Mascart, P., Masson, V., Pinty, J. P., Redelsperger, J. L., Richard, E., and Vila-Guerau
de Arellano, J.: The Meso-NH Atmospheric Simulation System. Part I: adiabatic formulation
and control simulations, Scientific objectives and experimental design, Ann. Geophys., 16,25
90–109, http://mesonh.aero.obs-mip.fr/mesonh/, 1998. 10071
Levin, Z., Ganor, E., and Gladstein, V.: The effects of desert particles coated with sulfate on
rain formation in the eastern mediterranean, J. Appl. Meteor., 35, 1511–1523, 1996. 10059,
10069, 10070, 10079, 10081
Mamane, Y. and Pueschel, R. F.: A method for the detection of individual nitrate particles,30
Atmos. Environ., 14, 629–639, 1980. 10069
Mamane, Y. and Gottlieb, J.: Nitrate formation on sea-salt and mineral particle: a single particle
approach, Atmos. Environ., 26A, 1763–1769, 1992. 10062, 10069
10083

ACPD
8, 10057–10103, 2008
MCS impact on
aerosol
hygroscopicity
during AMMA
S. Crumeyrolle et al.
Title Page
Abstract Introduction
Conclusions References
Tables Figures
◭ ◮
◭ ◮
Back Close
Full Screen / Esc
Printer-friendly Version
Interactive Discussion
Marticorena, B. and Bergametti, G.: Modeling of the atmospheric dust cycle: 1. design of a soil
derived dust emission scheme, J. Geophys. Res., 100, 16 415–16 429, 1995. 10064, 10071
Masson, V.: A physically-based scheme for the urban energy balance in atmospheric models,
Boundary-Layer Meteorology, 94, 357–397, 2000. 10071
Masson, V., Champeaux, J. L., Chauvin, F., Meriguet, C., and Lacaze, R.: A global database5
of land surface parameters at 1-km resolution in meteorological and climate models, J. of
Climate, 16, 9, 1261–1282, 2003. 10072
Mathon, V., Laurent, H., and Lebel, T.: Mesoscale convective system rainfall in the sahel, J.
Appl. Meteorl., 41, 1081–1092, 2002. 10064
Matsuki A., Iwasaka, Y., Osada, K., Matsunaga, K., Kido, M., Inomata, Y., Trochkine, D., Nishita,10
C., Nezuka, T., Sakai, T., Zhang, D., and Kwon, S.-A.: Seasonal dependence of the long-
range transport and vertical distribution of free tropospheric aerosols over east asia: on the
basis of aircraft and lidar measurements and isentropic trajectory analysis, J. Geophys. Res.,
108, 8663–8675, 2003. 10062
Meng, Z. and Seinfeld, J. H.: On the source of submicrometer droplet mode of urban and15
regional aerosols, Aerosol Sci. and Tech., 20, 3, 253–265, 1994. 10079, 10081
Morcrette, J. J. and Fouquart, Y.: The overlapping of cloud layers in shortwave radiation pa-
rameterizations, J. of Aer. Sci., 43, 321–328, 1986. 10072
Murphy, D. M. and Thompson, D. S.: Chemical composition of single aerosol particles at Idaho
Hill negative ion measurements, J. Geophys. Res., 102, 6353–6368, 1997. 1006920
Noilhan, J. and Mahouf, J.: The isba land surface parametrisation scheme, Global Planet.
Change, 13, 145–159, 1996. 10071, 10073
Parker, D. J., Thorncroft, C. D., Burton, R. R., and Diongue-Niang, A.: Analysis of the African
easterly jet, using aircraft observations from the JET2000 experiment, Q. J. Roy. Meteorol.
Soc., 131, 1461–1482, 2005. 10059, 1006025
Pinty, J. P. and Jabouille, P.: A mixed-phase cloud parameterization for use in mesoscale non
hydrostatic model: simulations of a squall line and of orographic precipitations, Conference
of Cloud Physics, Everett, WA, USA, 217–220, 1998. 10071
Prospero, J. M. and Carlson, T. N.: Vertical and area distributions of Saharan dust over the
western equatorial North Atlantic Ocean, J. Geophys. Res., 77, 5255–5265, 1972. 1005930
Pruppacher, H. R. and Klett, J. D.: Microphysics of clouds and precipitation, D. Reidel publishing
company, 1978. 10071
Roberts, G. C., Andreae, M. O., Zhou, J., and Artaxo, P.: Cloud condensation nuclei in the
10084
ACPD
8, 10057–10103, 2008
MCS impact on
aerosol
hygroscopicity
during AMMA
S. Crumeyrolle et al.
Title Page
Abstract Introduction
Conclusions References
Tables Figures
◭ ◮
◭ ◮
Back Close
Full Screen / Esc
Printer-friendly Version
Interactive Discussion
Amazon Basin: Marine conditions over a continent?, Geophys. Res. Lett., 28(14), 2807–
2810, 2001. 10067
Seinfeld, J. H. and Pandis, S. N.: Atmospheric Chemistry and Physics, Wiley interscience pub,
1997. 10071
Seinfeld, J. H. and Pandis, S. N.: Atmospheric chemistry and physics, John Wiley, Hoboken,5
N.J., 1998. 10069
Snider, J. R. and Brenguier, J. L.: Cloud condensation nuclei and cloud droplet measurements
obtained during ace-2, Tellus, 52B, 828–842, 2000.
Suhre, K., Mari, C., Bates, T. S., Johnson, J. E., Rosset, R., Wang, Q., Bandy, A. R., Blake, D.
R., Businger, S., Eisels, F. K., Huebert, B. J., Kok, G. L., Mauldin III, R. L., Prevot, A. S. H.,10
Schillawski, R. D., Tanner, D. J., and Thornton, T. C.: Physico-chemical modeling of the first
aerosol characterization experiment (ace 1) lagrangian b, 1. a moving column approach, J.
Geophys. Res., 103, 16 433–16 455, 1998. 10071
Tost, H., Jockel, P., Kerkweg, A., Sander, R., and Lelieveld, J.: Technical note: A new compre-
hensive scavenging submodel for global atmospheric chemistry modelling, Atmos. Chem.15
Phys., 6, 565–574, 2006,
http://www.atmos-chem-phys.net/6/565/2006/. 10071
Tulet, P., Crassier, V., Solmon, F., Guedalia, D., and Rosset, R.: Description of the
mesoscale nonhydrostatic chemistry model and application to a transboundary pollution
episode between northern france and southern england, J. Geophys. Res., 108(D1), 4021,20
doi:10.1029/2000JD000301, 2003. 10071
Tulet, P., Crassier, V., Cousin, F., Shure, K., and Rosset, R.: Orilam, a three moment
lognormal aerosol scheme for mesoscale atmospheric model, on-line coupling into the
mesonh-c model and validation on the escompte campaign, J. Geophys. Res., 110, D18201,
doi:10.1029/2004JD005716, 2005. 1007125
Tulet, P., Crahan-Kaku, K., Crumeyrolle, S., and Gomes, L.: Mixing of dust aerosols into
mesoscale convective system. An examination of the relative importance of downdraft gen-
eration and removal scavenging processes observed during the AMMA field campaign, In-
ternational conference on cloud and precipitation, 2008. 10079
Villani, P., Picard, D., Marchand, N., and Laj, P.: Design and Validation of a 6-Volatility Tandem30
Differential Mobility Analyzer (VTDMA), Aerosol Sci. Technol., 41(10), 898–906, 2007. 10062
Yin, Y., Wurzler, S., Levin, Z., and Reisin, T. G.: Interactions of mineral dust particles and
clouds: Effects on precipitation and cloud optical properties, J. Geophys. Res., 107, 4724,
10085

ACPD
8, 10057–10103, 2008
MCS impact on
aerosol
hygroscopicity
during AMMA
S. Crumeyrolle et al.
Title Page
Abstract Introduction
Conclusions References
Tables Figures
◭ ◮
◭ ◮
Back Close
Full Screen / Esc
Printer-friendly Version
Interactive Discussion
doi:10.1029/2001JD001544, 2002. 10059
Zender, C. S., Bian, H., and Newman, D.: The mineral dust entrainment and deposition
(DEAD) model: Description and global dust distribution, J. Geophys. Res., 108(D14), 4416,
doi:10.1029/2002JD002775, dust.ess.uci.edu/dead/, 2003. 10071
Zhuang, H., Chan, C. K., Fang, M., and Wexler, A. S.: Size distributions of particulate sulfate,5
nitrate, and ammonium at a coastal site in Hong Kong, Atmos. Environ., 33(6), 843–853,
1999.
10069
10086

ACPD
8, 10057–10103, 2008
MCS impact on
aerosol
hygroscopicity
during AMMA
S. Crumeyrolle et al.
Title Page
Abstract Introduction
Conclusions References
Tables Figures
◭ ◮
◭ ◮
Back Close
Full Screen / Esc
Printer-friendly Version
Interactive Discussion
Table 1. Log-normal characteristics of the number spectra shown on Fig. 7a. C represents the
concentration of the particle mode (cm−3
), σ is the standard deviation and Dp is the median
diameter (nm).
Before the MCS passage After the MCS passage
Number distribution C (cm−3
) σ Dp (nm) C (cm−3
) σ Dp (nm)
Boundary layer
Mode1 822 1.6 70 641 1.8 60
Mode2 201 1.5 170 117 1.6 185
Mode3 8 2 500 9 2.0 615
Saharan air layer
Mode1 161 1.5 63 428 1.9 110
Mode2 360 1.6 140 42 1.3 190
Mode3 9 2 535 6 2.0 650
10087

ACPD
8, 10057–10103, 2008
MCS impact on
aerosol
hygroscopicity
during AMMA
S. Crumeyrolle et al.
Title Page
Abstract Introduction
Conclusions References
Tables Figures
◭ ◮
◭ ◮
Back Close
Full Screen / Esc
Printer-friendly Version
Interactive Discussion
Table 2. Log-normal characteristics of the volume spectra shown on Fig. 7b. C represents
the concentration of the particle mode (µm3
cm−3
), σ is the standard deviation and Dp is the
median diameter (nm).
Before the MCS passage After the MCS passage
Volume distribution C (µm3
cm−3
) σ Dp (nm) C (µm3
cm−3
) σ Dp (nm)
Boundary layer
Mode1 0.4 1.6 137 0.4 1.8 185
Mode2 1.3 1.5 305 1.1 1.6 365
Mode3 5 2 2120 9 2 2590
Saharan air layer
Mode1 0.05 1.5 102 0.2 1.3 250
Mode2 1.6 1.6 305 2 1.9 390
Mode3 6.1 2 2260 8 2 2730
10088

ACPD
8, 10057–10103, 2008
MCS impact on
aerosol
hygroscopicity
during AMMA
S. Crumeyrolle et al.
Title Page
Abstract Introduction
Conclusions References
Tables Figures
◭ ◮
◭ ◮
Back Close
Full Screen / Esc
Printer-friendly Version
Interactive Discussion
c)
d) 3200m
2550m
850m650m400m
Latit
ude
(°)
Longitude (°)
a)La
titud
e (°
)
Longitude (°)
b)2900m
2250m
1250m
850m
400m
Fig. 1. Horizontal and Vertical ATR-42 trajectories (a and b) on 1 July 2006, at 12:00 UTC and
(c and d) on 2 July 2006, at 12:00 UTC.
10089

ACPD
8, 10057–10103, 2008
MCS impact on
aerosol
hygroscopicity
during AMMA
S. Crumeyrolle et al.
Title Page
Abstract Introduction
Conclusions References
Tables Figures
◭ ◮
◭ ◮
Back Close
Full Screen / Esc
Printer-friendly Version
Interactive Discussion
15 m.s
Monsoon Flux
Harmattan Flux
−1
LYBIA
NIGER TCHAD
EGYPT
Fig. 2. ECMWF analysis of the height (m) of the geopotential at 850 hPa and wind direction at
850 hPa on 1 July 2006, at 12:00 UTC. The maximum vector corresponds to horizontal wind
speed of 12.6 m s−1
.
10090

ACPD
8, 10057–10103, 2008
MCS impact on
aerosol
hygroscopicity
during AMMA
S. Crumeyrolle et al.
Title Page
Abstract Introduction
Conclusions References
Tables Figures
◭ ◮
◭ ◮
Back Close
Full Screen / Esc
Printer-friendly Version
Interactive Discussion
of moist air
Advection
15 m.s−1
TCHAD
EGYPT
LYBIA
NIGER
Fig. 3. ECMWF analysis of the water vapor mixing ratio (g kg−1
) and wind direction at 850 hPa
on 1 July 2006, at 12:00 UTC. The maximum vector corresponds to horizontal wind speed of
12.6 m s−1
.
10091

ACPD
8, 10057–10103, 2008
MCS impact on
aerosol
hygroscopicity
during AMMA
S. Crumeyrolle et al.
Title Page
Abstract Introduction
Conclusions References
Tables Figures
◭ ◮
◭ ◮
Back Close
Full Screen / Esc
Printer-friendly Version
Interactive Discussion
a)
c)
b)
Fig. 4. MCS tracking images, (a) 1 July at 15:00 UTC, (b) 2 July at 00:00 UTC, (c) 2 July at
12:00 UTC. Source: aoc.amma-international.org/observation/mcstracking.
10092

ACPD
8, 10057–10103, 2008
MCS impact on
aerosol
hygroscopicity
during AMMA
S. Crumeyrolle et al.
Title Page
Abstract Introduction
Conclusions References
Tables Figures
◭ ◮
◭ ◮
Back Close
Full Screen / Esc
Printer-friendly Version
Interactive Discussion
0 500 1000 1500 2000 2500 30000
1000
2000
3000
4000
5000
6000
CN (part.cm−3)
Alti
tude
(m
)
Fig. 5. CN total concentration (line) and CCN0.6 concentration (dotted line) as a function of
altitude. Red color is for data collected on 1 July 2006, and blue one for those collected on 2
July 2006. The open symbols represent the data in the BL and solid ones represent the data in
the SAL. Horizontal bars correspond to the variability on average concentrations (±1σ).
10093

ACPD
8, 10057–10103, 2008
MCS impact on
aerosol
hygroscopicity
during AMMA
S. Crumeyrolle et al.
Title Page
Abstract Introduction
Conclusions References
Tables Figures
◭ ◮
◭ ◮
Back Close
Full Screen / Esc
Printer-friendly Version
Interactive Discussion
0 0.1 0.2 0.3 0.4 0.50
500
1000
1500
2000
2500
3000
3500
4000
4500
CCN0.6
/CN fraction
Alti
tude
(m
)
Fig. 6. CCN0.6/CN ratio as a function of altitude. Colors, symbols and horizontal bars are as in
Fig. 5.
10094

ACPD
8, 10057–10103, 2008
MCS impact on
aerosol
hygroscopicity
during AMMA
S. Crumeyrolle et al.
Title Page
Abstract Introduction
Conclusions References
Tables Figures
◭ ◮
◭ ◮
Back Close
Full Screen / Esc
Printer-friendly Version
Interactive Discussion
(a)
101
102
103
104
100
102
104
dN/d
logD
p (p
art.c
m−3 )
Diameter (nm)
PrePost
101
102
103
104
100
102
104
dN/d
logD
p (p
art.c
m−3 )
Diameter (nm)
PrePost
SAL
BL
(b)
102
103
104
100
101
Diameter (nm)
dV/d
logD
p (µ
m3 .cm
−3 )
PrePost
102
103
104
100
101
Diameter (nm)dV
/dlo
gDp
(µm3 .c
m−
3 )
PrePost
SAL
BL
Fig. 7. Average number-size distribution (a) and volume-size distribution (b) observed by the
SMPS and the OPS during 1 (red) and 2 (blue) July 2006, in the SAL (top) and in the BL
(bottom).
10095
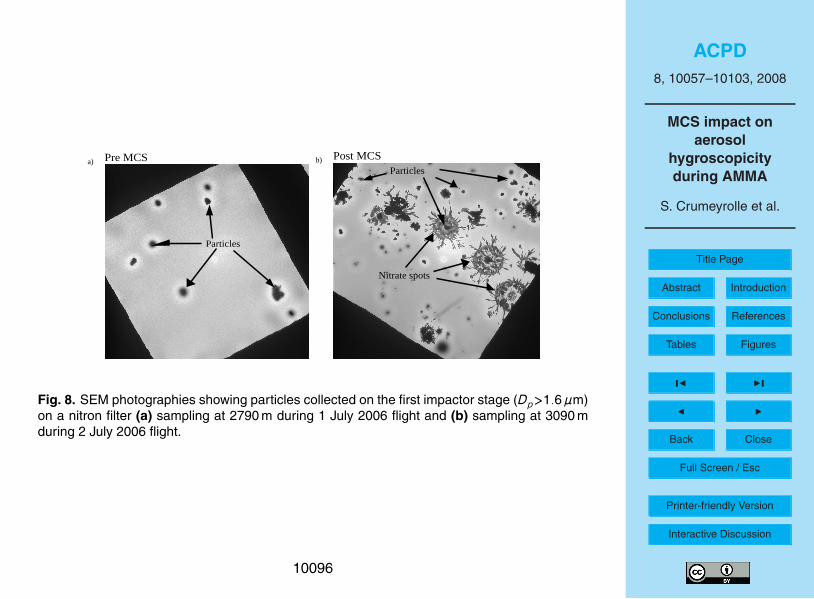
ACPD
8, 10057–10103, 2008
MCS impact on
aerosol
hygroscopicity
during AMMA
S. Crumeyrolle et al.
Title Page
Abstract Introduction
Conclusions References
Tables Figures
◭ ◮
◭ ◮
Back Close
Full Screen / Esc
Printer-friendly Version
Interactive Discussion
a)
Particles
Pre MCS bb)
Particles
Post MCS
Nitrate spots
Fig. 8. SEM photographies showing particles collected on the first impactor stage (Dp>1.6µm)
on a nitron filter (a) sampling at 2790 m during 1 July 2006 flight and (b) sampling at 3090 m
during 2 July 2006 flight.
10096

ACPD
8, 10057–10103, 2008
MCS impact on
aerosol
hygroscopicity
during AMMA
S. Crumeyrolle et al.
Title Page
Abstract Introduction
Conclusions References
Tables Figures
◭ ◮
◭ ◮
Back Close
Full Screen / Esc
Printer-friendly Version
Interactive Discussion
a)
BanizoumbouNiamey
b)
Fig. 9. Comparison between (a) observed satellite image on 2 July 2006, at 00:00 UTC (source:
aoc.amma-international.org/observation/mcstracking) and (b) modeled brightness temperature
on 1 July 2006 at 19:00 UTC. On (a) (resp. b), the crosses correspond to the MCS initialisation,
the black (yellow) lines correspond to the MCS trajectories and the black (yellow) triangles
correspond to the MCS disappearance.
10097

ACPD
8, 10057–10103, 2008
MCS impact on
aerosol
hygroscopicity
during AMMA
S. Crumeyrolle et al.
Title Page
Abstract Introduction
Conclusions References
Tables Figures
◭ ◮
◭ ◮
Back Close
Full Screen / Esc
Printer-friendly Version
Interactive Discussion
00:00 12:00 00:00 12:00290
295
300
305
310
315
Time (UT)
Tem
pera
ture
(K
)
00:00 12:00 00:00 12:00984
986
988
990
992
Time (UT)
Pre
ssur
e (h
Pa)
00:00 12:00 00:00 12:000
5
10
15
Time (UT)
Avg
. Win
d S
peed
(m
.s
−1 )
00:00 12:00 00:00 12:000
1
2
3
4
Time (UT)
Acc
umul
ated
Wat
er (
mm
)
a) b)
a) d)
Fig. 10. Modeled (red line) and observed (black line) parameters (a) Temperature (◦
K) (b)
Pressure (hPa) (c) Averaged wind speed (m s−1
) (d) Accumulated water (mm), from 1 July,
00:00 UTC to 2 July 18:00 UTC.
10098

ACPD
8, 10057–10103, 2008
MCS impact on
aerosol
hygroscopicity
during AMMA
S. Crumeyrolle et al.
Title Page
Abstract Introduction
Conclusions References
Tables Figures
◭ ◮
◭ ◮
Back Close
Full Screen / Esc
Printer-friendly Version
Interactive Discussion
(a)
0 20 40 60 80 1000
500
1000
1500
2000
2500
3000
3500
4000
4500
5000
Concentration (µg.m−3)
Alti
tude
(m
)
ATR−42Banizoumbou 07:00 UTCBanizoumbou 08:00 UTCBanizoumbou 09:00 UTCBanizoumbou 10:00 UTC
(b)
0 20 40 60 80 1000
500
1000
1500
2000
2500
3000
3500
4000
4500
5000
Concentration (µg.m−3)
Alti
tude
(m
)
BanizoumbouNorth BanizoumbouEast BanizoumbouSouth BanizoumbouWest Banizoumbou
Fig. 11. (a) Comparison of modeled (lines) and observed (dots) vertical profiles of aerosol
(Dp<2.5µm) mass concentration over Banizoumbou, on 2 July 2006, at 08:00 UTC (see text
for details). (b) Comparison of modeled vertical profile of the aerosol mass concentration over
Banizoumbou, 0.5◦
north of Banizoumbou, 0.5◦
south of Banizoumbou, 0.5◦
east of Banizoum-
bou and 0.5◦
west of Banizoumbou on 2 July 2006, at 08:00 UTC (12 h after the MCS passage).
10099

ACPD
8, 10057–10103, 2008
MCS impact on
aerosol
hygroscopicity
during AMMA
S. Crumeyrolle et al.
Title Page
Abstract Introduction
Conclusions References
Tables Figures
◭ ◮
◭ ◮
Back Close
Full Screen / Esc
Printer-friendly Version
Interactive Discussion
Longitude (°)
b)
Group1
Group2
a)
Latit
ude
(°)
Alti
tude
(m
)
Group2
Group1
Fig. 12. Backtrajectories ending over Banizoumbou on 1 July 2006, 07:00 UTC. Timestep: 1 h.
(a) Horizontal projection. (b) West-east vertical projection.
10100

ACPD
8, 10057–10103, 2008
MCS impact on
aerosol
hygroscopicity
during AMMA
S. Crumeyrolle et al.
Title Page
Abstract Introduction
Conclusions References
Tables Figures
◭ ◮
◭ ◮
Back Close
Full Screen / Esc
Printer-friendly Version
Interactive Discussion
b)Longitude (°)
Alti
tude
(m
)La
titud
e (°
)
a)
Group2Group3
Group1
Group2
Group1
Group3
Fig. 13. Backtrajectories ending over Banizoumbou on 2 July 2006, 07:00 UTC. Timestep: 1 h.
(a) Horizontal projection. (b) West-east vertical projection.
10101

ACPD
8, 10057–10103, 2008
MCS impact on
aerosol
hygroscopicity
during AMMA
S. Crumeyrolle et al.
Title Page
Abstract Introduction
Conclusions References
Tables Figures
◭ ◮
◭ ◮
Back Close
Full Screen / Esc
Printer-friendly Version
Interactive Discussion
Latit
ude
(°)
Longitude (°)
Fig. 14. Surface dust concentration (µg m−3
) on 1 July 2006, 19:00 UTC. Vectors correspond
to the surface wind speed. The maximum vector represents 16.2 m s−1
.
10102

ACPD
8, 10057–10103, 2008
MCS impact on
aerosol
hygroscopicity
during AMMA
S. Crumeyrolle et al.
Title Page
Abstract Introduction
Conclusions References
Tables Figures
◭ ◮
◭ ◮
Back Close
Full Screen / Esc
Printer-friendly Version
Interactive Discussion
a)
13.4°N 14.3°N
bb)
13.4°N 14.3°N
Fig. 15. Meridional cross section of the convective system (see location in Fig. 14) on 1 July
2006, 19:00 UTC. (a) Colored area represents the mixing ratio for cloud and ice (g kg−1
) and
the isoline corresponds to the mixing ratio for rain (g kg−1
). (b) Colored area represents the
dust concentration (µg m−3
) and the isoline corresponds to the mixing ratio for rain (g kg−1
).
Vertical scales are not the same.
10103