Embed Size (px)
Citation preview

Increase nursing time spent with patients: the holy grail.
A mixed method research evaluation in a live hospital environment
of a digital bedside nursing chart
Assistant Professor Kasia Bail Associate Professor Marian Currie and Professor Rachel Davey
Clinical Informatics Case Study: Acute Care TechnologiesHealth Data Analytics Conference
Brisbane 10 October 2017

Acknowledgements
• Traditional owners
• AusGov Dep of Innovation
• SmartWard
• Research team
• Clinical team

Evaluation team
• Assistant Professor Dr Kasia Bail
• A/Professor Dr Marian Currie
• A/Professor Penney Upton
• Professor Rachel Davey
• Professor Mari Botti, Deakin University, Melbourne
• A/Professor Bernice Redley, Deakin University, Melbourne
University of Canberra

This presentation
• Background– Efficiency opportunity
– Hospital data
– Care interactions
• Mixed Methods Study– Approach
– Findings
• Discussion and Recommendations– Clinical governance approaches
– Nursing minimum datasets

Efficiency opportunity:
• 48% bed days (complex older patients) AIHW 1997, 2013
• 27% hospital costs (nursing) Watts 2000, AIHW 2014
• 40% health costs (public hospitals) AIHW 2014
Need to: - Maximise use of secondary data for analysis of
nursing / care and decision making- Untapped area for efficiency investigation
(no matter how great our genomics R&D, people will still get sick and die, probably in hospital, with nurses)

• We know
– Up to 55 different comorbidities for every patient
– Their length of stay
– Any procedures during admission
• We don’t know
– Whether the patient is self caring and independent
– Or bed bound and nurse dependent
– What kinds of staff did what, or for how long
Untapped area for efficiency investigation. For example:
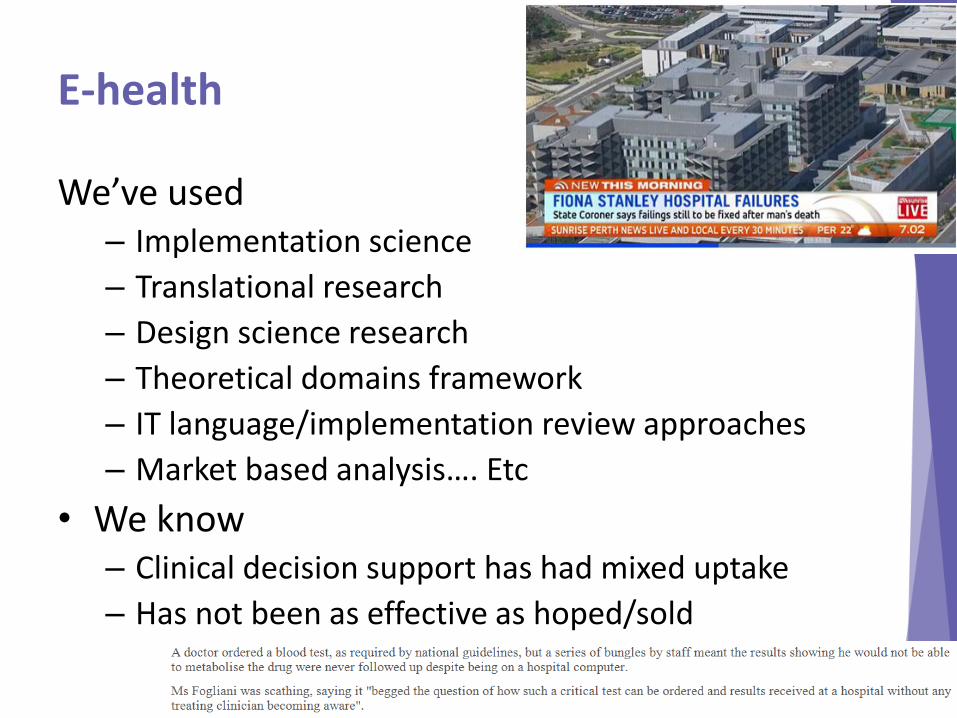
We’ve used– Implementation science
– Translational research
– Design science research
– Theoretical domains framework
– IT language/implementation review approaches
– Market based analysis…. Etc
• We know– Clinical decision support has had mixed uptake
– Has not been as effective as hoped/sold
E-health

Older patient complexity:
• 49-70% have 5+ comorbidities - Australian Bureau of
Statistics 2010
• 10.4% have dementia Bail 2015
• 30% have cognitive impairment Hickey 2007
• 90% need assistance for 1+ ADL Barnes 2012
• Functional variability ‘fit or sick old’ Parke 2010
©UNSW as represented by the DCRC-ABC (2011)

• People 65+ = 12% population, 30% admissions and
48% of bed days AIHW 2015
• 49% of 65-74, 70% of 85+ have 5+ comorbid’s ABS2010
• Decreased acute beds per population AIHW 2009, Sammut 2009
• Bed occupancy 90%+ Birch 2003, Forero 2008, Kuntz 2015, Sammut 2009
• LOS decreased, increased churn AIHW 2013, Duffield 2009
• Simple surgery goes to private or day Sammut 2009
• Lack of senior staff 75% of the week Garling 2008
• Increased casualisation Alameddine 2012, Greegan 2003
• Dilution of experienced nurses Garling 2008
©UNSW as represented by the DCRC-ABC (2011)
Hospital complexity:

Understanding nursing work
• Complete 72.3 tasks per hour
• Mean task length is 55 seconds
• Duration of 40% of nurses work is less than 10 secs
• Consider a different patient every 6 minutes
• Multitask 34% of the time
• Interrupted every 6 minutes (colleagues, patients)
• Interrupted every 60 minutes (work system failures
eg medications, orders, supplies)
• 55–98% leave at least one task undone
(Westbrook 2001, Ebright 2003, Tucker 2006, Kalisch 2010, Jones 2015)

Bedside nurses
Henderson 2016

Missed care in UK hospitals

Understanding the promise of EHR
• Consumer and carer directed, shared access• Continuity of care, through transitions• Communication: multidisciplinary and (?)
transboundary
• IF it collects as by product of care:– Contemporary documentation of care and decisions– Timely access to accurate information– Data for analysis of trends, preferences, outcomes– Financial reporting and accuracy?– Stores and consumables?
- > Releasing time to care

Canberra mixed methods study
• Located at patient bedside and central nurses stations
• Replace current paper nursing documents
• Support nursing care processes
– Plan, review and document patient care
– Communicate changes in delivery
– Flag unfinished tasks
– Easily accessible, real time, legible
– Available to whole multidisciplinary team

Implementation design
Overall Product Development
- 7 years of development of code generator with clinical and academic nurses
- 3 step clinical trials with Deakin Uni
- ‘point of care’ delivery and documentation and decision assist
Canberra Health development
- Multilevel stakeholder engagement
- Development with bedside clinicians
- Comprehensive and ongoing training, Champions, train the trainer
- 24 hour support, onsite

Research design
• Mixed methods evaluation
• Quasi-experimental pre-test/post-test design
• Ethnographic conceptual framework
• 3 month ‘trial of concept’ design
Qualitative data
- Focus groups
- Hallway interviews
Quantitative data
- Nurse Pedometer
- Time and motion observation
- Questionnaires
- Hospital data

Implementation
• 26-bed ward
• Bedside unit at all beds
• Multidirectional touch screen
• 11 of 55 commonly used nursing documentation tools trialled, ie– Observation/vital signs
– Nursing care plans
– Admission assessment
– Fluid balance chart
• Training for nursing, medical and allied health

Table 1. Summary of key data demographics
Participants / Data
PRE implementation (Sept 2016)
POST implementation (April 2017)*
Consents Patients 29 15
Nurses 27 17
Other staff 7 16
Total 61 48
Pedometers Nurse shifts 185 37
Surveys Patients (MISSCARE)^ 22 11
Nurses (BERNCA)^ 27 10
Nurses (User satisfaction) N/A 14
Focus groups Nurses N/A 2*
Hallway interviews
Patients N/A 20
Staff N/A 48
Time and Motion Nurses – all collected 91 58
With nights (excluded) 18 0
With long breaks (excluded) 5 8
Mornings 33 18
Evening 35 32
Total used 68 50
*All data from Post Deployment collected in April 2017, except the first focus group which was conducted in December 2016 following the false start in November
^MISSCARE = patient survey of missed care. BERNCA = nurse survey of missed care.
Time and Motion Sample. Data collection which resulted in more than 50% of the session being ‘nurse on break’ were excluded from analysis. Night duty was excluded from analysis as the pilot was suspended in the POST deployment phase prior to the night duty observations occurring.

Findings : 5 areas of influence

FindingsLocation of nurse activity Pre implementation mean Post implementation mean Change
Bedside 34% 36% + 2%
Nurse station 16% 21% + 5%
Bathroom 4% 1% +3%
Hallway 31% 28% -3%
Special rooms 11% 10% -1%
Other 5% 4% -1%
Cognitive restacking requirements
Pre implementation mean Post implementation mean Change
Multitasking minutes 55% 68% +13%
Interruption by colleagues (as a proportion of ‘hunting and gathering’).
34% 38% +3%
Nursing activity (as a proportion of all nursing time)
Pre implementation mean Post implementation mean Change
Direct patient care 34% 33% -1%
Indirect patient care 49% 48% -1%
Hunting and gathering 11% 12% +1%
System care 7% 8% +1%
Not statistically significant

Table 15. Comparison findings between nurse multitasking and interruptions
Previous literature Current data
Nurses multitask 34% of the time (Kalisch
and Aebersold, 2010)
Nurses multitask 54% of the time
Nurses consider a different patient every 6
minutes (Ebright et al., 2003)
Nurses consider a different patient every
3.5 minutes
Nurses are interrupted every 6 minutes
(colleagues, patients) (Kalisch and
Aebersold, 2010)
Nurses are interrupted 5% of their time by
patients and colleagues
Interrupted every 60 minutes (work
system failures eg medications, orders,
supplies) (Tucker and Spear, 2006)
Nurses are interrupted by system failures
1.4% of their time (averages at once an
hour)


Holy grail – releasing time to careTable 6. Category of nurse activity observed in the ‘time and motion study’Nursing activity (as a proportion of all nursing time)
Pre implementation mean
Post implementation mean
Change
Direct patient care 34% 33% -1%
Indirect patient care
49% 48% -1%
Hunting and gathering
11% 12% +1%
System care 7% 8% +1%


Holy grail – ‘releasing time to care’

Findings – the Canberra Experience
Implementation was (non-significantly) associated with:
• Decreased missed care by nurses
– patients reported 26% less missed care
– nurses reported 17% less missed care
• Nurses’ walking distances were also lower
– by 17% post implementation.

Qualitative themes
1. a positive potential of the digital bedside chart
2. evaluative suggestions on what aspects needed to be improved.
3. design fragmentation in the process of the implementation which created a product which was disruptive to clinical practice.
4. issue of pain and injury in nurses to do with ergonomic design combined with chosen software workflow design
5. unforeseen management decisions, where 30% of beds were closed by the Hospital, removing six of the eight trained technology ‘SuperUser’ nurses.

(this picture is usually for software design but also works for research in clinical settings…)

Extraneous variables
Table 1. Ward characteristics pre and post implementation periods
Baseline control
Pilot control
Baseline Pilot Change
Sep-15 Apr-15 Sep-16 Apr-17
Mean length of stay 8 9 8 5 -47%
Number of admitting doctors 31 31 37 38 23%
Number of admissions 82 93 119 122 31%
Urgent admissions 74% 70% 72% 80% 15%

Example 1 – nurse injury

Example 2 - rounding
When asked what would help the nurses to spend more time with their patients (one of the goals of the pilot), the nurse responded “do away with hourly roundings” FG2.
– Nurses described that if they didn’t need to document this time checking on patients, they could spend more time to actually listen to patients.
“And especially in the droplet precaution room, we can usually watch the patient from outside for hourly rounding purposes, but with the computer we have to gown up, gloves, mask, everything, go in the room; it's just a waste of time and energy, material, everything” FG1.
“And the hourly round is difficult to start with because, um, if you're doing a paper one you go and check your patient with the torch, especially during the night, you go and check them. If they're sleeping and they didn't ask you anything it takes five minutes to check your seven patients, but if you go and do everything, ……because we used to get the hourly rounding from the bedside, not at the nurses' station, so you have to go and do it there. By the time you get to your seven patients, 25 minutes is gone, so you're 25 minutes late to do your next round” FG1 .
“And next time, if you start from the other end, the same. When you get to the other end it's 25 minutes late again, because after you touch the computer screen the light is on, the patient will ask you something, then you get delayed for other things because you have to, you know, put your PIN number in and then you write what they asked for or what you have to enter by the time you finish seven of these……[you’re late again]“ FG1.
Would have been alleviated if automation of ‘rounding’ was done by computer when nurses were entering data in the patient room.

Table 1. Recommended actions in order of responsibility and priority
Responsibility No. Action Priority Difficulty
Shared Responsibility
(vendor and
health organisation)
a, d Maximise computer automation and ‘smart’ functions
High Medium
b, c,
Plan a pathway to include and integrate patient notes and medication charts, and minimise ‘hybrid’ soft and hardware systems of documentation
High High
I, j, k, l
Conduct comprehensive simulation software testing with experienced clinical bedside nurses, and pay them for their expertise
High Medium
h Provide swipe access Medium Low
Vendor Responsibility
(IT supplier)
e, f Improve ergonomic design High Medium
d Provide multiple documentation modes High Low
a, e Minimise scrolling and maximise user friendly design for varied and specific clinical work
High Medium
Customer responsibility
(Health
organisation)
h, c Review governance and policy related to nursing documentation practices
High High
I, k Provide employees who can communicate and understand clinical nursing and IT languages
High Medium
l, i Provide administration and other workload support to clinicians
High Medium
j, k Have effective pathways for clinician communication and support
Medium Medium
m Keep trial environment as stable as possible Medium Medium

If we want system implementation, we need good data
• If we want good data
– We need to understand clinical work flow• Clinician work flow vs Governance work flow
– Need to anticipate/understand the conflict
E-Health will highlight what are currently invisible problems:
• Errors of omission -> errors of commission
• Implicit rationing of care -> explicit rationing

Make implicit rationing explicit
• Need data
Need data

• We know
– Up to 55 different comorbidities for every patient
– Their length of stay
– Any procedures during admission
• We don’t know
– Whether the patient is self caring and independent
– Or bed bound and nurse dependent
– What kinds of staff did what, or for how long
Untapped area for efficiency investigation. For example:

Implementing e-health factors (Ross 2016):Reviewing the study against the evidence
• Innovation (evidence, source, advantage, adaptability, trial-ability, complexity,
quality, packaging, cost)
• Outer setting (patient needs, peer pressure, external incentives/policy)
• Inner setting (structure, networks, communication, culture, tension, compatibility,
priority, readiness, incentives, learning climate, leadership, resources, information access)
• Characteristics of individuals (knowledge, belief, self-efficacy, stage)
• Process (planning, engaging, champions, stakeholders)
• Executing
• Reflecting and evaluating

Implementing e-health factors (Ross 2016)
• Innovation (evidence, source, advantage, adaptability, trial-ability, complexity,
quality, packaging, cost)
• Outer setting (patient needs, peer pressure, external incentives/policy)
• Inner setting (structure, networks, communication, culture, tension, compatibility,
priority, readiness, incentives, learning climate, leadership, resources, information access)
• Characteristics of individuals (knowledge, belief, self-efficacy, stage)
• Process (planning, engaging, champions, stakeholders)
• Executing
• Reflecting and evaluating

Nurse as conduit

“Clinical governance”:
• Over-reliance on documentation as a solution to the many complex challenges facing health care and service provision (Francis, 2013, Garling, 2008, Jackson 2011).
• The organisational response to achieve auditing and checklists is logical in a managerial sense
BUT • There is increasing recognition that policies, audit tools
and compliance checklists – provide ‘illusions of assurance’, – but are rather a form of ‘documentation hysteria’ (Jackson,
2011),– described as ‘the regulatory beast that must be fed’
(Darbyshire, 2008).– sets the scene for risk as a negative and to be avoided
• can be contrary to patient-focussed care (Clancy and Happell, 2017).

Death by (electronic) paperwork?
• Data should a byproduct of care
– Otherwise it’s just digital polyFORMacy• Allen 2017
• We need to get skilled in FORMocology
– What is essential and
non-essential
documentation? • Redley 2017

• Photo of documentation
• Photo of patient in need

Nurse to patient contact:Not just ‘nice to have’
• 4 complications cost $225 million (NSW, 1 yr)(4 times MRSA) (just for over 50s)– Urinary tract infections– Pneumonia– Pressure injuries– Delirium
• Associated with nurse care rationing– Communication– Mobilisation– Hydration, nutrition– Hygiene, skin care

Current dominating factors :
• New public management
– Market based business units
• Economic rationalism
– Relies on being about to count the costs
• Disease model of health
– We actually want more than just the absence of disease
• Activity based funding
– It’s not efficient if you don’t know what quality
(or sustainability) you’ve actually paid for

• North American Nursing Diagnosis Association Taxonomy (NANDA)
• Visiting Nurses Association of Omaha (OMAHA system)• Home Health Care Classification (HHCC)• Outcome and Assessment Information Set (OASIS)• Nursing Interventions Classification (NIC)• Nursing Outcomes Classification (NOC)• Systematised Nomenclature of Medicine (SNOMED) and
nursing terms• International Classification of Nursing Practice (ICNP)
‘If we cannot name it, we cannot control it, finance it, teach it, research it, or put it into public policy’. (Clark & Lang 1992, p.109)
Nursing Classification Systems

THE GREY TSUNAMI
• 48% bed days (complex older patients) AIHW 1997, 2013
• 27% hospital costs (nursing) Watts 2000, AIHW 2014
• 40% health costs (public hospitals) AIHW 2014

What next?
• Please email for further information: [email protected]
- Determine quality:- Structure indicators- Process indicators - Outcome indicatorsCollect data on all- Measure costs- Identify efficiencies