Embed Size (px)
Citation preview

Incorporating Traffic Operations into Demand Forecasting Model
Daniel Ghile, Stephen Gardner
22nd international EMME Users’ Conference, PortlandSeptember 15 -16, 2011

Presentation Outline
1. Background
2. Conventional (regional) Model
3. Sub-area Model
4. Operational Elements
5. Model Result Comparison
6. Model of Off-Street Parking Lots
7. Volume Calibration and validation
8. Applications
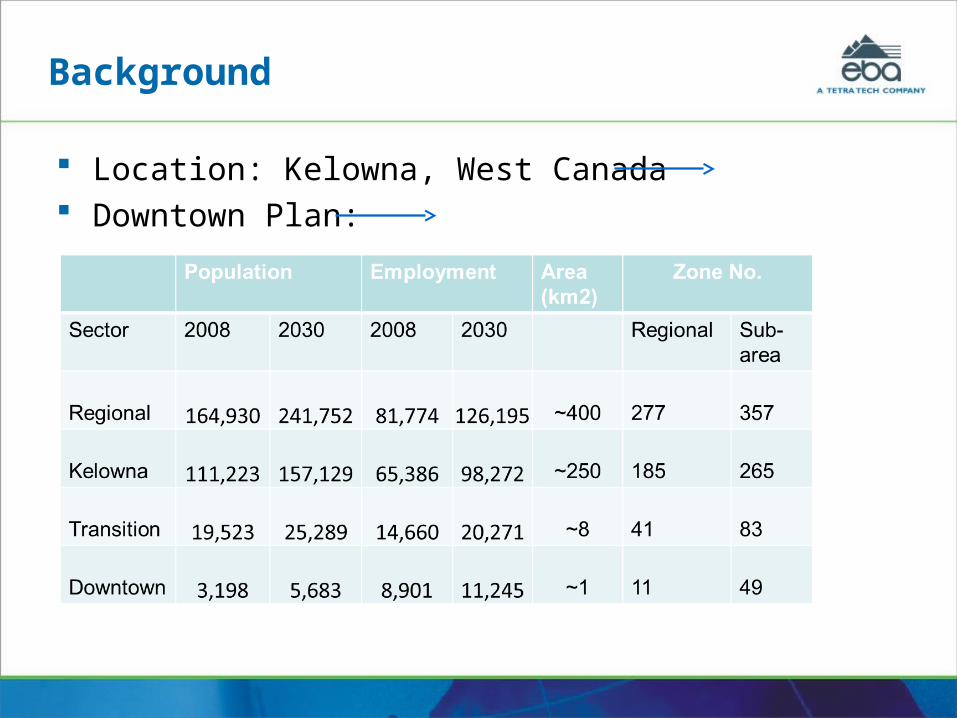
Background
Location: Kelowna, West Canada Downtown Plan:

Background
Objective: Assess implications of transportation and land use changes on traffic operations in the downtown core;
Approaches applied to assess the detailed traffic operational analysis– Sub-area demand model using EMME
– A micro simulations model focused on network impacts
– Intersection Capacity analysis using synchro
– The focus is on the Sub-area travel demand model

Regional Model
Study area: covers City of Kelowna, West Kelowna, Lake Country and Peachland
Calibration: 2008 fall/spring traffic conditions Link-based capacity approach Drawbacks/limitations
– Coarse Zone system and network in the downtown area
– Calibration limited to link volumes at screen lines
– Off-street parking lots not treated as ‘special zones’

Sub-area Model
Uses the regional model as a base Detailed zone system and network in the downtown area Transition area: provides a transition between the detailed zone
system in downtown and the coarse regional zone system Turn capacity based on Highway Capacity Manual (HCM)
operational methodology Traffic assigned to off-street parking lots Detail Intersection coding
Operational Elements –Model attributes
Model Procedures:
– Regional model approach applied to trip generation, distribution and mode split calibration
– Traffic assignment uses fixed demand generalized cost multi-class assignment with class specific volumes
– Travel time is key input to trip distribution and assignment and consists of :
» Link travel time
» Delay

Operational Elements-Travel time
Link Travel time:
– Modified Bureau of Public Roads (BPR) equation applied in both Regional and Sub-area models
– Adjustment factor applied to capture difference in link capacity for various road classes (0.8 to 1.1)
Intersection Delay:
– Key component of travel time in congested network
– Volume and capacity are key inputs to delay
– Proper representation of turn capacity is required to realistically capture delay at intersections

Operational Elements- Capacity
Regional Model Capacity:
– Link based capacity
– Drawbacks» Approach capacity is insensitive to conflicting volumes
» All stop controlled approaches have fixed capacity (400 veh/h)
» Exclusive left turns have fixed capacity (200 veh/h)
» Right and left turns are assumed to have the same capacity
» Signal phasing and timing are not taken into account
Sub-area Model Capacity:
– HCM operational methodology approach applied to estimate capacities at signalized and unsignalized intersections
– Dynamic adjustment of capacities based on projected volumes

Operational Elements- Signalized inter.
Signalized intersection Capacity:
– Approaches disaggregated to lane groups
– Saturation flow rate estimated as per HCM guideline
– Assumptions made on lane width, grade, percentage of heavy vehicles, bus, parking and pedestrian activities
– Right turn and left turn adjustment factors estimated based on HCM equations
– Left turn adjustment factor is very complicated
– Five cases considered to estimate left turn adjustment factor

Operational Elements- left turn factor
Left turn adjustment factor for permitted phase:
– HCM approach applied
– Adjustment facto for the lane from which permitted left turn are made is estimated by:
--Eq.1
– Adjustment facto for the lane group from which permitted left turn are made is estimated by:
--Eq2
PL =proportion of left turn traffic in shared lane, EL1= through car- equivalent for permitted left turn, N =number of lanes
– Parameters used in Eq. 1 and 2
11
1*0.0*0.1*
1LL
ufqf
m EPg
g
g
gg
g
gf

Operational Elements- Sample Input and outputs, Capacity comparison Turn Capacity Equations EMME turn attributes Operational input and output attributes for a sample signalized
intersection Capacity Comparison – Signalized intersection

Operational Elements-Capacity Comparison

Operational Elements- Unsignalized int.
Unsignalized intersection Capacity:
– Opposing Volumes, critical gap, follow-up time ,base capacity estimated as per HCM approach
– Capacity adjusted by impedance factor
– Operational input and output attributes for a sample unsignalized intersection
– Capacity Comparison – Unsignalized intersection

Operational Elements- Unsignalized int.

Off-street Parking lot Modeling
Parking lots defined as special zones Base year volume established based on parking spaces,
observed parking occupancy, and parking duration A procedure was developed that assigns auto trips to
parking lots Volume deducted from regular zones to account for the
volume allocated to parking lots Volume deduction is proportional to the trip generation of
the zones and inversely proportional to the travel impedance between the parking lot and the adjacent zone

Link Volume Deviation

Link Volume Deviation
Up to 20 screen lines defined within downtown core Up to 92% of the link volumes fall within the acceptable
deviations Key link volumes all within the acceptable limits

Goodness of fit test
Coefficient of determination (R2)- 0.91 Slope between model and observed volumes – almost
1.0 The coefficients show good relationship between the
model and observed volumes

Intersection Turn Volumes
Turn volumes compared at key intersections along Highway 97
Most major turn movements replicate actual observed volumes
Model Application
Produce O-D input to micro simulation model Test alternative packages of road/transit network
improvements; Evaluate the transportation impact of various land use
scenarios; Evaluate alternative transportation demand management
(TDM) strategies

Summary of Findings
Demonstrated capability to replicate HCM turn capacities; Potential applications include
– Sub-area model, – Local intersection improvements – Projection of turn capacities at major intersections
Limitations include– Intensive coding and error prone– Application is limited to short term operations– Detail input required for new or changed traffic control– All vehicles are served irrespective of capacity


![Basic First Aid Emme [Autosaved]](https://img.dokumen.tips/doc/110x75/554b2cc0b4c905ce088b4c2d/basic-first-aid-emme-autosaved.jpg)


