Embed Size (px)
Citation preview

Incorporating Reality Into Process Simulation
Nathan MasseyChemstations, Inc.January 10, 2002

1. Data Accuracy and Comprehensiveness• Physical Properties• Phase Properties (BIP’s)• Chemical Properties
2. Equilibrium Models• Phase (VLE, LLE, SLE)• Chemical Reaction (Gibbs or Emperical)
3. Rate Models• Reaction• Mass Transfer• Heat Transfer• Momentum Transfer (pressure drops)
Levels of Reality in Process Simulation

4. Mechanical Considerations• Pump and Compressor performance curves• Valve Geometry• Solids UnitOps
5. Time Dependence• Holdups• Transients inputs and fluctuations• Signal delays• Control response
Levels of Reality in Process Simulation

EquipmentSizing
& Rating
Steady StateProcess
Simulation
Plant Optimization
TrainingSimulators
ReactorDesign
DynamicProcess
Simulation
Historically,

Over time these gaps began to close:
i. Faster computers
ii. Better software technology
iii. Improved numerical techniques
iv. Better engineering models
v. Cumulative effort
Historically,

Historically,

Now simulations can be more realistic:
Mass transfer
Heat transfer
Pressure drops Prime mover performance curves

Now simulations can be more realistic:
Dynamic considerations
Control systems
Simulation of changes
Holdups

Azeotropic Distillation Example:

Residue Map for EtOH-H2O-nC5 System
0
0.1
0.2
0.3
0.4
0.5
0.6
0.7
0.8
0.9
1
0 0.1 0.2 0.3 0.4 0.5 0.6 0.7 0.8 0.9 1
mole fraction water
mol
e fra
ctio
n Et
OH
From this map we can verify our thermodynamic model.
Miscible/immiscible Azeotropecomposition, mole%
Azeotropetemperature, F
Ethanol-water Miscible 90.4 .v. 90.8 EtOH 172.8 .v. 173.1Ethanol-npentane Miscible 92.4 .v. 92.2 nC5 93.7 .v. 95.5npentane-water Immiscible 94.6 .v. 94.6 nC5 94.3 .v. 93.8Ethanol-water-npentane immiscible 4.4,6.1,89.5 .v.
4.9,5.4,89.792.1 .v. 93.2
Residue Curve Map for Azeotropic System

Preliminary Material Balance prepared from Residue Map

14 “ideal stages required
Sensitivity analysis using equilibrium stages:

Mass Transfer in Distillation Calculations
The Early History of Distillation Calculations
1. Concept of equilibrium stage introduced by Sorel in 1893.
2. McCabe-Thiele diagrams for number of theoretical stages in 1925
3. Lewis-Matheson and Thiele-Geddes methods for rigorous (tray-by-tray) multicomponent distillation in 1930’s. Not generally used until the appearance of computers in the 1950’s.

Mass Transfer in Distillation Calculations (cont.)
In all of these methods the departure from thermodynamic equilibrium is accounted for by using empirical factors:
(i) stages efficiencies for trays
(ii) HETP for packing
Trays: Stage efficiencies can vary -∞ to +∞. Vary with component, stage, conditions, etc.
Packing: HETP varies not only with size and type of packing, but also from one component to another and strongly from point to point in a column to another.
These phenomena are especially true for non-ideal mixtures, operating at extreme conditions.

Mass Transfer in Distillation Calculations (cont.)
The rate based approach:
1. Is more complex.
2. Has shorter application history.
3. Is completely predictive (based on component physical properties and BIPs), so avoids stage efficiencies and HETP.
4. Is at least as accurate as the equilibrium method.
5. Is the only method which can guarantee the accuracy of simulations involving simultaneous mass transfer and chemical reactions.
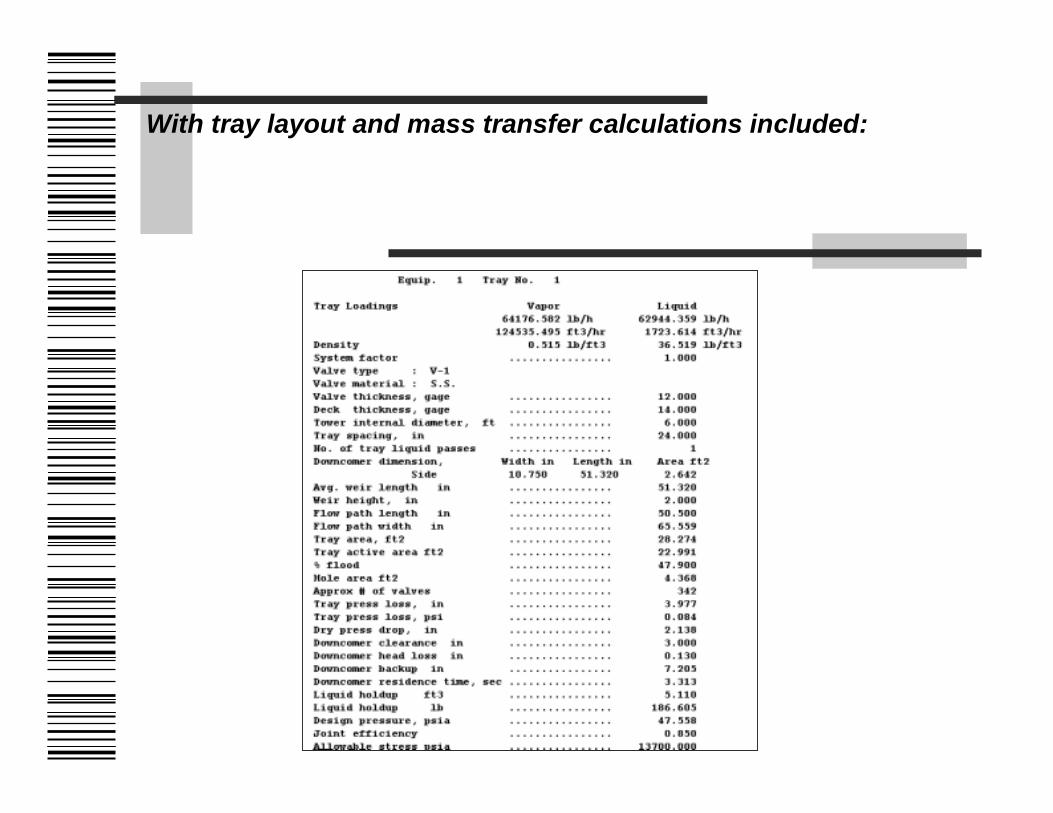
With tray layout and mass transfer calculations included:

With “real” stages, 18 stages required
Sensitivity analysis using mass transfer (rate based) method:

Temperature profiles under “ideal” and “real” conditions:
Mass transfer profile
Ideal stages profile

Heat transfer:
In conventional simulations, heat exchangers are simulated by making two types of specifications:
• Thermodynamic specs – T,Q,VF,…
• “Rating” specs – U*A (used frequently in dynamics)
This approach will not account for changing conditions which affect:
• film coefficients
• pressure drops
• varying outlet temperatures
• possible unexpected phase changes
Rigorous rating is done after the simulation.

Heat transfer:

Heat transfer:

Heat transfer:
Process side outlet temperature

Dynamic Simulation
Pressure control
Upset condition
Effect of cooling water temperature change

Dynamic Simulation
Effect of cooling water temperature change

Dynamic Simulation
Effect of cooling water temperature change

Dynamic Simulation
Effect of cooling water temperature change

Effect of feed change on column pressure control:

Response to feed impurities:

Equipment Which Can Be Included:
•••• Distillation
•••• Reactors (CSTR’s, PFR’s special models)
•••• Heat Exchangers
•••• Prime movers = pumps, compressors, etc.
•••• Pipes
•••• Valves
•••• Vessels and Tanks
•••• PID Controllers

So What?

Number of stages
Effect of temperature changes on LLE
Required operating range of pump
Benefits of “reality” simulations:

Some final notes

Mass Transfer in Distillation Calculations (cont.)
TWO TYPES OF METHODS:
1) Methods of the first type begin with the mass and heat balances of an differential element of the packing or of the two-phase layer on the plate.
2) The other group of methods of simulation for multicomponentseparation is the non-equilibrium stage model pioneered by Krishnamurty and Taylor.
Both types of methods give basically the same results. At present, the latter model is the more accepted approach.

Mass Transfer in Distillation Calculations (cont.)
In this presentation some examples of experimentally verified rated based distillations are presented. The chosen test systems cover a range of components which exhibiting various degrees of differences in chemical structure and in the binary diffusivities and/or enthalpies of vaporization.
• Ethanol/water/n-pentane
• Ethane/Ethylene
• Formaldehyde/water/methanol
• HCl/water/air


Temperature profiles
-55
-50
-45
-40
-35
-30
0 10 20 30 40 50 60 70 80 90
Tray number
Temperature
T-theoretical
T-eff.-AIChE
T-AIChE
T-Chan and Fair
T-Zuiderweg

Formaldehyde/Water/Methanol:

Formaldehyde/Water/Methanol:
0
10
20
30
40
50
60
70
80
2 2.5 3 3.5 4
MT model CH2O, ppmEquilibrium CH2O ppm
Toxicity data:
ORL-RAT LD50 100 mg/kg
SKN-RBT LD50 270 mg/kg

HCl Scrubbing:

HCl Scrubbing:
Note temperature ranges

Mass Transfer in Distillation Calculations (cont.)
The rate-based approach is recommended for modeling of the following operations:
• Packed columns
• Mixtures which exhibit strongly non-ideal behavior
• Reactive distillation
• Any column with profiles of rapidly changing slope

Thank You …
End