Embed Size (px)
Citation preview


Prioritized investmentResilienceInclusive growth
ON TO 2050 guiding principles

Economic disconnection

Equity elements
Using benefits to disadvantaged users as a criterion in project scoring (up to 10% of total score)
No match requirement for lower capacity local governments
Funding for preliminary engineering for lower capacity local governments

Elements that might work against equityPoints awarded for higher local financial commitment
Points awarded for project readiness

Does scoring for inclusive growth change the mix of projects selected?
Does scoring for financial commitments and project readiness reduce equity?
Does eliminating local match and offering PE funding encourage project submissions by lower-capacity local governments?
What did we evaluate?


Distribution of equity scoring

Does inclusive growth scoring change our results?If inclusive growth points were NOT considered
5 projects worth $19.2 m would likely shift out of the program
2 projects worth $18.9 m would likely shift in
21% reduction in number of nonwhite project users under poverty level

Are other scoring elements working against equity?Financial commitments points not included?
No change in number of non-White project users under poverty level
Project readiness points not included?
No change in number of non-White project users under poverty level

Evaluating inclusive growth scoring by geography?% of funding requested for projects in EDAs 24%
% of funding awarded to projects in EDAs 27%
Including equity resulted in $7.6m increase in funding to projects in economically disconnected areas (EDAs)
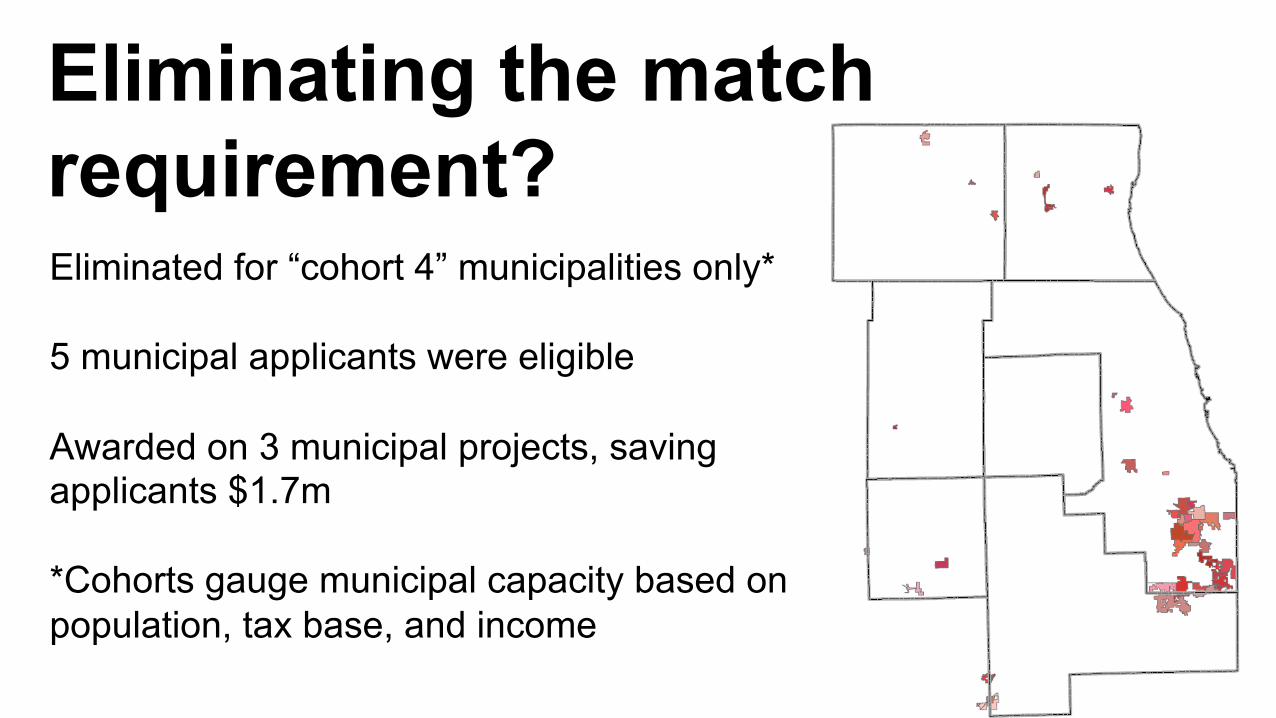
Eliminated for “cohort 4” municipalities only*
5 municipal applicants were eligible
Awarded on 3 municipal projects, saving applicants $1.7m
*Cohorts gauge municipal capacity based on population, tax base, and income
Eliminating the match requirement?

For Cohort 4 municipalities only
Sought by 4 applicants
Awarded for 3 applicants
Offering funding for preliminary engineering?
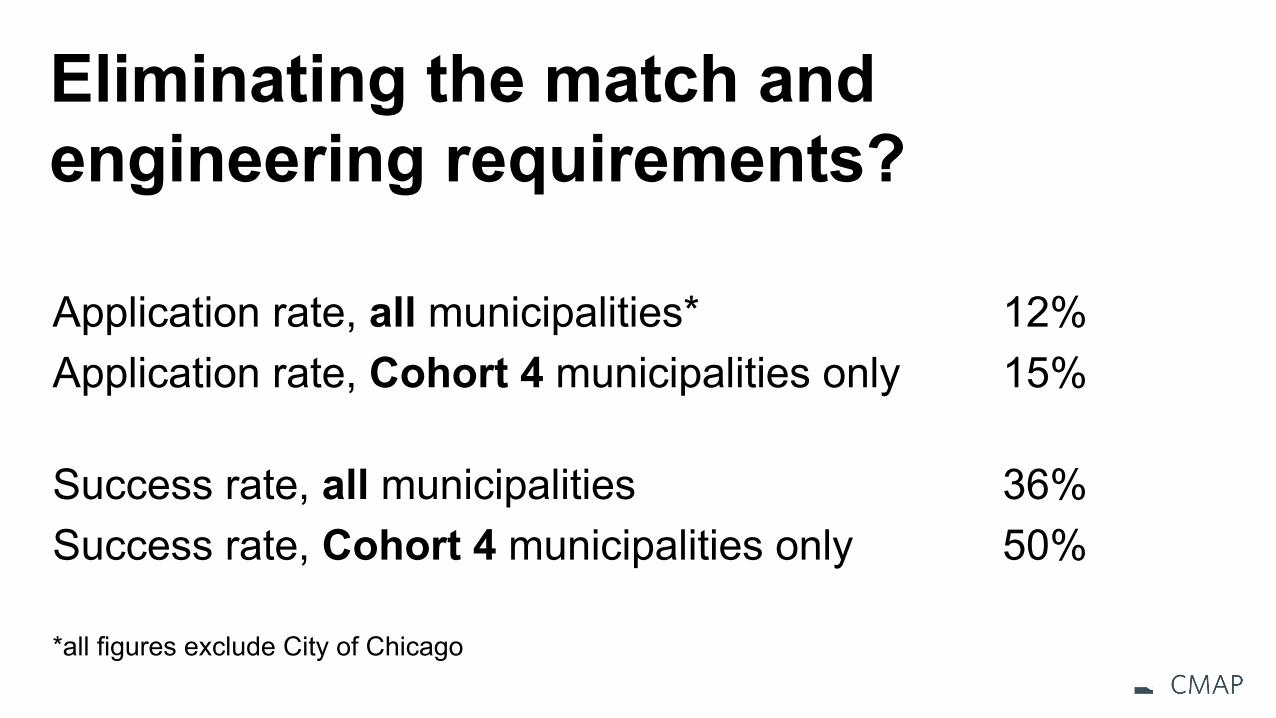
Eliminating the match and engineering requirements?
Application rate, all municipalities* 12%Application rate, Cohort 4 municipalities only 15%
Success rate, all municipalities 36%Success rate, Cohort 4 municipalities only 50%
*all figures exclude City of Chicago

Conclusions?Did scoring for inclusive growth change the mix of projects programmed?
Yes, to a moderate degree
Did scoring for financial commitments and project readiness work against inclusive growth?
No
Does eliminating local match and offering PE funding encourage lower-capacity local governments to submit projects?
Appears to have a positive effect

Explore ON TO 2050 at www.cmap.illinois.gov/2050
Read the CMAP Weekly Updateat www.cmap.illinois.gov/updates
Follow CMAP on Twitter (@onto2050), Facebook (search “CMAP”), and Instagram (@onto2050