Embed Size (px)
Citation preview

1
Income Statement Fraud and Balance Sheet Fraud: Different Manipulations, Different Incentives
Robert H. Davidson
McDonough School of Business, Georgetown University
January, 2016
Abstract
I find managers commit income statement fraud (fraud in which manipulations increase net income) when market price sensitivity to earnings news is high and their firms’ stock price is relatively more sensitive to idiosyncratic earnings performance. Managers commit balance sheet fraud (fraud in which manipulations increase net assets but do not affect net income) when market-wide default risk is high and their firms have greater financial constraints. The results hold in samples of fraud firms derived from SEC enforcements, class action lawsuits, and a subsample in which fraud was detected internally or by employee whistleblowers. Contact Information: Phone: 1-773-263-3076 Email: [email protected] Address: 480 Rafik B. Hariri Building, McDonough School of Business Georgetown University 37th and O Streets NW, Washington DC, 20057 Internet Appendix: rhdavidson.com/research Keywords: Financial statement fraud, macroeconomics, incentives, SEC, regulation. JEL Classification Codes: G30; G34; G38; G39
I thank Bill Baber, Ray Ball, Ryan Ball, Mark Bradshaw, Jon Karpoff, Christian Leuz, Michael Minnis, Zoe-Vonna Palmrose, Abbie Smith, and participants in seminars at Georgetown University, the University of Chicago, Florida International University, Purdue University, The University of Illinois at Urbana-Champaign, and The University of Texas at Dallas.

2
1. INTRODUCTION
Stakeholders provide managers with incentives to increase earnings, maintain a healthy balance
sheet with strong capital and liquidity ratios, maintain the ability to access the capital markets, and have
strong operating cash flows to fund current operations. Such incentives include compensation (Antle and
Smith 1986) and tenure (Martin and McConnell 1991). Incentives to deliver strong performance also
create incentives to manipulate financial statements (Benmelech, Kandel, and Veronesi 2010). Managers
can commit financial statement fraud by intentionally misreporting any combination of individual
transactions in response to these incentives.
Income statement and balance sheet information is used by numerous agents for numerous
purposes. A manager can have strong incentives to improve one financial statement while having
relatively weaker incentives to improve the other. For example, survey evidence from Graham, Harvey,
and Rajgopal (2005) indicates that managers would be willing to sacrifice long term value by delaying
projects or decreasing discretionary spending to meet a quarterly earnings target. A manager can commit
income statement fraud (defined as fraud which increases net income and does not involve material
manipulations unrelated to net income) in response to incentives to deliver strong earnings1. Conversely,
if the manager wishes to issue debt to finance capital expenditures then having a strong balance sheet
with regards to current debt obligations, the firm’s debt to equity ratio, and other ratios indicative of the
long run ability to service the debt could be more important than short term quarterly earnings
performance. A manager can commit balance sheet fraud (defined as fraud which increases net assets but
does not involve material manipulations related to net income) in response to incentives for a strong
balance sheet.
1 An example is recording fictitious revenues. Though the balance sheet is also affected by this entry (most likely by an increase in accounts receivable) the effect on the balance sheet is directly related to the manipulation of revenue.

3
Collectively, prior research argues fraud is a response to environmental pressures (Ball 2009)
more likely to occur in firms with certain idiosyncratic characteristics, such as firms with weak corporate
governance or a need to raise capital. Analytical research predicts more managers commit fraud during
relatively strong economic periods2, while empirical research finds mixed results on the relations between
fraud and a firm’s financial constraints, need for capital, and prior financial performance. Research has
not considered that environmental pressures to commit income statement or balance sheet fraud are
different and might vary independently or that different idiosyncratic characteristics are associated with
income statement and balance sheet fraud.
I find more managers begin to commit income statement fraud in periods of high market price
sensitivity to earnings news and that these firms’ stock prices were relatively more sensitive to earnings
performance. These relations have greater statistical significance than those for balance sheet fraud.
Conversely, I find that more managers begin to commit balance sheet fraud in periods with higher default
risk and that these firms had greater financial constraints. These relations have greater statistical
significance than those for income statement fraud.
Having found evidence that managers commit income statement and balance sheet fraud in
response to different environmental pressures, I then analyze how associations between fraud, regardless
of type, and firm-level price sensitivity to earnings news and financial constraints vary through time.
Frauds that began between 1992 and 2000 are positively and significantly associated with firms’ price
sensitivity to earnings news however frauds beginning prior to 1992 and after 2000 are not. 60 percent of
all income statement frauds occur during this between 1992 and 2000, while only 40 percent occurs in the
remaining 16 years of the sample. Conversely, only 34 percent of balance sheet frauds occur during this
period. Further, the association between fraud and firms’ financial constraints is positive and significant
in the periods 1986-1991 and 2001-2010 but not significant from 1992 through 2000.
2 See Hertzberg (2005), Povel, Singh, and Winton (2007), and Strobl (2013) for examples.
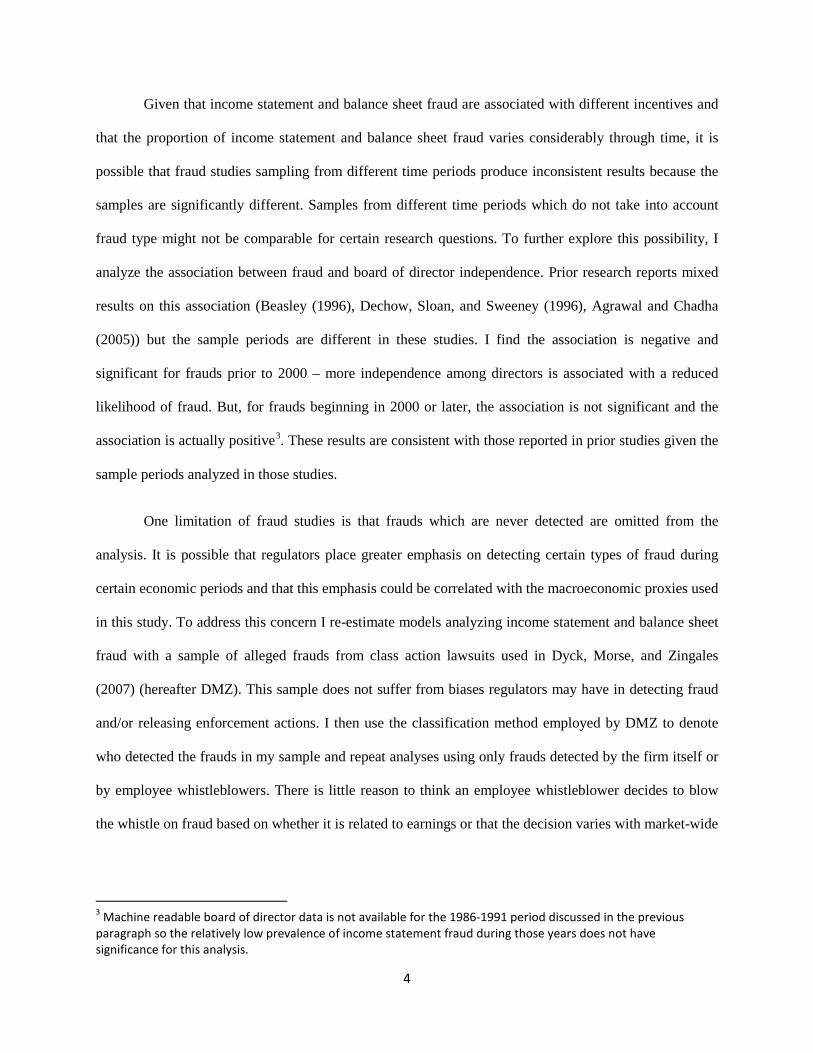
4
Given that income statement and balance sheet fraud are associated with different incentives and
that the proportion of income statement and balance sheet fraud varies considerably through time, it is
possible that fraud studies sampling from different time periods produce inconsistent results because the
samples are significantly different. Samples from different time periods which do not take into account
fraud type might not be comparable for certain research questions. To further explore this possibility, I
analyze the association between fraud and board of director independence. Prior research reports mixed
results on this association (Beasley (1996), Dechow, Sloan, and Sweeney (1996), Agrawal and Chadha
(2005)) but the sample periods are different in these studies. I find the association is negative and
significant for frauds prior to 2000 – more independence among directors is associated with a reduced
likelihood of fraud. But, for frauds beginning in 2000 or later, the association is not significant and the
association is actually positive3. These results are consistent with those reported in prior studies given the
sample periods analyzed in those studies.
One limitation of fraud studies is that frauds which are never detected are omitted from the
analysis. It is possible that regulators place greater emphasis on detecting certain types of fraud during
certain economic periods and that this emphasis could be correlated with the macroeconomic proxies used
in this study. To address this concern I re-estimate models analyzing income statement and balance sheet
fraud with a sample of alleged frauds from class action lawsuits used in Dyck, Morse, and Zingales
(2007) (hereafter DMZ). This sample does not suffer from biases regulators may have in detecting fraud
and/or releasing enforcement actions. I then use the classification method employed by DMZ to denote
who detected the frauds in my sample and repeat analyses using only frauds detected by the firm itself or
by employee whistleblowers. There is little reason to think an employee whistleblower decides to blow
the whistle on fraud based on whether it is related to earnings or that the decision varies with market-wide
3 Machine readable board of director data is not available for the 1986-1991 period discussed in the previous paragraph so the relatively low prevalence of income statement fraud during those years does not have significance for this analysis.

5
default rates. These analyses should mitigate, though not eliminate concerns about correlated omitted
variables.
This paper contributes to the literature in several ways. First, it is the first paper (of which I am
aware) which documents that managers manipulate the income statement and balance sheet in response to
different incentives and at different times. This highlights that all frauds are not homogenous and that
researchers should consider the economic theories they are testing and how they relate to different types
of manipulations when creating samples for empirical tests. Further, regulators and auditors should
perhaps focus on certain types of fraud and firm-level attributes during certain periods. Second, this is the
first empirical paper which documents how fraud varies with macroeconomic forces, specifically market
price sensitivity to earnings news and market-wide default risk, when controlling for idiosyncratic
incentives. Market forces create incentives for managers to misreport incremental to those at the firm
level. Third, this is the first paper that documents how the association between fraud and firm-level
determinants varies through time; researchers can find different results depending on what period the
sample is drawn from. Finally, it provides a novel explanation for inconsistent results reported in the
literature on the relation between financial statement fraud and board independence, opening the
possibility that other prior results are dependent upon the time period from which the fraud sample is
drawn.
2. HYPOTHESIS DEVELOPMENT
Prior analytical and empirical research provides evidence that both market and idiosyncratic forces
create incentives for managers to commit financial statement fraud (hereafter fraud). While this research
does not investigate whether different incentives are associated with income statement fraud (hereafter IS)
or balance sheet fraud (hereafter BS), some proposed theories are more likely related to earnings, while
others less likely.
2.1 Income Statement Fraud

6
Several studies find evidence that more managers commit fraud during relatively strong economic
periods; much of this research is centered on earnings manipulations and maintaining strong stock price
performance. When discussing reasons for the wave of corporate scandals in the late 1990s, Ball (2009)
argues that high growth is built into performance expectations during a boom period and that managers
therefore are pressured to deliver strong earnings growth4. When, inevitably, firms experience declining
performance relative to their own expectations and/or their peers, the managers of these firms find
themselves unable to meet their heightened expectations. Such managers have particularly strong
incentives to meet earnings expectations. Survey evidence from Graham, Harvey, and Rajgopal (2005)
indicates that managers manipulate earnings to maintain or increase their firm’s stock price. Dechow, Ge,
Larson, and Sloan (2011) find evidence that fraud firms have strong prior stock price performance. That
accounting frauds happen after a sustained run of strong market performance by firms with strong prior
performance is consistent with Jensen’s (2005) theory of overvalued equity.
Benmelech, Kandel, and Veronesi (2010) show that while incentive-based compensation induces
managers to exert costly effort, it also creates incentives to conceal bad news about future growth options.
They note that fraudulent reporting is one possible response to poor performance in periods where price
sensitivity to earnings news is high. The price response to earnings news is not constant through time and
the incentives to report positive earnings news are stronger in periods where the price response is larger,
ceteris paribus.
Collectively, prior research provides evidence that market and idiosyncratic forces can create
incentives for managers to manipulate earnings but are silent about motives to manipulate the balance
sheet (independent of the residual effect of the earnings manipulations). They predict more managers
manipulate earnings when price sensitivity to earnings is highest. This prediction has never been tested
specifically against known cases of IS fraud separate from BS fraud. The prior research provides the
theoretical motivation for my first set of hypotheses:
4 Galbraith (1961) makes a similar case for the events leading up to the 1929 market crash.

7
Hypothesis 1A:
Managers commit income statement fraud when market price sensitivity to earnings news is high.
Hypothesis 1B:
Firms where income statement fraud occurs have relatively high price sensitivity to earnings news.
2.2 Balance Sheet Fraud
The income statement and balance sheet are used by different agents for different purposes. For
example, Watts (2003) notes the prevalence of the balance sheet’s use in contracting. Common covenants
written into debt contracts include restrictions against issuing more debt, requiring a minimum level of
working capital, and placing limits on certain ratios such as interest coverage and debt-to-equity. When
analyzing developments in credit risk management, Altman and Saunders (1997) cite the extensive use of
the balance sheet in credit risk assessment. Bernanke and Gertler (1989) develop a model of the business
cycle where higher net assets reduce the agency costs of financing real capital investments. In their
model, the balance sheet is more important in periods of high financial distress. Many of the incentives
for managers to maintain a strong balance sheet relate to financial constraints, credit risk, or bankruptcy
risk and the strength of these incentives varies through time.
The need for external financing is one hypothesized determinant of fraud. Both Efendi, Srivastava,
and Swanson (2007) and Richardson, Tuna, and Wu (2003) find that managers commit fraud because of a
need to raise external financing, yet Beneish (1999) finds no evidence of this. One potential issue is that
most prior research analyzes small samples of fraud over brief time periods. The type of frauds committed
and the economic environment can differ across studies. Also, these studies do not consider the role of
macroeconomic forces or whether different types of fraud are more likely related to capital constraints. It
is easier for firms to raise capital, and do so on favorable terms, during strong economic periods and it is
easier for firms with strong prior performance to raise capital. Therefore, firms that might otherwise be
constrained by their balance sheet profile (i.e. firms with high levels of debt or firms nearing covenant
violations) have less incentive to commit fraud in response to financial constraints during strong

8
economic periods, given the relative ease of raising capital. Such firms are also less likely to have strong
prior performance given their weak balance sheet. The macro and microeconomic conditions that create
incentives to manipulate earnings differ from those that create incentives to improve net assets, avoid
covenant violations, and ease access to external financing.
Prior research on the role of the balance sheet and on the hypothesized association between fraud and
firms’ financial constraints lead to my second set of hypotheses:
Hypothesis 2A:
Managers commit balance sheet fraud during periods with greater market-wide default risk.
Hypothesis 2B:
Firms where balance sheet fraud occurs have relatively severe financial constraints.
2.3 Effect of Treating Frauds as Homogenous
Prior research does not distinguish between IS and BS fraud. Most of these studies analyze small
samples over brief time periods. The results of these studies are often mixed. For example, Beasley
(1996) finds that fraud is decreasing in board independence while Agrawal and Chadha (2005) find no
such relation. Beasley (1996) analyses frauds from 1980-1991 while Agrawal and Chadha (2005) analyze
violations from 2000-2001. Dechow, Sloan, and Sweeney (1996) find a positive association between
fraud and a desire for low cost financing with a sample of 92 fraud firms while Beneish (1999) finds no
such evidence in a sample of 64 fraud firms. Figure 1 lists the sample sizes of 17 prior papers on financial
statement manipulation. Half have fewer than 60 fraud firms and only two have more than 100 fraud
firms5. Given that only 50 percent of frauds detected and enforced by the SEC represent earnings
manipulations alone (and only 20 percent net assets alone) the inconsistent results in prior research could
be caused, in part, by significantly different proportions of IS and BS fraud in the respective samples.
5 A number of papers look at earnings restatements and have larger samples. Restatement studies often produce results inconsistent with fraud studies.

9
Figure 2 lists the sample periods of 15 prior studies on financial statement manipulation6. Of the 15
papers listed, ten have samples within the years 1996 through 2002. Further, seven of the papers have a
sample period which covers five years or less.
If macro incentives associated with IS fraud are not associated with BS fraud (and vice versa) i.e.
the aggregate composition of fraud type varies through time, then these studies could be analyzing
significantly different samples with different fraud type compositions. Studies with larger samples over a
greater number of years might fail to document associations that are significant for one type of fraud but
insignificant for another type because IS and BS fraud are committed for different reasons. Broadly,
treating all frauds as the same event can lead to inconsistent, inaccurate, and incomplete results.
Analyzing all frauds using the same specification but over different time periods and finding different
results provides evidence of the importance of incorporating fraud type into research design. It also
documents the pitfalls that accompany small sample analyses over brief time periods; when the
composition of the sample changes the results can change as well.
3. SAMPLE, DATA, AND SUMMARY STATISTICS
3.1 Sample and Data
I use SEC Accounting and Auditing Enforcement Releases (AAERs) as a proxy for fraud. These
releases summarize investigations the SEC brings against the agents of firms for violations of SEC and
federal rules. To collect my sample, I read AAERs 84 – 3638 which were released between January 15,
1986 and February 13, 2015. I only include firms for which the following can be determined: whether the
firm’s financial statements were materially misstated; whether the manipulation was related to the income
statement or balance sheet (or both); and the year the violation began7. I exclude AAERs related to
6 These papers represent a subset of fraud research and several study manipulations not deemed fraudulent. Several papers studying fraud do not specify the specific years that sample observations occur and so are not listed. 7 The Internet Appendix includes two AAERs; one was issued for IS fraud and the other for BS fraud. These examples document the accuracy with which these three pieces of information can be collected.

10
income or asset understatement.8 My hypotheses pertain to frauds where the primary motivation was to
improve the current period income statement or balance sheet.
AAERs offer several advantages relative to other proxies for fraud. First, it is clear whether the
managers of firms in the AAER sample actually committed fraud. I am specifically interested in
violations of Section 13(a) and Section 13(b)(2)(A) of the Securities Exchange Act of 1934. AAERs
provide the year (and exact date in some cases) the fraud began. Finally, over 90 percent of AAERs
related to accounting fraud provide clear information regarding whether the income statement or the
balance sheet was manipulated.
That said, AAERs have limitations. AAERs only document frauds that are detected9 and
ultimately enforced. This is a potential concern if detection and enforcement of IS and BS fraud vary
independently through time. However, this would change the nature of the detection/enforcement
environments several years (in most cases) after the fraud began so it is not clear how this would
influence market conditions or firm-level incentives when the fraud began. If the SEC begins to place
increased emphasis on income related fraud in 2003, that cannot influence whether the frauds they detect
began in 2000, 2001, or any other year. Still, to address this concern I analyze two additional samples of
fraud firms.
First, I use a sample of alleged frauds from class action lawsuits used in DMZ. This sample is
unrelated to regulators’ enforcement decisions and therefore will not suffer from such potential bias in the
AAER sample. There is little reason reason to expect the decision to bring a class action lawsuit will be
related to the state of the economy or firm-level incentives which were in place several years before the
lawsuit was even filed. Further, there is no evidence that the decision to bring a class action lawsuit
should vary with whether the fraud was related to the income statement or balance sheet and in a way
8 There are 5 AAER firms with frauds related to earnings/asset understatement with all required data. This could be because fewer managers have incentives to commit this type of fraud or because the SEC has weaker incentives to prosecute such violations. 9 This is true for all ex post measures of fraud.

11
correlated with the macro and micro incentives I analyze in this study, particularly given that these
lawsuits are often filed well before detailed evidence of fraud is even discovered. Where possible, I
classify their sample as IS or BS fraud using the same process used for AAERs. Some class action
lawsuits are clearly unrelated to financial statement fraud and are excluded from the analysis10. After
removing cases unrelated to fraud I am left with a sample of 90 cases from 1995-2003.
Second, I analyze a sample of AAER firms for which the fraud was detected by management or
employee whistleblowers. DMZ note that regulators rarely detect fraud themselves. There is little reason
to think a whistleblower’s decision to come forward varies inter-temporally on whether the fraud was
related to the income statement or balance sheet. Following the process employed in DMZ, I categorize
the initial source of information related to the fraud and note whether this source is part of the
management of the firm or an employee whistleblower. DMZ find that 104 out of 230 (45%) cases are
first brought to light by internal governance or employee whistleblowers. In my sample I find that 50% of
IS and BS frauds are first detected by internal governance or employee whistleblowers.
Another concern related to AAERs is whether they accurately categorize IS and BS fraud. Some
AAERs provide great detail regarding the specific accounts and dollar amounts manipulated and the exact
dates manipulations took place, while many others do not approach this level of detail. Categorization
based on the exact accounts and amounts manipulated is quite difficult but nearly every AAER (over 90
percent) provides enough information to determine whether net income was manipulated and whether
manipulations unrelated to net income took place. Further, while the SEC may place emphasis on certain
types of fraud during certain periods, there is little reason to think it would be so negligent in its
investigation to fail to detect material income manipulations in periods when it is more concerned about
balance sheet manipulations or that it would choose not to disclose significant manipulations in the
AAER. Therefore, the categorization of fraud type employed in this study should not suffer from noise or
10 For example, Service Corporation International faced a class action lawsuit due to desecration of gravesites and for leaving dug up corpses in the woods.

12
bias due to variation in the level of detail provided in AAERs. Results using the DMZ sample should also
reduce concerns about categorization of fraud type that are unique to AAERs, but potentially have their
own categorization concerns. I exclude the firm from my analyses in cases of ambiguity. Table 1
documents the composition of the samples used to test my hypotheses. Of the 459 frauds with
CRSP/Compustat identifiers about half are IS frauds and about 20 percent are BS frauds (with 30 percent
affecting both financial statements through independent manipulations).
I distinguish failure years (the first year fraud began) using these indicator variables: IS equals
one the first year income statement fraud begins; zero otherwise. BS equals one the first year balance
sheet fraud begins; zero otherwise. FRAUD equals one the first year fraud of any kind begins; zero
otherwise.
I calculate PE MKT, the value weighted annual market price-earnings ratio as a proxy for market
price sensitivity to earnings news11. The objective is to succinctly capture how sensitive the market was to
earnings over the course of the year. I also estimate a firm-specific price sensitivity to earnings measure,
EARN SEN, computed as the annual percentile rank of the firm’s price-earnings ratio12:
I calculate DEFAULT RISK as the difference between the long-term BAA corporate bond rate
and the 10 year Treasury bill rate to proxy for market-wide annual default risk13. Prior research uses
11 Results hold when calculating an equal weighted price-earnings ratio. Value weighting should reduce concerns about the measure being unduly influenced by smaller firms with large variances in earnings sensitivity. Nevertheless, I re-estimate models calculating PE MKT excluding firms with less than $100 million in market capitalization and find the results hold. 12 I use the percentile rank to address problems arising from negative price-earnings ratios. Negative PE ratios have no interpretive value and also create a computational problem because when holding price constant firms with small losses have more negative (lower) PE ratios than firms with large losses. When earnings are positive the opposite is true. I correct for this when calculating the percentile rank. Additionally, I use price scaled by sales as an alternative proxy and use the firm’s actual PE ratio and exclude firms with losses and find that the results are unchanged. 13 In robustness analysis I employ a separate measure to consider credit supply in the economy. Specifically, TIGHTNESS uses the Federal Reserve Board’s quarterly Senior Loan Officer Opinion Survey on Bank Lending Practices and takes a value of 1 in years where tightness is in the top quartile of the distribution; 0 otherwise (Bushman, Williams, and Wittenberg-Moerman 2015). This measure is not available until the second quarter of 1990 and therefore cannot be used for the first 5 years of the sample. Given the similarity in results using both measures, I report results using DEFAULT RISK to maximize the sample size.

13
various measures for firm-specific financial constraints and/or need for capital. I use the measure
developed by Kaplan and Zingales (1997) which is shown in numerous settings to consistently capture
overall financial constraints14. Following Baker, Stein, and Wurgler (2003) I construct the five variable
KZ financial constraint measure for each firm/year as the following linear combination:
𝐾𝐾𝐾𝐾𝑖𝑖,𝑡𝑡 = −1.002𝐶𝐶𝐶𝐶𝑖𝑖,𝑡𝑡𝐴𝐴𝑖𝑖,𝑡𝑡−1
− 39.368𝐷𝐷𝑖𝑖,𝑡𝑡𝐴𝐴𝑖𝑖,𝑡𝑡−1
− 1.315𝐶𝐶𝑖𝑖,𝑡𝑡𝐴𝐴𝑖𝑖,𝑡𝑡−1
+ 3.139𝐵𝐵𝑖𝑖,𝑡𝑡 + 0.283𝑄𝑄𝑖𝑖,𝑡𝑡, (1)
where 𝐶𝐶𝐶𝐶𝑖𝑖𝑡𝑡/𝐴𝐴𝑖𝑖,𝑡𝑡−1 is cash flow over prior year (t-1) assets; 𝐷𝐷𝑖𝑖,𝑡𝑡/𝐴𝐴𝑖𝑖,𝑡𝑡−1 is cash dividends over prior year
assets; 𝐶𝐶𝑖𝑖,𝑡𝑡/𝐴𝐴𝑖𝑖,𝑡𝑡−1 is cash balances over prior year assets; 𝐵𝐵𝑖𝑖,𝑡𝑡 is total debt divided by the sum of total debt
and book equity measured at year-end, and Tobin’s Q (𝑄𝑄𝑖𝑖,𝑡𝑡) is the market value of equity (price times
shares outstanding) plus assets minus the book value of equity, all divided by assets.
3.2 Summary Statistics
Table 2, Panel A describes the macro variables and micro variables for fraud firms and non-fraud
firms15. Fraud firms differ significantly from non-fraud firms on potentially important dimensions. Fraud
firms have greater earnings sensitivity (EARN SEN), are more financially constrained (KZ), have larger
abnormal returns (AB RET), are larger (SIZE), have a higher return on assets (ROA), and are more likely
to have a recent initial public offering (IPO). The statistics suggest that fraud firms are either quite large
(based on size) or quite young (based on IPOs). IS and BS fraud firm characteristics also differ. Table 2,
Panel A documents that IS fraud firms have greater earnings sensitivity, are less financially constrained,
have larger abnormal returns, are smaller (significant at the median only), have a higher return on assets,
and are more likely to have a recent IPO. These differences are consistent with the notion that managers
of IS and BS fraud firms commit fraud under different conditions and circumstances. All continuous firm-
level variables are winsorized at the 0.01 and 0.99 levels to reduce the influence of outliers. Table 2,
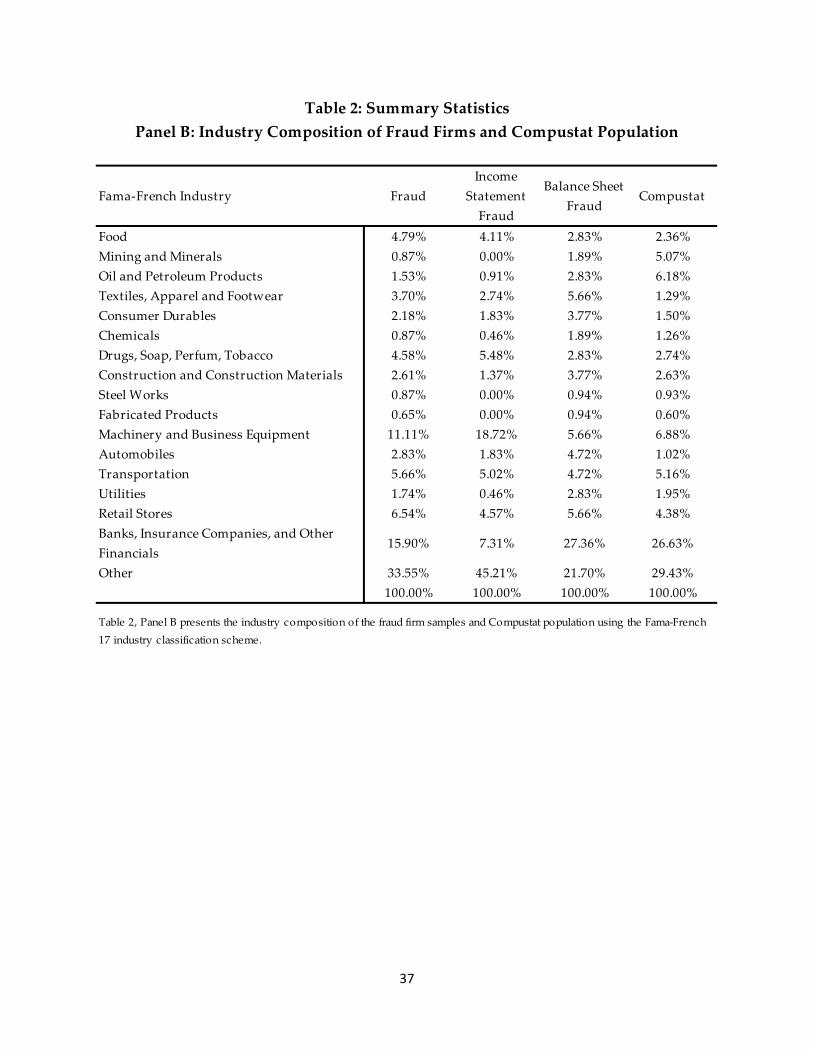
Panel B provides the industry breakdown for fraud firms, IS and BS fraud firms, and the Compustat 14 The results are robust to using an indicator variable for the firm’s need for capital as computed in Dechow et al. (2011). 15 Variable definitions and data sources are presented in Appendix 1.

14
population using the Fama and French 17 industry classification scheme. Fraud firms are distributed
similarly to the Compustat population though relatively few firms in mining, oil, and banking commit
fraud while more firms in the machinery and business equipment industry commit fraud. Considering
fraud type, banks are more likely and firms in the machinery and business equipment industry are less
likely to commit BS fraud16.
4. EMPIRCAL ANALYSIS
4.1 Income Statement Fraud
I test Hypotheses 1A and 1B by estimating Cox proportional hazards models of the following
form:
𝐼𝐼𝐼𝐼𝑖𝑖,𝑡𝑡 = 𝛽𝛽1𝑃𝑃𝑃𝑃 𝑀𝑀𝐾𝐾𝑀𝑀𝑡𝑡 + 𝛽𝛽2𝐷𝐷𝑃𝑃𝐶𝐶𝐴𝐴𝐷𝐷𝐷𝐷𝑀𝑀 𝑅𝑅𝐼𝐼𝐼𝐼𝐾𝐾𝑡𝑡 + 𝛽𝛽3𝐺𝐺𝐷𝐷𝑃𝑃𝑡𝑡 + 𝛽𝛽4𝐼𝐼𝐷𝐷𝑅𝑅𝑃𝑃𝑅𝑅𝐼𝐼𝐼𝐼𝑃𝑃𝑡𝑡 + 𝛽𝛽5𝐼𝐼𝑃𝑃𝐶𝐶𝑡𝑡
+ 𝛽𝛽6𝐼𝐼𝐼𝐼 𝐷𝐷𝑃𝑃𝑀𝑀𝑃𝑃𝐶𝐶𝑀𝑀𝑡𝑡 + 𝛽𝛽7𝐼𝐼𝑃𝑃𝐼𝐼𝐼𝐼𝑡𝑡 + 𝛽𝛽8𝑃𝑃𝐴𝐴𝑅𝑅𝐸𝐸 𝐼𝐼𝑃𝑃𝐸𝐸𝑖𝑖,𝑡𝑡−1 + 𝛽𝛽9𝐾𝐾𝐾𝐾𝑖𝑖,𝑡𝑡−1
+ 𝛽𝛽10𝐴𝐴𝐵𝐵 𝑅𝑅𝑃𝑃𝑀𝑀𝑖𝑖,𝑡𝑡−1 + 𝛽𝛽11𝐼𝐼𝐼𝐼𝐾𝐾𝑃𝑃𝑖𝑖,𝑡𝑡−1 + 𝛽𝛽12𝑅𝑅𝐼𝐼𝐴𝐴𝑖𝑖,𝑡𝑡−1 + 𝛽𝛽13𝐼𝐼𝑃𝑃𝐼𝐼𝑖𝑖,𝑡𝑡 + 𝜀𝜀𝑖𝑖,𝑡𝑡 . (2)
The dependent variable, IS, takes a value of 1 the period income statement fraud begins and is 0
otherwise. PE MKT, DEFAULT RISK, EARN SEN, and KZ are as defined in Section 3. GDP is gross
domestic product (inflation adjusted and expressed in 2005 $10s of billions) with the time trend removed
using the Hodrick and Prescot (1997) filter. SURPRISE, computed as the difference between actual GDP
and expected GDP as forecasted by the Survey of Professional Forecasters (Philadelphia FED), is
included because the decision to commit fraud might be influenced by expected macroeconomic
performance (Fernandes and Guedes 2010). SEC is the SEC’s annual budget appropriation and controls
for the SEC’s ability to detect and litigate fraud. I also include IS DETECT which is the average time to
detect IS frauds initiated in the current year. IS DETECT controls for changes in monitoring intensity. 16 While banks face the same incentives as other firms to deliver strong earnings performance, the balance sheet of a bank is not comparable to that of firms in other industries. My results hold when excluding banks but this significantly reduces the BS fraud sample in particular. Since my hypotheses are the same for banks and non-banks and because I find no change in results between bank and non-bank frauds I include them to analyze as many frauds as possible.

15
IPOS is the number of initial public offerings in the current year. Macro variables are measured in year t
to capture the environment in which the manager decides to commit fraud.
I include the following firm-level controls: AB RET, the firm’s annual abnormal return; SIZE, the
natural logarithm of market capitalization; ROA, operating income after depreciation scaled by average
total assets; and IPO, an indicator variable equal to 1 if the firm had its initial public offering in the
previous two years; zero otherwise. IPO is measured in the current year; lagging it would effectively
change its definition to whether the firm made an initial public offering in the previous three years17. All
other firm-level variables are measured as of the beginning of the year (lagged by one year) to capture the
firm’s circumstances at the beginning of the year the manager decides to commit fraud. A key reason for
lagging firm-level variables is that restated data are not available for a large number of fraud firms and the
fraudulently inflated numbers do not capture the underlying economics of the firm. Moreover, data of any
sort are not available for a number of firms in the first year of fraud (particularly data required for KZ and
AB RET).
A lack of restated financials presents a conceptual issue as it relates to EARN SEN. The relative
sensitivity of a firm’s price to earnings compared to the market can be calculated with non-restated data
and it is preferable to capture this sensitivity in real time. That said, it is unlikely that a firm’s price
sensitivity to earnings is linear in earnings. Without knowing true earnings this calculation is noisy at best
and biased at worst, therefore I choose to use the prior year’s reported earnings in this calculation18.
Table 3, Panel A presents estimates for three versions of equation (2): with macro variables only,
firm-level variables only, and both macro and firm-level variables. As predicted, I find a positive and
17 Results are not sensitive to measuring IPO in this way. 18 Using restated data when it is available produces statistically and economically similar results but reduces the sample size. Another option is to use restated data when it is available and lagged data when it is not. While this also produces similar results, for consistency’s sake I choose to measure EARN SEN in the same manner for all firms.

16
significant relation between IS and both PE MKT and EARN SEN (at the 0.01 level)19. The hazard ratios
in the full model indicate that a one dollar increase in PE MKT is associated with a 5 percent increase in
the probability of IS fraud; a 10 point increase in EARN SEN is associated with a 7 percent increase in the
probability of IS fraud. Additionally, more managers commit IS fraud in periods with higher GDP, lower
GDP surprise, and in years with more IPOs. Abnormal returns and firm size are both positively and
significantly associated with IS fraud and there is weak evidence that managers at firms with recent IPOs
are more likely to commit IS fraud (significant in one model and at the 0.10 level). When comparing
coefficients across models a chi squared test indicates that the hazard rate for PE MKT is significantly
smaller in the full model than it is in the macro model20. EARN SEN is not significantly different across
models. The results provide support for Hypotheses 1A and 1B and suggest that both macro and firm-
level incentives are important determinants of IS fraud. Additionally, the r-squared in the full model (31
percent) is notably larger than in the macro or firm-level model, further highlighting that both macro and
firm-level conditions create incentives to commit IS fraud.
The survival models I estimate offer important advantages over probit/logit models in handling
key features of the data, namely, right censoring, time at risk, and time-varying covariates. Right
censoring occurs because not all ongoing frauds have been detected by the end of the sample period.
Logit models treat these observations as if fraud will never occur while survival analysis is explicitly
designed to take account of censoring. Time at risk is not accounted for with logit analysis. Logit analysis
uses a dichotomous dependent variable for whether fraud occurs at any point in the study period. A fraud
that begins after, say, ten years, could have begun during the first nine years; the fact that fraud did not
occur in the first nine years is informative about fraud risk. Shumway (2001) shows that cross-sectional
19 In the Cox model robust standard errors are equivalent to standard errors clustered by firm, so double clustering standard errors (by firm and year for example) is equivalent to clustering by year alone as the variance-covariance matrices of the specifications with robust and firm-clustered standard errors cancel each other out perfectly. Because of this, all Cox models present results clustered by firm. The z-statistics in models clustered by year are generally larger than those presented. 20 This could be because fraud observations are lost when firm-level variables are added to the model. To consider this, I re-estimate models with macro variables alone including only firms for which firm-level data are available and find the results (presented in the Internet appendix) hold.

17
logit is an inconsistent estimator of the probability of failure because it does not account for time at risk.
In contrast, time at risk (time to fraud) is the dependent variable in survival analysis.
4.2 Balance Sheet Fraud
I test Hypotheses 2A and 2B by estimating Cox proportional hazards models of the following form:
𝐵𝐵𝐼𝐼𝑖𝑖,𝑡𝑡 = 𝛽𝛽1𝑃𝑃𝑃𝑃 𝑀𝑀𝐾𝐾𝑀𝑀𝑡𝑡 + 𝛽𝛽2𝐷𝐷𝑃𝑃𝐶𝐶𝐴𝐴𝐷𝐷𝐷𝐷𝑀𝑀 𝑅𝑅𝐼𝐼𝐼𝐼𝐾𝐾𝑡𝑡 + 𝛽𝛽3𝐺𝐺𝐷𝐷𝑃𝑃𝑡𝑡 + 𝛽𝛽4𝐼𝐼𝐷𝐷𝑅𝑅𝑃𝑃𝑅𝑅𝐼𝐼𝐼𝐼𝑃𝑃𝑡𝑡 + 𝛽𝛽5𝐼𝐼𝑃𝑃𝐶𝐶𝑡𝑡
+ 𝛽𝛽6𝐵𝐵𝐼𝐼 𝐷𝐷𝑃𝑃𝑀𝑀𝑃𝑃𝐶𝐶𝑀𝑀𝑡𝑡 + 𝛽𝛽7𝐼𝐼𝑃𝑃𝐼𝐼𝐼𝐼𝑡𝑡 + 𝛽𝛽8𝑃𝑃𝐴𝐴𝑅𝑅𝐸𝐸 𝐼𝐼𝑃𝑃𝐸𝐸𝑖𝑖,𝑡𝑡−1 + 𝛽𝛽9𝐾𝐾𝐾𝐾𝑖𝑖,𝑡𝑡−1
+ 𝛽𝛽10𝐴𝐴𝐵𝐵 𝑅𝑅𝑃𝑃𝑀𝑀𝑖𝑖,𝑡𝑡−1 + 𝛽𝛽11𝐼𝐼𝐼𝐼𝐾𝐾𝑃𝑃𝑖𝑖,𝑡𝑡−1 + 𝛽𝛽12𝑅𝑅𝐼𝐼𝐴𝐴𝑖𝑖,𝑡𝑡−1 + 𝛽𝛽13𝐼𝐼𝑃𝑃𝐼𝐼𝑖𝑖,𝑡𝑡 + 𝜀𝜀𝑖𝑖,𝑡𝑡 (3)
This model is similar to that which I use to test Hypotheses 1A and 1B except that the dependent variable
is BS, which takes a value of 1 the period balance sheet fraud begins and is 0 otherwise, and BS DETECT,
the average time to detect BS frauds initiated in the current year, replaces IS DETECT. Table 3, Panel B
presents analogous results for estimations of equation (3).
As predicted, I find a positive and significant association between BS and both DEFAULT RISK
and KZ (at the 0.01 level). In the full model, a one standard deviation increase in DEFAULT RISK is
associated with at 42 percent increase in the probability of BS fraud; a one standard deviation increase in
KZ is associated with a 45 percent increase in BS fraud. Firm size is positively associated with BS fraud;
ROA is positively, but weakly, associated with BS fraud. The results suggest that both macro and firm-
level variables explain significant variation in the incentives to commit BS fraud and provide strong
evidence supporting Hypotheses 2A and 2B21. As with IS fraud, the r-squared in the full model of
equation (3) is notably larger than that where either macro or firm-level variables are considered alone.
To further highlight the differences between IS and BS fraud I compare the parameter estimates
from Table 3, Panels A and B, using a series of seemingly unrelated estimations. Table 3, Panel C
21 I also estimate equations (2) and (3) including only firms where fraud ultimately took place. With this sample, hazard rates for IS and BS frauds are estimated using a sample of firms where fraud of any kind occurs. The results are provided in the Internet Appendix and are similar to those presented in Table 3, Panels A and B.

18
presents the results. The associations between IS fraud and both PE MKT and EARN SEN are significantly
larger than they are for BS fraud (at the 0.05 level or better). Conversely, the associations between BS
fraud and both DEFAULT RISK and KZ are significantly larger than they are for IS fraud (at the 0.01
level). The results indicate that IS and BS frauds are committed for different reasons and that incentives to
commit IS fraud are not associated with BS fraud (and vice versa).
4.3 Alternative Samples
I re-estimate models with two additional samples to address concerns that results might be driven
by changes in the detection and enforcement environments. The only changes are the dependent variable
and whether the average time for detection of IS fraud or BS fraud is modeled; all other variables are as
defined in Section 322.
Table 4 presents results using the DMZ sample; the first column models IS fraud and the second
column models BS fraud. Consistent with Table 3, IS frauds in the DMZ sample are positively associated
with PE MKT and EARN SEN (0.05 level or better). DEFAULT RISK and KZ are not significantly
associated with IS fraud. BS frauds in the DMZ sample are positively associated with DEFAULT RISK
and KZ (0.05 level or better) and are not significantly associated with PE MKT or EARN SEN. Both types
of fraud in the DMZ sample are positively associated with firm size23 but abnormal returns, which were
strongly associated with IS fraud in the AAER sample, are not associated with IS fraud in the DMZ
sample. The results provide more evidence in support of hypotheses 1 and 2 and more evidence that the
documented associations are not related to omitted variables that can influence the AAER process.
22 I also estimate equation (2) analyzing firms which received AAERs for violations other than fraud (insider trading, selling securities without a license) and find no association between the start period of the violation and my variables of interest. The results are provided in the Internet Appendix. This provides more evidence that different SEC violations occur during different macroeconomic periods and are associated with different firm-level characteristics. 23 This is not surprising given that larger firms are more likely to face class action lawsuits.

19
Table 5 presents results using AAERs of frauds which were initially discovered by internal
governance or by employee whistleblowers. The results are highly similar to those in Table 3. IS fraud is
positively associated with PE MKT, EARN SEN, GDP, IPOS, AB RET, and SIZE, and negatively
associated with SURPRISE. BS fraud is positively associated with DEFAULT RISK, KZ, and SIZE, and
negatively associated with IPOS. That the results hold in the approximately 50 percent of frauds
uncovered internally and through employee whistleblowers provides more support for hypotheses 1 and 2.
4.4 Robustness Analysis
King and Zeng (2001) note bias in binary analysis of rare events arises because: the statistical
properties of binary regression models are not invariant to the (unconditional) mean of the dependent
variable and because the method of computing probabilities of events in logistic analysis is suboptimal in
finite samples of rare events. While I find significant results, the economic and statistical significance can
be understated for variables for which I predict a weaker or insignificant association. King and Zeng
develop a rare-events logit model which generates approximately unbiased and lower-variance estimates
of logit coefficients and their variance-covariance matrix by correcting for small samples and rare events.
While survival analysis is preferable to logit analysis for the reasons listed earlier, it is worth verifying the
veracity of my results under an alternative specification specifically designed to deal with rare events. I
estimate equations (2) and (3) using a rare events logit model and find the statistical significance of the
results is unchanged24.
Heinze and Schemper (2002) provide evidence that a method of penalized likelihood estimation
develop by Firth (1993) that produces finite parameter estimates in cases where there are a small number
of events can also be used to reduce the potential bias of maximum likelihood estimates. However this
model assumes observations are independent; while this model is inappropriate for analysis with firm-
level variables, it may be less concerning with regards to Hypotheses 1A and 2A, which deal with
24 Results provided in the Internet Appendix.

20
macroeconomic incentives. I re-estimate equations (2) and (3) using penalized maximum likelihood
including only macro variables and find the results are unchanged25
Table 3 provides evidence that the economic environment creates incentives for managers to
commit fraud incremental to those at the firm-level. However, it is possible that these incentives might be
better captured by measuring them at the industry level instead of the market level. While firms can be
thought of as competing against all other firms in the market for shareholder interest, managers are often
evaluated and compensated based on performance relative to industry peers (Antle and Smith 1986).
Moreover, if the market is sensitive to earnings news in aggregate, it must also be sensitive to earnings
news in most industries. There are not enough frauds to perform meaningful analyses within each
industry,26 and most industries are so highly correlated with the market that there is no meaningful time-
series difference between market and industry level price sensitivity to earnings news. If countercyclical
industries are looked at in aggregate, however, then there are enough cases of fraud to analyze and
enough variation between market and industry level measures to investigate whether the incentives to
commit fraud are better measured at the market or industry level.
To explore the possibility that industry measures are more relevant than market measures, I
calculate PE MKT for the four industries27 with earnings sensitivities negatively correlated with the
market and re-estimate equations (2) and (3) for these industries. The results (not tabulated), from
estimating equations (2) and (3) for countercyclical industries suggest that incentives to commit IS fraud
are better measured using market level earnings sensitivity than using industry level earnings sensitivity28.
25 Results provided in the Internet Appendix. 26 Within the Fama-French 17 industry classification scheme there are fewer than 10 frauds in most industries and these frauds occur over a 25 year period 27 The four industries are “Steel Works”, “Fabricated Products”, “Machinery and Business Equipment”, and “Other”. There is no clear industry level measure for DEFAULT RISK and KZ is not an industry dependent measure so these variables are unchanged. 28 The association between IS fraud and earnings sensitivity is significantly larger when measured at the market level than at the industry level and when both market and industry measures are included in the same model market level earnings sensitivity remains positively and significantly associated with IS fraud while the association

21
While data limitations limit the scope of this analysis, results examining fraud in industries with
countercyclical earnings sensitivity suggest that managers are responding to incentives at the market level
and that these incentives are not simply proxies for industry level incentives.
4.5 Variation in Fraud Type Composition and Firm-level Associations through Time
The results in Tables 3 through 5 suggest that managers commit IS and BS frauds in different
macroeconomic periods and in response to different incentives, and provide one possible explanation for
inconsistencies found in prior research. To shed more light on this possibility I look at variation in fraud
type over the sample period and perform further analyses over certain periods. Figure 3 shows the
percentage of frauds per year that are defined as income statement or balance sheet. IS fraud is
consistently higher than average in the mid to late 1990s and BS fraud is consistently lower than average
during this period (though there are spikes and dips in individual years). Figure 3 indicates that a
disproportionate percentage of frauds during the mid to late 1990s were income statement motivated.
Figure 4 shows the percentage of aggregate IS and BS fraud that takes place each year. Approximately 51
percent of IS frauds occur in the 5 years from 1997-2001 while only 30 percent of BS frauds occur during
this same period. BS fraud spikes relative to IS fraud in the late 1980s/early 1990s and in the late 2000s
which are recessionary periods. The IS versus BS fraud profile changes over time. My results suggest this
is an important consideration.
To investigate further, I estimate the following equation for all types of fraud over the following
periods: 1986-1991, 1992-2000, and 2001-201029:
𝐶𝐶𝑅𝑅𝐴𝐴𝐷𝐷𝐷𝐷𝑖𝑖,𝑡𝑡 = 𝛽𝛽1𝑃𝑃𝐴𝐴𝑅𝑅𝐸𝐸 𝐼𝐼𝑃𝑃𝐸𝐸𝑖𝑖,𝑡𝑡−1 + 𝛽𝛽2𝐾𝐾𝐾𝐾𝑖𝑖,𝑡𝑡−1 + 𝛽𝛽3𝐴𝐴𝐵𝐵 𝑅𝑅𝑃𝑃𝑀𝑀𝑖𝑖,𝑡𝑡−1 + 𝛽𝛽4𝐼𝐼𝐼𝐼𝐾𝐾𝑃𝑃𝑖𝑖,𝑡𝑡−1 + 𝛽𝛽5𝑅𝑅𝐼𝐼𝐴𝐴𝑖𝑖,𝑡𝑡−1
+ 𝛽𝛽6𝐼𝐼𝑃𝑃𝐼𝐼𝑖𝑖,𝑡𝑡 + 𝜀𝜀𝑖𝑖,𝑡𝑡 . (4)
with industry level earnings sensitivity is not statistically significant. PE MKT is not significantly associated with BS fraud regardless of whether it is measured at the market or industry level. 29 Results are not sensitive to varying the start and end periods one year in either direction.

22
Results are presented in Table 630. The association between FRAUD and EARN SEN is positive and
significant (at the 0.01 level) only in the 1992-2000 period. Further, it is actually negative and significant
(though weakly) from 1986-1991. Conversely, KZ is positive and significantly associated with FRAUD
from 1986-1991 and from 2001-2010 (at the 0.01 level). Additionally, the previously documented
association between fraud and abnormal returns is confined to the period of 1992-2000. Most prior
research analyzes samples where frauds occur between 1992 and 2000, but the incentives for fraud and
the composition of fraud type during this period are significantly different than in periods before and
after. Descriptive data and the results in Table 6 provide evidence regarding how associations between
fraud and firm-level variables vary through time and signify the importance of considering the IS versus
BS fraud composition of the sample.
To further illustrate the importance of sampling periods, I analyze the association between fraud
and board of director independence in different time periods. Beasley (1996) and Dechow, Sloan, and
Sweeney (1996) find a negative association between fraud and board independence while Agrawal and
Chadha (2005) find no such association. These studies have several differences, including sampling
methodology, and there are several possible explanations for the mixed results. However, one explanation
is that the first two papers sample frauds from 1980-1992 while the third studies violations from 2000-
2001. Given that director data from the earlier studies was hand collected and analyzed in matched
samples I am not attempting a perfect replication, but instead am exploring whether this association varies
over time using a sample of fraud firms collected using the same process in both time periods. I re-
estimate equation (4) and add IND, the percentage of a firm’s directors that are considered independent31.
The results are presented in Table 7. In the full sample I find no association between fraud and director
independence. However, for frauds initiated prior to 2000 I find a negative and significant (0.01 level)
association between fraud and director independence, consistent with prior studies. Further, for frauds
30 Results for models with firm-level variables alone are provided as the macro variables have little variation with so few years in the different samples. 31 I exclude IPO from this estimation because only two fraud firms that have data on board independence in year t-1 had an IPO in the prior two years.

23
initiated after 1999 the association between fraud and board independence is actually positive, though not
quite statistically significant. Again, while this is not meant to be a perfect replication of prior work, the
results show that when sampling fraud under the same criterion the association between fraud and director
independence varies drastically depending on which years the frauds are sampled from. This provides one
explanation for the inconsistent results reported in prior studies.
5. SUMMARY AND CONCLUSIONS
I examine differences in both macro and firm-level incentives to commit income statement and
balance sheet fraud. Income statement fraud tends to occur in periods of relatively high market price
sensitivity to earnings news, and IS fraud firms are relatively more sensitive to idiosyncratic earnings
performance. These associations are significantly larger than those for balance sheet fraud, which are not
significantly greater than zero. In contrast, balance sheet fraud tends to occur during periods of relatively
high default risk and BS fraud firms are more financially constrained. These associations are significantly
larger than those for income statement fraud, which are not significantly greater zero. The results hold in
samples of fraud derived from SEC AAERs, class action lawsuits, and a subsample of firms for which
fraud was detected internally or by employee whistleblowers.
I document that associations between firm-level incentives and fraud vary through time. Frauds
initiated between 1992 and 2000 are positively associated with firm-level earnings sensitivity; this period
had a particularly large proportion of IS fraud. Frauds initiated between 1986 and 1991 are negatively
associated with firm-level earnings sensitivity and frauds initiated between 2001 and 2010 are
uncorrelated with firm-level earnings sensitivity. Conversely, frauds initiated between 1986 to 1991 or
2001 to 2010 are positively associated with firm financial constraints. These are periods with greater
incidence of BS fraud. Frauds initiated between 1992 and 2000 are not associated with firm financial
constraints. Further, the association between fraud and board independence is negative and significant for
frauds initiated before 2000 but not significant (and actually positive) for frauds initiated after 1999.

24
These results indicate that managers commit different types of financial statement fraud in
response to different incentives, which come from different (macro economy and firm-level) sources.
Moreover, the strength of incentives to commit fraud varies over time.

25
References
Agrawal, A., and S. Chadha. 2005. Corporate governance and accounting scandals. The Journal of Law and Economics 48: 371–406.
Agrawal, A., and T. Cooper. 2007. Corporate governance consequences of accounting scandals: evidence from top management, CFO, and auditor turnover. Unpublished working paper.
Altman, E., and A. Saunders. 1997. Credit risk management: developments over the last 20 years. Journal
of Banking and Finance 21: 1721-1742. Armstrong, C., A. Jagolinzer, and D. Larcker. 2010. Chief executive officer equity incentives and
accounting irregularities. Journal of Accounting Research 48 (2): 225-271.
Antle, R., and A. Smith. 1986. An empirical investigation of the relative performance evaluation of corporate executives. Journal of Accounting Research 24 (1): 1-39.
Ball, R. 2009. Market and political/regulatory perspectives on the recent accounting scandals. Journal of Accounting Research 47 (2): 277-323.
Baker, M., J. Stein, and J. Wurgler. 2003. When does the market matter? Stock prices and the investment of equity-dependent firms. The Quarterly Journal of Economics 118 (3): 969-1005.
Beasley, M. 1996. An empirical analysis of the relation between the board of director composition and financial statement fraud. The Accounting Review 71 (4): 443-465.
Beatty, A., S. Liao, and J. Yu. 2009. The spillover effect of fraudulent financial reporting on peer firms’ investment efficiency. Journal of Accounting and Economics 55 (2): 183-205.
Beneish, M. 1997. Detecting GAAP violation: Implications for assessing earnings management among firms with extreme financial performance. Journal of Accounting and Public Policy 16 (3): 271-309.
Beneish, M. 1999. Incentives and penalties related to earnings overstatements that violate GAAP. The Accounting Review 74 (4): 425-457.
Benmelech, E., E. Kandel, and P. Veronesi. 2010. Stock-based compensation and CEO (dis) incentives. The Quarterly Journal of Economics 125 (4): 1769-1820.
Bernanke, B., and M. Gertler. 1989. Agency costs, net worth, and business fluctuations. American Economic Review 79 (1): 14-31.
Brazel, J., K. Jones, and M. Zimbelman. 2009. Using nonfinancial measures to asses fraud risk. Journal of Accounting Research 47 (5): 1135-1166.
Bromiley, P., and J. Harris. 2007. Incentives to cheat: the influence of executive compensation and firm performance on financial misrepresentation. Organization Science18 (3): 350-367.
Burns, N., and S. Kedia. 2006. The impact of performance-based compensation on misreporting. Journal of Financial Economics 79: 35-67.

26
Burns, N., and S. Kedia. 2008. Executive option exercises and financial misreporting. Journal of Banking and Finance 32: 845-857.
Bushman, R., C. Williams, and R. Wittenberg-Moerman. 2015. The information role of the media in private lending. Unpublished working paper.
Cheng, Q., and D. Farber. 2008. Earnings restatements, changes in CEO compensation, and firm performance. The Accounting Review 83 (5): 1217-1250.
Cotter, J., and S. Young. 2007. Do analysts anticipate accounting fraud? Unpublished working paper.
Crutchley, C., M. Jensen, and B. Marshall. 2007. Climate for scandal: corporate environments that contribute to accounting fraud. The Financial Review 42: 53-73.
Davidson, R., A. Dey, and A. Smith. 2015. Executives’ “off-the-job” behavior, corporate culture, and financial reporting risk. Journal of Financial Economics 117: 5-28.
Dechow, P., W. Ge, C. Larson, and R Sloan. 2011. Predicting material accounting manipulations.
Contemporary Accounting Research 28: 17–82. Dechow, P., R. Sloan, and A. Sweeney. 1996. Causes and consequences of earnings manipulation: an
analysis of firms subject to enforcement actions by the SEC. Contemporary Accounting Research13 (1): 1-36.
Desai, H., C. Hogan, and M. Wilkins. 2004. The reputational penalty for aggressive accounting: earnings
restatements and management turnover. The Accounting Review 81 (1): 83-112.
Dyck, A., A. Morse, and L. Zingales. 2007. Who blows the whistle on corporate fraud? The Journal of Finance 65 (6): 2213-2253.
Efendi, J., A. Srivastava, and P. Swanson. 2007. Why do corporate managers misstate financial statements? The role of option compensation and other factors. Journal of Financial Economics 85: 667-708.
Erickson, M., M. Hanlon, and E. Maydew. 2004. How much will firms pay for earnings that do not exist? Evidence of taxes paid on allegedly fraudulent earnings. The Accounting review 79 (2): 387-408.
Erickson, M., M. Hanlon, and E. Maydew. 2006. Is there a link between executive equity incentives and accounting fraud? Journal of Accounting Research 44: 113–143.
Feng, M., W. Ge, S. Luo, and T. Shevlin. 2011. Why do CFOs become involved in material accounting manipulations? Journal of Accounting and Economics 51: 21-36.
Fernandes, N., and J. Guedes. 2010. Keeping up with the joneses: a model and a test of collective accounting fraud. European Financial Management 16 (1): 72-93.
Fich, E., and A. Shivdasani. 2007. Financial fraud, director reputation, and shareholder wealth. Journal of Financial Economics 86: 306-336.
Firth, D. 1993. Bias reduction of maximum likelihood estimates. Biometrika 80 (1): 27-38.

27
Galbraith, J. 1961. The Great Crash, 1929. New York: Houghton Mifflin Harcourt.
Gerety, M., and K. Lehn. 1997. The causes and consequences of accounting fraud. Managerial and Decision Economics 18: 587-599.
Graham, J., C. Harvey, and S. Rajgopal. 2005. The economic implications of corporate financial reporting. Journal of Accounting and Economics 40 (1): 3-73.
Graham, J., S. Li, and J. Qiu. 2008. Corporate misreporting and bank loan contracting. Journal of Financial Economics 89: 44-61.
Heinze, G., and M. Schemper. 2002. A solution to the problem of separation in logistic regression. Statistics in Medicine 21 (16): 2409-2419.
Hertzberg, A. 2005. Managerial incentives, misreporting, and the timing of social learning: A theory of slow booms and rapid recessions. Unpublished Working Paper.
Hodrick, R., and E. Prescott. 1997. Postwar US business cycles: An empirical investigation. Journal of Money, Credit, and Banking 29 (1): 1-16.
Jensen, M. 2005. Agency costs of overvalued equity. Financial Management 34 (1): 5-19.
Johnson, S., H. Ryan, and Y. Tian. 2009. Managerial incentives and corporate fraud: The sources of incentives matter. Review of Finance 13: 115–145.
Kaplan, S., and L. Zingales. 1997. Do investment-cash flow sensitivities provide useful measures of financing constraints? The Quarterly Journal of Economics 112 (1): 169-215.
King, G., and L. Zeng. 2001. Logistic regression in rare events data. Political Analysis 9 (2): 137-163.
Martin, K., and J. McConnell. 1991. Corporate performance, corporate takeover, and management turnover. The Journal of Finance 46 (2): 671-687.
Palmrose, Z., V. Richardson, and S. Scholz. 2004. Determinants of market reactions to restatement announcements. Journal of Accounting and Economics 37: 59-89.
Povel, P., R. Singh, and A. Winton. 2007. Booms, busts, and fraud. Review of Financial Studies 20 (4): 1219-1254.
Richardson, S., I. Tuna, and M. Wu. 2003. Predicting earnings management: the case of earnings restatements. Unpublished working paper.
Schrand, C., and S. Zechman. 2012. Executive overconfidence and the slippery slope to financial misreporting. Journal of Accounting and Economics 53 (1): 311-329.
Shumway, T. 2001. Forecasting bankruptcy more accurately: A simple hazard model. The Journal of Business 74: 101–124.

28
Strobl, G. 2013. Earnings manipulation and the cost of capital. Journal of Accounting Research 51 (2): 449-473.
Wang, T., and A. Winton. 2010. Competition and corporate fraud waves. Unpublished working paper.
Watts, R. 2003. Conservatism in accounting. Accounting Horizons 17 (3): 207-221.

29
Variable Measurement SourceIncome Statement fraud (IS)
An indicator variable equal to 1 in the period the manager starts committing fraud in which all material manipulations are related to the Income Statement and 0 otherwise.
SEC AAERs
Balance Sheet fraud (BS)
An indicator variable equal to 1 in the period the manager starts committing fraud in which none of the material manipulations are related to the Income Statement and 0 otherwise.
SEC AAERs
Income Statement and Balance Sheet fraud (ISBS)
An indicator variable equal to 1 in the period the manager starts committing fraud with material manipulations both related and unrelated to the Income Statement and 0 otherwise.
SEC AAERs
Fraud (FRAUD) An indicator variable equal to 1 in the period the manager starts committing fraud and 0 otherwise.
SEC AAERs
Non-fraud AAER Occurrence (NFAAER)
An indicator variable equal to 1 in the period the manager starts committing a non-fraud violation and 0 otherwise.
SEC AAERs
Market price sensitivity to earnings (PE MKT)
Value weighted price-earnings ratio for the market. Compustat
Default risk premium (DEFAULT
Difference between the long term BAA corporate bond rate and the 10 year US Treasury rate.
St. Louis FED
Gross domestic product (GDP)
2005 GDP, inflation adjusted, expressed in $10s of billions and detrended using the Hodrick-Prescot filter.
Bureau of Economic Analysis
GDP Surprise (SURPRISE)
Difference between GDP and GDP forecast, as provided by the Philadelphia FED 'Survey of Professional Forecasters', expressed in $10s of billions.
Bureau of Economic Analysis and Philadelphia Fed
SEC budget (SEC) The SEC's annual budget appropriation in $100s of millions. SECTime to detect fraud (DETECT)
The average time in years to detect fraud initiated during the year.
SEC AAERs
Time to detect Income Statement fraud (IS DETECT)
The average time in years to detect Income Statement fraud initiated during the year.
SEC AAERs
Time to detect Balance Sheet fraud (BS DETECT)
The average time in years to detect Balance Sheet fraud initiated during the year.
SEC AAERs
Time to detect non-fraud violations (NF DETECT)
The average time in years to detect non-fraud violations initiated during the year.
SEC AAERs
Number of IPOs (IPOS)
The number of IPOs in the current year expressed in hundreds.
Jay Ritter's website http://bear.warrington.ufl.edu/ritter/
Appendix 1Definition of Variables and Data Sources

30
Variable Measurement SourceRelative earnings sensitivity (EARN SEN)
The annual percentile rank of the firm's price-earnings ratio. Compustat
Financial constraint (KZ)
The financial constraint proxy developed by Kaplan and Zingales (1997). I construct the five variable KZ Score for each firm/year as the following linear combination: KZ i,t= -1.002 CF i,t / Ai,t-1 – 39.368 Di,t/ Ai, t-1 – 1.315 Ci,t / Ai, t-1 + 3.139 Bi,t + 0.283 Qi,t where CF i,t / Ai,t-1 is cash flow over lagged assets; Di,t/ Ai, t-1 is cash dividends over lagged assets; Ci,t / Ai, t-1 is cash balances over lagged assets; Bi,t is book leverage which is total debt divided by the sum of total debt and book equity measured at year-end, and Qi,t is Tobin's Q which is the market value of equity (price times shares outstanding) plus assets minus the book value of equity, divided by assets. All individual components of the above financial constraint variable are winsorized before constructing the variable.
Compustat
Abnormal returns (AB RET)
Annual firm return less the annual value weighted market return.
CRSP
Size (SIZE) The natural logarithm of the firm's market capitalization. CompustatPerformance (ROA) Operating income before depreciation scaled by average total
assets.Compustat
Recent IPO (IPO) An indicator variable equal to 1 if the firm has been listed on CRSP for less than 4 years and 0 otherwise.
CRSP
Board Independence (IND)
The percentage of independent directors on the firm's board of directors.
Appendix 1 - Continued

31
Study Fraud Firms used in Primary Analysis
Beasley 1996 75
Beatty, Liao, and Yu 1999 14
Beneish 1999 49
Beneish 1999 64
Brazel, Jones, and Zimbelman 2009 50
Cotter and Young 2007 56
Crutchley, Jensen, and Marshall 2007 97
Davidson, Dey, and Smith 2013 109
Dechow, Sloan, and Sweeney 1996 92
Dechow, Ge, Larson, and Sloan 2011 362
Erickson, Hanlon, and Maydew 2004 27
Erickson, Hanlon, and Maydew 2006 50
Feng, Ge, Luo, and Shevlin 2011 74
Fich and Shivdasani 2007 45
Gerety and Lehn 1997 62
Johnson,Ryan, and Tian 2009 87
Schrand and Zechman 2008 49
Figure 1Sample Sizes of Prior Research

32
Research Paper
Palmrose et al 2004Agrawal and Chadha 2005Burns and Kedia 2006Desai et al 2006Erickson et al 2006Agrawal and Cooper 2007Dyck et al 2007Efendi et al 2007Fich and Shivdasani 2007Harris and Bromiley 2007Burns and Kedia 2008Cheng and Farber 2008Graham et al 2008Armstrong et al 2010Wang and Winton 2010
1990
1991
1992
1993
1994
1995
1996
1997
1998
1999
2000
2001
2002
2003
2004
2005
2006
2007
2008
2009
2010
Year
Figure 2: Timeline of Prior Research on Accounting Manipulations

33

34

35
Sample collection period 1986 - 2015
Sample period of violations 1986 - 2010
Total AAERs that involve specific firms 3,439
Less: AAERs unrelated to financial statament fraud 1,041
Less: redundant AAERs related to the same firm/incident 1,290
AAERs related to unique cases of financial statement fraud 1,108
Less: violations occurring after 2010 or before 1986 39
Less: firms without CRSP/Compustat identifiers 605
Less: earnings/net asset understatement 5
AAERs with unique CRSP/Compustat identifiers 459
Income statement only fraud firms 189
Income statement only fraud firms with CRSP/Compustat data in year prior to fraud161
Balance sheet only fraud firms 78
Balance sheet only fraud firms with CRSP/Copmpustat data in year prior to fraud 68
Table 1Sample Composition
Table 1 describes the AAER sample and collection process and notes how many firms are available for different analyses . The sample is reduced primarily because firms do not have CRSP/Compustat identifiers or because of missing data in the year before fraud began.

36
Macro Variables Mean Median
PE MKT 23.30 20.06
DEFAULT RISK 2.33 2.11
GDP 1.27 1.73
SURPRISE -2.92 3.60
SEC 4.80 3.28
DETECT 2.73 2.68
IS DETECT 2.60 2.52
BS DETECT 2.71 2.57
IPOS 2.61 1.73
Mean Median Mean Median
EARN SEN 55.8 58 49.21*** 49***
KZ 0.83 0.77 0.57*** 0.62***
AB RET 0.09 -0.01 0.01*** -0.07***
SIZE 5.92 5.94 5.01*** 4.89***
ROA 0.10 0.11 0.06*** 0.09**
IPO 0.11 0.00 0.07*** 0.00
Mean Median Mean Median
EARN SEN 58.24 61.00 51.04*** 53.00***
KZ 0.73 0.68 0.98*** 0.91***
AB RET 0.12 0 0.05** -0.03*
SIZE 5.89 5.86 5.99 6.13***
ROA 0.11 0.12 0.09*** 0.08***
IPO 0.13 0.00 0.07*** 0.00
Firm Level VariablesIncome Statement Fraud
Table 2, Panel A presents the mean and median of the macro variables and firm-level variables for the fraud firm samples and Compustat population. PE MKT is the value-weighted annual market price-earnings ratio; DEFAULT RISK is the difference between the long term BAA corporate bond rate and the 10 year treasury bill rate; GDP is gross domestic product (inflation adjusted and expressed in 2005 $10s of billions) detrended using the Hodrick and Prescot [1997] filter; SURPRISE is the difference between actual GDP and expected GDP; SEC is the SEC’s annual budget appropriation; DETECT is the average time to detect frauds initiated in the current year; IS DETECT is the average time to detect IS frauds initiated in the current year; BS DETECT is the average time to detect BS frauds initiated in the current year; IPOS is the number of IPOs in the current year. EARN SEN is the percentile rank of the firm's price-earnings ratio; KZ is the financial constraint proxy developed by Kaplan and Zingales [1997]; AB RET is the firm's annual abnormal return; SIZE is the natural logarithm of the firm's market capitalization; ROA is the firm's operating income after depreciation scaled by average total assets; IPO is an indicator that equals 1 if the firm made an initial public offering in the current or preceding two years and 0 otherwise. ***, **, and * denote significance at the .01, .05, and .10 levels respecitively for t-tests (mean) and Wilcoxon/Chi-square (median) tests of differences.
Table 2: Summary StatisticsPanel A: Descriptive Statistics
Firm Level VariablesFraud Firms Compustat
Balance Sheet Fraud
37
Fama-French Industry FraudIncome
Statement Fraud
Balance Sheet Fraud
Compustat
Food 4.79% 4.11% 2.83% 2.36%Mining and Minerals 0.87% 0.00% 1.89% 5.07%Oil and Petroleum Products 1.53% 0.91% 2.83% 6.18%Textiles, Apparel and Footwear 3.70% 2.74% 5.66% 1.29%Consumer Durables 2.18% 1.83% 3.77% 1.50%Chemicals 0.87% 0.46% 1.89% 1.26%Drugs, Soap, Perfum, Tobacco 4.58% 5.48% 2.83% 2.74%Construction and Construction Materials 2.61% 1.37% 3.77% 2.63%Steel Works 0.87% 0.00% 0.94% 0.93%Fabricated Products 0.65% 0.00% 0.94% 0.60%Machinery and Business Equipment 11.11% 18.72% 5.66% 6.88%Automobiles 2.83% 1.83% 4.72% 1.02%Transportation 5.66% 5.02% 4.72% 5.16%Utilities 1.74% 0.46% 2.83% 1.95%Retail Stores 6.54% 4.57% 5.66% 4.38%Banks, Insurance Companies, and Other Financials
15.90% 7.31% 27.36% 26.63%
Other 33.55% 45.21% 21.70% 29.43%100.00% 100.00% 100.00% 100.00%
Table 2: Summary StatisticsPanel B: Industry Composition of Fraud Firms and Compustat Population
Table 2, Panel B presents the industry composition of the fraud firm samples and Compustat population using the Fama-French 17 industry classification scheme.

38
MACRO MICRO FULLPE MKT 1.078*** 1.050***
(4.72) (4.14)DEFAULT RISK 0.786 0.998
(-0.88) (-0.01)GDP 1.021*** 1.018***
(2.92) (2.85)SURPRISE 0.979** 0.985**
(-2.12) (-2.15)SEC 0.993 0.917
(-0.11) (-1.24)IS DETECT 1.585 1.024
(1.57) (0.09)IPOS 1.290*** 1.208**
(3.47) (2.21)EARN SEN 1.007*** 1.007***
(3.43) (3.15)KZ 1.061 1.084
(0.72) (0.80)AB RET 1.334*** 1.217***
(3.60) (2.62)SIZE 1.247*** 1.205***
(5.11) (4.20)ROA 1.165 1.458
(0.31) (0.76)IPO 1.884* 1.582
(1.85) (1.28)OBSERVATIONS 155,753 109,113 109,113FAILURES 189 161 161R-SQUARED 0.26 0.20 0.31CHI 2 - CROSS MODEL DIFFERENCE COMPARISONS P VALUEPE MKT Macro - PE MKT Full 0.074DEFAULT RISK Macro - DEFAULT RISK Full 0.441EARN SEN Micro - EARN SEN Full 0.636KZ Micro - KZ Full 0.389
Table 3Panel A: Survival Analysis - Income Statement Fraud
𝐼𝐼𝐼𝐼𝑖𝑖,𝑡𝑡 = 𝛽𝛽1𝑃𝑃𝑃𝑃 𝑀𝑀𝐾𝐾𝑀𝑀𝑡𝑡 + 𝛽𝛽2𝐷𝐷𝑃𝑃𝐶𝐶𝐴𝐴𝐷𝐷𝐷𝐷𝑀𝑀 𝑅𝑅𝐼𝐼𝐼𝐼𝐾𝐾𝑡𝑡 + 𝛽𝛽3𝐺𝐺𝐷𝐷𝑃𝑃𝑡𝑡 + 𝛽𝛽4𝐼𝐼𝐷𝐷𝑅𝑅𝑃𝑃𝑅𝑅𝐼𝐼𝐼𝐼𝑃𝑃𝑡𝑡 + 𝛽𝛽5𝐼𝐼𝑃𝑃𝐶𝐶𝑡𝑡 + 𝛽𝛽6𝐼𝐼𝐼𝐼 𝐷𝐷𝑃𝑃𝑀𝑀𝑃𝑃𝐶𝐶𝑀𝑀𝑡𝑡 + 𝛽𝛽7𝐼𝐼𝑃𝑃𝐼𝐼𝐼𝐼𝑡𝑡 + 𝛽𝛽8𝑃𝑃𝐴𝐴𝑅𝑅𝐸𝐸 𝐼𝐼𝑃𝑃𝐸𝐸𝑖𝑖,𝑡𝑡−1 + 𝛽𝛽9𝐾𝐾𝐾𝐾𝑖𝑖,𝑡𝑡−1 + 𝛽𝛽10𝐴𝐴𝐵𝐵 𝑅𝑅𝑃𝑃𝑀𝑀𝑖𝑖,𝑡𝑡−1 + 𝛽𝛽11𝐼𝐼𝐼𝐼𝐾𝐾𝑃𝑃𝑖𝑖,𝑡𝑡−1 + 𝛽𝛽12𝑅𝑅𝐼𝐼𝐴𝐴𝑖𝑖,𝑡𝑡−1 + 𝛽𝛽13𝐼𝐼𝑃𝑃𝐼𝐼𝑖𝑖,𝑡𝑡 + 𝜀𝜀𝑖𝑖,𝑡𝑡

39
Table 3, Panel A presents the results of Cox proportional hazards models estimating variants of equation (2). Equation (2) estimates the relation between income statement fraud and macro and firm-level determinants. The first column models macroeconomic variables; the second column models firm-level variables; the third column models macroeconomic and firm-level variables. PE MKT is the value-weighted annual market price-earnings ratio; DEFAULT RISK is the difference between the long term BAA corporate bond rate and the 10 year treasury bill rate; GDP is gross domestic product (inflation adjusted and expressed in 2005 $10s of billions) detrended using the Hodrick and Prescot [1997] filter; SURPRISE is the difference between actual GDP and expected GDP; SEC is the SEC’s annual budget appropriation; IS DETECT is the average time to detect IS frauds initiated in the current year; IPOS is the number of IPOs in the current year. EARN SEN is percentile rank of the firm's price-earnings ratio; KZ is the financial constraint proxy developed by Kaplan and Zingales [1997]; AB RET is the firm's annual abnormal return; SIZE is the natural logarithm of the firm's market capitalization; ROA is the firm's operating income after depreciation scaled by average total assets; IPO is an indicator that equals 1 if the firm made an initial public offering in the current or preceding two years and 0 otherwise. Z-statistics appear in parentheses. ***, **, and * denote significance at the .01, .05, and .10 levels respectively.
Table 3, Panel A - Continued

40
MACRO MICRO FULLPE MKT 1.017 1.011
(1.33) (0.82)DEFAULT RISK 1.528*** 1.489***
(2.86) (3.06)GDP 1.011 1.010
(0.91) (0.93)SURPRISE 1.001 0.997
(0.06) (-0.22)SEC 0.883 0.739***
(-0.87) (-2.82)BS DETECT 0.827 0.882
(-0.54) (-0.58)IPOS 0.820 0.716***
(-1.58) (-3.22)EARN SEN 0.998 0.997
(-0.39) (-0.65)KZ 1.291*** 1.268***
(3.27) (3.40)AB RET 0.681 0.694
(-1.44) (-1.40)SIZE 1.197*** 1.198***
(2.70) (2.62)ROA 2.500* 2.806*
(1.71) (1.95)IPO 0.270 0.305
(-1.58) (-1.44)OBSERVATIONS 155,753 109,113 109,113FAILURES 78 68 68R-SQUARED 25 0.15 0.30CHI 2 - CROSS MODEL DIFFERENCE COMPARISONS P VALUEPE MKT Macro - PE MKT Full 0.518DEFAULT RISK Macro - DEFAULT RISK Full 0.464EARN SEN Micro - EARN SEN Full 0.813KZ Micro - KZ Full 0.317
Table 3Panel B: Survival Analysis - Balance Sheet Fraud
𝐵𝐵𝐼𝐼𝑖𝑖,𝑡𝑡 = 𝛽𝛽1𝑃𝑃𝑃𝑃 𝑀𝑀𝐾𝐾𝑀𝑀𝑡𝑡 + 𝛽𝛽2𝐷𝐷𝑃𝑃𝐶𝐶𝐴𝐴𝐷𝐷𝐷𝐷𝑀𝑀 𝑅𝑅𝐼𝐼𝐼𝐼𝐾𝐾𝑡𝑡 + 𝛽𝛽3𝐺𝐺𝐷𝐷𝑃𝑃𝑡𝑡 + 𝛽𝛽4𝐼𝐼𝐷𝐷𝑅𝑅𝑃𝑃𝑅𝑅𝐼𝐼𝐼𝐼𝑃𝑃𝑡𝑡 + 𝛽𝛽5𝐼𝐼𝑃𝑃𝐶𝐶𝑡𝑡 + 𝛽𝛽6𝐵𝐵𝐼𝐼 𝐷𝐷𝑃𝑃𝑀𝑀𝑃𝑃𝐶𝐶𝑀𝑀𝑡𝑡 + 𝛽𝛽7𝐼𝐼𝑃𝑃𝐼𝐼𝐼𝐼𝑡𝑡 + 𝛽𝛽8𝑃𝑃𝐴𝐴𝑅𝑅𝐸𝐸 𝐼𝐼𝑃𝑃𝐸𝐸𝑖𝑖,𝑡𝑡−1 + 𝛽𝛽9𝐾𝐾𝐾𝐾𝑖𝑖,𝑡𝑡−1 + 𝛽𝛽10𝐴𝐴𝐵𝐵 𝑅𝑅𝑃𝑃𝑀𝑀𝑖𝑖,𝑡𝑡−1 + 𝛽𝛽11𝐼𝐼𝐼𝐼𝐾𝐾𝑃𝑃𝑖𝑖,𝑡𝑡−1 + 𝛽𝛽12𝑅𝑅𝐼𝐼𝐴𝐴𝑖𝑖,𝑡𝑡−1 + 𝛽𝛽13𝐼𝐼𝑃𝑃𝐼𝐼𝑖𝑖,𝑡𝑡 + 𝜀𝜀𝑖𝑖,𝑡𝑡

41
Table 3, Panel B presents the results of Cox proportional hazards models estimating variants of equation (3). Equation (3) estimates the relation between balance sheet fraud and macro and firm-level determinants. The first column models macroeconomic variables; the second column models firm-level variables; the third column models macroeconomic and firm-level variables. PE MKT is the value-weighted annual market price-earnings ratio; DEFAULT RISK is the difference between the long term BAA corporate bond rate and the 10 year treasury bill rate; GDP is gross domestic product (inflation adjusted and expressed in 2005 $10s of billions) detrended using the Hodrick and Prescot [1997] filter; SURPRISE is the difference between actual GDP and expected GDP; SEC is the SEC’s annual budget appropriation; BS DETECT is the average time to detect BS frauds initiated in the current year; IPOS is the number of IPOs in the current year. EARN SEN is percentile rank of the firm's price-earnings ratio; KZ is the financial constraint proxy developed by Kaplan and Zingales [1997]; AB RET is the firm's annual abnormal return; SIZE is the natural logarithm of the firm's market capitalization; ROA is the firm's operating income after depreciation scaled by average total assets; IPO is an indicator that equals 1 if the firm made an initial public offering in the current or preceding two years and 0 otherwise. Z-statistics appear in parentheses. ***, **, and * denote significance at the .01, .05, and .10 levels respectively.
Table 3, Panel B - Continued

42
Variable P ValuePE MKT 0.029DEFAULT RISK 0.001EARN SEN 0.001KZ 0.002
Table 3, Panel C presents the P-values from Chi Squared tests comparing parameter estimates from a series of seemingly unrelated estimations. PE MKT is the value-weighted annual market price-earnings ratio; DEFAULT RISK is the difference between the long term BAA corporate bond rate and the 10 year treasury bill rate. EARN SEN is the percentile rank of the firm's price-earnings ratio; KZ is the financial constraint proxy developed by Kaplan and Zingales [1997].
Panel C: Coefficient Comparisons from Seemingly Unrelated EstimationsTable 3
Income Statement Frauds Compared to Balance Sheet Frauds

43
IS FRAUD BS FRAUDPE MKT 1.143*** 1.041
(3.62) (1.12)DEFAULT RISK 0.595 1.247**
(-0.54) (2.05)GDP 1.046** 0.994
(2.23) (-0.25)SURPRISE 1.003 0.998
(0.10) (-0.05)SEC 0.808 0.643**
(-1.50) (-2.11)IS/BS DETECT 4.422*** 0.534
(3.19) (-0.72)IPOS 1.965*** 1.087
(3.44) (0.43)EARN SEN 1.006** 1.002
(2.48) (1.04)KZ 1.106 1.424***
(1.04) (2.81)AB RET 1.182 0.795
(1.15) (-1.54)SIZE 2.061*** 1.891***
(11.17) (5.60)ROA 0.984 0.172**
(-0.02) (-2.06)IPO 2.878 2.013
(1.49) (1.39)OBSERVATIONS 109,113 109,113FAILURES 62 28R-SQUARED 0.61 0.21CHI 2 - CROSS MODEL DIFFERENCE COMPARISONS P VALUEPE MKT IS - PE MKT BS 0.008DEFAULT RISK IS - DEFAULT RISK BS 0.001EARN SEN IS - EARN SEN BS 0.041KZ IS - KZ BS 0.035
Table 4Survival Analysis - Class Action Lawsuit Sample
𝐼𝐼𝐼𝐼|𝐵𝐵𝐼𝐼𝑖𝑖,𝑡𝑡 = 𝛽𝛽1𝑃𝑃𝑃𝑃 𝑀𝑀𝐾𝐾𝑀𝑀𝑡𝑡 + 𝛽𝛽2𝐷𝐷𝑃𝑃𝐶𝐶𝐴𝐴𝐷𝐷𝐷𝐷𝑀𝑀 𝑅𝑅𝐼𝐼𝐼𝐼𝐾𝐾𝑡𝑡 + 𝛽𝛽3𝐺𝐺𝐷𝐷𝑃𝑃𝑡𝑡 + 𝛽𝛽4𝐼𝐼𝐷𝐷𝑅𝑅𝑃𝑃𝑅𝑅𝐼𝐼𝐼𝐼𝑃𝑃𝑡𝑡 + 𝛽𝛽5𝐼𝐼𝑃𝑃𝐶𝐶𝑡𝑡 + 𝛽𝛽6𝐷𝐷𝑃𝑃𝑀𝑀𝑃𝑃𝐶𝐶𝑀𝑀𝑡𝑡 + 𝛽𝛽7𝐼𝐼𝑃𝑃𝐼𝐼𝐼𝐼𝑡𝑡 + 𝛽𝛽8𝑃𝑃𝐴𝐴𝑅𝑅𝐸𝐸 𝐼𝐼𝑃𝑃𝐸𝐸𝑖𝑖,𝑡𝑡−1 + 𝛽𝛽9𝐾𝐾𝐾𝐾𝑖𝑖,𝑡𝑡−1 + 𝛽𝛽10𝐴𝐴𝐵𝐵 𝑅𝑅𝑃𝑃𝑀𝑀𝑖𝑖,𝑡𝑡−1 + 𝛽𝛽11𝐼𝐼𝐼𝐼𝐾𝐾𝑃𝑃𝑖𝑖,𝑡𝑡−1 + 𝛽𝛽12𝑅𝑅𝐼𝐼𝐴𝐴𝑖𝑖,𝑡𝑡−1 + 𝛽𝛽13𝐼𝐼𝑃𝑃𝐼𝐼𝑖𝑖,𝑡𝑡 + 𝜀𝜀𝑖𝑖,𝑡𝑡

44
Table 4 - Continued
Table 4 presents the results of Cox proportional hazards models estimating variants of equations (2) and (3) using a sample of firms subject to class action lawsuits. Equation (2) estimates the relation between income statement fraud and macro and firm-level determinants. Equation (3) estimates the same relation but for balance sheet fraud. The first column models income statement fraud; the second column models balance sheet fraud. PE MKT is the value-weighted annual market price-earnings ratio; DEFAULT RISK is the difference between the long term BAA corporate bond rate and the 10 year treasury bill rate; GDP is gross domestic product (inflation adjusted and expressed in 2005 $10s of billions) detrended using the Hodrick and Prescot [1997] filter; SURPRISE is the difference between actual GDP and expected GDP; SEC is the SEC’s annual budget appropriation; IS DETECT is the average time to detect IS frauds initiated in the current year; IPOS is the number of IPOs in the current year. EARN SEN is the percentile rank of the firm's price-earnings ratio; KZ is the financial constraint proxy developed by Kaplan and Zingales [1997]; AB RET is the firm's annual abnormal return; SIZE is the natural logarithm of the firm's market capitalization; ROA is the firm's operating income after depreciation scaled by average total assets; IPO is an indicator that equals 1 if the firm made an initial public offering in the current or preceding two years and 0 otherwise. Z-statistics appear in parentheses. ***, **, and * denote significance at the .01, .05, and .10 levels respectively.
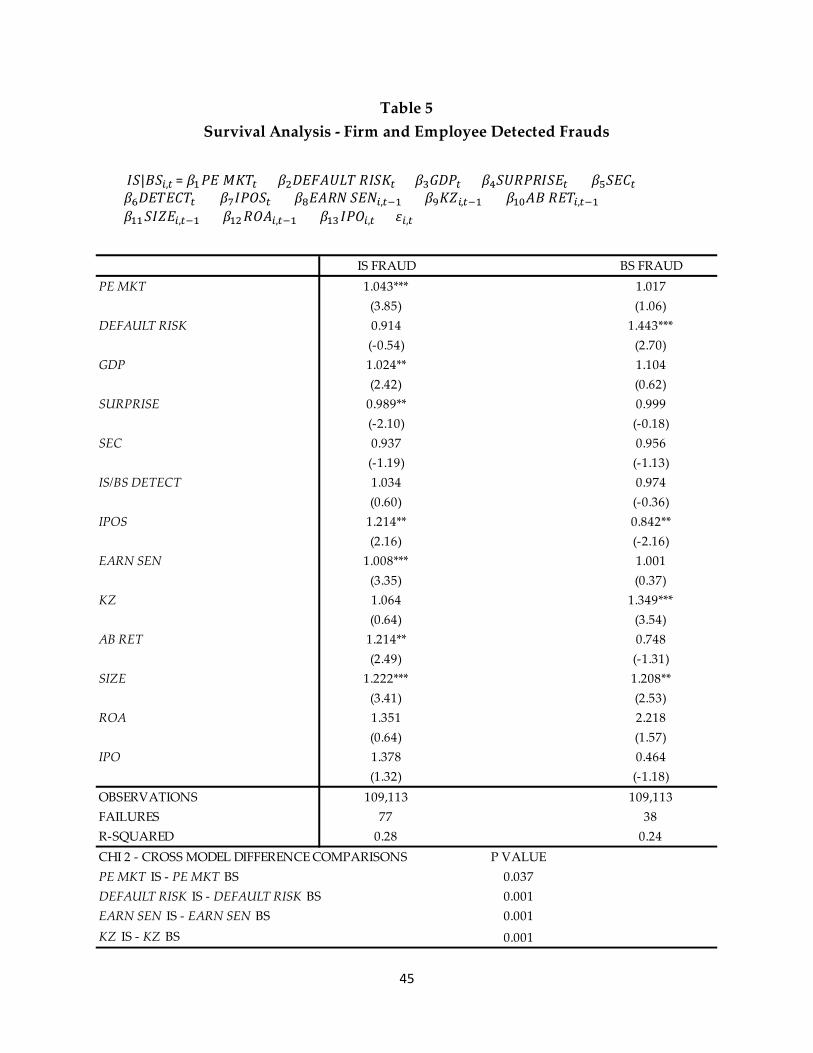
45
IS FRAUD BS FRAUDPE MKT 1.043*** 1.017
(3.85) (1.06)DEFAULT RISK 0.914 1.443***
(-0.54) (2.70)GDP 1.024** 1.104
(2.42) (0.62)SURPRISE 0.989** 0.999
(-2.10) (-0.18)SEC 0.937 0.956
(-1.19) (-1.13)IS/BS DETECT 1.034 0.974
(0.60) (-0.36)IPOS 1.214** 0.842**
(2.16) (-2.16)EARN SEN 1.008*** 1.001
(3.35) (0.37)KZ 1.064 1.349***
(0.64) (3.54)AB RET 1.214** 0.748
(2.49) (-1.31)SIZE 1.222*** 1.208**
(3.41) (2.53)ROA 1.351 2.218
(0.64) (1.57)IPO 1.378 0.464
(1.32) (-1.18)OBSERVATIONS 109,113 109,113FAILURES 77 38R-SQUARED 0.28 0.24CHI 2 - CROSS MODEL DIFFERENCE COMPARISONS P VALUEPE MKT IS - PE MKT BS 0.037DEFAULT RISK IS - DEFAULT RISK BS 0.001EARN SEN IS - EARN SEN BS 0.001KZ IS - KZ BS 0.001
Table 5Survival Analysis - Firm and Employee Detected Frauds
𝐼𝐼𝐼𝐼|𝐵𝐵𝐼𝐼𝑖𝑖,𝑡𝑡 = 𝛽𝛽1𝑃𝑃𝑃𝑃 𝑀𝑀𝐾𝐾𝑀𝑀𝑡𝑡 + 𝛽𝛽2𝐷𝐷𝑃𝑃𝐶𝐶𝐴𝐴𝐷𝐷𝐷𝐷𝑀𝑀 𝑅𝑅𝐼𝐼𝐼𝐼𝐾𝐾𝑡𝑡 + 𝛽𝛽3𝐺𝐺𝐷𝐷𝑃𝑃𝑡𝑡 + 𝛽𝛽4𝐼𝐼𝐷𝐷𝑅𝑅𝑃𝑃𝑅𝑅𝐼𝐼𝐼𝐼𝑃𝑃𝑡𝑡 + 𝛽𝛽5𝐼𝐼𝑃𝑃𝐶𝐶𝑡𝑡 + 𝛽𝛽6𝐷𝐷𝑃𝑃𝑀𝑀𝑃𝑃𝐶𝐶𝑀𝑀𝑡𝑡 + 𝛽𝛽7𝐼𝐼𝑃𝑃𝐼𝐼𝐼𝐼𝑡𝑡 + 𝛽𝛽8𝑃𝑃𝐴𝐴𝑅𝑅𝐸𝐸 𝐼𝐼𝑃𝑃𝐸𝐸𝑖𝑖,𝑡𝑡−1 + 𝛽𝛽9𝐾𝐾𝐾𝐾𝑖𝑖,𝑡𝑡−1 + 𝛽𝛽10𝐴𝐴𝐵𝐵 𝑅𝑅𝑃𝑃𝑀𝑀𝑖𝑖,𝑡𝑡−1 + 𝛽𝛽11𝐼𝐼𝐼𝐼𝐾𝐾𝑃𝑃𝑖𝑖,𝑡𝑡−1 + 𝛽𝛽12𝑅𝑅𝐼𝐼𝐴𝐴𝑖𝑖,𝑡𝑡−1 + 𝛽𝛽13𝐼𝐼𝑃𝑃𝐼𝐼𝑖𝑖,𝑡𝑡 + 𝜀𝜀𝑖𝑖,𝑡𝑡

46
Table 5 - Continued
Table 5 presents the results of Cox proportional hazards models estimating variants of equations (2) and (3) using a sample of firms for which managers or employees of the firm uncovered fraud. Equation (2) estimates the relation between income statement fraud and macro and firm-level determinants. Equation (3) estimates the same relation but for balance sheet fraud. The first column models income statement fraud; the second column models balance sheet fraud. PE MKT is the value-weighted annual market price-earnings ratio; DEFAULT RISK is the difference between the long term BAA corporate bond rate and the 10 year treasury bill rate; GDP is gross domestic product (inflation adjusted and expressed in 2005 $10s of billions) detrended using the Hodrick and Prescot [1997] filter; SURPRISE is the difference between actual GDP and expected GDP; SEC is the SEC’s annual budget appropriation; IS DETECT is the average time to detect IS frauds initiated in the current year; IPOS is the number of IPOs in the current year. EARN SEN is the percentile rank of the firm's price-earnings ratio; KZ is the financial constraint proxy developed by Kaplan and Zingales [1997]; AB RET is the firm's annual abnormal return; SIZE is the natural logarithm of the firm's market capitalization; ROA is the firm's operating income after depreciation scaled by average total assets; IPO is an indicator that equals 1 if the firm made an initial public offering in the current or preceding two years and 0 otherwise. Z-statistics appear in parentheses. ***, **, and * denote significance at the .01, .05, and .10 levels respectively.

47
1986-1991 1992-2000 2001-2010
EARN SEN 0.996* 1.007*** 1.001
(-1.86) (3.14) (0.36)
KZ 1.340*** 1.081 1.228***
(3.45) (1.20) (2.74)
AB RET 1.206 1.237*** 0.992
(0.43) (2.90) (-0.06)
SIZE 0.980 1.325*** 1.077
(-0.16) (6.59) (1.39)
ROA 9.260* 1.194 2.175
(1.79) (0.41) (1.37)
IPO 0.691 0.942 1.999
(-0.42) (-0.20) (1.39)
OBSERVATIONS 13,139 48,911 47,063
FAILURES 30 162 110
R-SQUARED 0.09 0.20 0.10
Table 6Survival Analysis By Time Period
Table 6 presents the results of Cox proportional hazards models estimating equation (4). Equation (4) estimates the relation between fraud and firm-level determinants. The first column models 1986-1991; the second column models 1992-2000; the third column models 2001-2010. EARN SEN is the percentile rank of the firm's price-earnings ratio; KZ is the financial constraint proxy developed by Kaplan and Zingales [1997]; AB RET is the firm's annual abnormal return; SIZE is the natural logarithm of the firm's market capitalization; ROA is the firm's operating income after depreciation scaled by average total assets; IPO is an indicator that equals 1 if the firm made an initial public offering in the current or preceding two years and 0 otherwise. Z-statistics appear in parentheses. ***, **, and * denote significance at the .01, .05, and .10 levels respectively.
YEARS
𝐶𝐶𝑅𝑅𝐴𝐴𝐷𝐷𝐷𝐷𝑖𝑖,𝑡𝑡 = 𝛽𝛽1𝑃𝑃𝐴𝐴𝑅𝑅𝐸𝐸 𝐼𝐼𝑃𝑃𝐸𝐸𝑖𝑖,𝑡𝑡−1 + 𝛽𝛽2𝐾𝐾𝐾𝐾𝑖𝑖,𝑡𝑡−1 + 𝛽𝛽3𝐴𝐴𝐵𝐵 𝑅𝑅𝑃𝑃𝑀𝑀𝑖𝑖,𝑡𝑡−1 + 𝛽𝛽4𝐼𝐼𝐼𝐼𝐾𝐾𝑃𝑃𝑖𝑖,𝑡𝑡−1 + 𝛽𝛽5𝑅𝑅𝐼𝐼𝐴𝐴𝑖𝑖,𝑡𝑡−1 + 𝛽𝛽6𝐼𝐼𝑃𝑃𝐼𝐼𝑖𝑖,𝑡𝑡 + 𝜀𝜀𝑖𝑖,𝑡𝑡

48
Full Sample Pre 2000 Post 1999
IND 0.991 0.978*** 1.013
(-1.35) (-3.13) (1.59)
EARN SEN 1.003 1.005** 1.001
(1.56) (2.37) (0.46)
KZ 1.203** 1.165* 1.250*
(2.21) (1.88) (1.91)
AB RET 1.142 1.133 1.193
(0.99) (0.64) (1.12)
SIZE 1.557*** 1.709*** 1.397***
(5.58) (5.32) (2.58)
ROA 0.218* 0.523 0.105**
(-1.90) (-0.53) (-2.18)
OBSERVATIONS 17,838 17,575 17,680
FAILURES 93 51 42
R-SQUARED 0.24 0.35 0.25
Table 7Survival Analysis By Time Period: Board Independence
YEARS
Table 7 presents the results of Cox proportional hazards models estimating equation (4). Equation (4) estimates the relation between fraud and firm-level determinants. The first column models the full sample; the second column models through 1999; the third column models after 1999. IND is the percentage of independent directors on the firm's board of directors. EARN SEN is the percentile rank of the firm's price-earnings ratio; KZ is the financial constraint proxy developed by Kaplan and Zingales [1997]; AB RET is the firm's annual abnormal return; SIZE is the natural logarithm of the firm's market capitalization; ROA is the firm's operating income after depreciation scaled by average total assets. Z-statistics appear in parentheses. ***, **, and * denote significance at the .01, .05, and .10 levels respectively.
𝐶𝐶𝑅𝑅𝐴𝐴𝐷𝐷𝐷𝐷𝑖𝑖,𝑡𝑡 = 𝛽𝛽1𝐼𝐼𝐸𝐸𝐷𝐷𝑖𝑖,𝑡𝑡−1 + 𝛽𝛽2𝑃𝑃𝐴𝐴𝑅𝑅𝐸𝐸 𝐼𝐼𝑃𝑃𝐸𝐸𝑖𝑖,𝑡𝑡−1 + 𝛽𝛽3𝐾𝐾𝐾𝐾𝑖𝑖,𝑡𝑡−1 + 𝛽𝛽4𝐴𝐴𝐵𝐵 𝑅𝑅𝑃𝑃𝑀𝑀𝑖𝑖,𝑡𝑡−1 + 𝛽𝛽5𝐼𝐼𝐼𝐼𝐾𝐾𝑃𝑃𝑖𝑖,𝑡𝑡−1 + 𝛽𝛽6𝑅𝑅𝐼𝐼𝐴𝐴𝑖𝑖,𝑡𝑡 + 𝜀𝜀𝑖𝑖,𝑡𝑡