Embed Size (px)
Citation preview

Income of Retirement-Aged Persons in the United States by Martynas A. Yeas and Susan Grad*
This article reviews the composition and level of retirement income in the United States and how this has changed over time, focusing on two overlapping but distinct groups-the entire population aged 65 or older, and recent retirees. Changes in the composition of income of the aged over the past 20-30 years, including greatly expanded Social Security and pension coverage and an increasing number of persons with retirement savings, have improved the economic status of the aged not only in comparison with the aged in earlier years, but also in comparison with younger adults who derive most of their income from earnings. New retired workers are better off than the total aged population in several respects. The younger cohorts now in the labor force will spend more of their working lives in the more favorable conditions now present than was true of past new beneficiaries or the aged as a whole. It is, therefore, not unreasonable. to expect that to- day’s workers will enjoy more and larger pensions and in- creased income from savings to supplement their Social Security benefits when they retire.
Fifty years ago, the Social Security Act established a national system that would collect a share of workers’ earnings and pay them benefits in old age. The social insurance features of the program, later ex- panded to provide other benefits, including disability income and ,health insurance, have transformed the economic status of older Americans. The number of Social Security beneficiaries has grown from less than 1 percent of the aged population in 1940 to over 90 percent today, and Social Security payments are now the largest single component of the income of the aged. At the same time, major changes have affected their income from other sources.
This article reviews what is known today about the composition and level of retirement income and how this has changed over time, with a particular empha-
*Program Analysis Staff, Office of Research and Statistics, Office of Policy, Social Security Administration. This article is adapted from a paper presented in Baltimore, Maryland, at an ex- pert group meeting sponsored by the International Social Security Association on May 6-8, 1986. The proceedings of the meetings were published in Conjugating Public and Private: The Case of Pensions (Studies and Research No. 24) International Social Secu- rity Association, Geneva, 1987.
sis on the role of Social Security retired-worker benefits. It focuses on two overlapping but distinct groups. The first section examines the entire elderly population of persons aged 65 or older, which in- cludes persons who retired at widely different times. The second section deals with recent retirees- persons, regardless of age, who have just begun receiving Social Security retired-worker benefits.
The Social Security System in Brief The national Old-Age, Survivors, and Disability In-
surance (OASDI) program, popularly called Social Security, is the largest and most important social in- surance program in the United States. It is financed on a pay-as-you-go basis through payroll taxes paid by employees, their employers, and the self-employed. These are used to provide cash benefits that replace part of the income lost after workers retire, die, or suffer severe long-term disability. Additional auxiliary Social Security benefits have been extended to wives, certain divorced wives, children, and disabled adult children of retired and disabled workers; and to sur- viving widows, divorced spouses, children, and depen-
Social Security Bulletin, July 1987/Vol. 50, No. 7 5

dent parents of deceased-worker beneficiaries. All auxiliary benefits are available to men and women on the same terms, though in practice few men find them advantageous.
Benefits are payable as a matter of statutory right without regard to personal need or level of nonwork income. To qualify for them, workers must acquire “insured status” by earning at least a minimum amount during a specified number of quarters in jobs covered by Social Security. When established in 1935, the program covered only employees in commerce and industry, but mandatory coverage had been extended to 91 percent of all workers by 1984. The major re- maining groups of noncovered workers are railroad employees (covered under a separate, parallel system), Federal civilian employees hired before 1983, and em- ployees of certain State and local governments that have chosen not to participate in the system.
The size of benefits is an indirect function of the amount of Social Security taxes previously paid on covered earnings. It is computed as a percentage of average earnings over the period when the applicant could reasonably have been expected to work in covered employment. The benefit formula is weighted in favor of persons with a history of low earnings, on the assumption that they have a smaller margin for reduction in income.
The full retirement benefit calculated by the formu- la is payable at age 65. However, workers have the op- tion of retiring at age 62 (and widows and widowers as early as age 60). Although recent legislation has at- tempted to encourage later retirement, the early retire- ment benefit option has become very popular, so that retirement as late as age 65 is becoming somewhat unusual. This is having an impact on the income of the elderly because benefits taken before age 65 are actuarially reduced to equalize estimated lifetime So- cial Security income. Thus, workers retiring at age 62 are paid only 80 percent of their “primary insurance amount!’ Workers who choose to take their benefits late, after age 65, receive a proportionally smaller augmentation of the full amount, currently equivalent to 3 percent for each year deferred up to age 70.
It should be emphasized that receipt of old-age benefits is by no means synonymous with “retire- ment” in a labor-force sense. Beneficiaries can earn a substantial amount without any reduction in benefits (in 1985, up to $7,320 for persons aged 65-69 and $5,400 for persons under age 65), and benefits are reduced by only $1 for every $2 in earnings above the exempt amounts. Moreover, benefits are not reduced for any earnings at ages 70 or older.
The aged population includes many persons who began receiving benefits that reflect earlier, somewhat different versions of the benefit computation formula, delayed retirement credit, earnings offsets, etc., and
the Social Security Act includes a schedule of further gradual changes that will significantly affect workers retiring in the years to come. Their general purpose is to counteract the growing ratio of retired to active workers. Among these provisions are gradual increases in the age at which full benefits are payable from 65 to 67, substantially larger credits for delayed retirement, and diminished offsets for earnings after benefits begin.
The Total Aged Population
Changing Sources of Income for the Aged Social Security payments have had an increasing
impact on the income of the elderly for two reasons-more and more of the elderly are receiving payments, and the average payments have become larger in real terms. Past extensions in the range of jobs covered by Social Security have made receipt of some Social Security benefits almost universal. In 1984, 91 percent of aged units (couples or single per- sons) received benefits, compared with only 69 per- cent in 1962 (table 1). The real value of these benefits has also risen considerably more rapidly than con- sumer prices: In constant 1984 dollars, the average monthly benefit for retired workers grew from $257 in 1960 to $461 in 1984.
Amounts rose despite a great increase in the proportion of benefits actuarially reduced because they were claimed before age 65. Between 1961-when men were first eligible to claim early benefits-and 1984, the percentage with reduced benefits rose from 5 percent to 59 percent. Between 1956-when women
Table I.-Percentage of aged units with income from various sources and shares of aggregate income from these sources, 1962 and 1984
Income source
Percentage of units with income from: Social Security.. Private pensions. Government employee pensions. Assets Earnings
Share of aggregate income provided by Social Security.. Private pensions.. Government employee pensions. Assets Earnings.........................
-1984 1962 1
69 91 9 24 5 14
54 68 36 21
31 38 3 6 6 7
16 28 28 16
Sources: Lenore Epstein and Janet Murray, The Aged Popula- tion of the United States: The 1963 Social Security Survey of the Aged (Research Report No. 19). Office of Research and Statistics, Social Security Administration, 1967, and Susan Grad, Income of the Population 55 and Over, 1984, Office of Research, Statistics, and International Policy, Office of Policy, Social Security Ad- ministration, December 1985.
6 Social Security Bulletin, July 1987/Vol. 50, No. 7

first became eligible-and 1984, the percentage rose from 8 percent to 71 percent. If conversions of disa- bled workers to retired status at age 65 are taken into account, the proportion actually waiting until age 65 for their first benefits is even smaller.
The combined effect of more widely available and larger benefits is that Social Security has become a more important component of total income. Social Security accounted for 38 percent of aggregate in- come of the aged in 1984, compared with 31 percent in 1962. Because much of the aggregate income of the elderly is received by a relatively small minority, So- cial Security payments play an even more important part for many beneficiaries. In 1984, it provided the majority of the income received by 62 percent of them (table 2). Social Security is the only source of income for 1 beneficiary in 7, and accounts for almost all the income (90 percent or more) for about 1 in 4.
However, Social Security old-age benefits were never intended to be the sole source of support in retirement, but rather to supplement pensions and as- sets acquired during working life. Assets have indeed become an increasingly important source of income for the elderly. The proportion with at least some as- set income rose from 54 percent to 68 percent be- tween 1962 and 1984, and the share of aggregate income from assets increased from 16 percent to 28 percent, second only to Social Security payments.
Private pension income has increased even more rapidly than asset income among the elderly. Both in order to benefit workers and to promote capital for- mation, Federal policy has actively encouraged the ex- pansion of private pension plans since the Revenue Act of 1942. The most important of a series of subse-
Table 2.-Social Security’ as a proportion of total cash income: Percentage distribution of aged units, by marital status, 1984
Proportion of inco?me Married Nonmarried (recipients only) All units couples persons
Number (in thousands). 18,682 7,598 11,084 Total percent. 100 100 100
l-19.......................... 9 13 6 20.39......................... 18 24 15 40-59......................... 22 24 20 60.79......................... 19 19 19 80 or more.................... 32 20 40
50 or more.................. 62 51 69 90 or more.................. 4 14 31 loo......................... 4 I 19
‘Social Security beneficiaries may be receiving retired-worker benefits, dependents’ or survivors’ benefits, transitionally insured, or:special age-72 benefits.
Units with zero or negative total income and units with a per- son receiving both Social Security and Railroad Retirement benefits are excluded.
Social Security Bulletin, July 19871Vol. 50, No. 7 7
quent laws was the Employee Retirement Income Security Act (ERISA) of 1974, which was intended to ensure the viability of pension plans by setting mini- mum standards of administration and fiscal responsi- bility, and to increase the number of workers with pension coverage by setting vesting limits and pro- hibiting exclusion or differential treatment of most classes of employees.
These changes have had a considerable cumulative impact. Almost three times as many aged couples and single persons received employer pensions in 1984 as in 1962-24 percent of the aged had pensions from private former employers and 14 percent had pensions earned as former employees of Federal, State, or local governments. The share of aggregate income from pri- vate pensions doubled during this interval, while the share from public employee pensions remained about the same.
The one major component of income among the aged that has been declining is earnings. This reflects a consistent, long-term trend away from labor-force participation among older persons, including those below the normal retirement age. In 1962, 36 percent of the aged had earnings, but this had fallen to 21 percent by 1984. Income from earnings accounted for only 16 percent of the aggregate income in the latter year.
A fifth type of income, means-tested transfer pay- ments, is of relatively little importance to most of the elderly. The main program providing money income to the elderly on the basis of need has been the Sup- plemental Security Income (SSI) program, which in 1974 consolidated under Federal administration vari- ous earlier State-run programs assisting the blind, dis- abled, and elderly. It provides a supplement to small Social Security benefits or an alternative payment for nonbeneficiaries to provide a minimum income level. As the Social Security system has matured (that is, as more and more persons have worked longer in covered employment), the importance of means-tested transfers has declined among the elderly. In 1940, this type of income was received by 22 percent of the population aged 65 or older, but the rate fell to 14 percent in 1960 and to only 7 percent in 1983 (table 3). In 1983, SSI was somewhat more important for single persons (11 percent had some) but accounted for only 2 percent of aggregate cash income even in this group. All other miscellaneous cash transfers ac- counted for only 1 percent.
However, a focus on cash income does tend to underemphasize the importance of need-based as- sistance. During the past two decades, indirect and in- kind forms of assistance have come to play a larger role. The most important of these benefits are medi- cal care paid for by the Medicaid program, Food Stamps (banknote-like coupons that can be used to

purchase food items), and free or subsidized public housing. Even these were received, respectively, by only 13.7 percent, 7 percent, and 6 percent of elderly households in 1983.
Table 3.-Persons aged 65 or older receiving Social Security’ or Supplemental Security Income (SSI), 1940-83
Number of the aged (per thousands)’ receiving-
Year OASDI sst
1940 (June). 7 217 1945 (June). 62 194 1950 (February). . 164 224 1955 (February). 394 179 1960 (February). 616 141 1965 (February). 752 117 1970 (February). 855 104 1975 (December). 904 111 1980 (December). 914 87 1981 (December). _. ‘912 81 1982 (December). 913 75 1983 (December). 918 73
‘Social Security beneficiaries may be receiving retired-worker benefits, dependents’ or survivors’ benefits, transitionally insured, or2special age-72 benefits.
Population data on which ratio is based furnished by the Bureau of the Census. Data not adjusted for errors of coverage and of age misreporting.
For 1940-73, data refer to Old-Age Assistance program. Begin- ning January 1974, the Supplemental Security Income program su- perseded the Old-Age Assistance progam in the 50 States and the Di$rict of Columbia.
Based on IO-percent sample. Source: Annual Statistical Supplement to the Social Security
Bulletin, 1984-85, table 168.
The Current Composition of the Income of the Elderly
The aged are an economically diverse group. Their median total income was $10,170 in 1984, but 19 per-
cent had incomes of less than $5,000 (approximately the official poverty threshold for a single person aged 65 or older) and 22 percent had incomes of $20,000 or more (table 4). Aged couples generally have larger incomes than aged single persons; the married-couple median income is two-and-a-half times as great as the single median ($17,250, compared with $6,690).
Many of these income differences reflect variations in the composition of total income. The relatively well-off elderly received 39 percent of their aggregate income from assets and 15 percent from pensions provided by former public and private employers. These sources accounted for a negligible 4 percent and 2 percent of the aggregate income among the relatively poor elderly. On the other hand, Social Security accounted for most of the income of the relatively poor (77 percent), with Public Assistance payments (primarily SSI) providing much of the re- mainder. Social Security provided only 20 percent of the income of the relatively well-off and Public As- sistance virtually none.
While asset income and Public Assistance are im- portant at the extremes of the income distribution, the main determinants of income differences for most of the elderly population are earnings, Social Security, and employer pensions. Which of these three forms of income they receive greatly affects their average to- tal money income (table 5). Nearly half (46 percent) of all aged persons and couples receive only Social Security, and their median annual incomes of $6,270 are comparatively low. Only the very small group (4 percent of aged units) with neither work, pensions, nor Social Security have an even smaller median in- come. About one-third of aged units also have no earnings but receive a higher cash income from an employer pension instead of Social Security ($11,430) or in addition to Social Security ($14,400).
Only about 1 in 5 aged units receives any earnings.
Table 4.-Shares of aggregate income of aged units 65 or older, by levels of total money income: Percentage distribution of money income from various sources, 1984
Income source
Number (in thousands). Total percent..
Percentage of income from: Retirement benefits.
Social Security.. Railroad Retirement.. Government employee pensions.. Private pensions or annuities..
Earnings......................................... Income from assets., Public Assistance.. Other............................................
Total
20,790 100
53 38
1 7 6
16 28
1 2
Less than $10,000- $20,000- $5,000 $5,000-$9,999 $19,999 or more
4,044 6,220 5,910 4,617 100 100 100 loo
80 81 67 37 77 71 48 20
1 1 1 0 1 3 7 9 1 4 9 6 0 4 10 23 4 10 21 39
14 3 0 0 2 3 2 1
Source: Current Population Survey, March 1985.
8 Social Security Bulletin, July 19871Vol. 50, No. 7
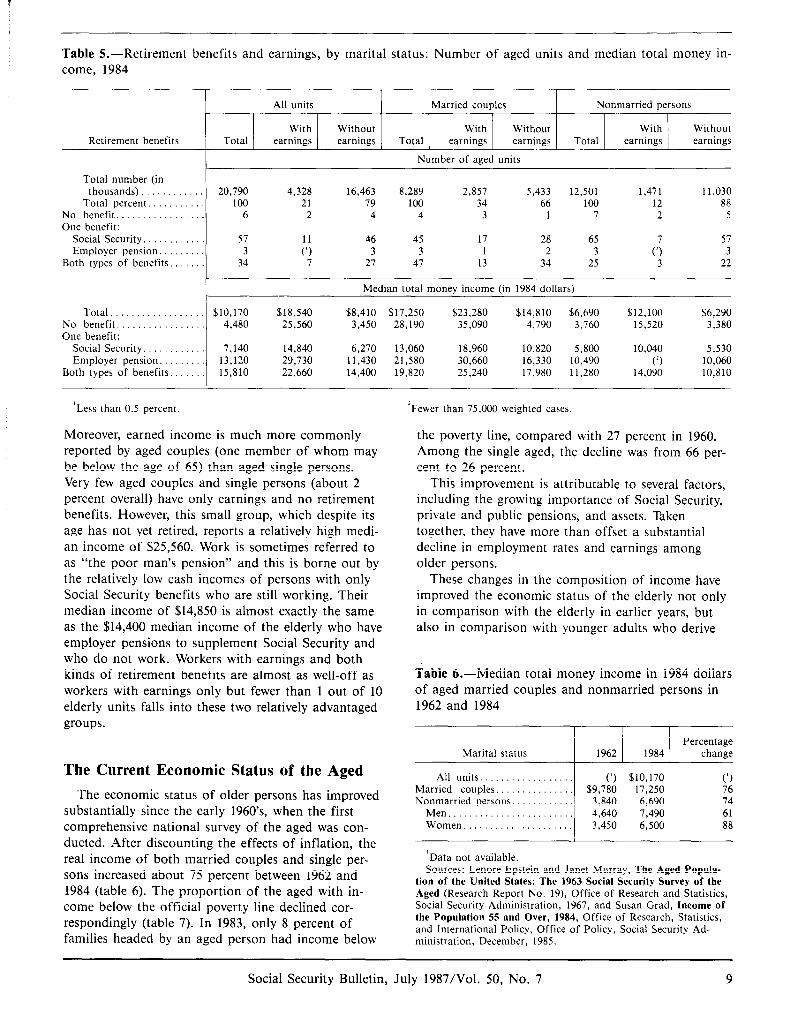
Table 5.-Retirement benefits and earnings, by marital status: Number of aged units and median total money in- come, 1984
Retirement benefits Total
All units
With earnings
Without earnings
Married couples
With Without Total earnings earnings
Number of aged units
Nonmarried persons
With Without Total earnings earnings
Total number (in thousands) 20,790 4,328 16,463 8,289 2,857 5,433 12,501 1,471 11,030
Total percent.. 100 21 79 100 34 66 100 12 88 No benefit.. 6 2 4 4 3 I 7 2 5 One benefit:
Social Security. 57 46 45 17 28 65 57 Employer pension. 3 t\‘, 3 3 1 2 3 c: 3
Both of benefits.. types 34 I 27 47 13 34 25 3 22
Median total money income (in 1984 dollars)
Total.. $10,170 $18,540 $8,410 $17,250 $23,280 $14,810 $6,690 $12,100 $6,290 No benefit. 4,480 25,560 3,450 28,190 35,090 4,190 3,760 15,520 3,380 One benefit:
Social Security. 7,140 14,840 6,270 13,060 18,960 10,820 5,800 10,040 5,530 Employer pension. 13,120 29,730 11,430 21,580 30,660 16,330 10,490 (7 10,060
Both of benefits. types 15,810 22,660 14,400 19,820 25,240 17,980 11,280 14,090 10,810
‘Less than 0.5 percent. ‘Fewer than 75,000 weighted cases.
Moreover, earned income is much more commonly reported by aged couples (one member of whom may be below the age of 65) than aged single persons. Very few aged couples and single persons (about 2 percent overall) have only earnings and no retirement benefits. However, this small group, which despite its age has not yet retired, reports a relatively high medi- an income of $25,560. Work is sometimes referred to as “the poor man’s pension” and this is borne out by the relatively low cash incomes of persons with only Social Security benefits who are still working. Their median income of $14,850 is almost exactly the same as the $14,400 median income of the elderly who have employer pensions to supplement Social Security and who do not work. Workers with earnings and both kinds of retirement benefits are almost as well-off as workers with earnings only but fewer than 1 out of 10 elderly units falls into these two relatively advantaged groups.
The Current Economic Status of
The economic status of older persons
the Aged
has improved substantially since the early 1960’s, when the first comprehensive national survey of the aged was con- ducted. After discounting the effects of inflation, the real income of both married couples and single per- sons increased about 75 percent between 1962 and 1984 (table 6). The proportion of the aged with in- come below the official poverty line declined cor- respondingly (table 7). In 1983, only 8 percent of families headed by an aged person had income below
the poverty line, compared with 27 percent in 1960. Among the single aged, the decline was from 66 per- cent to 26 percent.
This improvement is attributable to several factors, including the growing importance of Social Security, private and public pensions, and assets. Taken together, they have more than offset a substantial decline in employment rates and earnings among older persons.
These changes in the composition of income have improved the economic status of the elderly not only in comparison with the elderly in earlier years, but also in comparison with younger adults who derive
Table 6.-Median total money income in 1984 dollars of aged married couples and nonmarried persons in 1962 and 1984
Percentage Marital status 1962 1984 change
Ail units.. (1) $10,170 (‘) Married couples. $9,780 17,250 76 Nonmarried persons. 3,840 6,690 74
Men........................ 4,640 7,490 61 Women..................... 3,450 6,500 88
‘Data not available. Sources: Lenore Epstein and Janet Murray, The Aged Popula-
tion of the United States: The 1963 Social Security Survey of the Aged (Research Report No. 19), Office of Research and Statistics, Social Security Administration, 1967, and Susan Grad, Income of the Population 55 and Over, 1984, Office of Research, Statistics, and International Policy, Office of Policy, Social Security Ad- ministration, December, 1985.
Social Security Bulletin, July 1987/Vol. 50, No. 7 9

Table 7.-Aged families and unrelated individuals with income below the poverty line, 1960 and 1983
Percentage below poverty line
Family status 1960 1983
Families 21 8 Headed by men. 26 7 Headed by women. 31 17
Unrelated individuals. 66 26 Men.................. 60 22 Women............... 68 28
Source: Bureau of the Census, “Characteristics of the Popula- tion Below the Poverty Level,” Current Population Reports (Series P-60), various years.
most of their income from earnings. Social Security benefits received two substantial ad hoc increases of 10 percent and 20 percent in the early 1970’s, and were then indexed to maintain their purchasing power relative to consumer prices; moreover, with recent and limited exceptions, they have been tax free. Over the period, most government employee pensions have also been indexed, though not tax free. By comparison, earned income was subject to taxation and did not keep pace with inflation during much of the 1970’s.
As a result, the gap between the incomes of the elderly and nonelderly, which had widened between 1960 and 1970, has narrowed or disappeared. When mean income is compared, households with an aged head still have less than 52 percent as much money income as other families, but aged households contain considerably fewer persons on average. When income is calculated on a per capita basis, most of the gap disappears and ratio of the elderly to nonelderly money incomes is about 90 percent. When the narrow cash definition of money income is broadened in vari- ous ways, the relative position of the elderly improves consistently (table 8).
The relative position of the elderly is better with respect to disposable income than to total money in- come because most of Social Security benefits, a major income component only among the elderly, are not subject to taxation; moreover, the elderly are treated favorably in other ways by the tax system. Counting the market value of public in-kind benefits also improves their position because by far the most important of these benefits is the Medicare program, which provides insurance to almost everyone aged 65 or older. Because the elderly are more likely to own their own homes, the inclusion of implicit rental value of housing also improves their standing. The only major adjustment that lowers the apparent relative position of the elderly is the addition of the value of noncash employee benefits, since the elderly are con- siderably less likely to work. None of these adjust- ments, however, is as important as the simple
distinction between household and per capita income. Moreover, while these calculations suggest that, over- all, the elderly may now be somewhat better off than the nonelderly, the single aged have lower incomes than their younger counterparts even after ad- justment.
Table I.--The effects of alternative adjustments for household size and income composition on the ratio of incomes of the elderly to the nonelderly in 1979
Income measure
Census money income.. Disposable income (money
income less income and payroll taxes).
Public income (disposable income plus market value of public in-kind benefits).
Public and insurance income (public income plus employer cost of noncash employee benefits)
Total income (public and insurance income plus implicit rental value of owner-occupied and rent-free housing).
Ratio of Ratio of household per capita
income income
0.518 0.903
.601 1.036
.612 1.189
,619 1.107
,647 1.142
Source: Adapted from Timothy Smeeding, Full Income Esti- mates of the Relative Well-Being of the Elderly and the Nonelder- Iy, May 1985.
Recent New Beneficiaries
The New Beneficiary Survey
Because many older persons are well above the usual retirement age and stopped work long ago, the income of older persons today reflects the legal, labor-market, and institutional provisions of the past. The impact of today’s arrangements will be felt gradually in the decades to come, as present workers age and retire. These arrangements have changed sig- nificantly in recent years. Since the early 1970’s, the country has experienced periods of unusually high in- flation and high unemployment. More and more women were working, while unprecedented numbers had fewer or later children, or none at all. Legislative measures were taken to expand pension coverage, se- cure pension rights, and curb age discrimination in employment. The Social Security program has made an extensive series of changes in benefit calculation, benefit levels, and earnings offset provisions.
The New Beneficiary Survey (NBS) was therefore launched in 1982 to provide more current information for program analysts, and to provide detailed data that would permit policy planners to estimate the probable consequences of changes in the Social Secu-
10 Social Security Bulletin, July 1987IVol. 50, No. 7

rity program. The NBS was designed to obtain a comprehensive and detailed work history for each person in the sample together with information on in- come sources and asset holdings of both beneficiaries and their spouses (a likely source of support), marital and child-rearing histories, and the costs (forgone earnings) and benefits (retirement income and finan- cial resources) associated with the beginning of retire- ment, as well as such other relevant characteristics as health and spouse’s employment.
The NBS was designed to interview a representative sample of noninstitutionalized persons in the United States who had begun receiving different kinds of So- cial Security and medical insurance benefits between mid-1980 and mid-1981 (table 9). Sample cases were selected from the Social Security Administration’s in- ternal files containing the names, addresses, and So- cial Security numbers of everyone entitled to cash or Medicare benefits. The overall response rate was at least 85.9 percent, on the very conservative assump- tion that everyone who could not be contacted was in fact eligible for interview. The information obtained in the resulting 18,599 interviews was weighted to represent the entire new beneficiary population and matched to SSA record data.
The Economic Status of New Beneficiaries Today
As expected, the new retired-worker beneficiaries in the NBS proved to be better off than the total aged population in several respects (table 10). They are more likely to have earnings, pensions (other than So- cial Security), and income from assets. Their median
monthly income is higher and they rely on Social Security for a smaller fraction of their total income.
In part, this is because they are relatively young (the majority had retired before age 65) and fewer of them have yet experienced changes likely to occur with advancing age, such as declining health and earnings capacity, death of a spouse, and erosion of the real value of income sources that are not indexed for inflation. Moreover, because the new beneficiaries all had substantial work histories as a precondition for receiving retired-worker benefits, they were some- what more likely to have pensions and, perhaps, more assets and better work capacity than the elderly popu- lation in general.
One to 2 years after the first benefit had been paid, employment was still fairly common: Earnings were reported by 27 percent of single beneficiaries and 44 percent of couples (in which a beneficiary might be married to someone who had not retired). However, the level of earnings was rarely so high that retire- ment benefits had been suspended: 98 percent of the married couples and 97 percent of the single group were still receiving Social Security (table 11).
The other two sources of income expected to sup- plement Social Security were also reported quite fre- quently. Asset income (most commonly interest on savings accounts) was reported by 84 percent of the couples, 73 percent of the single women, and 63 per- cent of the single men. However, the amounts were often quite small. Only 51 percent of married men and their wives and 35 percent of single men and women had more than $100 per month in asset income.
Fewer beneficiaries reported income from employer
Table 9.-New Beneficiary Survey sample size and interview outcomes
Domain of study Desired number Total selected Not eligible for
Population size of interviews for interviews interview’ Nonrespondent Interviewed
Retired workers: Men, aged:
62 .............................. 63-64 ........................... 65 .............................. 66 and older. ...................
Women, aged: 62 .............................. 63-64 ........................... 65 .............................. 66 or older. .....................
Disabled workers: Men .............................. Women ...........................
Wives.. ............................ Widows. ............................ Divorced wives. ..................... Divorced widows. ................... Medicare recipients. ..................
340,988 1,350 1,613 37 194 1,442 195,564 1,350 1,698 53 179 1,466 112,418 1,300 1,651 47 216 1,388 67,540 1,000 1,264 53 201 1,011
348,099 1,200 1,538 19 200 1,319 120,986 1,000 1,275 16 185 1,074 64,505 1,000 1,283 25 213 1,045 24,689 800 1,009 35 200 774
171,655 3,450 4,376 290 493 3,593 70,602 1,550 1,986 127 204 1,605
213,332 1,000 1,243 22 180 1,041 115,356 950 1,188 19 194 975
5,517 200 246 11 23 210 9,096 200 258 6 40 212
257,286 1,500 1,795 17 334 1,444
‘Ineligibles include the deceased, the institutionalized, and beneficiaries who had received a first payment before specified date
Social Security Bulletin, July 1987/Vol. 50, No. 7 11

Table lO.-New retired workers and total aged beneficiaries: Percentage of beneficiaries with income from vari- ous sources, median monthly income, and share of aggregate income from Social Security, by sex and marital status, 1982
Income source
Percentage receiving: Earnings .......................... Income from assets ............... Employer pensions, total. .........
Private ......................... Public ..........................
New retired workers’ Total aged beneficiaries’
Unmarried Unmarried Married men Married men
and their wives Men Women and their wives Men Women
44 22 30 33 15 9 83 63 72 78 61 64 56 41 43 50 36 24 39 26 28 35 26 14 20 16 16 17 11 11
Median monthly income. $1,490 $780 $760 $1,240 $600 $480
Share of aggregate income from Social Security (percent). 35 40 42 39 45 53
‘Includes only married men retired workers and their wives and unmarried workers interviewed in the 1982 New Beneficiary Survey who received a first Social Security benefit during mid-1980 to mid-1981.
March 1983 Current Population Survey of the Bureau of the Census.
‘Includes all couples and unmarried persons aged 65 or older in 1983 who reported receipt of Social Security benefits in 1982 in the
Source: Linda Drazga Maxfield, “Income of New Retired Workers by Age at First Benefit Receipt: Findings From the New Beneficiary Survey,” Social Security Bulletin, July 1985.
Table Il.-Sources of 1982 income during the 3 months preceding interview for persons who first received retired-worker benefits in June 1980-May 1981
sion income was much smaller: $253, compared with $400 per month.
Married men Unmarried Income source and their wives beneficiaries
Total number (in thousands). 580.0 295.9
Income from other sources was reported by fewer than 1 out of 6 beneficiaries. The most common of these other forms of income was veterans’ benefits, received by B-10 percent of the men. SSI or other forms of Public Assistance were received by only 2 percent of the married couples and 7 percent of the unmarried.
Percentage receiving income from: Social Security.. Employer pensions.
Private Public.
Assets Earnings....................... Other source’.
Welfare.
98.3 97.1 55.7 42.4 38.3 26.8 21.0 16.5 83.8 69.1 43.7 27.1 16.5 15.2 2.0 7.1
‘Includes receipt of at least one of the following: veterans’ pen- sions or compensation, Workers’ Compensation, Unemployment Insurance, Black Lung benefits, contributions from others within or outside of the household, and welfare (Supplemental Security Income, Aid to Families with Dependent Children, and Food Stamps).
Source: New Beneficiary Survey, October-December 1982.
When the relative importance of income compo- nents at different levels of the income distribution is examined (table 12), the dominant role of Social Security payments stands out. They account for more than half of total income up to the 45th percentile of the income distribution for couples and the 55th per- centile for single persons. They decline steadily in im- portance as total income rises, but are relatively unimportant only to the most affluent decile. Asset income and earnings have an inverse distribution, in- creasing steadily in importance as income rises. Em- ployer pensions do the same, except at the highest level. Income from other sources accounts for only a small share of the total at all levels.
pensions than from assets, but when they did their As expected, these findings from the NBS indicate median monthly pension amounts were considerably that persons entering retirement recently are in a con- larger than median asset income. The proportions siderably better financial position than earlier cohorts with at least $100 a month in asset and pension in- of retirees. Although the real value of Social Security come were therefore almost identical. Roughly half of payments has increased substantially, other forms of the retired-worker beneficiaries had pensions from income to supplement them have grown even more former public or private employers: 56 percent of the rapidly. The proportion of married couples and single married and 42 percent of the unmarried. While sin- beneficiaries relying on Social Security for the majori- gle women were (rather unexpectedly) more likely ty of their income has decreased only slightly over the than single men to have pensions, their median pen- years (from 47 percent and 59 percent in 1941-42 to
I2 Social Security Bulletin, July 1987/Vol. 50, No. 7

Table 12.-Married men and their wives and unmarried persons who first received retired-worker benefits in June 1980-May 1981: Percentage of mean total 1982 monthly income from major sources, by percentile of total monthly income distribution
I I
Percentile of total income distribution
Mean total monthly
income
Percentage of mean total monthly income from-
Employer All sources Social Security pensions Assets Earnings Other income
Married men and their wives
lst-10th .............. 1 lth-20th ............ 21st-30th. ............ 31st-40th ............. 41st-50th ............. 51st-60th. ............ 61st-70th. ............ 71st-80th ............. 81st-90th. ............ 91st-100th ............
$521 100 77 4 4 9 6 843 100 67 10 7 12 4
1,068 100 59 14 9 15 3 1,251 100 54 20 11 14 2 1,421 100 48 20 12 17 3 1,630 100 44 22 16 15 3 1,880 100 38 24 15 20 3 2,225 100 32 23 20 22 3 2,829 100 25 26 23 23 3 5,895 100 13 14 39 27 8
Unmarried men and women
1st.10th. ............. 1 lth-20th ............ 21st-30th ............. 31st-40th ............. 41st-50th. ............ 5 lst-60th. ............ 61st-70th ............. 71st-80th. ............ 8lst-90th ............. 91st-100th ............
$248 100 87 1 2 3 I 375 100 80 2 4 6 8 478 100 71 5 6 6 12 588 100 70 7 6 13 5 708 100 61 12 9 13 4 839 100 52 18 10 15 5 983 100 43 21 17 16 4
1,189 100 42 22 17 15 4 1,520 100 34 25 21 15 5 3,287 100 17 19 34 18 12
Source: New Beneficiary Survey, October-December 1982.
42 percent and 57 percent in 1982), but a much smaller proportion now relies entirely on the program (table 13). The completely dependent group has fallen from 13 percent to 3 percent among the married cou- ples and from 23 percent to 11 percent of single retirees over this period.
It was always intended that Social Security be sup- plemented in retirement by pension and asset income, but for the majority of beneficiaries this has not been the case. However, the goal of universal supplementa- tion is being approached, especially for assets. In the early days of the program, only 44 percent of married couples and 37 percent of single persons had any as- set income, and the figures for employer pensions were only 17 percent and 13 percent (table 14). By 1982, newly retired workers were twice as likely to have asset income and, rising from a lower base, more than three times as likely to have employer pensions.
The overall value of assets has increased even more impressively than simple receipt of asset income over the same period (table 15). Since the early 1940’s the constant-dollar value of the asset portfolios of new retirees has increased dramatically: Six-fold for mar- ried men and their wives, 11-fold for single women, and 19-fold for single men. Perhaps the most impor- tant increase has been in home ownership, a form of asset holding that is also associated with lower living
costs and greater security among the elderly. In 1941-42, barely half of married men and less than a fourth of single men and women owned their own homes. By 1982, the great majority of married men (87 percent) were owner-occupants, and ownership rates for unmarried men and women had more than doubled to 47 percent and 58 percent, respectively.
As a result of these combined increases, the eco-
Table 13.-Social Security as a proportion of total cash income: Percentage distribution by marital sta- tus, 1941 and 1982
1941’ 1982
Married Married men and Non- men and Non-
their married their married Proportion of income wives persons wives persons
Total percent. 100 100 100 loo o....................... 3 2 2 3 1-49. 50 39 56 40 50-99. 34 36 39 46 loo..................... 13 23 3 11
‘Sample for St. Louis, MO., only. Sources: Edna C. Wentworth and Dena K.Motley, Resources Af-
ter Retirement (Research Report No. 34), Office of Research and Statistics, Social Security Administration, 1970, table 5, and tabu- lations from the 1982 New Beneficiary Survey.
Social Security Bulletin, July 1987/Vol. 50, No. 7

Table 14.-Percentage of new retired workers with Table 16.-Percentage of new retired workers with pensions other than Social Security and with income income below the poverty threshold, 1941-42, 1970, from assets, 1941-42 and 1982 and 1982
Item 1941-42 1982 Percentage with income below the
Percentage with pensions other than Social Security:
Married men and their wives.. Nonmarried persons.
Percentage with income from assets: Married men and their wives.. Nonmarried persons..
17 56 13 42
44 83 37 69
Nonmarried men. Nonmarried women.
Sources: Edna C. Wentworth and Dena K. Motley, Resources After Retirement (Research Report No. 34), Office of Research and Statistics, Social Security Administration, 1970, table 7, and Linda Drazga Maxfield, “Income of New Retired Workers by Age at First Benefit Receipt: Findings From the New Beneficiary Sur- vey,” Social Security Bulletin, July 1985, table A.
‘Income of the couple or nonmarried person only, in relation to the poverty threshold for an aged couple or individual living alone. Poverty thresholds for 1941-42 were estimated by adjusting the 1982 thresholds by the change in the Consumer Price Index (45.2 in 1941-42, 288.6 in 1982). Poverty rates in 1941-42 were estimated by interpolation from published income distributions.
Table H.-Assets of new retired workers, 1941-42 and 1982
Asset ownership and marital status 1941-42 1982
Sources: Edna C. Wentworth and Dena K. Motley, Resources After Retirement (Research Report No. 34). Office of Research and Statistics, Social Security Administration, 1970, page 10; Reaching Retirement Age: Findings From a Survey of Newly Enti- tled Workers, 1968-70 (Research Report No. 47), Office of Research and Statistics, Social Security Administration, 1976, table 8.5; Linda Drazga Maxfield, “Income of New Retired Workers by Age at First Benefit Receipt: Findings From the New Beneficiary Survey,” Social Security Bulletin, July 1985, table 10; and unpub- lished tabulations from the New Beneficiary Survey.
Percentage owning their own homes: Married men and their wives.. Nonmarried men. Nonmarried women.
Median home equity for those with equity (in 1982 dollars):
54 87 23 47 23 58
Married men and their wives. . $17,300 $48,000 Nonmarried men. . 17,270 35,000 Nonmarried women.. 13,180 38,000
Median net worth (in 1982 dollars): Married men and their wives.. 11,230 68,000 Nonmarried men.. 910 17,000 Nonmarried women.. 2,840 30,100
Sources: Edna C. Wentworth and Dena K.‘Motley, Resources
minority. As they age, almost all retirees will cease to receive earnings, and it is an open question to what extent their assets will gradually be consumed and no longer generate income. Finally, while Social Security payments are fully indexed to increases in consumer prices, it is unclear how well other pension benefits are protected. Therefore, it is likely that the economic position of this cohort will decline somewhat in years to come.
After Retirement (Research Report No. 34), Office of Research and Statistics, Social Security Administration, 1970, tables 14 and 16, and Sally R. Sherman, “Assets of New Retired-Worker Beneficiaries: Findings From the New Beneficiary Survey,” Social Security Bulletin, July 1985, table 7.
Future Prospects In a sense, these findings may exaggerate the well-
being of the elderly population in the years to come. Many new beneficiaries were still employed when in- terviewed, and health problems afflicted only a
nomic well-being of the recently retired elderly has greatly improved (table 16). In terms of the present official poverty standard, the majority of the newly retired were in poverty in the early 1940’s: 57 percent of married couples, 75 percent of single men, and 80 percent of single women. As recently as 1970, a large minority of the unmarried (40 percent) were still poor. By 1982, only 5 percent of the newly retired married couples and 20 percent of the unmarried had incomes below the poverty threshold.
On the other hand, even though the NBS sampled the newest retirees, the factors that made them better- off than their predecessors are likely to have an even more favorable effect on their future counterparts. The higher wage levels, broader pension coverage, in- creased labor-force participation among married wom- en, and incentives to asset accumulation in recent years (especially a rapid increase in tax-sheltered In- dividual Retirement Accounts and employer-subsidized savings plans) that benefitted NBS retirees are gener- ally fairly recent developments that had most of their impact on the NBS sample only in the last years of their working lives. The younger cohorts now in the labor force will spend more of their working lives in the present, relatively favorable conditions. It is not unreasonable to expect that today’s workers will enjoy more and larger pensions and increased income from savings to supplement their Social Security payments when they retire. Despite the increase in life expectan- cy and the decline in labor-force participation among the elderly, therefore, there is good reason to hope that the financial position of the aged population in the United States will continue to improve for some years to come.
14 Social Security Bulletin, July 1987/Vol. 50, No. 7


![[Global HR Forum 2014] The Extension of the Retirement Age and the Current Employment Condition of Middle-Old Aged Persons in Japan : As a Reference Case](https://img.dokumen.tips/doc/110x75/558cd9a9d8b42aa36a8b4625/global-hr-forum-2014-the-extension-of-the-retirement-age-and-the-current-employment-condition-of-middle-old-aged-persons-in-japan-as-a-reference-case.jpg)


