Embed Size (px)
Citation preview

INCOME INEQUALITY AND POVERTY

Distribution of U.S. Personal Income by Families, 2010
Personal Income Category
Percentage of All Families
in This Category
Under $10,000
$10,000 - $14,999
$15,000 - $24,999
$25,000 - $34,999
$35,000 - $49,999
$50,000 - $74,999
$75,000 - $99,999
$100,000-$199,999
$200,000 and over
7.6
5.9
11.5
11.0
13.9
17.6
11.5
16.7
4.2
100.0
FACTS ABOUT INCOME INEQUALITY

The Lorenz Curve graphically...
Distribution of Personal Income by Quintiles, 2010 Percentage of
Total Income
Upper
Income Limit
3.3
8.5
14.6
23.4
50.3
100.0
FACTS ABOUT INCOME INEQUALITY
Quintile
Lowest 20%
Second 20%
Third 20%
Fourth 20%
Highest 20%
Total
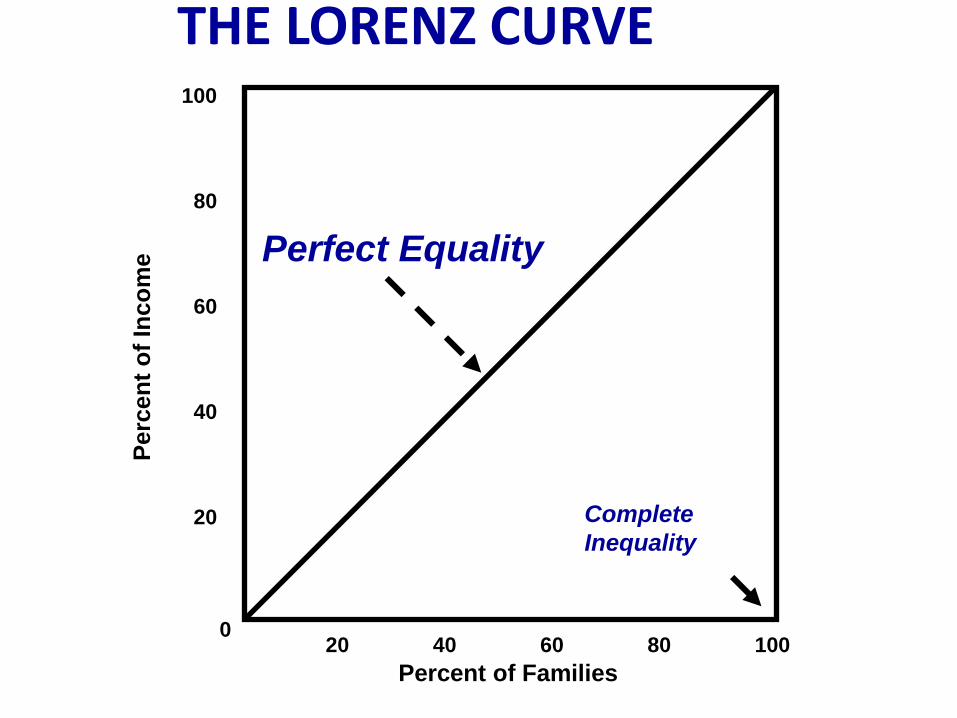
20 40 60 80 100
100
80
60
40
20
0
Percent of Families
Perc
en
t o
f In
co
me Perfect Equality
Complete
Inequality
THE LORENZ CURVE

20 40 60 80 100
100
80
60
40
20
0
Percent of Families
Perc
en
t o
f In
co
me Perfect Equality
Complete
Inequality
Lorenz Curve
(actual distribution)
Area between
the lines shows
the degree of
income inequality
THE LORENZ CURVE

20 40 60 80 100
100
80
60
40
20
0
Percent of Families
Perc
en
t o
f In
co
me Perfect Equality
Complete
Inequality
Lorenz Curve
(actual distribution)
Area between
the lines shows
the degree of
income inequality
THE LORENZ CURVE
Gini Ratio Numerical Measure of Overall
Dispersion of Income
Area Between Lorenz Curve and Diagonal
Total Area Below the Diagonal
Gini Ratio =

20 40 60 80 100
100
80
60
40
20
0
Percent of Families
Perc
en
t o
f In
co
me Perfect Equality
Complete
Inequality
Lorenz Curve
(actual distribution)
Area between
the lines shows
the degree of
income inequality
THE LORENZ CURVE

20 40 60 80 100
100
80
60
40
20
0
Percent of Families
Perc
en
t o
f In
co
me Perfect Equality
Complete
Inequality
Lorenz Curve
(actual distribution)
Area between
the lines shows
the degree of
income inequality
THE LORENZ CURVE
Effect of government redistribution of cash and noncash transfers

20 40 60 80 100
100
80
60
40
20
0
Percent of Families
Perc
en
t o
f In
co
me Perfect Equality
Complete
Inequality
Lorenz Curve
(actual distribution)
Area between
the lines shows
the degree of
income inequality
THE LORENZ CURVE
Lorenz curve
after taxes and
transfers

Ability Differences Education and Training Discrimination Preferences and Risks Unequal Distribution
of Wealth Market Power Luck, Connections,
and Misfortune
CAUSES OF INCOME INEQUALITY

TRENDS IN INCOME INEQUALITY
1929 - 1947
Significant reduction
in income inequality
1947 - 1969
Less inequality
but at a slower pace
1969 - now
More unequal since 1969
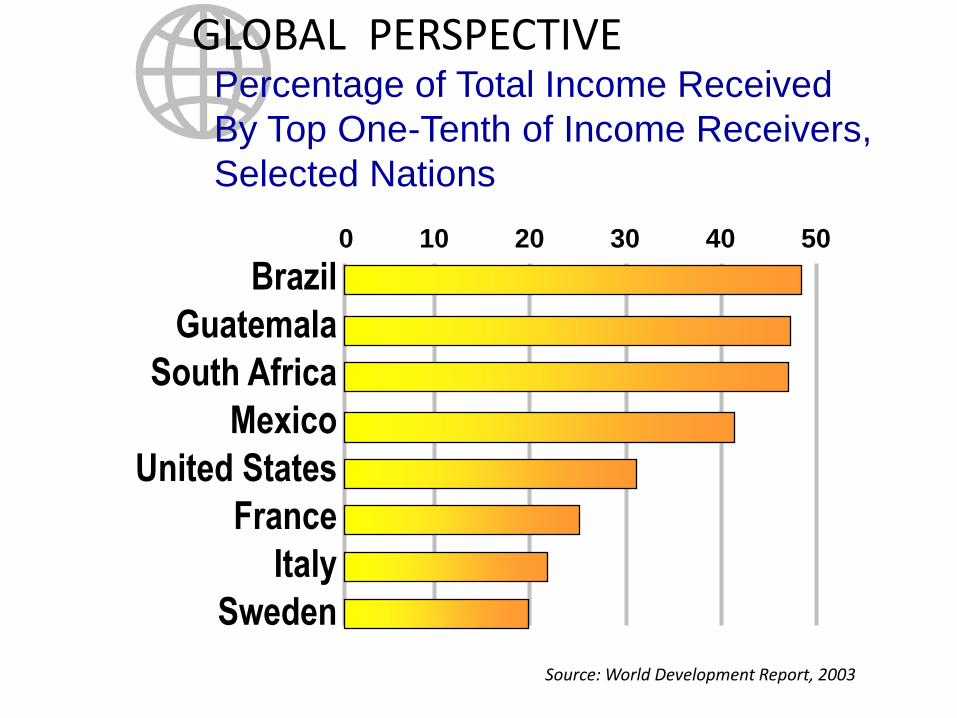
Brazil
Guatemala
South Africa
Mexico
United States
France
Italy
Sweden
0 10 20 30 40 50
GLOBAL PERSPECTIVE Percentage of Total Income Received
By Top One-Tenth of Income Receivers,
Selected Nations
Source: World Development Report, 2003

EQUALITY VERSUS EFFICIENCY
The Case for Equality
Maximizing Total Utility
The Case for Inequality
Incentives and Efficiency
Tradeoff Between Equality
and Efficiency