Embed Size (px)
Citation preview

Income Distribution and Inequality
Frank A. Cowell∗
STICERD, London School of Economics
DARP 94 The Toyota Centre October 2007 Suntory and Toyota International Centres for Economics and Related Disciplines London School of Economics Houghton Street London WC2A 2A (+44 020) 7955 6674
∗ author contact: [email protected]

Abstract
What are the principal issues on which research on income distribution and inequality focus? How might that focus shift in the immediate future? Prepared for the The Elgar Handbook of Socio-Economics. JEL Classification: C13, D63

Distributional Analysis Research Programme
The Distributional Analysis Research Programme was established in 1993 with funding from the Economic and Social Research Council. It is located within the Suntory and Toyota International Centres for Economics and Related Disciplines (STICERD) at the London School of Economics and Political Science. The programme is directed by Frank Cowell. The Discussion Paper series is available free of charge. To subscribe to the DARP paper series, or for further information on the work of the Programme, please contact our Research Secretary, Leila Alberici on: Telephone: UK+20 7955 6674 Fax: UK+20 7955 6951 Email: [email protected] Web site: http://sticerd.lse.ac.uk/DARP © Author: Frank Cowell. All rights reserved. Short sections of text, not to exceed two paragraphs, may be quoted without explicit permission provided that full credit, including © notice, is given to the source.

The produce of the earth - all that is derived from its surface bythe united application of labour, machinery, and capital, is dividedamong three classes of the community; namely, the proprietor of theland, the owner of the stock or capital necessary for its cultivation,and the labourers by whose industry it is cultivated. [...] To de-termine the laws which regulate this distribution, is the principalproblem in Political Economy. �David Ricardo, On The Principlesof Political Economy and Taxation. London: John Murray, 1817(third edition 1821)
1 Introduction
The central place that Ricardo accorded the subject of income distributionin 19th century Political Economy is appropriate also in 21st century Socio-Economics. Although the �eld was relatively neglected by economists for severaldecades, in the last �fteen years there has been a resurgence of interest drivenpartly by developments in economic theory and partly by major developments inthe interpersonal income distributions within many developed countries (Atkin-son 1997).In recent years the subject of economic inequality has developed in such a
way as to have a life of its own separate from the obvious connection with thedistribution of income, the distribution of wealth, the structure of wages andother related empirical topics. This distinct area of study has been built uponnew insights in welfare economics and on the relationship to information theory(Cowell 2000, Sen and Foster 1997).Our treatment of this pair of subjects is organised as follows. Section 3
examines the ways in which economic analysis has attempted to explain whatdrives income distribution; in section 4 we will look at ways of analysing thepersonal income distribution as a prelude to a more thorough consideration ofinequality (section 5); section 6 looks at new directions in which the analysismay proceed. But �rst let us brie�y think about the main focus of our subject.
2 Income
Why the focus on income rather than some other measurable quantity? In manytreatments of the subject income plays one of two roles, sometimes both:
� Income as a proxy for economic welfare. If one adopts an individualistic,welfarist approach to social economics then it is reasonable to be concernedwith individual well-being or utility. In some respects the �ow of incomecaptures this, but it has been argued that consumption expenditure maybe a more appropriate economic indicator (Blundell and Preston 1998).1 It
1Among other things use of consumption data can avoid a number of di¢ cult technicalproblems that arise from the presence in practice of zero and negative incomes.
1

should also be acknowledged that individual well-being may be determinednot only by the level of one�s own income but also by its relation to theincomes of others (Ferrer-i-Carbonell 2005).
� Income as command over resources. This role of income can be interpretedin more than one way. If one has in mind spending power then perhapsdisposable income (income after taxes and compulsory deductions?) maybe an appropriate concept. But if �inequality�is associated with economicpower and status then a measure of wealth may be more appropriate.
The focus on income as conventionally de�ned clearly has shortcomings. Anuncritical use of income in either of the above roles may neglect questions of time(people�s incomes often change systematically over their lifetime) and of risk(people�s incomes often change erratically in the short run): more sophisticatedincome concepts can be used that take account of these factors, but it is harderto get reliable data to estimate them. Also left open are important theoreticaland practical questions: for each type of income one needs to be clear aboutwho or what the �income receiver�is (a single person? a family or household?a �rm? a taxpayer?); particular care must be taken when using standard datasources to make international comparisons (Atkinson and Brandolini 2001).
3 Economics and income distribution
In economic analysis �income distribution�is interpreted in two principal ways:the functional distribution of income � i.e. the distribution of income amongfactors �and the size distribution of income (or distribution of income amongpersons).We brie�y deal with the way each of these is conventionally handled in
economics, focusing on the forces that determine the shape of the income dis-tribution (section 3.1). Then, in section 3.2 we will look at challenges to theorthodoxy and the way these challenges have enhanced our understanding aboutthe analysis of income distribution in recent years.
3.1 The standard approach
Functional distribution. The functional distribution of income is an inte-gral part of the economic analysis of relative prices, output and employment.In this sense there are several theories of income distribution corresponding todi¤erent theoretical and ideological stances on these central issues. However,these various analyses usually focus on the same basic economic concepts: em-ployment of the factors of production �land, labour and capital �and the ratesof remuneration of their services �rent, wages and pro�t.The conventional approach is to treat questions of distribution as part of
the neoclassical analysis of prices and resource allocation in a story such asthe following. A competitive �rm takes the price it can get for its output andthe prices it must pay for inputs as given in the market: it selects its level of
2

output and adjusts its demand for inputs so as to maximise pro�ts at thoseprices; each household takes as given the prices paid to it for the labour servicessupplied by members of the household just as takes as given the prices to bepaid for goods and services it needs, and: it adjusts the quantities of the goodsand services demanded or supplied in the market so as to maximise satisfactionwithin the limitations imposed by its budget. In this story prices adjust so as toensure equilibrium in all markets: equilibrium means that aggregate supply ofeach commodity is at least as great as aggregate demand. In particular factorincomes, the reward for each type of labour, each natural resource and capitalasset is determined by its market clearing price. So the functional distributionof income �the issue referred to directly by Ricardo in the epigraph �is in thisway automatically determined by the market mechanism. Shocks to the system�for example changes in the stock of natural resources alters, or a shift in thepreference patterns of consumers �will change the income distribution throughthis mechanism as prices adjust to new equilibrium levels.
Personal distribution. The distribution of income between persons or be-tween households can be �tted into the above scenario. Key decisions thatdetermine incomes in the long run can each be analysed as particular cases ofthe household�s optimization problem: household saving, self-investment in hu-man capital or the purchase of education for children are determined by pricesignals. To complete the theory of income distribution within this frameworkone also needs a description of the system of property rights that prevails withinthe community. The question of who owns the natural resources, the capitalequipment and the pro�ts of the �rms is central to the determination of house-hold incomes: household budgets are jointly determined by market prices andproperty rights and will be a¤ected by a change in the pattern of ownership, orin the system of ownership.However, more is required to complete the personal income distribution
story. In order to draw conclusions about the distribution of income in thelong-run one also needs to consider the evolution of property rights across thegenerations.(Piketty 2000).This will depend, among other things, on how fam-ilies are formed (do the rich predominantly marry the rich?2 do the poor havemore children?) on the motives for bequeathing wealth to the next generation(do parents compensate disadvantaged children? is the amount bequeathed theoutcome of dynastic optimisation or largely a matter of chance?3) and the roleof the State through taxation (Cremer and Pestieau 2006).
3.2 Challenges and developments
The orthodox neoclassical story outlined in section 3.1 has been called into ques-tion on account of its restrictive assumptions concerning the economic processesinvolved. Because these assumptions are central to the theory rather than be-
2See for example Fernández et al. (2005), Liu and Lu (2006).3See for example Arrondel and Laferrère (2001), Kopczuk and Lupton (2007).
3

ing merely convenient simpli�cations, many economists have questioned therelevance of various aspects of the standard account of income distribution. Wemay brie�y mention three points of focus.
The role of prices. The predominant interest of neoclassical orthodox the-ory of income distribution in smooth adjustments to market clearing equilibriamay be inappropriate to a theory of the functional distribution of income. As aresponse to this, economists who are strongly in�uenced by Keynes�s approachto macroeconomics have developed a number of alternative theories of the func-tional distribution of income using components of the Keynesian system, forexample the work of Kaldor (1955) and Pasinetti (1962). Key features of suchalternative theories are rule-of-thumb savings decisions by capitalists and work-ers and a rigid technique by which labour and capital are combined to produceoutput; they play a role in some of the modern theory of growth and its rela-tionship to factor incomes (Bertola 1993).
Monopoly power. The standard theory neglects barriers to competition andthe monopoly power as of secondary importance in the competitive marketstory. Restraints on competition � in the form of segmentation of the labourmarket and outright discrimination �are of major importance in analysing thelower tail of the size distribution of earnings; and monopoly power may beparticularly important in the upper tail, for example, in the determination ofearnings in professions with restricted entry. Monopolistic pricing by �rms hasalso been seen as of prime importance in the functional distribution of income(Kalecki 1939): such power plays an important part in the Marxian conceptof exploitation and in distribution theories based on struggle between classesrepresenting di¤erent factors of production. The assumption of competitionis also likely to be inadequate in analysing economics that have a substantialpublic sector.Modern treatments of the labour market take seriously the problem of monop-
sony by powerful �rms in determining labour incomes and the potential role fora minimum wage (Manning 2003).
Information. The standard story in section 3.1 assumes e¤ectively perfectinformation on the part of economic agents. However, uncertainty is itself a po-tent force generating inequality in both labour income and income from assets,in that the rich not only are better able to bear risk but also may have superiorinformation which can be exploited in the stock market and the labour market.Moreover, some of the barriers to competition may have been erected by �rmsin response to uncertainty. Hence considerable interest has developed in thedistributional implications of theories of output, employment and the structureof wages that explicitly incorporate imperfect information, in particular screen-ing and signalling, phenomena that may result in equilibrium income inequality(Salanié 1997). Because of imperfect information it is in the interest of economic
4

$0
$100,000
$200,000
$300,000
$400,000
$500,000
$600,000
$700,000
$800,000
$900,000
$1,000,000
0.0 0.2 0.4 0.6 0.8 1.0
proportion of population
Figure 1: Parade diagram, US income before tax 2003
agents to make use of social networks formed from social contacts which mayalso buttress equilibrium (Ioannides and Loury 2004, Manski 2000).
4 The personal distribution
4.1 Representations of income distribution
Let us �rst examine the problems of depicting and interpreting the personalincome distribution; then we will brie�y consider the merits of formal modelling.
Statistical tools. To present the bald facts about income inequality one couldjust draw an empirical frequency distribution (histogram). But it is worthconsidering two other presentations of the data that have become familiar inthe literature; we will illustrate the techniques using readily available tax datafrom the United States.The background story for the �rst presentation is eloquently set out in Pen
(1974).4 Imagine that each person�s height were in proportion to his incomeand that the entire population were to �le past in a parade that lasted exactlyone hour. If we do this thought experiment for the US then the picture thatemerges is that shown in Figure 1.5 It is clear that this is just the inverse of the
4Pen�s story was originally told for the UK and for income distribution data from the 1960s.Nevertheless the central message is still valid for the 21st century and for other countries�data.
5Source: http://www.irs.gov/taxstats/indtaxstats/article/0�id=134951,00.html. Table1.1�2003, Individual Income Tax Returns, Selected Income and Tax Items, by Size and Ac-
5

conventional distribution function F : if x is income then p = F (x) gives theproportion of the population with incomes less than or equal to x and Figure 1just plots x against p. One standard feature of empirical income distributionsemerges clearly from the diagram: the dotted line depicts the position of theperson with average income ($48,889) and it is clear that this is more than two-thirds along in the parade (so that the mean is substantially greater than themedian).
0.0
0.2
0.4
0.6
0.8
1.0
0.0 0.2 0.4 0.6 0.8 1.0
Proportion of population
Prop
ortio
n of
Inco
me
1987
2003
Figure 2: Lorenz Diagram, US income before tax 1987 and 2003
The second standard presentation is shown (using the same data source)in Figure 2. The horizontal axis is just as for Figure 1: on the vertical axisis plotted s, the income shares of the population. The Lorenz curve (Lorenz1905) is a graph of income shares against population shares for a particulardistribution so that a particular (p; s) point can be read as �the bottom 100p%of the population receive 100s% of total income.�6 It is clear that this graphcaptures an intuitive concept of inequality comparison: to see this Figure 2 alsoincludes the corresponding graph for 1987; note that the share of the bottom50% of the population (p = 0:5) in 2003 is unambiguously less than in 1987 andthat the same conclusion would have been obtained if we had chosen any other p-
cumulated Size of Adjusted Gross Income. These data do not embody the ideal de�nition ofincome and income-receiver for welfare analysis (below) but they can be conveniently used toillustrate all the techniques presented here. The data have been truncated below to eliminatenegative and zero incomes to provide a consistent distribution that can be used in all thepresentation techniques covered below �Pen (1974) did not truncate his data, but used onlythe parade presentation.
6Two points to note. (1) Because the population is implicitly arranged in ascending orderof income the graph must be increasing and convex and start from (0; 0). (2) If there wereperfect equality then everywhere we would have p = s and the Lorenz curve would be astraight line; following convention this has been drawn in Figure 2.
6

value; so according to this �shares ranking�income seems to be more unequallydistributed in 2003 than in 1987. One might wonder whether the intuition couldor should be formalised: this point is taken up in section 5 below.
0.0001
0.001
0.01
0.1
1
$1,000 $10,000 $100,000 $1,000,000
Figure 3: Pareto Diagram: US Pretax Income 2003 (� = 1:95)
Modelling the distribution. Once one considers anything beyond the sim-plest example of interpersonal income distribution there is a strong temptationto �nd some way of simplifying the representation of the distribution and its as-sociated inequality. One way of doing this is to use a parametric model �in otherwords a suitable functional form, where �suitability�is interpreted as meaningthat the salient features of the empirical distribution are captured. There areseveral candidate functional forms borrowed from statistics including the log-normal, beta and gamma distributions (Cowell 2007, Kleiber and Kotz 2003),but of particular interest is Pareto (1965)�s insight, all the more remarkablesince it was based on the limited data available at the end of the 19th century.Figure 3 presents the same information as that presented in Figure 1 but nowit plots 1 � F (x) against income x, each on a logarithmic scale. A naked-eyeinspection suggests that the points where x is at least $50,000 lie almost on astraight line, as shown.7 If one accepts the straight-line representation on thisdiagram for x � x0 where x0 := $50; 000 then in this income range we have
F (x) = 1��x
x0
��7For demonstration purposes this has been �tted using OLS to the top 11 observations.
7

where the parameter � is the slope of the �tted line in Figure 3 .Clearly the advantage of this is that the complexity of the distribution is
reduced to a single parameter � � the lower is the value of this parameter,the �fatter� is the tail of the associated frequency distribution and, in somesense, the higher is the inequality displayed by the distribution. Some of thedisadvantages are obvious: no attempt is made to capture information from thebottom end of the income distribution, the estimate of � may be quite sensitiveto the statistical method employed (Cowell and Victoria-Feser 2007) and the useof � as an indicator �equality� is based on nothing stronger than an informalimpressionistic argument.From the time of Pareto�s discovery of this relationship (1896) there has been
interest in whether it somehow characterises a �law�of income distribution �whether the straight-line approximation described above is generally a good one(it is) and whether it is reasonable to assume that across countries there is anatural tendency for � to approach one particular value (it isn�t) (Persky 1992).
4.2 Income distribution: recent developments
A renewed interest in income distribution has developed because of recent his-tory of the personal income distribution. After several decades of apparentstasis from the late 1970s onwards there has been a remarkable increase in thedispersion of incomes in many countries. Figure 4 (taken from Piketty and Saez2003) demonstrates one aspect of the situation for the case of the USA:8 thischarts the shares of the topmost income receivers over the 20th century.The apparent secular increase in inequality is in both income derived from
assets (note the role played by capital gains in this) and in labour income. Thislatter component has been driven by a recent increased dispersion of wage ratesin industrialised countries (Gottschalk and Smeeding 1997, 2000); explanationsfor this remarkable phenomenon have been sought in the e¤ects of technologicaladvances on wage dispersion via productivity growth(Acemoglu 2002, Blau andKahn 1996, Goldin and Katz 1996, Krueger 1993, DiNardo and Pischke 1997)and in the e¤ects of international trade (Burtless 1995, Krugman and Venables1995, Marjit and Acharyya 2003, Richardson 1995),
5 Inequality
To pass from the description and analysis of income distribution to a systematicconsideration of inequality one needs to address a number of questions aboutthe value judgments implicit in inequality comparisons and a number of ethicaland practical questions associated with the use of an inequality measure.
8The increase in inequality shown by the shares ranking (Figure 2) is consistent with this:in contrast to Figure 2 which plots the income share s of the bottom p of the population,Figure 4 plots 1� s (corresponding to the top 1� p of the population) against time.
8

0
5
10
15
20
25
30
35
40
45
50
1913
1917
1921
1925
1929
1933
1937
1941
1945
1949
1953
1957
1961
1965
1969
1973
1977
1981
1985
1989
1993
1997
Top 10%
Top 1%
Top 1% (including capital gains)
Figure 4: Top income shares in the United States
5.1 Connections with income distribution
Values. Perhaps the overriding question is, why one should be concerned withinequality? The standard answer is that it is rooted in an ethical approach todistributional questions (Sen and Foster 1997). Further, social values are inturn related to individual concerns and views: people care about distributionalfairness and they reveal a concern for fairness through their behaviour in exper-imental settings (Charness and Rabin 2002, Fehr and Fischbacher 2002, 2003);to some extent a concern for fairness is also revealed in surveys (Inglehart et al.2004)A fundamental concept that is usually applied in inequality comparisons
captures an element of this fairness-in-distribution point. The transfer princi-ple (Dalton 1920) states the following: take an n-person income distribution(x1; x2; :::; xn) where xi is the income of person i; for any i and j among thesen persons consider the distribution formed by transferring a small amount ofincome � from i to j (so xi is replaced by xi � � and xj is replaced by xj + �);then, if xi < xj the income distribution must become more unequal, if xi > xjthe income distribution must become less unequal. We have seen a glimpse ofthis principle in the representation of the income distribution using the Lorenzcurve (Figure 2): one can imagine the 2003 distribution being �created� fromthe 1987 distribution by a series of poorer-to-richer transfers that successivelyreduce the income shares of the poorer members of the community; this impliesthat the 2003 distribution (outer Lorenz curve) must exhibit greater inequalitythan the 1987 distribution (inner Lorenz curve) (Atkinson 1970).
9

Measurement. Why should one be interested in inequality measurement?One good answer is that the �shares ranking�outlined in section 4.1 is limitedas a practical tool: the type of clear-cut conclusion drawn from Figure 2 (�2003is more unequal than 1987�) is not always possible because in many instancesthe relevant Lorenz curves intersect; to resolve the apparent ambiguity in theLorenz comparison a summary numerical value for each Lorenz curve is sought.An appealing intuitive way of doing this is to take the area trapped betweenthe Lorenz curve and the equality line in Figure 2: the normalised value of thisarea9 yields the Gini coe¢ cient. Formally the Gini is de�ned as
1
2n2x
nXi=1
nXj=1
jxi � xj j ; (1)
where x := 1n
Pni=1 xi denotes mean income. The formula (1) provides another
simple and natural interpretation: take all the possible pairs of income-receiversin society (i; j) and compute the absolute di¤erence between their incomes �theGini is a normalised average of those di¤erences.In view of this attractive solution to the measurement problem, the question
arises, why not just use the Gini coe¢ cient to quantify inequality and leavethe matter there? There are two main points in reply. First, there are otherperfectly good summary statistics that combine intuitive appeal with familiarityand simplicity of computation; for example, one could use the coe¢ cient ofvariation vuut 1
n
nXi=1
hxix� 1i2; (2)
which is obviously related to the variance; this and other intuitively reasonablemeasures may deserve to be considered alongside the Gini coe¢ cient.10 Second,it may be more appropriate to base inequality measurement on some sort ofsocial evaluation of income distribution rather than just on personal intuition.
5.2 Welfare economics and distribution
In the context of income-distribution analysis social welfare can be representedas a value W (x1; x2; :::; xn) where W is a function with �suitable�properties.It is commonly, though not universally, assumed that social-welfare functionW can be written in additive form so that the social welfare associated with aparticular income distribution is given by
nXi=1
u(xi); (3)
9Normalisation involves dividing this area by the area of the whole triangle, namely 12.
This is exactly the same as the formula given in 1.10Because di¤erent inequality measures encode di¤erent information about the income dis-
tribution, thay can give qualitatively di¤erent answers in cases where Lorenz curves intersect:it is not hard to �nd cases where the Gini indicates that distribution A is more unequal thandistribution B, but that the coe¢ cient of variation indicates the opposite.
10
u(x)
x1
xx2
u(x1)
u(x2)
x* x•
u(x*)
income
soci
al e
valu
atio
n of
inco
me
Figure 5: Social evaluation function u, equally-distributed-equivalent income x�
and mean income x
where u is a �social-evaluation function�which is increasing (so that more in-come for person i means higher social welfare) and strictly concave (so that apoorer-to-richer transfer will reduce W �the transfer principle again). An ex-ample of this type of function is given in Figure 5. Let us look at two importantways in which this apparatus is used.
Welfare dominance. For the above special type of W -function there is anice relationship with the Lorenz concept. For any distribution construct theGeneralised Lorenz Curve (GLC) by multiplying each income share by the meanof the distribution; then if the GLC for distribution A lies somewhere above andnowhere below the GLC for distribution B social welfare must be higher in Athan in B for every possible W of the above type (Shorrocks 1983).Figure 6 draws the GLCs for the US data that we used earlier: it is clear
that the two curves intersect, but what does this mean? Both average incomeand inequality increased over 1987-2003; social welfare increased because of the�rst e¤ect and decreased because of the second, but neither of the two e¤ectsdominates; di¤erentW s, corresponding to di¤erent speci�cations of u in (3) willyield di¤erent conclusions as to whether welfare rose (because of the growth intotal income) or fell (because of the more unequal shares in total income).
Welfare-based inequality measurement. Find the income level which, ifreceived by everyone, would yield the same level of social welfare. From (3) this
11

$0
$5,000
$10,000
$15,000
$20,000
$25,000
$30,000
$35,000
$40,000
$45,000
0.0 0.2 0.4 0.6 0.8 1.0
Proportion of population
1987
2003
Figure 6: Generalised Lorenz Diagram. US income before tax 1987 and 2003(in 2003 $)
is a number x� such that
u(x�) =1
n
nXi=1
u(xi): (4)
x� is a e¤ectively a dollar measure of social welfare and is illustrated in Figure5, for a two-person income distribution (x1; x2). If x1 and x2 are moved furtherapart from each other then clearly the gap between x� and the mean x increases;so we could use the proportionate size of this gap, 1 � x�=x, as an index ofinequality. In the special case where u (x) takes the form 1
1�"�x1�" � 1
�this
concept yields the class of Atkinson indices (Atkinson 1970):
1�"1
n
nXi=1
hxix
i1�"# 11�"
(5)
The number ", the degree of relative inequality aversion, is a parameter thatcharacterises individual members of the class of inequality and may take anypositive value.11 It encapsulates the imputed social values regarding inequality:at the limiting value of zero one is imputing complete indi¤erence to inequality,so that social welfare is measured by mean income (x� = x); as successivelyhigher values of " are considered we are imputing a higher premium on inequalityand, for any given income distribution, the gap between x� and x will increase.
11The limiting form of u as " ! 1 is log(x) and the limiting form of (5) as " ! 1 is1� exp
�1n
Pni=1 log(xi=�)
�.
12
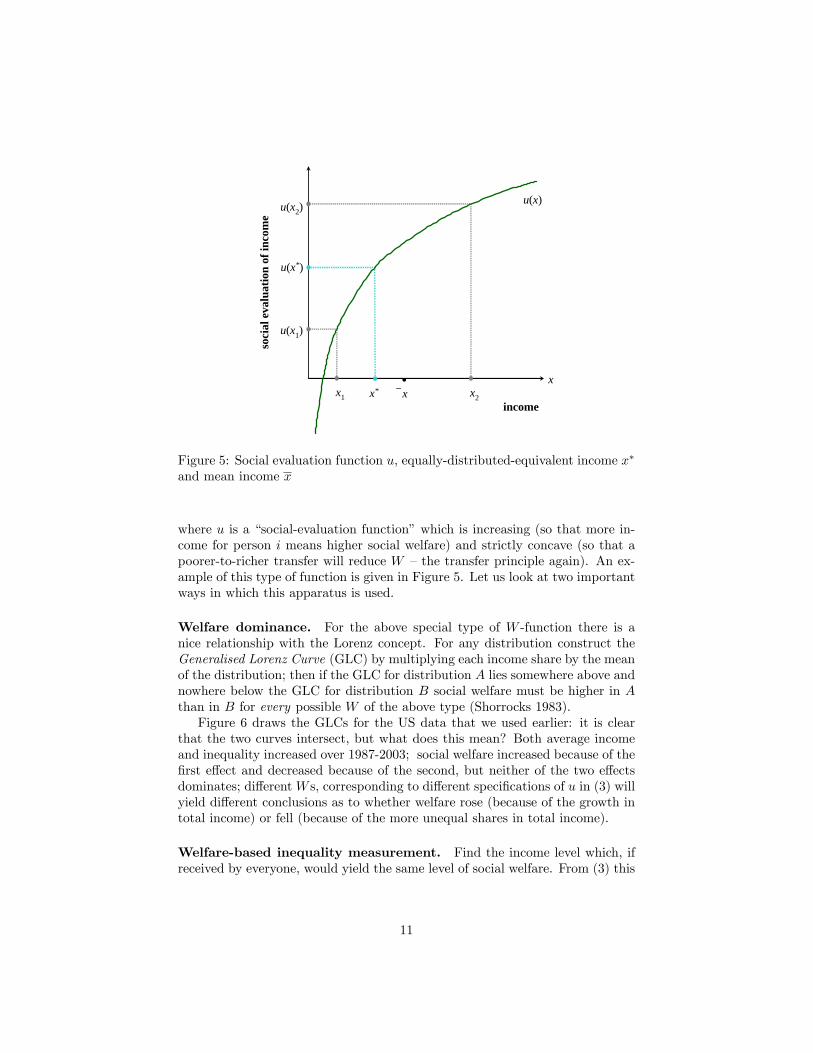
To illustrate, suppose we calculate social welfare for the 1987 and 2003income-distribution data, taking this speci�c form of the social-evaluation func-tion u. We can do this using the equally-distributed equivalent income x�: forsuccessively higher values of inequality-aversion " we will get lower values of x�
in each of the two years. The results are depicted in Figure 7: for low values of" (close to indi¤erence to inequality) welfare is clearly higher in 2003, re�ectingthe higher mean income in that year; but for higher values of " (above about0.76, where the curves cross) the premium being put on inequality is so highthat welfare is counted as higher in 1987 than in 2003.
$0
$10,000
$20,000
$30,000
$40,000
$50,000
$60,000
0.0 0.2 0.4 0.6 0.8 1.0 1.2 1.4 1.6 1.8 2.0
ε
x*
1987
2003
Figure 7: Social welfare for di¤erent degrees of inequality aversion. US incomebefore tax 1987 and 2003 (in 2003 $)
6 New directions?
Two broad channels show considerable promise for the immediate future ofresearch on income distribution and inequality.
Data developments The availability of new, reliable data sources almostinevitably has a stimulating e¤ect on research. The development of micro-dataon incomes in developing economies has facilitated not only the analysis ofincome distribution within each country concerned but the tricky question of
13

meaningful international comparisons. It enables one to better address questionssuch as whether inequality is good for growth (Aghion et al. 1999) and thedirections that the world distribution of income is taking (Sala-i-Martin 2006).However, as Figure 4 shows, signi�cant improvements in data availability
are not con�ned to developing countries. A renewed interest in the �ne detailof the income distribution among the seriously rich has led to the synthesis ofdata from tax authorities that has added a new perspective to internationalcomparisons Piketty (2007); new work making available micro-data on wealthwill also enhance understanding of what is going on in the upper tail of theincome distribution (Sierminska et al. 2006).
Inequality and the basis for social intervention The idea of inequalityhas long been associated with public policy prescriptions, addressing questionsof whether more resources should be devoted to redistributive programmes, themeaning of tax progression and so on. For the last 35 years or so this literaturehas largely been based on essentially a welfarist approach to social judgments(Sen 1979). Moreover the particular form of welfarism has typically been rathernarrow: the nature of inequality and of inequality aversion has been sought ina kind of social analogy with risk and risk-aversion.Recent years have seen a reappraisal of this theoretical underpinning. The
analysis of preferences under uncertainty and of preferences has been devel-oped to richer models than simple expected-utility and to encompass broaderconcepts of risk-aversion (Chateauneuf et al. 2004); this is leading to parallel de-velopments in the treatment of the concept of inequality aversion (Chateauneufand Moyes 2000). Furthermore the growing appreciation of the contributionof �behavioural public economics� (Bernheim and Rangel 2005) has led to asearch for an understanding of social-welfare criteria that are not based on sim-plistic models of individual rationality. Along with this a strong interest hasdeveloped in nonwelfarist policy prescriptions that are based on broader crite-ria of fairness and that show appropriate concern for individual responsibility(Fleurbaey 2008, Kanbur et al. 2006). This reappraisal has in�uenced thinkingabout the ethical basis of inequality analysis: Devooght (2007) has examineda responsibility-sensitive approach to income inequality and Cowell and Ebert(2004) have shown how alternative philosophical approaches to welfarism can beencapsulated in inequality measures that are related to concepts of deprivation.These developments are likely to ensure that concerns with inequality will
remain high on the socio-economics research agenda for some time to come.
References
Acemoglu, D. (2002). Technical change, inequality, and the labor market.Journal of Economic Literature 40, 7�72.
Aghion, P., E. Caroli, and C. Garcia-Penalosa (1999). Inequality and eco-nomic growth: The perspectives of the new growth theories. Journal ofEconomic Literature 37, 1615�60.
14

Arrondel, L. and A. Laferrère (2001). Taxation and wealth transmission inFrance. Journal of Public Economics 79, 3�33.
Atkinson, A. B. (1970). On the measurement of inequality. Journal of Eco-nomic Theory 2, 244�263.
Atkinson, A. B. (1997). Bringing income distribution in from the cold. TheEconomic Journal 107, 297�321.
Atkinson, A. B. and A. Brandolini (2001). Promise and pitfalls in the use ofsecondary data-sets: Income inequality in oecd countries as a case study.Journal of Economic Literature 39, 771�799.
Bernheim, B. D. and A. Rangel (2005). Behavioral public eco-nomics: Welfare and policy analysis with non-standard decision mak-ers. Working Paper 11518, National Bureau of Economic Research,http://www.nber.org/papers/w11518.
Bertola, G. (1993). Factor shares and savings in endogenous growth. TheAmerican Economic Review 83, 1184�1198.
Blau, F. D. and L. M. Kahn (1996). International di¤erences in male wageinequality: institutions versus market forces. Journal of Political Econ-omy 104 (4), 791�837.
Blundell, R. and I. Preston (1998). Consumption inequality and income un-certainty. The Quarterly Journal of Economics 113, 603�640.
Burtless, G. (1995). International trade and the rise in earinings inequality.Journal of Economic Literature 33 (2), 800�816.
Charness, G. and M. Rabin (2002). Understanding social preferences withsimple tests. Quarterly Journal of Economics 117, 817�869.
Chateauneuf, A., M. Cohen, and I. Meilijson (2004). Four notions of mean-preserving increase in risk, risk attitudes and applications to the rank-dependent expected utility model. Journal of Mathematical Economics 40,547�571.
Chateauneuf, A. and P. Moyes (2000). Inequality measurement and theweak-ening of the transfer principle. Technical report, GRAPE.
Cowell, F. A. (2000). Measurement of inequality. In A. B. Atkinson andF. Bourguignon (Eds.), Handbook of Income Distribution, Chapter 2, pp.87�166. Amsterdam: North Holland.
Cowell, F. A. (2007). Measuring Inequality (Third ed.). Hemel Hempstead:Oxford University Press.
Cowell, F. A. and U. Ebert (2004). Complaints and inequality. Social Choiceand Welfare 23, 71�89.
Cowell, F. A. and M.-P. Victoria-Feser (2007). Robust stochastic dominance:A semi-parametric approach. Journal of Economic Inequality 5, 21�37.
15
Cremer, H. and P. Pestieau (2006). Wealth transfer taxation: a survey of thetheoretical literature. In L.-A. Gérard-Varet, S.-C. Kolm, and J. Mercier-Ythier (Eds.), Handbook of the Economics of Giving, Reciprocity and Al-truism, Volume 1. Amsterdam: North Holland.
Dalton, H. (1920). Measurement of the inequality of incomes. The EconomicJournal 30, 348�361.
Devooght, K. (2007). To each the same and to each his own: A proposal tomeasure responsibility-sensitive income inequality. Economica 74.
DiNardo, J. and J.-S. Pischke (1997). The returns to computer use revis-ited: Have pencils changed the wage structure too? Quarterly Journal ofEconomics 112, 291�303.
Fehr, E. and U. Fischbacher (2002). Why social preferences matter � theimpact of non-sel�sh motives on competition, cooperation and incentives.The Economic Journal 112, C1�C33.
Fehr, E. and U. Fischbacher (2003). The nature of human altruism. Na-ture 425, 785�791.
Fernández, R., N. Guner, and J. Knowles (2005). Love and money: A theoret-ical and empirical analysis of household sorting and inequality. QuarterlyJournal of Economics 120, 273�344.
Ferrer-i-Carbonell, A. (2005). Income and well-being: an empirical analysis ofthe comparison income e¤ect. Journal of Public Economics 89, 997�1019.
Fleurbaey, M. (2008). Fairness, Responsibility and Welfare. Oxford UniversityPress.
Goldin, C. and L. F. Katz (1996). Technology, skill, and the wage structure:Insights from the past. American Economic Review 86, 252�257.
Gottschalk, P. and T. M. Smeeding (1997). Cross-national comparisons ofearnings and income inequality. Journal of Economic Literature 35, 633�687.
Gottschalk, P. and T. M. Smeeding (2000). Empirical evidence on income in-equality in industrialized countries. In A. B. Atkinson and F. Bourguignon(Eds.), Handbook of Income Distribution, Chapter 3. Amsterdam: NorthHolland.
Inglehart, R., M. Basáñez, J. Díez-Medrano, L. Halman, and L. Luijkx (Eds.)(2004). Human Beliefs and Values: A Cross-cultural Sourcebook based onthe 1999-2002 Values Surveys. Mexico: Siglo Veinteiuno.
Ioannides, Y. M. and L. D. Loury (2004). Job information networks, neigh-borhood e¤ects, and inequality. Journal of Economic Literature 42, 1056�1093.
Kaldor, N. (1955). Alternative theories of distribution. The Review of Eco-nomic Studies 23, 83�100.
16

Kalecki, M. (1939). Essays in the Theory of Economic Fluctuations. London:Allen and Unwin.
Kanbur, R., J. Pirttilä, and M. Tuomala (2006). Non-welfarist optimal taxa-tion and behavioural public economics. Journal of Economic Surveys 20,849�868.
Kleiber, C. and S. Kotz (2003). Statistical Size Distributions in Economicsand Actuarial Sciences. Hoboken. N.J.: John Wiley.
Kopczuk, W. and J. P. Lupton (2007). To leave or not to leave: The distrib-ution of bequest motives. Review of Economic Studies 74, 207�235.
Krueger, A. B. (1993). How computers have changed the wage structure:Evidence from microdata. Quarterly Journal of Economics 108, 33�60.
Krugman, P. and A. J. Venables (1995). Globalization and the inequality ofnations. The Quarterly Journal of Economics 110, 857�880.
Liu, H. and J. Lu (2006). Measuring the degree of assortative mating. Eco-nomics Letters 92, 317�322.
Lorenz, M. O. (1905). Methods for measuring concentration of wealth. Journalof the American Statistical Association 9, 209�219.
Manning, A. (2003). Monopsony in Motion: Imperfect Competition in LaborMarkets. Princeton, N.J.: Princeton University Press.
Manski, C. F. (2000). Economic analysis of social interactions. The Journalof Economic Perspectives 14, 115�136.
Marjit, S. and R. Acharyya (2003). International Trade, Wage Inequality andthe Developing Economy: A General Equilibrium Approach. Springer.
Pareto, V. (1965). Écrits sur La Courbe de la Repartition de la Richesse,Volume 3 of Oeuvres Complètes. Geneva: Librairie Droz.
Pasinetti, L. L. (1962). Rate of pro�t and income distribution in relation tothe rate of economic growth. The Review of Economic Studies 29, 267�279.
Pen, J. (1974). Income Distribution (second ed.)., Chapter 3, pp. 48�59. Lon-don: Allen Lane, The Penguin Press.
Persky, J. (1992). Retrospectives: Pareto�s law. The Journal of EconomicPerspectives 6 (2), 181�192.
Piketty, T. (2000). Theories of persistent inequalities. In A. B. Atkinson andF. Bourguignon (Eds.), Handbook of Income Distribution, Chapter 6, pp.429�476. Amsterdam: North Holland.
Piketty, T. (2007). Top incomes over the twentieth century: A summary ofthe main �ndings. In A. B. Atkinson and T. Piketty (Eds.), Top IncomesOver the Twentieth Century: A Contrast Between Continental Europeanand English-Speaking Countries. Oxford University Press.
Piketty, T. and E. Saez (2003). Income inequality in the United States, 1913-1998. Quarterly Journal of Economics 118, 1�39.
17

Richardson, J. D. (1995). Income inequality and trade: How to think, whatto conclude. The Journal of Economic Perspectives 9, 33�55.
Sala-i-Martin, X. (2006). The world distribution of income: Falling povertyand ... convergence, period. Quarterly Journal of Economics 121, 351�397.
Salanié, B. (1997). The Economics of Contracts: A Primer. CambridgeMassachusetts: MIT Press.
Sen, A. K. (1979). Personal utilities and public judgements: or what�s wrongwith welfare economics? The Economic Journal 89, 537�558.
Sen, A. K. and J. E. Foster (1997). On Economic Inequality (Second ed.).Oxford: Clarendon Press.
Shorrocks, A. F. (1983). Ranking income distributions. Economica 50, 3�17.
Sierminska, E., A. Brandolini, and T. Smeeding (2006). The LuxembourgWealth Study - a cross-country comparable database for household wealthresearch. Journal of Economic Inequality 4, 375�383.
18