Embed Size (px)
Citation preview
Afyon Kocatepe Üniversitesi Sosyal Bilimler Dergisi / Cilt: 19, Sayı: 2, Aralık 2017, 235-250
235
Income Distribution and Economic Growth:
A Complementary Cross Country Study to the Kuznets
Curve*
DOI NO: 023106710054068 Abdullah KESKİN**
Geliş Tarihi: 16.04.2017
Kabul Tarihi: 08.12.2017
Abstract
This study aims to analyze the relationship between income distribution and
economic growth using cross country data. The study also investigates whether
there is a certain level of Gini coefficient which maximizes GDP growth rate. The
available data on Gini coefficients and GDP growth rates of 105 countries is used to
test a nonlinear relationship between these two variables, namely Inequality-Growth
Curve (IGC). The model is first estimated for 2001 and then the estimation is
repeated for 2011. The Gini coefficient which maximizes GDP growth rate is
estimated as 0,436 for 2001 and 0,464 for 2011. Also, IGC is compared with
Kuznets Curve. This paper suggests that, being opposite to the common sense,
developing countries should reduce income inequality to increase their GDP growth
rates while developed countries should increase.
Key Words: Income Distribution, Gini Coefficient, Economic Growth Rate,
Inequality-Growth Curve, Kuznets Curve.
Gelir Dağılımı ve Ekonomik Büyüme: Kuznet Eğrisi'ni
Tamamlayıcı Ülkeler Arası Bir Yatay Kesit Çalışma
Özet
Bu çalışma, yatay kesit veri kullanılarak gelir dağılımı ile ekonomik
büyüme arasındaki ilişkiyi analiz etmeyi amaçlamaktadır. Çalışma ayrıca ülkelerin
GSYİH büyüme oranını maksimize eden Gini katsayısını araştırmaktadır.
Çalışmada, bu iki değişken arasındaki ilişkiyi test etmek için 105 ülkeye ait veriler
* This paper was presented at Turgut Ozal International Congress on Economics and Politics
in Malatya-Turkey which took place between 15-16 April 2010 and published in conference
proceedings as a full paper. The origional paper has been revised and developed using another
year data and reviewing related literature. ** Assoc. Prof. Dr., Afyon Kocatepe University, Faculty of Economics and Administrative
Sciences, Department of Economics, [email protected]
Abdullah Keskin / Income Distribution and Economic Growth: A Complementary Cross
Country Study to the Kuznets Curve
236
kullanılarak doğrusal olmayan bir regresyon denklemi tahmin edilmektedir. Bu ilişki
Gelir Dağılımı-Büyüme Eğrisi (IGC) olarak adlandırılmaktadır. Regresyon modeli
önce 2001 yılı verileriyle tahmin edilmekte, daha sonra 2011 verileriyle süreç
yinelenmektedir. GSYİH büyüme oranını maksimize eden Gini katsayısı 2001 yılı
verileriyle 0,436 ve 2011 yılı verileriyle 0,464 olarak tahmin edilmiştir. Ayrıca IGC,
Kuznet Eğrisiyle karşılaştırılmaktadır. Bu çalışmadaki bulgular, genel kanının
aksine, ekonomik büyüme oranını artırmak için gelişmekte olan ülkelerin gelir
dağılımı eşitsizliğini azaltan politikalar uygulaması gerektiği, gelişmiş ülkelerin ise
gelir dağılımı eşitsizliğini azaltan politikalardan uzak durması gerektiği sonucuna
varmaktadır.
Anahtar Kelimeler: Gelir Dağılımı, Gini Katsayısı, Ekonomik Büyüme
Oranı, Gelir Dağılımı-Büyüme Eğrisi, Kuznets Eğrisi.
Introduction
Income distribution is one of several factors affecting economic
growth as many studies reveal. But the studies are split about the shape of
relationship between income distribution and economic growth. Some
studies1 reveal that income inequality induces economic growth. In this case,
income inequality can provide incentives for innovation and
entrepreneurship and can also increase saving and investment. Some other
studies, in contrast, reveal that income inequality reduce economic growth
because inequality can prevent the building of human capital (causing
insufficient education and health) and inequality also leads to political and
economic instability that discourages investment. In the case of large income
inequality, economy makes use of resources of country to provide the luxury
needs of small rich group of country instead of providing basic needs of
large poor group. It is argued that while income inequality increases,
economic growth decreases as a result of disappearance of peace and
increase of social problems. On the other hand, it is also argued that income
equality also negatively affects economic growth since lack of motivation
becomes a barrier to economic growth. The other studies reveal that the
relationship between income distribution and economic growth may be
nonlinear. It means that increases in income inequality from low levels can
enhance economic growth, but as income inequality rises beyond a certain
level it reduces economic growth. So, what the optimal level of income
distribution should be, which induces economy to maximum growth level, is
the main question of this study.
The rest of the study is organized as following: The second section
reviews the literature, the third section introduces data sources and
1 Studies are all mentioned in the literature review.
Afyon Kocatepe Üniversitesi Sosyal Bilimler Dergisi / Cilt: 19, Sayı: 2, Aralık 2017, 235-250
237
methodology, the fourth sections reveals empirical results, and the last
section ends with a conclusion.
1. Literature Review
Income distribution and its impact on the economic growth has been
studied particularly since the 1950’s. It has been continued to be an
important study topic since then. It began with Simon Kuznets' studies
(1955; 1963) on an inverted-U shaped relationship between income
inequality and per capita GNP. Kuznets suggested that as per capita income
rise in the early stage of development, income inequality also rise, then
reaches a maximum, and at last declines as income levels rise further in the
later stage of development periods. Kuznets developed his hypothesis
studying data estimating income distribution in a few rich and a few poor
countries and studying trends in distribution in few European countries over
time (Perkins at all, 2001: 129). Following this path breaking hypothesis,
many developing countries tolerated rising income inequality believing that
income would become more equally distributed with advanced development.
Some later studies [Galor and Zeira (1993); Brueckner and Lederman
(2015)] using income distribution and per capita income confirm Kuznets
hypothesis. Unfortunately, some other studies particularly using income
distribution and economic growth instead of per capita income reveal
conflicting results. Some of these studies find a negative relationship
between income inequality and economic growth [Persson and Tabellini
(1994), Alesina and Rodrik (1994), Clarke (1995), Perotti (1996), Benabou
(1996), Gottschalk and Smeeding (1997), Deininger and Squire (1997),
Aghion at all. (1999)] while other studies find a positive relationship
between them [Adelman and Robinson (1989), Li at all (1998), Forbes
(2000)].
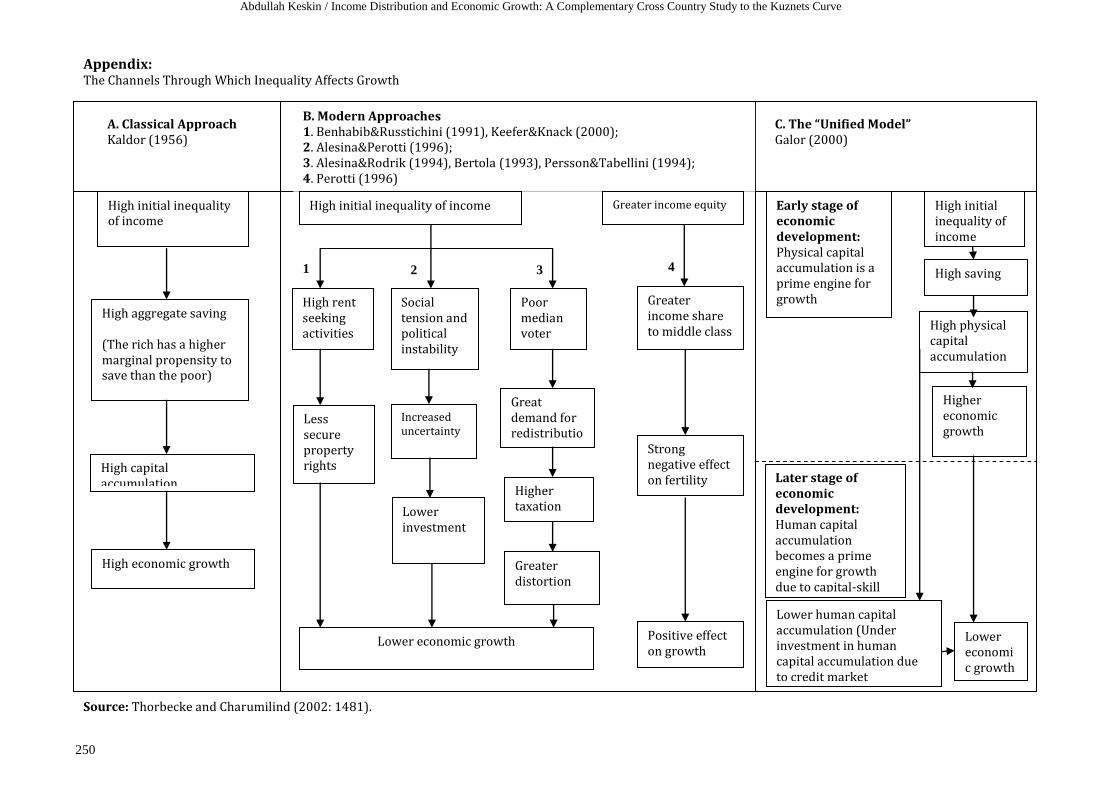
There are three approaches which explain the relationship between
income distribution and economic growth2. These are classical approach
[Kaldor (1956)], modern approach [Benhabib and Russtichini (1991), Keefer
and Knack (2000), Alesina and Perotti (1996), Alesina and Rodrik (1994),
Bertola (1993), Persson and Tabellini (1994), Perotti (1996)] and the unified
model [Galor (2000)]. According to the classical approach, it has been
argued that income inequality and the accumulation of wealth in a small
proportion of individuals would result in higher growth in the future. There
may be three reasons for positive relationship (Dadkhah, 2006): First, the
rich consume proportionately less of their income and a higher propensity to
save stimulate a faster growth rate. Second, indivisibility of investment
2 Three channels through which how income inequality affects economic growth are given in
the Appendix.
Abdullah Keskin / Income Distribution and Economic Growth: A Complementary Cross
Country Study to the Kuznets Curve
238
project make the concentration of resources in a few hands a prerequisite for
investment and growth. Finally, workers and employers require incentive to
exert their utmost efforts. A society committed to equality would not provide
the incentive system necessary for growth. However, there could be a
negative impact of income inequality on growth as argued others (the
modern approaches and the unified model). There may be three reason for
negative relationship (Dadkhah, 2006): First, inequality reduces investment
opportunities. Second, inequality worsens borrowers’ incentives. Finally,
inequality generates macroeconomic volatility. If a country experiences high
income inequality, there is great pressure from the poor to redistribute the
wealth accumulation. The high taxes levied to redistribute the wealth lower
the rate of return on private assets, which restricts capital accumulation and
decelerates growth (Clarke, 1995).
A case study (Benabou, 1996) displaying contrary relationship
between income inequality and economic growth is that of South Korea and
Philippines. These two countries looked quite similar in the early 1960’s
with regard to major macroeconomic variables such as GDP per capita,
investment per capita, average saving rate, population, urbanizations,
primary and secondary school enrolment. However, these countries differed
in their income distribution. In 1965 South Korea’s Gini coefficient was 0,34
while the Philippines’ Gini coefficient was 0,51. They became 0,34 and 0,46
respectively in 1988. During the next thirty years, fast growth in South
Korea resulted in a five-fold increase of the output level even though it has
pretty income distribution, while the Philippines’ output level barely doubled
with its inequality in income distribution.
Deininger and Squire (1997), using cross country data, apply
different approach to capture the relationship between income distribution
and economic growth. They use land distribution as asset distribution instead
of income distribution and find negative relationship with economic growth.
They state: "Many economists have long believed that income disparities
increase in the early stages of development, making the poor relatively
worse off. Recent research suggests that an unequal distribution of income
can hamper growth."
Krongkaew and Mat Zin (2006) attempts to find the relationship
between rapid economic growth and income inequality in eight East Asian
countries. These countries are China, Indonesia, Korea, Malaysia,
Philippines, Singapore, Thailand and Vietnam. The study states that “income
distribution associated with the different patterns of growth differs from one
country to another, making the relationship between economic growth and
income inequality non-uniform. Some may achieve the Kuznets type growth,
Afyon Kocatepe Üniversitesi Sosyal Bilimler Dergisi / Cilt: 19, Sayı: 2, Aralık 2017, 235-250
239
that is, income inequality increases as the country grows, but some may have
the opposite effects”.
Wells (1988: 28) states that income inequality prevents a large
portion of the population from improving their knowledge and skill through
education which slows the social development. However, social
development is very important for social capital accumulation.
Samanta and Heyse (2006) study on the relationship between income
inequality and economic growth based on panel data over the period 1966-
1991 in developing countries. The study reveals that developing countries
with higher income inequality do not grow slower than developing countries
with a more equal income distribution.
Barro (2000) presents empirical evidence that indicates higher
inequality reduces growth in poor countries and increase growth in richer
countries. He also presents theoretical analysis of the macroeconomic
mechanisms, including credit market imperfections, political economy,
socio-political unrest, saving rates, in which income inequality relates to
economic growth. Barro explains situations that could have either positive or
negative effects on growth. The uncertain effect of all the interrelated factors
can be seen through the empirical study.
Birdsall (2007) states that high levels of income inequality (at or
above a Gini coefficient of 0,45) is more likely to harm economic growth in
countries at low levels of income. Theory and evidence suggest that high
income inequality affects economic growth first, "through interaction with
incomplete and underdeveloped markets for capital and information";
second, "by discouraging the evolution of the economic and political
institutions associated with accountable government"; third, "by
undermining the civic and social life that sustains effective collective
decision-making".
The studies on relationship between income distribution and
economic growth claim that high level of income inequality affects
economic growth negatively. One reason for this is that high level of income
inequality prevents the formation of political and economical institutions
necessary for investment and economic growth. Another reason is that high
level of income inequality leads to alienations among people. And some
other studies also indicate that income inequality associated with
underdeveloped markets and institutions prevent economic growth (Derviş,
2007).
Abdullah Keskin / Income Distribution and Economic Growth: A Complementary Cross
Country Study to the Kuznets Curve
240
2. Data Sources And Methodology
This study uses the Gini coefficients data as income distribution and
GDP growth rates data as economic growth3. Data on the Gini coefficients,
GDP growth rates and per capita income for 105 countries is taken from
World Development Report 2000-2001 and World Bank web site4. World
Bank separates countries in three sub-groups depending on their per capita
GNP5. These sub-groups are;
- High Income Countries ($9266 or over)
- Middle Income Countries (from $755 to $9265)
- Low Income Countries ($755 or lower)
Since it is convenient, meaningful and generally accepted, the
countries in high income group are taken as developed countries while those
in low income and middle income groups are taken as developing countries
(WDR, 1998-1999: 251).
There are various methods to measure income distributions such as
the Coefficient of Variation, the Theil's Index, and the Gini coefficient
(Clarke, 1995). The most used method is Lorenz Curve and Gini coefficient.
Lorenz Curve can be obtained by adding percentage of national income on
the vertical axis and each 20% of population from the poorest to the richest
on the horizontal axis cumulatively. We can compare the average Gini
coefficients of developed and developing country groups to see the
difference.
The study attempts to evaluate income inequality and economic
growth using data of 105 countries for the years 2001 and 2011. First, the
difference between 23 developed and 82 developing country groups is
investigated in terms of income distribution using Lorenz Curves. If the
Lorenz Curves of developed and developing countries differ from each
other, then, one may assume that income distribution is one of the main
determinants of the difference in economic growth between developed and
developing country groups. If such a relationship exists, one may look for a
certain level of income distribution for a country which maximize its
economic growth rate. Then, the relationship between income distribution
and economic growth may be investigated and estimated by using nonlinear
regression model. In this study, a nonlinear regression model is used for
3 Kuznets uses per capita income data of countries to capture the stages of development. 4http://data.worldbank.org/indicator/NY.GNP.PCAP.CD (Access date: 12.12.2015) 5 World Bank has changed its country classification later on, but using old classification doesn't cause any serious problem in this study.

Afyon Kocatepe Üniversitesi Sosyal Bilimler Dergisi / Cilt: 19, Sayı: 2, Aralık 2017, 235-250
241
investigation of the relationship between income distribution and economic
growth.
3. Empirical Studies And Results
The Lorenz Curves of developed and developing country groups are
plotted at the Figure 1. The curve close to the equality line belongs to the
developed countries while the other one belongs to the developing countries.
It is seen in the Figure 1 that in developing countries income inequality is
higher than developed ones.
Figure 1: Lorenz Curves of Developed and Developing Countries
Source: The figure was formed by the author.
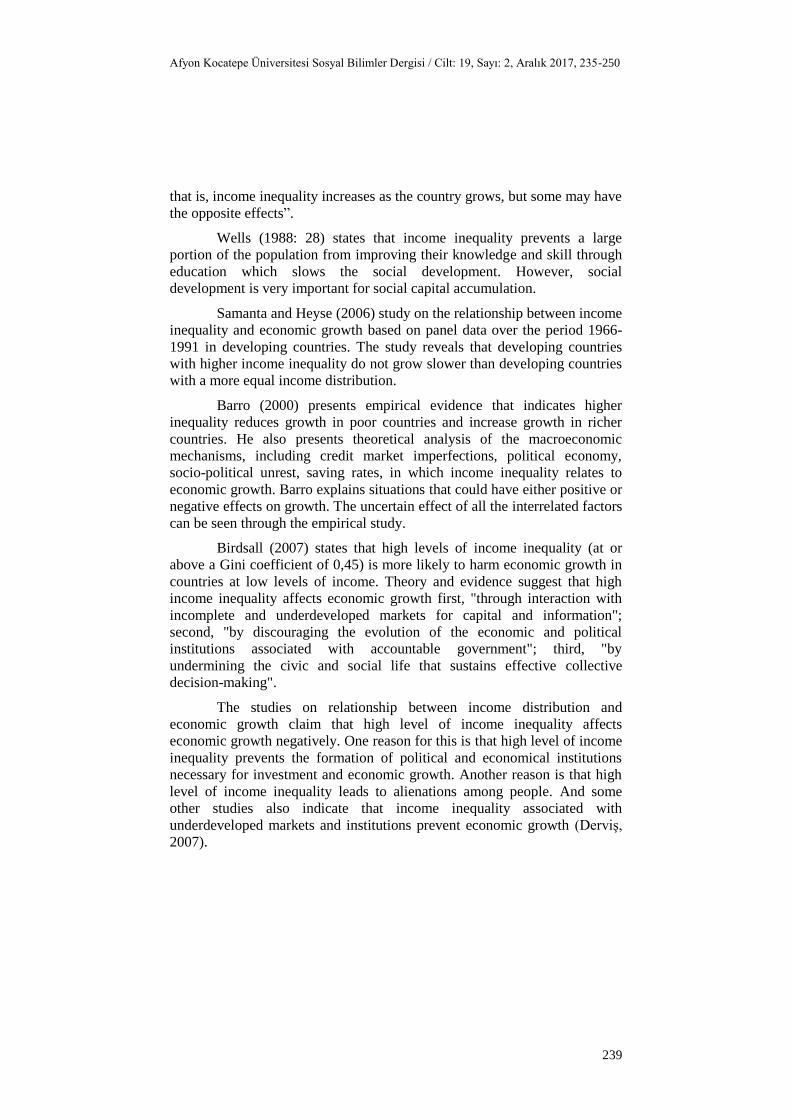
The Table 1 below supports the Figure 1. There are percentage shares of income for the
poorest and the richest 20% of the selected high inequality and low inequality countries in the Table 1.
In the high inequality countries (Guatemala, Paraguay, Brazil, Swaziland and New Zealand), the
percentage share of income of the poorest 20% of the population changes between 2.1 and 2.7, while
the same percentage share of income of the low inequality countries (Slovak Republic, Japan, Austria,
0
20
40
60
80
100
0 20 40 60 80 100
Cu
mu
lati
ve
% o
f G
NP
Cumulative % of POPULATION
Equity Line
Lorenz Curve of Developed Countries
Lorenz Curve of Developing Countries
Abdullah Keskin / Income Distribution and Economic Growth: A Complementary Cross Country Study to the Kuznets Curve
242
Czech Republic and Finland) changes between 10.0 and 11.9. The percentage share of income of the
richest 20% of the population for the high inequality countries changes between 46.9 and 64.4, while
the same percentage share of income of the low inequality countries changes between 31.4 and 35.7.
High inequality countries are mostly developing countries while low inequality countries are mostly
developed countries.
Table 1: Percentage share of income (poorest and richest 20 percent of the population)
High Inequality
Countries
Lowest 20% Highest 20% Low Inequality
Countries
Lowest 20% Highest 20%
Guatemala 2.1 63.0 Slovak Republic 11.9 31.4
Paraguay 2.3 62.4 Japan 10.6 35.7
Brazil 2.5 63.8 Austria 10.4 33.3
Swaziland 2.7 64.4 Czech Republic 10.3 35.9
New Zealand 2.7 46.9 Finland 10.0 35.8
Source: World Bank, World Development Indicators 2000.
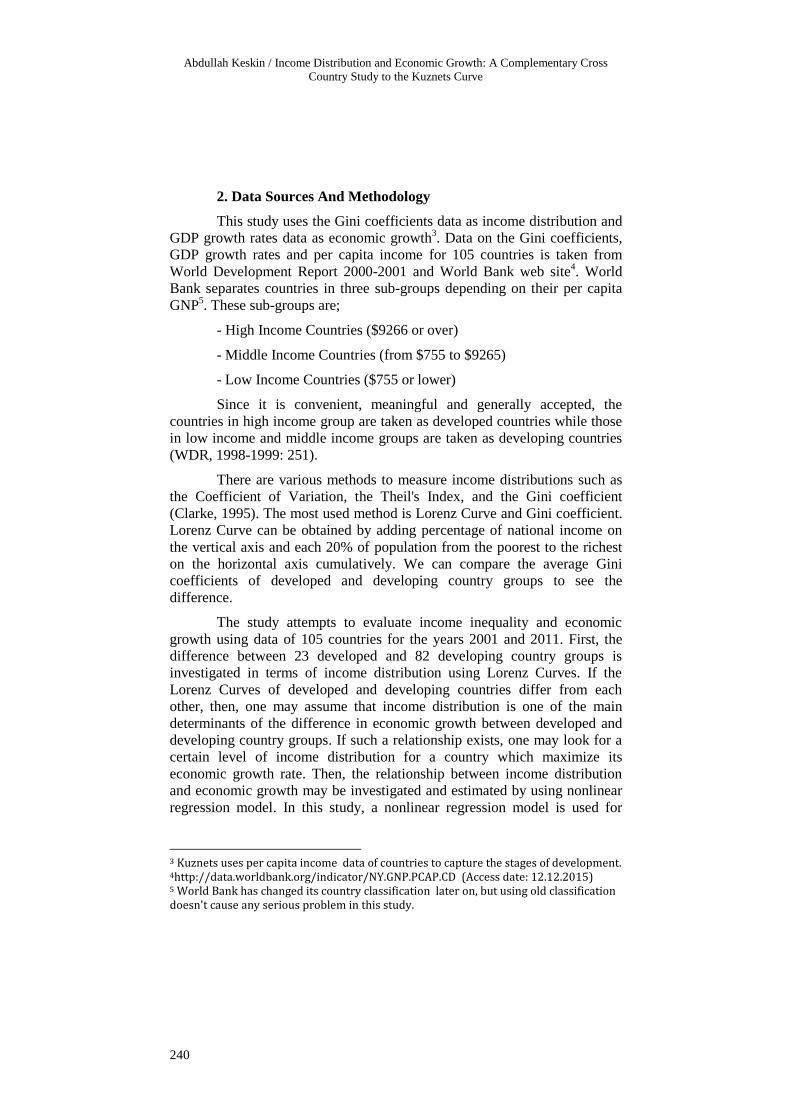
Studies reveal both positive and negative relationships between income distribution and
economic growth rate. The relationship between income distribution and economic growth rate could
be similar to the one at Figure 2.
Figure 2: The Inequality and Growth Curve (IGC)
Source: The figure was drawn by the author.
It is expected that income distribution and economic growth have a nonlinear relationship. In
the extreme case of perfect income inequality, Gini coefficient is 1, which means one gets all while the
rest gets nothing. In this extreme case, there is no economic growth because of the lack of demand for
goods and services. In the other extreme case of perfect equality, Gini coefficient is 0, which means
everybody gets the equal amount of income, but there is insufficient growth because of the lack of
production and supply as a result of the lack of motivation as well as low productivity. Between 0 and
1, it is expected that economic growth rate gets higher and higher to the optimum level of income
distribution which may also change depending on the stage of economic development and other
factors (political system, demography, social, religious, geographic factors, etc.) of each country.
Developed Countries
Economic Growth Rate (%)
0 0,1 0,2 0,3 0,4 0,5 0,6 0,7 0,8 0,9 1
Gini Coefficients
Maximum Growth Rate
Developing Countries
Afyon Kocatepe Üniversitesi Sosyal Bilimler Dergisi / Cilt: 19, Sayı: 2, Aralık 2017, 235-250
243
Cornia and Court (2004)concludes that extreme equality and inequality in income cause slow
growth. Extreme equality leads to eroding working incentive, increasing free riding behavior,
increasing high supervision costs, increasing labor shirking and corruption in the redistribution system
while extreme inequality leads to erosion of social cohesion, increasing social unrest, social conflicts,
rent seeking, decreasing progress in education and accumulation of human capital, and uncertain
property rights. Therefore there should be an "efficient inequality range" between 0 and 1.
As it is seen at the Figure 2, there are two different Gini coefficients which provide the same
rate of economic growth. How could this be possible? The answer may be the difference in
characteristic properties of the developed and the developing countries: The developed countries have
lower Gini coefficients than the developing countries. Therefore, the developed countries are at the left
side of optimal Gini coefficient, while the developing countries are at the right side of it . There are
some different dynamics in the developed and developing countries that drive the countries to the
optimal Gini coefficient that guarantees the highest economic growth rate. One may argue that, while
internal dynamics of market economy, in the developed countries, raise inequality by creating the rich
and the poor, the developed civil society and its pressure on the parliament in democratic environment
decreases the inequality from the optimum level to the left. On the other hand, in the developing
countries, the income inequality is higher than the optimal level because of the lack of institutional
structures. But as the civil society develops, its pressure on the parliament reduces the inequality to the
optimal level.
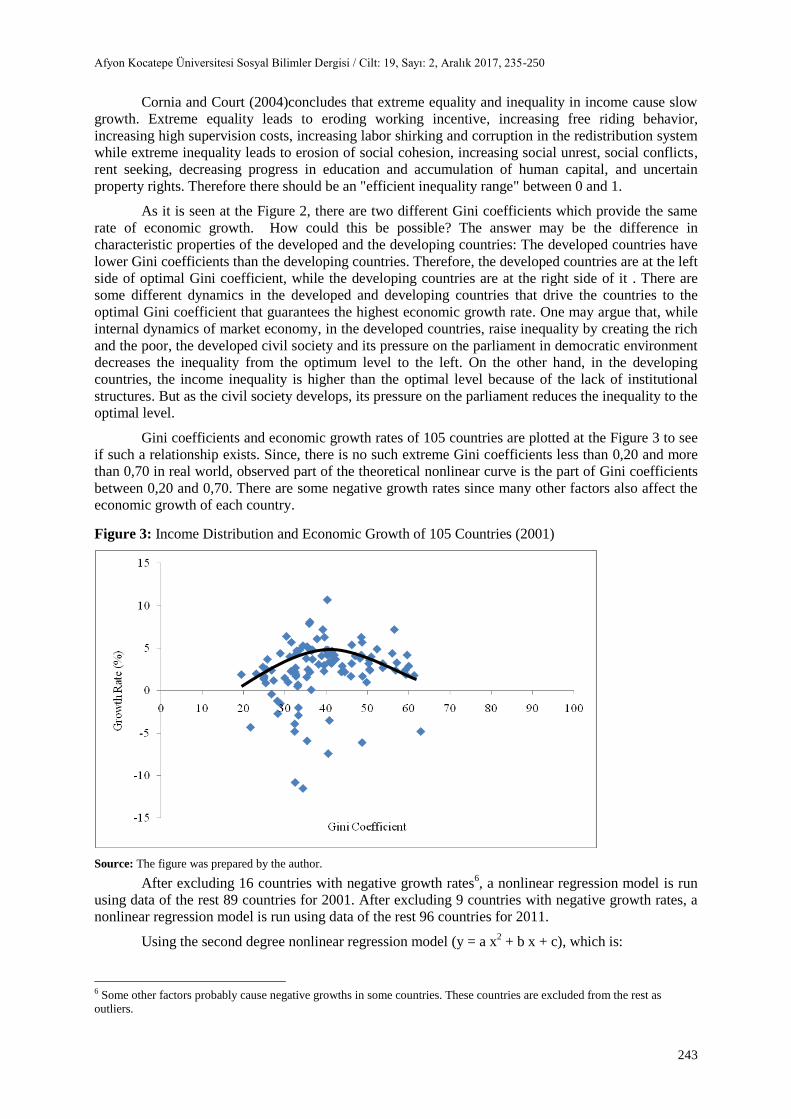
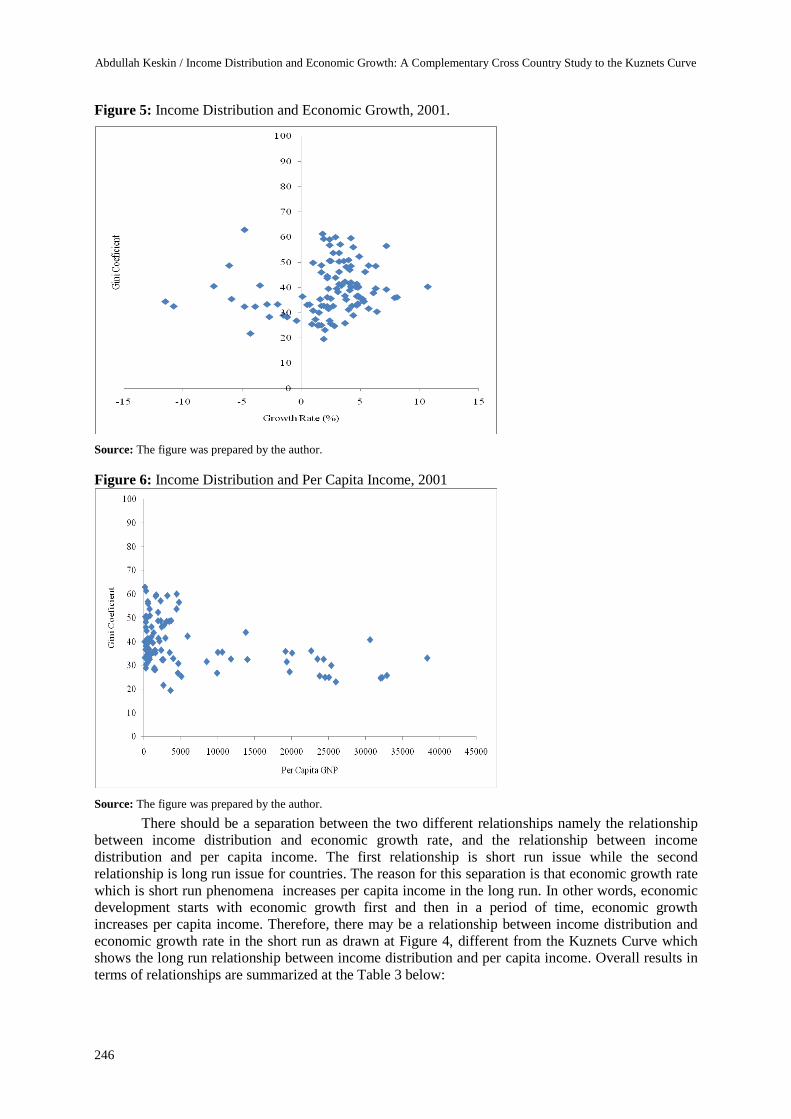
Gini coefficients and economic growth rates of 105 countries are plotted at the Figure 3 to see
if such a relationship exists. Since, there is no such extreme Gini coefficients less than 0,20 and more
than 0,70 in real world, observed part of the theoretical nonlinear curve is the part of Gini coefficients
between 0,20 and 0,70. There are some negative growth rates since many other factors also affect the
economic growth of each country.
Figure 3: Income Distribution and Economic Growth of 105 Countries (2001)
Source: The figure was prepared by the author.
After excluding 16 countries with negative growth rates6, a nonlinear regression model is run
using data of the rest 89 countries for 2001. After excluding 9 countries with negative growth rates, a
nonlinear regression model is run using data of the rest 96 countries for 2011.
Using the second degree nonlinear regression model (y = a x2 + b x + c), which is:
6 Some other factors probably cause negative growths in some countries. These countries are excluded from the rest as
outliers.

Abdullah Keskin / Income Distribution and Economic Growth: A Complementary Cross Country Study to the Kuznets Curve
244
Economic Growth Rate = 0 + 1 Gini Coefficient + 2 Gini Coefficient2 +
The Estimation results of nonlinear regression models are reported at the Table 2 for 2001 and
2011 as below.
Table 2: Estimation Results of Nonlinear Regression Models for 2001 and 2011
2001 2011
Economic Growth Rate Economic Growth Rate
Constant -6,4561
(-2,2596)
[0,0264]**
-10,1123
(-2,0166)
[0,0466]**
Gini Coefficient 0,4886
(3,4374)
[0,0009]***
0,6861
(2,7419)
[0,0073]***
Gini Coefficient2 -0,0056
(-3,3018)
[0,0014]***
-0,0074
(-2,4599)
[0,0157]**
R2 0,13 0,11
F 6,2162
[0,0030]***
6,01
[0,0035]***
Optimum Gini Coefficient
Maximum Growth Rate
0,436
%4,2
0,464
%5,8
The values in the parentheses are t-statistics.
The values in the square brackets are p-values.
*** % 1 significance level, ** % 5 Significance level, * %10 significance level.
Solution of the first equation for optimum Gini coefficient gives 0,436 which provides
maximum growth rate %4,2 for 2001. The same way, solution the second equation for optimum Gini
coefficient gives 0,464 which provides maximum growth rate that is %5,8 for 2011.
Both model pass stability test (CUSUM Test), the models are stable. Residuals of the models
have no serial correlation (Breusch-Godfrey Serial Correlation LM Test - Observed R-squared Chi-
Square p-value 0,1827 (2001); 0,1364 (2011)) and no heteroskedasticity (Breusch-Pagan-Godfrey
Heteroskedasticity Test - Observed R-squared Chi-Square p-value 0,2406 (2001); 0,4074 (2011)) but
they are not normally distributed (Histogram Normality Test - Jarque-Bera statistics p-value 0,0001
(2001); 0,0000 (2011)).
The Kuznets’ Curve and a complementary curve are drawn together below to compare. On the
vertical axis Gini coefficient is placed, on the horizontal axis per capita income for the Kuznets’ curve
and economic growth rate for the complementary curve are placed. The aim of drawing two curves
together is to shed light on how conflicting findings might be obtained as mentioned in the literature
review. At the Figure 4, the complementary curve shows positive and negative relationships between
income distribution and economic growth rates as the Kuznets’ curve shows positive and negative
relationships between income distribution and per capita income regarding to whether the countries
are developed or developing ones.
The complementary curve states that there is a negative relationship between income
distribution and economic growth rate for the developing countries which are at high inequality levels
(Figure 4, Part I) while there is positive relationship between income distribution and economic
growth rate for the developed countries which are low inequality levels (Figure 4, Part II).
As it is mentioned earlier, Kuznets explains the positive and negative relationships between
income distribution and per capita income depending on the stages of economic development.
Countries, in the early stages of economic development (the developing countries), have increasing
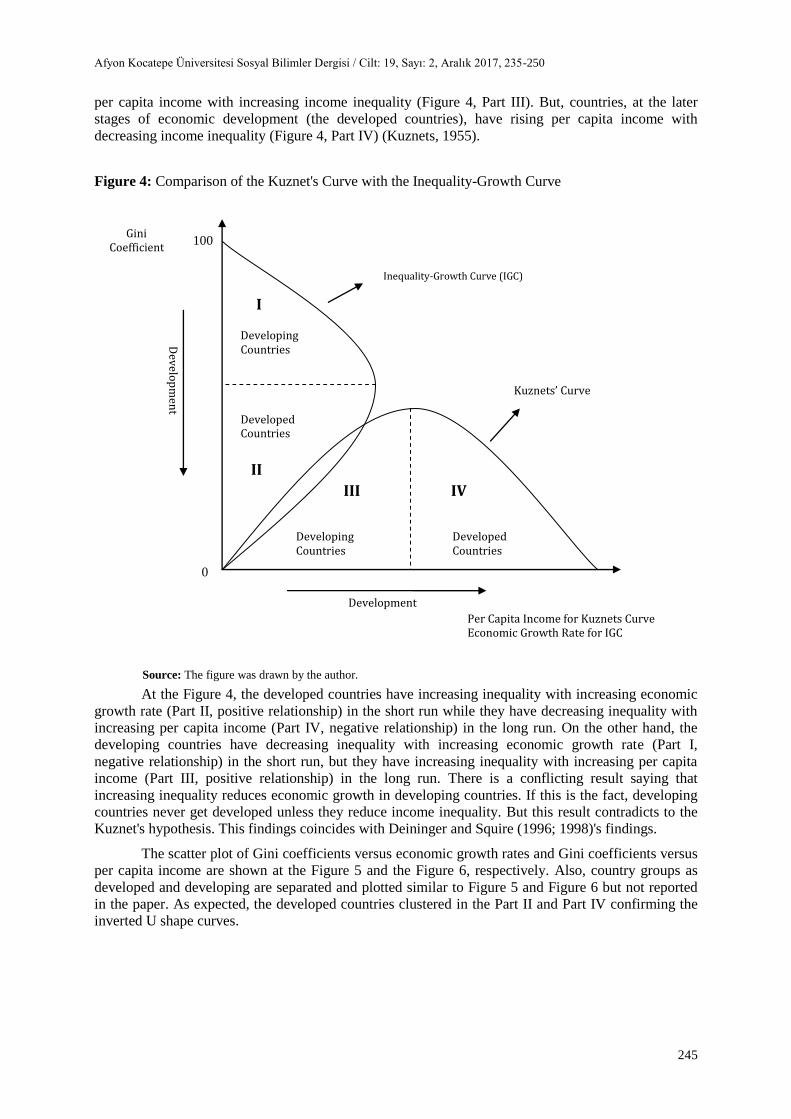
Afyon Kocatepe Üniversitesi Sosyal Bilimler Dergisi / Cilt: 19, Sayı: 2, Aralık 2017, 235-250
245
per capita income with increasing income inequality (Figure 4, Part III). But, countries, at the later
stages of economic development (the developed countries), have rising per capita income with
decreasing income inequality (Figure 4, Part IV) (Kuznets, 1955).
Figure 4: Comparison of the Kuznet's Curve with the Inequality-Growth Curve
Source: The figure was drawn by the author.
At the Figure 4, the developed countries have increasing inequality with increasing economic
growth rate (Part II, positive relationship) in the short run while they have decreasing inequality with
increasing per capita income (Part IV, negative relationship) in the long run. On the other hand, the
developing countries have decreasing inequality with increasing economic growth rate (Part I,
negative relationship) in the short run, but they have increasing inequality with increasing per capita
income (Part III, positive relationship) in the long run. There is a conflicting result saying that
increasing inequality reduces economic growth in developing countries. If this is the fact, developing
countries never get developed unless they reduce income inequality. But this result contradicts to the
Kuznet's hypothesis. This findings coincides with Deininger and Squire (1996; 1998)'s findings.
The scatter plot of Gini coefficients versus economic growth rates and Gini coefficients versus
per capita income are shown at the Figure 5 and the Figure 6, respectively. Also, country groups as
developed and developing are separated and plotted similar to Figure 5 and Figure 6 but not reported
in the paper. As expected, the developed countries clustered in the Part II and Part IV confirming the
inverted U shape curves.
Dev
elop
men
t
Gini Coefficient
Kuznets’ Curve
Developing Countries
Developed Countries
Developed Countries
Developing Countries
0
100
I
II
III IV
Development
Per Capita Income for Kuznets Curve Economic Growth Rate for IGC
Inequality-Growth Curve (IGC)
Abdullah Keskin / Income Distribution and Economic Growth: A Complementary Cross Country Study to the Kuznets Curve
246
Figure 5: Income Distribution and Economic Growth, 2001.
Source: The figure was prepared by the author.
Figure 6: Income Distribution and Per Capita Income, 2001
Source: The figure was prepared by the author.
There should be a separation between the two different relationships namely the relationship
between income distribution and economic growth rate, and the relationship between income
distribution and per capita income. The first relationship is short run issue while the second
relationship is long run issue for countries. The reason for this separation is that economic growth rate
which is short run phenomena increases per capita income in the long run. In other words, economic
development starts with economic growth first and then in a period of time, economic growth
increases per capita income. Therefore, there may be a relationship between income distribution and
economic growth rate in the short run as drawn at Figure 4, different from the Kuznets Curve which
shows the long run relationship between income distribution and per capita income. Overall results in
terms of relationships are summarized at the Table 3 below:
Afyon Kocatepe Üniversitesi Sosyal Bilimler Dergisi / Cilt: 19, Sayı: 2, Aralık 2017, 235-250
247
Table 3: Short Run Relationship Between Income Distribution and Economic Growth versus Long
Run Relationship Between Income Distribution and Per Capita Income
Developing Countries Developed Countries
SHORT RUN Relationship Between
Income Distribution & Economic Growth
Rate (The Inequality-Growth Curve)
Negative
Relationship
(economic growth decreases while
inequality increases)
Positive
Relationship
(economic growth and inequality both
increase or decrease)
LONG RUN Relationship Between
Income Distribution & Per Capita
Income (The Kuznets Curve)
Positive
Relationship
(inequality and per capita income
both increase or decrease)
Negative
Relationship
(inequality decreases while per capita
income increases)
Source: The table was prepared by the author.
This classification in the Table 3 may clarify the conflicting findings of the studies on the
topic in the literature. Clarification of the conflicting results still remains to new studies by
investigating the short run relationships between income distribution and economic growth rate, and
the long run relationships between income distribution and per capita income, respectively.
Conclusion
Studies on the relationship between income distribution and per capita income during stages of
economic development begin with Kuznets in 1950’s. However, some later studies using economic
growth rate instead of per capita income reveal conflicting results between income distribution and
economic growth. Some of the studies find a negative relationship while other studies find a positive
relationship.
This study states the fact that income distribution in the developed and developing countries is
significantly different from each other. It seems that inequality decreases in developed counties as a
consequence of economic and social policies, economic and social institutions while developing
countries are far away from equality probably because of prevailing various political, economic and
social problems, and lack of political, economic and social institutions.
In this study, the IGC is compared with the Kuznets Curve. The IGC curve shows sort run
relationship between income distribution and economic growth rate while the Kuznets Curve shows
the long run relationship between income distribution and per capita income. The reason for this
separation is that economic growth in the short run increases per capita income in the long run.
Since there is a strong relationship between income distribution and economic growth rate in
the short run, it could be suggested that one of the most important reasons of lower economic growth
may be extreme income inequality for developing countries and extreme income equality for
developed countries.
This study finds that, the optimum income distribution for the highest economic growth is the
one that Gini coefficient is around 0,45 regarding the data. It is another argument how to reach this
Gini coefficient. The first way may be governmental intervention for redistribution of income
providing equal opportunity in economic activities for everyone. This paper suggest that, being
opposite to the common sense, developing countries should decrease income inequality to the optimal
level to increase their economic growth rates while developed countries should increase. The second
way may be altruistic behaviour of individuals and social groups. The participation of other
nongovernmental organizations or decision makers like local governments, labor unions, the civil
organizations, associations, clubs, charitable foundations in decision making process may reduce
inequality and stimulate economic growth and per capita income.
There are still many remaining questions about the relationship between income inequality,
economic growth and per capita income. In other words, it seems that the relationship between income
inequality, economic growth and per capita income is far from well understood yet.
Abdullah Keskin / Income Distribution and Economic Growth: A Complementary Cross Country Study to the Kuznets Curve
248
References
Adelman, I. and Robinson, S. 1989. Income Distribution and Development, H. Chenery and
T.N. Srinivisan (Eds.), Handbook of Development Economics, New York: North Holland.
Aghion, P., Caroli, E. and Garcia-Penalosa, C. 1999. Inequality and Economic Growth: The
Perspective of New Growth Theories, Journal of Economic Literature, 37(4), 1615-1660.
Alesina, A. and Perotti, R. 1996. Income Distribution, Political Instability, and Investment,
European Economic Review, 40, 1203-1228.
Alesina, A. and Rodrik, D. 1994. Distributive Policies and Economic Growth, The Quarterly
Journal of Economics, May, 109(2), pp. 465-490.
Barro, R.J. 2000. Inequality and Growth in A Panel of Countries, Journal of Economic
Growth, March, Boston, 5(1), 5-32.
Benabou, R. 1996. Inequality and Growth, NBER Working Paper, No: 5658.
Benhabib, J. and Rustichini, A. 1991. Social Conflict, Growth and Income Distribution,
Department of Economics, New York University.
Bertola, G. 1993. Factor Shares and Savings in Endogenous Growth, American Economic
Review, 83, 1184-1199.
Birdsall, N. 2007. Income Distribution: Effects on Growth and Development, Center for
Global Development Working Paper 118, Center for Global Development, Washington, D.C.
Brueckner, M. and Lederman, D. 2015. Effects of Income Inequality on Aggregate Output,
World Bank Policy Discussion Paper 7317.
Clarke, G.R.G. 1995. More Evidence On Income Distribution and Growth, Journal of
Development Economics, 47(2), 403-427.
Cornia, G.A. and Court, J. 2004. Inequality, Growth and Poverty in the Era of Liberalization
and Globalization, UNU World Institute for Development Economics Research (UNU/WIDER).
Available at: https://www.researchgate.net/publication/265039268 (Access Date: 16.04.2017).
Dadkhah, K.M. 2006. Income Distribution and Economic Growth in the United States: 1947 –
2001,
Available at: ftp://ftp.soc.uoc.gr/students/aslanidis/My%20documents/papers/Dadkhah%20(2002).pdf
(Access Date: 24.03.2017).
Deininger, K. and Squire, L. 1996. A New Data Set Measuring Income Inequality, World
Bank Economic Review, 10, 565-591.
Deininger, K. and Squire, L. 1997. Economic Growth and Income Inequality: Reexamining
the Links, Finance and Development, March, 38-41.
Deininger, K. and Squire, L. 1998. New Ways of Looking at Old Issues: Inequality and
Growth, Journal of Development Economics, Vol. 57, 259-287.
Derviş, K. 2007. Küreselleşme, Büyüme ve Gelir Dağılımı, Uluslararası Ekonomik Sorunlar,
Kasım: 27, 1-9.
Forbes, K. 2000. A Reassessment of the Relationship Between Inequality and Growth, The
American Economic Review, September, 90(4), 869-887.
Galor, O. 2000. Income Distribution and the Process of Development, European Economic
Review, 56, 118-137.
Galor, O. and Zeira, J. 1993. Income Distribution and Macroeconomics, Review of Economic
Studies 60: 35-52.
Afyon Kocatepe Üniversitesi Sosyal Bilimler Dergisi / Cilt: 19, Sayı: 2, Aralık 2017, 235-250
249
Gottschalk, P. and Smeeding, T.M. 1997. Cross-National Comparison of Earnings and Income
Inequality, Journal of Economic Literature, 25, 633-687.
Kaldor, N. 1956. Alternative Theories of Distribution, Review of Economic Studies, 23(2), 94-
100.
Keefer, P. and Knack, S. 2000. Polarization, Politics and Property Rights: Links Between
Inequality and Growth, Policy Research Working Paper No: 2418, August, Washington DC: The
World Bank.
Keskin, A. 2010. Income Distribution and Economic Growth: A Cross Country Study, Turgut
Ozal International Conference on Economics, 15-16 April 2010, 704-720. Available
at:https://www.researchgate.net/profile/Abdullah_Keskin/publication/265147531_INCOME_DISTRI
BUTION_AND_ECONOMIC_GROWTH_A_CROSS_COUNTRY_STUDY/links/56aa833f08aed5a
01358a230.pdf
Krongkaew, M. and Mat Zin, R.H. 2006. Income Distribution and Sustainable Economic
Development in East Asia: A Comparative Analysis, Paper presented at the Conference on “Economic
Openness and Income Inequality: Policy Options for Developing Countries in the New Millennium”
organized by the International Development Economics Associates (IDEAS) and the Shanghai
Administration Institute (SAI), in Shanghai, China, 25-28 August.
Kuznets, S. 1955. Economic Growth and Income Inequality, American Economic Review,
45(1): 1-28.
Kuznets, S. 1963. Quantitative Aspects of the Economic Growth of Nations, III: The
Distribution of Income by Size, Economic Development and Cultural Change, 11, 1-92.
Li, H., Squire, L. and Zou, H. 1998. Explaining International and Intertemporal Variations in
Income Inequality, Economic Journal, 108, 26–43.
Perkins, D.H., Radelet, S. and Snodgrass, D.R. 2001. Economics of Development, 5. Edition,
Norton Company, New York.
Perotti, R. 1996. Growth, Income Distribution, and Democracy: What Data Say, Journal of
Economic Growth, June, 1(2), 149-187.
Persson, T. and Tabellini, G. 1994. Is Inequality Harmful for Growth? Theory and Evidence,
American Economic Review 84, 600-621.
Samanta, S.K. and Heyse, A. 2006. Income Inequality and Economic Growth in Developing
Countries: An Empirical Analysis, Indian Journal of Economics and Business, December, 5(2), 243-
254.
Thorbecke, E. and Charumilind, C. 2002. Economic Inequality and Its Socioeconomic Impact,
World Development, 30(9), 1477-1495.
Wells, D.C. 1988. The Theory of Leisure Class by Thorstein Veblen”, B.S. KATZ ve R.E.
ROBBINS (Ed.), Modern Economic Classics – Evolutions Through Time, Garland Reference Library
of Social Science, Cilt: 424, Garland Publishing Inc., New York.
World Bank 1999. World Development Report, 1998-1999, Washington: World Bank.
World Bank 2001. World Development Report, 2000-2001, Washington: World Bank.
World Bank 2000. World Development Indicators 2000, Washington: World Bank.
Abdullah Keskin / Income Distribution and Economic Growth: A Complementary Cross Country Study to the Kuznets Curve
250
A. Classical Approach Kaldor (1956)
B. Modern Approaches 1. Benhabib&Russtichini (1991), Keefer&Knack (2000); 2. Alesina&Perotti (1996); 3. Alesina&Rodrik (1994), Bertola (1993), Persson&Tabellini (1994); 4. Perotti (1996)
C. The “Unified Model” Galor (2000)
High initial inequality of income
High aggregate saving (The rich has a higher marginal propensity to save than the poor)
High capital accumulation
High economic growth
High initial inequality of income Greater income equity
High rent seeking activities
Less secure property rights
Lower economic growth
Social tension and political instability
Increased uncertainty
Lower investment
Poor median voter
Great demand for redistribution
Higher taxation
Greater distortion
Greater income share to middle class
Strong negative effect on fertility
Positive effect on growth
1 2 3 4
High initial inequality of income
High saving
High physical capital accumulation
Higher economic growth
Early stage of economic development: Physical capital accumulation is a prime engine for growth
Lower economic growth
Lower human capital accumulation (Under investment in human capital accumulation due to credit market imperfection)
Later stage of economic development: Human capital accumulation becomes a prime engine for growth due to capital-skill complemantarity
Appendix: The Channels Through Which Inequality Affects Growth
Source: Thorbecke and Charumilind (2002: 1481).