Embed Size (px)
Citation preview
115
Income disparities and poverty in the European Union member states32
Ireneusz Jaźwiński University of Szczecin Poland Abstract The paper gives an outline of the issues of income disparities and poverty with a special attention being paid to the European Union member states. Individual parts of the paper deal income diversity and poverty from a theoretical perspective, income disparities in the EU-countries based on different indicators, poverty in the EU-countries based on At-risk-of-poverty rate and Human Poverty Index. The final part of the paper contains elements of typology premises of EU-countries from the point of view of income diversity and poverty. Keywords: income disparity, poverty, European Union, social economy, European integration. Introduction The level of income disparity and poverty belongs to important indicators influencing the socio-economic development and other processes taking place in the social and economic realm. Facilitating rational income distribution and reducing poverty are mentioned among the main goals of public policy. It should be mentioned that such multidimensional phenomena as income disparity and poverty may be analyzed from many different perspectives, including the national and international, also within the European Union. It has to be emphasized that individual EU-countries are characterized by different income disparity and poverty levels. The objective of the paper is to compare the EU member states with regards to income disparity and poverty. Theoretical elements regarding income disparity and poverty It has to be mentioned within the context of considering the elements of theory regarding income disparity and poverty that exponents of social and economic sciences and politicians dealing with social and economic issues are researching the possibilities of optimizing income distribution and conditions necessary in limiting poverty and preventing its spread (Capeau and Decoster 2004; Young 2003). It is stressed that the occurrence of excessive earning differences is leading to deformation of development processes and causes social problems and conflicts (Staniek 2008, 110; Sztaudynger 2005, 68). On the other hand, placing too much emphasis on compensatory social policy and on income equalising may turn out to be acting against effectiveness and against motivation. The occurrence of income disparity may be connected with poverty described as not reaching the minimal standard of living. Poverty is a synonym of impoverishment and the opposite of welfare (Jaźwiński 2007, 32). Important public policy goals include limiting the range, depth, permanence and hereditary nature of poverty. Specialist literature contains descriptions of various kinds of
32 Scientific work financed from the funds of the Polish Ministry of Science and Higher Education for the years 2009-2011 as a research project no. N N114 297137.
Ireneusz Jaźwiński. “Income disparities and poverty in the European Union member states.” In Beyond Globalisation: Exploring the Limits of Globalisation in the Regional Context (conference proceedings), 115-121. Ostrava: University of Ostrava Czech Republic, 2010. http://conference.osu.eu/globalization/publ/14-jazwinski.pdf.
116
poverty. With regard to the reasons leading to impoverishment, three different kinds of poverty can be enumerated (Kabaj 2002, 14): • random poverty, caused by random occurrences during a person’s life: accidents, medical
conditions, divorces, natural catastrophes etc.; • subjective poverty caused by a lack of resourcefulness, low qualifications, reluctance to
take up work, dependence on state financial aid, various social pathologies, alcoholism, drug addiction etc.;
• structural poverty caused by external economic reasons: unemployment, reduction of state aid, low wages and pensions, income polarization, high prices, elimination of subsidies.
Income disparities in the European Union member states The level of income diversity and inequality, also in respect to comparisons in the European Union member states, can be measured taking different kinds of approaches (Förster and d’Ercole 2005), of which some are introduced further in the text. The Gini coefficient (Podgórski 2001, 75-78) is a measure of income distribution inequality. In literature, it is stressed that this coefficient can take values from the range [0; 1]. Zero value of the coefficient indicates a full equality of income distribution, and the one value means a full concentration – a situation, where one subject only has income. An increase in the coefficient indicates an increase in inequalities of income distribution. Additionally, in other approaches some other indicators can be used; such as the rate showing a proportion of average income of the richest 20% part of society to the average income of the poorest 20% part of society. Shortly this indicator is called the income inequality rate. Table 1 presents figures concerning income diversity in EU member states. The figures presented in Table 1 show, among other things, that: • EU member states with the smallest income diversification according to the Gini
coefficient are: Denmark, Sweden and the Czech Republic; • EU member states with the largest income diversification according to the Gini
coefficient are: Portugal and Latvia; • EU member states with the smallest income diversification according to the ratio of the
average income of the richest 20% part of society to the average income of the poorest 20% part of society and according to the ratio of the average income of the richest 10% part of society to the average income of the poorest 10% part of society are: Czech Republic, Hungary and Finland;
• EU member states with the biggest income diversification according to the ratio of the average income of the richest 20% part of society to the average income of the poorest 20% part of society and according to the ratio of the average income of the richest 10% part of society to the average income of the poorest 10% part of society are: Portugal, Great Britain and Latvia;
• EU member states with the smallest share of the richest 20% part of society in the total income are: Slovakia, Slovenia and Denmark;
• EU member states with the largest share of the richest 20% part of society in the total income are: Portugal, Latvia and Great Britain.
Ireneusz Jaźwiński. “Income disparities and poverty in the European Union member states.” In Beyond Globalisation: Exploring the Limits of Globalisation in the Regional Context (conference proceedings), 115-121. Ostrava: University of Ostrava Czech Republic, 2010. http://conference.osu.eu/globalization/publ/14-jazwinski.pdf.

117
Table 1. European Union member states according to income diversity A B C D E F G Austria 3.3 8.6 37.8 6.9 4.4 0.291 Belgium 3.4 8.5 41.4 8.2 4.9 0.330 Bulgaria 3.4 8.7 38.3 7.0 4.4 0.292 Cyprus X X X X X X CzechRepublic 4.3 10.3 35.9 5.2 3.5 0.254 Denmark 2.6 8.3 35.8 8.1 4.3 0.247 Estonia 2.5 6.7 42.8 10.8 6.4 0.358 Finland 4.0 9.6 36.7 5.6 3.8 0.269 France 2.8 7.2 40.2 9.1 5.6 0.327 Germany 3.2 8.5 36.9 6.9 4.3 0.283 Greece 2.5 6.7 41.5 10.2 6.2 0.343 Hungary 4.0 9.5 36.5 5.5 3.8 0.269 Ireland 2.9 7.4 42.0 9.4 5.6 0.343 Italy 2.3 6.5 42.0 11.6 6.5 0.360 Latvia 2.5 6.6 44.7 11.6 6.8 0.377 Lithuania 2.7 6.8 43.2 10.4 6.3 0.360 Luxemburg X X X X X X Malta X X X X X X The Netherlands 2.5 7.6 38.7 9.2 5.1 0.309 Poland 3.1 7.5 42.2 8.8 5.6 0.345 Portugal 2.0 5.8 45.9 15.0 8.0 0.385 Romania 3.3 8.1 39.2 7.5 4.9 0.310 Slovakia 3.1 8.8 34.8 6.7 4.0 0.258 Slovenia 3.6 9.1 35.7 5.9 3.9 0.284 Spain 2.6 7.0 42.0 10.3 6.0 0.347 Sweden 3.6 9.1 36.6 6.2 4.0 0.250 United Kingdom 2.1 6.1 44.0 13.8 7.2 0.360
Notations: A – state name; B – share of the poorest 10% part of society in total income (in %); C – share of the poorest 20% part of society in total income (in %); D – share of the richest 20% part of society in total income (in %); E – index illustrating a ratio of average income of the richest 10% part of society to average income of the poorest 10% part of society; F – index illustrating a ratio of average income of the richest 20% part of society to average income of the poorest 20% part of society; G – Gini coefficient; X – no data available. Source: (United Nations Development Programme 2007, 281-282). Poverty in the European Union member states The poverty level in the European Union member states may be measured according to different indicators, amongst others according to At-risk-of-poverty rate and Human Poverty Index HPI. At-risk-of-poverty rate is used to estimate the poverty level in EU-countries. It is used amongst others by the Eurostat (Eurostat 2008, 223, 226). The indicator shows how big is the share of people whose income does not exceed 60% of the median of equivalent income within the society. Table 2 presents the indicator of the risk of poverty in EU member states in 2005 for the whole population and for selected social groups: the employed, the unemployed, retired.
Ireneusz Jaźwiński. “Income disparities and poverty in the European Union member states.” In Beyond Globalisation: Exploring the Limits of Globalisation in the Regional Context (conference proceedings), 115-121. Ostrava: University of Ostrava Czech Republic, 2010. http://conference.osu.eu/globalization/publ/14-jazwinski.pdf.

118
Table 2. European Union member states according to At-risk-of-poverty rate
State name Total population
Persons employed Unemployed Retired
% Austria 12 7 48 12 Belgium 14 4 31 18 Bulgaria 14 7 34 15 Cyprus 17 7 37 49 CzechRepublic 8 3 51 6 Denmark 12 5 26 16 Estonia 17 7 60 23 Finland 12 4 36 17 France 13 6 29 13 Germany 12 5 42 14 Greece 19 13 32 25 Hungary 12 10 48 10 Ireland 18 6 47 30 Italy 18 9 44 16 Latvia 19 9 59 24 Lithuania 19 10 63 17 Luxemburg 11 9 46 6 Malta 13 5 48 17 The Netherlands 9 6 27 5
Poland 18 14 46 11 Portugal 18 12 28 25 Romania X X X X Slovakia 12 9 39 7 Slovenia 12 5 25 17 Spain 19 10 35 25 Sweden 9 5 26 10 United Kingdom 15 8 50 28
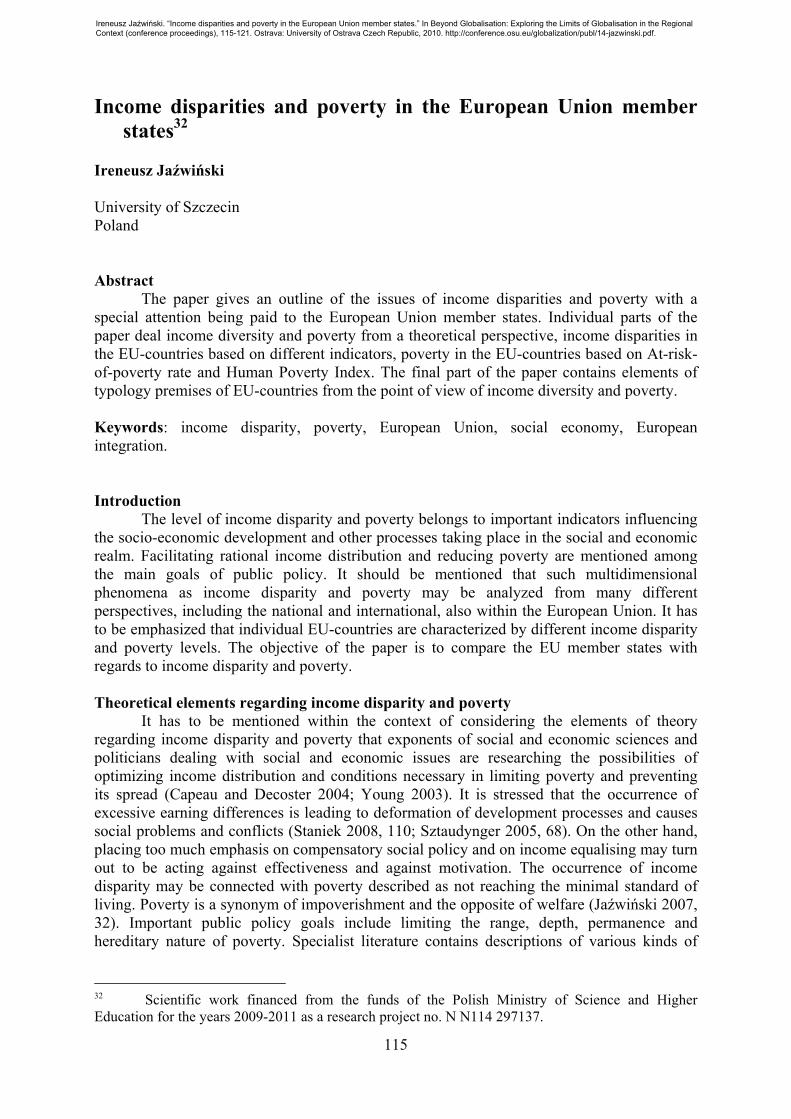
EU-25 15 8 40 16 Source: (Eurostat 2008, 223). The data presented in table 2 lead to a conclusion that the EU member states with the lowest risk-of-poverty indicator for the whole population include the CzechRepublic, the Netherlands and Sweden. EU-countries characterized by the highest poverty include Spain, Greece, Lithuania and Latvia. Taking into consideration the employed part of the population, the lowest level of the risk of poverty is present in the CzechRepublic, Belgium and Finland. The EU-countries with the biggest share of poverty-stricken members of the employed group include Poland, Greece and Portugal. Whereas with regard to the group of pensioners it can be said that the lowest poverty indicator is characteristic for the Netherlands, Luxembourg and the Czech Republic. Human Poverty Index HPI, called also the Social Poverty Index, determines the level of population poverty with regards to various aspects of social life. This index is used by the United Nations, including also the United Nations Development Program (UNDP), for international comparisons in the field of social poverty (United Nations Development Programme 2007, 241, 357). It is presented in two versions, separately for the developing countries (HPI-1) and for developed countries, OECD, Central and Eastern Europe (HPI-2). For the calculation of HPI-2 the following measures are used: in the area of health conditions and lifespan the percentage of people, who live to be sixty; in the area of educational
Ireneusz Jaźwiński. “Income disparities and poverty in the European Union member states.” In Beyond Globalisation: Exploring the Limits of Globalisation in the Regional Context (conference proceedings), 115-121. Ostrava: University of Ostrava Czech Republic, 2010. http://conference.osu.eu/globalization/publ/14-jazwinski.pdf.

119
achievements the percentage of people, who are illiterates in the sense of functional illiteracy described as a lack of reading and communicating ability; in the area of living standards and marginalisation the percentage of people living below the poverty income line, set at the level of 50% of median line of the personal income at disposal; in the area of participation in social development the long-term unemployment rate (12 months or longer). In Table 3 the EU states are presented according to HPI-2 for year 2007. Table 3. European Union member states according to the Human Poverty Index A B C D E F Austria 8.8 16.4 1.3 7.7 11.1 Belgium 9.3 18.4 4.6 8.0 12.4 Bulgaria 15.9 X X X X CzechRepublic
11.6 X 3.9 4.9 X
Denmark 10.3 9.6 0.8 5.6 8.2 Estonia 21.4 X X 12.4 X Finland 9.4 10.4 1.8 5.4 8.1 France 8.9 16.4 4.1 7.3 11.2 Germany 8.6 14.4 5.8 8.4 10.3 Greece 8.2 X 4.9 14.3 X Hungary 17.9 X 3.4 6.7 X Ireland 8.7 22.6 1.5 16.2 16.0 Italy 7.7 47.0 3.4 12.7 29.8 Latvia 19.8 X X X X Lithuania 20.0 X X X X Luxemburg 9.2 16.4 1.2 6.0 11.1 Malta 7.6 X X X X The Netherlands
8.3 10.5 1.8 7.3 8.1
Poland 14.5 X 7.0 8.6 X Portugal 9.5 X 3.8 X X Romania 17.7 X X 8.1 X Slovakia 14.6 X 9.7 7.0 X Slovenia 10.8 X X 8.2 X Spain 7.7 16.4 2.2 14.2 12.5 Sweden 6.7 7.5 1.1 6.5 6.3 United Kingdom
8.7 21.8 1.2 12.5 14.8
Notations: A – state name; B – probability of not living to be 60 at the moment of birth (in %); C – a percentage of people who are functional illiterates in age between 16-65 years; D – long-term unemployment rate; E – a percentage of people living below the income poverty line set at a level of 50% of the personal income at disposal; F – Human Poverty Index HPI-2; X – no data available. Note: Cyprus is shown in HPI-1 ranking. Source: (United Nations Development Programme 2007, 241). The data presented in table 3 lead to the conclusion that EU member states with the lowest level of human poverty include Sweden, the Netherlands and Finland. Among the EU-countries of the lowest human poverty level are the ‘old’ member states. What may prove interesting is the study of the high level of functional illiteracy in Italy, Ireland and United Kingdom. The United Nations did not manage to collect complete data about all EU member
Ireneusz Jaźwiński. “Income disparities and poverty in the European Union member states.” In Beyond Globalisation: Exploring the Limits of Globalisation in the Regional Context (conference proceedings), 115-121. Ostrava: University of Ostrava Czech Republic, 2010. http://conference.osu.eu/globalization/publ/14-jazwinski.pdf.
120
states. It seems also that Cyprus should be considered in HPI-2 ranking together with the other new member states of the EU. Conclusions The paper gives an outline of the issues of income disparity and poverty in the European Union member states. The introductory discussion includes an acquaintance with the basics of theory regarding income disparity and poverty. The second part of the study contains an analysis of income disparities in EU-countries based on selected indicators. The smallest income diversification on a national scale according to Gini coefficient is characteristic for Denmark, Sweden and CzechRepublic. In turn, in the third part of the paper poverty in EU-countries has been analysed according to At-risk-of-poverty rate and Human Poverty Index. It has to be stressed that a rational socio-economic policy should include the aspiration to improve the variables included in these poverty indicators. The EU member states with the lowest poverty level according to the At-risk-of-poverty rate are: CzechRepublic, the Netherlands and Sweden. Taking into account the conducted deliberations all EU member states can be divided into four groups: • countries characterized by a lower than EU-average income disparity and lower than EU-
average poverty level; • countries characterized by a higher than EU-average income disparity and lower than EU-
average poverty level; • countries characterized by a lower than EU-average income disparity and higher than EU-
average poverty level; • countries characterized by a higher than EU-average income disparity and higher than
EU-average poverty level. The CzechRepublic is an example of a country belonging to the fist group and Latvia presents an example of the fourth group. References Capeau, B. and Decoster, A. 2004.The Rise or Fall of World Inequality. A Spurious Controversy? Lueven: United Nations University, World Institute for Development Economics Research. Eurostat. 2008.Europe in Figures - Eurostat yearbook 2008. Luxemburg: Eurostat. Förster, M. and d’Ercole, M. M. 2005.Income Distribution and Poverty in OECD Countries in the Second Half of the 1990s.OECD Social, Employment and Migration Working Papers 2005(22). Jaźwiński, I. 2007. Elementy ekonomii i polityki społecznej.Szczecin: Polskie Towarzystwo Ekonomiczne. Kabaj, M. 2002. Społeczne aspekty rozwoju. Elementy programu przeciwdziałania ubóstwu i bezrobociu, in: Społeczne aspekty rozwoju gospodarki polskiej, ed. S. Owsiak. Warszawa: Polskie Towarzystwo Ekonomiczne. Podgórski, J. 2001. Statystyka dla studiów licencjackich. Warszawa: Polskie Wydawnictwo Ekonomiczne.
Ireneusz Jaźwiński. “Income disparities and poverty in the European Union member states.” In Beyond Globalisation: Exploring the Limits of Globalisation in the Regional Context (conference proceedings), 115-121. Ostrava: University of Ostrava Czech Republic, 2010. http://conference.osu.eu/globalization/publ/14-jazwinski.pdf.
121
Staniek, Z. 2008. System instytucjonalny rynku pracy a zatrudnienie i bezrobocie, in: Wzrost gospodarczy a bezrobocie i nierówności w podziale dochodu, ed. W. Pacho, M. Garbicz. Warszawa: Oficyna Wydawnicza Szkoły Głównej Handlowej w Warszawie. Sztaudynger, J. J. 2005. Wzrost gospodarczy a kapitał społeczny, prywatyzacja i inflacja. Warszawa: Wydawnictwo Naukowe PWN. United Nations Development Programme. 2007.Human Development Report 2007/2008. Fighting climate change: Human solidarity in a divided world.New York: United Nations Development Programme. Young, H. P. 2003. Sprawiedliwy podział. Warszawa: Wydawnictwo Naukowe Scholar.
Ireneusz Jaźwiński. “Income disparities and poverty in the European Union member states.” In Beyond Globalisation: Exploring the Limits of Globalisation in the Regional Context (conference proceedings), 115-121. Ostrava: University of Ostrava Czech Republic, 2010. http://conference.osu.eu/globalization/publ/14-jazwinski.pdf.