Embed Size (px)
Citation preview
Framework Paper
Development and LDCsSeptember 2016 |
Raphael Kaplinsky
Inclusive and Sustainable Growth: The SDG Value Chains Nexus

l Development and LDCs
Inclusive and Sustainable Growth: The SDG Value Chains Nexus
Framework Paper
September 2016
Raphael KaplinskyUniversity of Sussex
ii
Published by International Centre for Trade and Sustainable Development (ICTSD)International Environment House 27 Chemin de Balexert, 1219 Geneva, Switzerland
Tel: +41 22 917 8492 Fax: +41 22 917 8093 [email protected] www.ictsd.org
Publisher and Chief Executive: Ricardo Meléndez-OrtizManaging Director: Deborah VorhiesProgramme Officers: Nicholas Frank, Kiranne Guddoy, and Simon Pelletier
Acknowledgements
This paper was produced under ICTSD’s Programme on Development and Least Developed Countries (LDCs) as part of a project focused on global value chains which is aimed at empowering LDCs and low income countries to effectively utilise value chains to achieve sustainable and inclusive economic transformation.
ICTSD is grateful for the generous support from its core and thematic donors including the UK Department for International Development (DFID); the Swedish International Development Cooperation Agency (SIDA); the Ministry of Foreign Affairs of Denmark (Danida); the Netherlands Directorate-General of Development Cooperation (DGIS); the Ministry for Foreign Affairs of Finland; the Ministry of Foreign Affairs of Norway; and the Australian Department of Foreign Affairs and Trade.
ICTSD welcomes feedback on this publication. These can be sent to Fabrice Lehmann, ICTSD Executive Editor ([email protected]).
Citation: Kaplinsky, Raphael. 2016. Inclusive and Sustainable Growth: The SDG Value Chains Nexus. Geneva: International Centre for Trade and Sustainable Development (ICTSD).
Copyright © ICTSD, 2016. Readers are encouraged to quote this material for educational and non-profit purposes, provided the source is acknowledged. This work is licensed under the Creative Commons Attribution-NonCommercial 4.0 International License. To view a copy of this license, visit: https://creativecommons.org/licenses/by-nc/4.0/ or send a letter to: Creative Commons, 171 Second Street, Suite 300, San Francisco, California, 94105, USA.
The views expressed in this publication are those of the authors and do not necessarily reflect the views of ICTSD or the funding institutions.
ISSN 1995-6932

iiiDevelopment and LDCs
TABLE OF CONTENTS
LIST OF FIGURES AND BOXES ivLIST OF ABBREVIATIONS vFOREWORD viEXECUTIVE SUMMARY vii1. INTRODUCTION 12. GLOBAL VALUE CHAINS DOMINATE GLOBAL TRADE 2 2.1. Governance in GVCs 2
2.2. DifferentFamiliesofGVCs 3
2.3. TheIncreasingStandards-IntensityofGVCs 3
2.4. TheImportanceofInnovationandUpgradinginGVCs 5
2.5. TheDistributionofRewardsinGVCs 6
3. TARGETSANDINDICATORSINMONITORINGSDGPROGRESS 8 3.1. TheOriginsandSpreadofTargetinginContemporarySociety 8
3.2. TheMeaningandIntegrityofMeasures 8
3.3. MacroandMicro,Secondary,andPrimaryMeasures 10
4. CONTRIBUTINGTOEVIDENCE-INFORMEDPOLICY:TARGETING THE CONTRIBUTION GVCs CAN MAKE TO ACHIEVING THE SDGs 11
5. CONCLUSION 26REFERENCES 28
iv
LIST OF FIGURES AND BOXESBox 1: Four Sets of Standards Widely Observed in GVCs
Box 2: Upgrading in GVCs
Figure 1: Absolute Poverty Indicator (SDG1)
Figure 2: Reduced Inequalities (SDG10)
Figure 3: Sustainable Agriculture (SDG2); Water and Sanitation (SDG6)
Figure 4: Age (SDG3); Gender (SDG5)
Figure 5: Education and Lifelong Learning (SDG4); Age (SDG3); Gender (SDG5)
Figure 6: Reliable, Sustainable, and Modern Energy (SDG7); Resilient Infrastructure (SDG9); Sustainable Consumption and Production (SDG12); Climate Change (SD13); Oceans and Marine (SDG14); Forestry and Biodiversity (SDG15)
Figure 7: Inclusive and Sustainable Growth and Employment (SDG8)
Figure 8: Decent Work, Sustainable Growth, and Employment (SDG8)
Figure 9: Upgrading, Sustainable Growth, and Employment (SDG8)
Figure 10: Inclusive Innovation, Sustainable Growth, and Employment (SDG8, SDG9)
Figure 11: Implementation of SDGs (SDG17)

vDevelopment and LDCs
LIST OF ABBREVIATIONSAGOA African Growth and Opportunity Act
CSO civil society organisation
CSR corporate social responsibility
GDP gross domestic product
GVC global value chain
HDI Human Development Indicators
ILO International Labour Organization
IPR intellectual property right
ISIC International Standard Industrial Classification
ISO International Organization for Standardization
MDG Millennium Development Goal
OECD Organisation for Economic Co-operation and Development
PPP purchasing power parity
SDG Sustainable Development Goal
SFC Sustainable Forestry Standard
SITC Standard International Trade Classification
TNC transnational corporation
TQM Total Quality Management
UNDP United Nations Development Programme
WDI World Development Indicators
vi
FOREWORDThe global development landscape witnessed a significant shift in emphasis and commitment in 2015 with the adoption of the 2030 Agenda for Sustainable Development. This universal framework includes the 17 Sustainable Development Goals (SDGs), underpinned by the Addis Ababa Action Agenda on Financing for Development. Explicit recognition of the role that trade and investment policies can play in advancing sustainable development is included in the agenda.
The SDGs provide an opportunity to mainstream an inclusive and comprehensive approach to development in the national strategies of low income countries and least developed countries (LDCs). The goals are mutually reinforcing and will be strengthened by the application of well-articulated trade and investment policies. For example, efforts to design policies that consider the gender dimensions of trade in achieving SDG 5 (gender equality) will have ramifications not only for the goal in question and related targets, but also for competitiveness and growth (SDG 8), ending poverty (SDG 1), reducing inequality (SDG 10), and promoting peaceful and inclusive societies (SDG 16).
The emphasis on the need to enhance inclusive and sustainable growth in the current policy debate is particularly important in the context of global value chains (GVCs) driving the geographic dispersion of production across borders. From a policy perspective, the discussion around GVCs is increasingly concerned with how to spread the distribution of gains along the chain rather than concentrating the rents in the hands of lead firms governing the processes along the chain. This focus on inclusive growth and the distribution of gains naturally flows into a discussion on how the processes driving value chains on a global and regional level dovetail with the global aims for the SDGs.
The International Centre for Trade and Sustainable Development (ICTSD) conceived this paper as a framework document to provide an analytic and policy agenda that scholars and policymakers can use when they undertake detailed and in-depth analysis of the impact of GVCs on sustainable development on a sectoral and geographic basis. The author, Raphael Kaplinsky, Professor of International Development at The Open University, has worked and advised for over 30 years on industrial, technology, and innovation policy, and was an early researcher in the development of GVC analysis.
The paper is produced under ICTSD’s Programme on Development and Least Developed Countries as the inaugural component of a research and publication series on GVCs. A paper authored by ICTSD entitled Trade Polices and Sustainable Development in the Context of Global Value Chains complements this conceptual analysis. The objective of the series is to provide input into the policy debate on how LDCs and low-income countries can utilise value chains to achieve sustainable and inclusive development. We hope that this paper, and indeed the series, will prove to be a valuable and useful contribution to researchers and policymakers in this important endeavour.
Ricardo Meléndez-Ortiz Chief Executive, ICTSD

viiDevelopment and LDCs
EXECUTIVE SUMMARYThe Sustainable Development Goals (SDGs) have been established in an era of deepening globalisation. Although many economies, firms, farms, and individuals have benefited greatly from globalisation, these gains are not automatic — the challenge is not whether to participate in the global economy, but how to do so beneficially. This applies to growth as well as SDG targets of employment, equity, nutrition, and longevity. A key to a positive outcome is for producers to position themselves appropriately in the global value chains (GVCs), which now account for more than two-thirds of total global trade.
Market forces have an important role to play in achieving the SDGs — both positive and negative. On the positive side, economic growth allows the state to deliver developmental services to its population. It also provides employment and incomes, not just in the large-scale formal sector, but also in the small and micro enterprises that relate directly to the poor. On the negative side, growth as we have known it over the past few decades has tended to exclude much of the population from the fruits of economic expansion. Thus, the challenge is to fashion growth into a more inclusive path, which includes the SDGs. This is as true for low per capita income southern economies as it is for the middle and higher income northern economies.
One important contributor to growth is outward-oriented production through the framework of GVCs. We know from experience that GVCs are not undifferentiated — some enhanced, and others undermined achieving the Millennium Development Goals (MDGs). These two different faces of GVC-led growth did not happen by accident or the simple extension of market-led expansion. They resulted from the concerted action of five key sets of stakeholders: international agencies, national governments, lead firms, civil society organisations, and public-private partnerships. Sometimes these lead actors acted in isolation; in other cases, they worked together to achieve MDG-friendly outcomes.
The SDG task is to learn from the GVC-MDG experience to ensure that GVC-led growth does not result in excluding patterns of growth. A clear lesson from the past two decades is that for developmental goals to be achieved, policy interventions by each of the five major sets of GVC stakeholders must be evidence-based. If policies are not built on real dynamics, their unintended consequences may be adverse. It may not just be that alternative policies may have delivered better results, but in the worst cases, they may work against promoting sustainable development.
This paper provides the framework to generate policy-relevant data to reinforce the maximum achievement of SDGs in GVC-led economic growth. In the same way that growth in itself is highly unlikely to achieve the SDGs, routinely collecting data in market-led growth will not provide evidence that the key stakeholders require to achieve SDG-friendly developmental outcomes.
Section 2 describes the dominance of GVCs in outward-oriented production. Key to their operation are that GVCs are governed by lead parties; that there are different types of GVCs; that GVCs are increasingly standards-intensive; and that without the capacity of producers to upgrade their role in GVCs, they will be forced into a race to the bottom undermining their capacity to deliver the required growth for achieving the SDGs. To reach optimal progress, the policies of key stakeholders must be evidence-based. But “data” is not neutral. Hence, in section 3 we briefly outline some of the pitfalls undermining the value and integrity of the evidence collected to support optimally the promotion of SDGs through GVC-led growth.
Section 4 provides the paper’s core. Learning from the MDG experience, it systematically works through each of the 17 SDG targets. It outlines the data required to promote the necessary
viii
developmental outcomes, and the methods likely to generate these data. Section 5 then sets out the policy implications for the five major sets of stakeholders. Placing this actor-led discussion earlier in a policy paper would undermine the key lesson which the development community has learnt from the GVC-MDG experience: without appropriate evidence to back action, developmental outcomes may be suboptimal at best and counterproductive at worst.
However, policy can be drowned by data that is not fit for purpose. Different interventions by different actors at different times require specific sets of evidence. There is no magic bullet, no single method that enlightens all SDG concerns in all chains, all sectors, and all economies. Each experience will be specific and the relevance of the data categories in section 4 will vary in importance. Moreover, it is unlikely that a single GVC study will seek to examine all of the SDG-relevant issues. The SDGs are ambitious. Progress will necessarily be partial and incremental, and the operations of GVCs are inevitably contextual. Therefore, any policy intervention, and any data-gathering exercise required to adequately inform policy, will need to be contextually relevant and carefully defined. This paper provides a smorgasbord of data requirements and data-gathering methods. It should be read with this in mind and used selectively.
1Development and LDCs
1. INTRODUCTION
The global community has set itself an ambitious programme of Sustainable Development Goals (SDGs) to be achieved by 2030. The SDGs build on many of the Millennium Development Goal (MDG) targets set in 2000 to be achieved by 2015. But the SDGs go beyond the MDG targets in broadening the objectives to include a wider set of equity goals and a more decisive targeting of environmental objectives.
Since the MDG targets were defined in the last decade of the twentieth century, global economic integration has increased. The major driver of this deepening integration has been the ever-widening spread of Global Value Chains (GVCs), which currently account for two-thirds of total global trade. The pressing policy challenge which now has to be faced by the development community is how these two sets of developments — a commitment to new and wider SDGs in a context in which deepening global economic integration is driven by the extension of GVCs – can be brought into alignment.
In seeking to address this policy challenge, we begin (in Section 2) by reviewing the nature and significance of GVCs in the extension of global integration. It is clear from this that although there are many gains to be realised from a deepening presence in the global economy, the issue is not whether an economy should pursue this outward growth trajectory, but how it does so. Incorrect positioning in the global economy, particularly by low-income countries, can lead to the undermining of SDGs, or a less than optimal rate of progress. This being the case, the question then is what steps need to be taken to ensure favourable outcomes, and how might progress on these fronts be measured. This is the subject matter of Section 3. But not all SDGs are centrally relevant in GVCs. Hence, Section 4 of this framework paper focuses on those SDGs which are most likely to be affected by the character of involvement in GVCs. In each case we seek
to identify the nature of the SDG-GVC nexus, the data required to assess this interaction, and the problems which might emerge in data collection. The ultimate goal is to assist in the evidence informed rollout of policies designed to further progress with respect to the SDGs, particularly (but not exclusively) in the least developed economies.
It is important to pay close attention while reading Section 4 of this framework paper which sets out an ambitious programme for a holistic analysis of the impact of GVCs on all of the SDGs. It is very unlikely that any one project will seek to undertake such comprehensive enquiry. Moreover, context differs between different types of GVCs and different types of economies. For example, the challenges faced by least developed economies with very large informal sectors and high levels of absolute poverty are different from those faced by middle and upper middle income economies. Similarly, the challenges faced and opportunities opened in sectors involving labour-intensive assembly are qualitatively different from those involved in the service sector and in high-tech industries. In addition, the resources available for the investigation and analysis of GVCs may be constrained in terms of both time and human effort.
Thus, analysis of specific GVCs and specific SDGs will necessarily selectively draw on this methodological toolkit. Therefore, the first step required in drawing on this toolkit is a strategic judgment which begins with a reasoned assessment of the particular context, the objectives of the data-gathering exercise, and the constraints imposed by time and investigative resources. Without this fit-for-purpose lens to the analysis of GVCs and the SDGs, there is a danger that the search for appropriate and effective policy will be drowned, rather than facilitated, by the investigative process.

2
2. GLOBAL VALUE CHAINS DOMINATE GLOBAL TRADE
We are accustomed to think that the integration of production and trade in the current era of globalisation is unprecedented. However, comparing the turn of the twentieth and the twenty-first century we can observe similar levels of integration, that is, in both periods there was a broadly equivalent share of global trade in global production (Baldwin and Martin 1999; Kaplinsky 2005). However, appearances can be deceptive because lying behind these similar aggregates is a key structural difference in the character of global integration in these two periods. Trade during the deepening of internationalisation in the second half of the nineteenth century was largely in finished products — manufactured exports from the north traded with commodities from the south, and with manufactures and commodities from other northern economies. By contrast, the rapid growth of global trade after the 1970s was increasingly in intermediate products exported through the medium of GVCs. This trade in intermediates in the current era of globalisation dominates the imports and exports of virtually all economies, southern and northern alike.
By one measure, more than 80 percent of world trade now occurs within GVCs (UNCTAD 2013). The definition of GVCs used to make this estimate is when exports from one country either involve the processing of imports from one (or more) other countries, and/or are processed in the destination country and then exported to one (or more) other countries. Amongst the many ramifications of this explosion in GVC-led global trade is the confusion which arises with respect to output and trade statistics. The Apple iPhone4, for example, retailed in the US for $495 and was exported from China at US$175. But “production” in China was in fact merely assembly, and the value actually added to each iPhone in China was a paltry US$6.50 (Xing and Detert 2010). Hence, the value of China’s
net exports of iPhones (and virtually all other manufactured exports) was substantially lower than its gross exports, and its manufacturing value added below its gross manufacturing output value. Similarly, the screen in each of these iPhones was double-counted in global trade statistics since it was both included in the value of Korea’s exports (screens from Korea to China) and China’s exports (iPhones to the world). Thus, it is estimated that the real value of global trade (netting out these double-counted intermediates) was 28 percent lower than its gross value, that is US$14 trillion compared to US$18 trillion in 2012 (ibid).1
Behind the broad definition of GVC trade in intermediates which underlie these estimates of global trade and production values lie five important characteristics which determine the potential contributions made by GVC-trade to the achievement of SDGs: the degree of governance in GVCs; the difference between families of GVCs; the increasing prevalence of standards in GVCs; the importance and distinctive character of innovation and upgrading in GVCs; and the manner in which rents are distributed in GVCs. We briefly sketch the principles which determine the links to SDGs. Then we show how these SDG-affecting chain characteristics can be measured and monitored, and then, mindful of the difference between sectors and GVCs, how this monitoring can be utilised to provide an evidence base for policies designed to further the achievement of SDGs through the extension of GVCs.
2.1. Governance in GVCs
A large share of overall GVC trade (the percentage is unknown) occurs within “governed GVCs.” By this we mean that the parties included in this chain do not operate in the “perfect markets” (of economic text books) where buyers and sellers are anonymous and
1 There are no equivalent gross numbers which estimate the difference between the gross and net value of global manufacturing. The difference will of course be lower than that for gross and net trade values (since not all manufactures are traded), but will nevertheless be substantial, particularly in economies with large trade/GDP ratios.

3Development and LDCs
engage in short-term exchanges, and in which each party seeks to maximise its own returns separately in the trade in intermediates and final products. By contrast, in governed value chains relationships between firms are “sticky,” often involving the maximisation of joint gains.
Crucially, these chains are generally governed by lead firms. Lead firms control the pattern of production and trade in the chain, determining the division of labour in the chain, the final markets which chains feed into, and the process and product standards which chain-participants need to achieve. In other words, participants in these governed chains are not entirely free to determine what they produce, how they produce, what inputs they use, and where and how their output is marketed. But in many cases, since lead firms control access to final markets, there is little substantive choice — producers either participate in governed GVCs or are excluded from final markets (or from profitable niches in final markets).
2.2. Different Families of GVCs
Value chains have emerged out of a historical process of core competence specialisation in which firms confine their activities to specific niches in which they have distinct competitive advantages. These niches are protected by various types of barriers to entry which ensure high and sustainable incomes (Hamel and Prahalad 1994). All other non-core competence tasks are outsourced, upstream to their supply chain or downstream to their customer chain. Initially this outsourcing, driven by large corporations in the industrialised countries, was directed to geographically proximate suppliers and customers. But as trade barriers fell, as transport logistics improved and as capabilities grew in the south, outsourcing took on a global dimension, increasingly incorporating southern suppliers in developing countries. It was this process of global outsourcing and the globally dispersed production of intermediates which has driven globalisation from the 1970s to the present day (Kaplinsky 2005).
Two broad families of GVCs can be identified (Kaplinsky and Morris 2015). One set
are “vertically specialised GVCs.” A key characteristic of vertically specialised GVCs is that the individual processes can be undertaken in parallel, and that they involve relatively low transport costs. The second set of GVCs — additive GVCs — involve chains in which individual sub-processes are necessarily sequential, that is, they are additive. Each stage can only be undertaken once the previous stage has been completed. Additive GVCs can also be driven by the high transport costs of intermediates and/or weight or volume loss during processing. In general, vertically specialised GVCs characterise manufacturing and service sector GVCs (as in the example of the iPhone4 described above). By contrast, additive GVCs are generally found in the commodities sectors (agriculture, mining and oil, and gas). On the other hand, approximately 75 percent of total GVC trade (that is 60 percent of total global trade) is in vertically specialised GVCs and in Africa and Latin America around 75 percent of GVC exports are in additive GVCs.
2.3. The Increasing Standards-Intensity of GVCs
During the 1950s and 1960s, in the aftermath of World War Two, global economic growth occurred in a context of relatively low per capita incomes and constrained supply as Europe and Japan rebuilt their economies. This was also a period of import substituting industrialisation in the south. In this era, products were relatively undifferentiated and the growth of mass consumption was matched by the mass production of standardised final products. But as incomes grew in the north, and as productive capacity began to catch up with demand, consumers became increasingly demanding. This structural change in northern markets occurred from around the mid-1970s (Piore and Sabel 1984). Consumers demanded greater product variety, enhanced product quality, and towards the end of the twentieth century, they became ever more demanding of the processes involved in production in the value chains final producing output. During the same period, Japanese firms invented just-in-time production, which involved low inventories and
4
required high quality intermediate products and smaller, predictable deliveries. This, in turn, made major demands over suppliers, and suppliers’ suppliers, all of whom had to achieve much tighter requirements in the inputs they produced for their lead firms.
This combination of efficiency requirements (just-in-time production) and more demanding consumers led to value chains’ participants increasingly being judged in relation to triple bottom line performance requirements. Lead firms required conformance from their suppliers, and stockholders demanded high rates of return (the economic bottom line), whilst final consumers, civil society organisations, and governments were increasingly demanding of the social and environmental bottom lines in the GVCs.
Meeting these demands led to the growing standards intensity of GVCs. The economic bottom line required lead firms to demand
conformance in their supply chain to demand three sets of performance standards to be met — Q (quality), C (cost), and D (delivery). Meeting the demand of the social and environmental bottom line meant conformance to labour standards, environmental and organic standards, and the social licence to operate required many lead firms to introduce corporate social responsibility (CSR) programmes. Meeting these requirements increasingly required that chain participants responded to a growing number of standards, led by a variety of different stakeholders (Box 1). In many cases, such as in the Sustainable Forestry Standards (SFC), the requirements for conformance not only involved environmental standards (for example, no logging within specified periods after rainfall; use of sustainable timber), but also social standards (respecting the rights of indigenous people). Additionally, they required a paper trail — a “chain of custody” — to prove that standards had been implemented along the chain.
• Corporate standards internal to the chain. They typically address quality, cost, and delivery procedures and, increasingly, environmental processes. They specify the requirements of the lead firm (at the buying end of the chain) for supplier firms to ensure systemic chain competitiveness.
• Generic standards. They are industry specific or relevant across a range of sectors, such as ISO9000 on quality and ISO14000 on the environment.
• Standards set by governments. They include food safety and energy efficiency, and those set by international bodies including the EU “farm-to-fork” food standards and vehicle emission standards
• Standards designed by civil society. They include labour standards, organic standards, and Fairtrade certification.
Box 1: Four Sets of Standards Widely Observed in GVCs
Although, as Box 1 shows, there are a variety of stakeholders who have driven the demand for standards in GVCs, it is often the lead firms who take the primary responsibility for implementing these standards. For example, in order to drive the greening of its supply chain, Walmart in 2009 developed a worldwide Sustainability Product Index, addressing energy
use, climate impact, material efficiency, natural resource usage, and local community involvement. By 2012, 500 suppliers and 107 product categories had participated in the Sustainability Product Index. Walmart announced that failure to participate in the exercise would result in removal of the firm from Walmart’s supply chain. The key
5Development and LDCs
initiatives involved in supply chain greening were the increased use of recycled materials in packaging; offering products with greener chemicals; reducing fertiliser use in agriculture; and improving energy efficiency in factories. After beginning this programme in China it was rolled out to other southern economies, including in Chile, Mexico, and in South Africa (Kaplinsky and Morris 2014).
Standards have played an important role in the achievement of the MDGs since they often forced lead firms and suppliers to improve working conditions and in some cases they also helped to improve (low) salary levels. They will also play an important role in the future achievement of SDGs (see Section 4 below). However, it is important to recognise that by their nature these standards often exclude small scale producers (who find it difficult to finance accreditation) and social groups such as women and informal sector producers who may not have adequate standards of literacy and numeracy required to participate in these GVCs.
Nonetheless, when value chains feed into final markets in emerging economies in the south where low and middle income consumers predominate, the standards intensity of production is much less critical for global exporters. These low and middle income consumers are less demanding of the provenance of the value chains and of the products which they consume, whether because they lack awareness, or the incomes to satisfy these demands. The pressures to meet the triple bottom line in these chains is thus considerably reduced, particularly with regard to conformance to the social and environmental bottom line parameters in production. Whilst these less demanding markets also exist in many parts of the north, and indeed grew as a result of the 2008 financial crisis and the growth of inequality in many high income economies, they dominate consumption in the south and this has important consequences for the organisation of the GVCs feeding into these lower income markets. Thus, to the extent that final markets shift from the north to the
south as “southern drivers of growth” dominate global economic progress, so the demand for standards-intensive GVCs will diminish.
2.4. The Importance of Innovation and Upgrading in GVCs
Global competition has become intense as GVCs have extended and as capabilities have grown throughout the global economy. This means that there are very few cases where a firm or a group of firms can continue to operate with unchanged procedures and products. Critically, whereas there are clear gains to be realised from participating in export markets, these gains are not automatic. It is thus not so much a matter of whether a firm or an economy should participate in global markets, but how they do so. The “how” involves the capacity of producers to upgrade their offerings; this is characteristically referred to as “innovation,” or in GVC parlance, as “upgrading.”
Traditionally the upgrading challenge was defined in relation to the capacity of producers to improve their products (higher quality, more product differentiation, new products) and their production processes. Process improvement invariably involved more mechanisation (generally involving the adoption of more capital intensive and labour saving machinery), and this in turn required improved and different labour skills. It also increasingly required the adoption of new forms of production organisation, as in the transition to total quality control and just-in-time production, and this, as we have seen, involved the adoption of intense monitoring processes in order to achieve the standards imposed by lead firms, final markets, and governments.
However, the unfolding of GVCs made additional demands for upgrading. The capability to fragment value chains by specialising in smaller and smaller niches provided the opportunity for a new form of upgrading, that is, to change the firm’s functional position in the chain. This has come to be referred to as “functional upgrading.” Examples are when large transnational cooperations
6
(TNCs) such as Apple, Nike, and Levi Strauss withdraw from the manufacturing link in the chain, and specialise in branding and retailing. Conversely, suppliers in the chain may reposition themselves from assembling components to manufacturing them, and then transition to designing and even branding products. But, further, as capabilities grow
and competition intensifies, lead firms may seek to draw on their capabilities and to move out of a particular chain into another chain, as Nokia did over the decades in transitioning from the manufacture of rubber boots, to paper machinery, to mobile phones, and to telephone switching systems. These four forms of upgrading are described in Box 2.
2.5. The Distribution of Rewards in GVCs
GVCs are not just an arena for producing goods and services for global markets. They also determine the distribution of rewards along the chain. This is clearly relevant to the achievement of the SDGs. Understanding how this occurs requires a brief diversion into the theory of rent.
Rent is defined by having a scarce attribute, protected by barriers to entry. Three primary sources of rent affect income streams. The first are resource rents, “gifts of nature,” in which a producer has access to relatively better land or resource deposits than a rival, and where the price of the resource is set by the costs of production of the least well-endowed producer. The second major category of rents are those which are created by producers, increasingly through the systematic application of knowledge to production, sometimes referred to as “Schumpeterian
Rents” (Schumpeter 1934). These “innovation rents” are endogenous to the participants involved in the chain of production. They may be generated by developing better production processes than rivals, introducing higher quality or differentiated products, developing forms of organisation which are superior to those utilised by rivals, or repositioning their role in the GVC. The third category of rents are those which are exogenous to the chain, created by external parties, but which play a role in determining the inter-country and intra-chain distribution of rents. Thus, for example, compared to rivals in other economies, producers may benefit from access to better forms of infrastructure, from lower cost and better-directed financial intermediation, have access to a better trained workforce and to other inputs which affect their capacity to produce effectively. The nature of intellectual property rights regimes (IPRs) buttress the capacity to appropriate the rents generated in production and exchange.
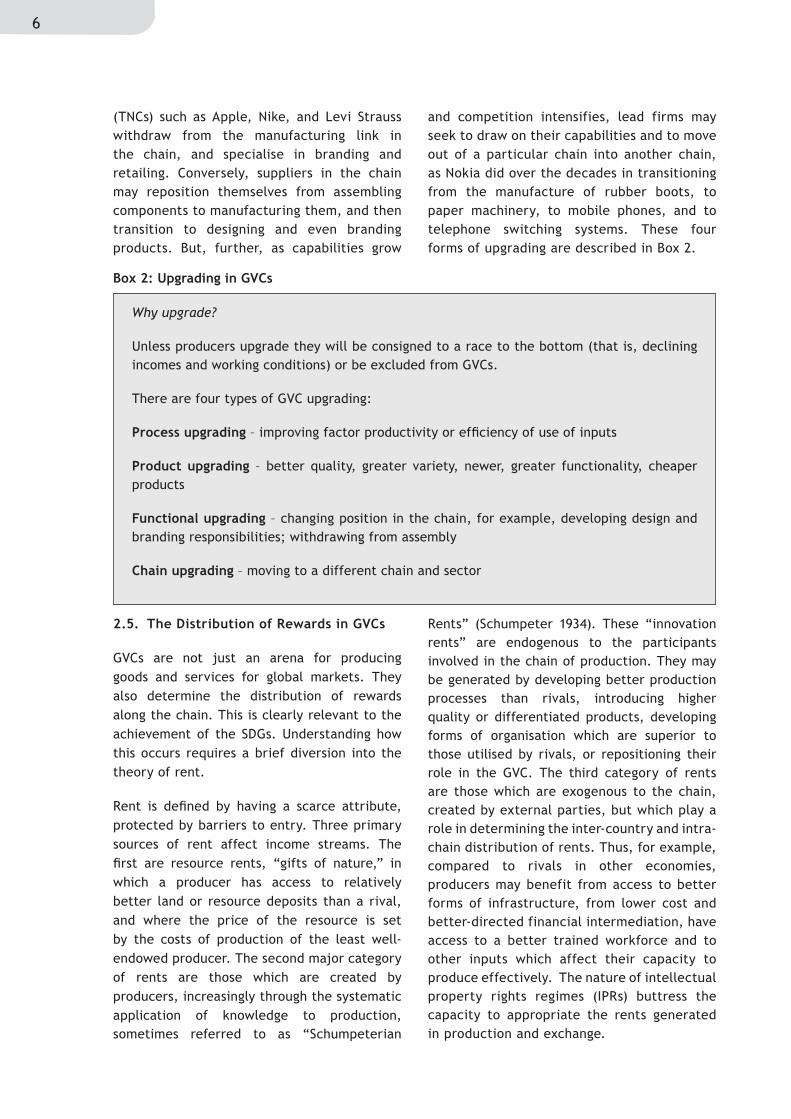
Why upgrade?
Unless producers upgrade they will be consigned to a race to the bottom (that is, declining incomes and working conditions) or be excluded from GVCs.
There are four types of GVC upgrading:
Process upgrading – improving factor productivity or efficiency of use of inputs
Product upgrading – better quality, greater variety, newer, greater functionality, cheaper products
Functional upgrading – changing position in the chain, for example, developing design and branding responsibilities; withdrawing from assembly
Chain upgrading – moving to a different chain and sector
Box 2: Upgrading in GVCs
7Development and LDCs
Access to these rents determines who gains in GVCs and thus the extent to which GVCs may determine SDG performance. For example, in the absence of sustained upgrading, left to the market, wages may be driven down to subsistence levels. Similar outcomes arise with regard to working conditions. Small scale and informal sector producers may be unable to develop the skills, capital goods, and managerial attributes which are required to generate growing and sustainable incomes. Individual economies, or regions in economies, may fall behind if they are unable to develop distinctive capabilities which benefit to a greater or lesser extent from barriers to entry.
Many of the key rents in GVCs have been held by TNC lead firms. These firms have managed to erect barriers to entry in the most profitable links in the chain and to take advantage of barriers to entry constructed by supportive governments (which are, in many cases, responding to pressures exerted by TNCs). Arising out of this command over key rents in their GVCs, lead firms exercise the governance required to protect their rents. Critically, since rents are invariably eroded through competition, the key attribute of firms who command the lion’s share of rents in their chains, is that they have developed what is widely referred to as “dynamic capabilities.”
8
3.1 The Origins and Spread of Targeting in Contemporary Society
Targets have become an increasingly prevalent feature of contemporary societies, guiding performance in both the corporate and social spheres, and driving the attainment of wider societal objectives such as the MDGs.
The origins of targets as a driver of performance are to be found in the development of post-WW2 Japan, guided by the ideas of W. Edwards Deming (widely considered to be the father of Total Quality Management, TQM), and fine-tuned by Toyota and other automobile producers during the 1970s and 1980s. The TQM approach sought to build-in quality throughout the manufacturing process, rather than to re-build products to required standards after production had been completed. Hence, it required systematic measurement throughout the production cycle to ensure that all sub-processes met the required quality standards. Toyota drew on these measurement schemes to both implement just-in-time procedures and to develop and diffuse a policy of kaizen — continuous improvement — which it pushed throughout its internal production system and in its supply and customer chains (Cusumano 1985). Kaizen involved a different approach to technological change than that which had hitherto been adopted in the auto and other industries. The traditional approach to innovation was to pursue this as formal R&D, conducted by specialised knowledge workers. Toyota realised that in reality, many of the changes which improved product and process was tacit, and held by its labour force.
Hence Toyota used targets, systematically, to improve performance across all of its value chain. All processes were measured and documented, and “stretch-targets” were then set for improvement, ratcheted up as performance improved.2 Initially these targets were used to improve individual processes over time, but as experience unfurled, these targets
were used to benchmark performance not only within a process or plant or firm over time, but also across plants and firms — that is across the value chain — and increasingly also across sectors. The same principles of benchmarking performance over time, over space, and over sector are central to the successful progress made with regard to the MDGs, as they are to a range of public services (such as health delivery) across virtually all northern and many southern economies.
3.2 The Meaning and Integrity of Measures
Hence, measurement and targets are central to both the SDGs and to the global operations of GVCs. They are thus one of the key methodological entries into evidence-informed policy. In Section 4 below we will identify specific measures which can be used to drive the implementation of SDGs in GVCs. However, before undertaking this task, it is important to recognise the dangers inherent in targeting, of which four inter-related problems stand out — the bias which they introduce; the integrity and credibility of the numbers produced; the comparability of numbers; and conceptual problems. Many of the examples used to illustrate these points are drawn from the experience of northern economies, but their relevance is general and widely spread across sectors and countries and is, of course, central to the targeted improvement implicit in SDGs.
3.2.1. Numbers and bias
For every number collected, there will be other numbers which are ignored. For example, targets are deeply ingrained in the UK’s National Health Service and are used to guide the allocation of resources. Hence, outcomes which can be monitored and measured easily (for example, numbers discharged from mental health services) place pressure on rapid patient throughput, but do not reflect the quality of life improvements of those passing through the system. These improvements are intrinsically
3. TARGETS AND INDICATORS IN MONITORING SDG PROGRESS
2 Famously, it was able to reduce the changeover time for heavy machinery from over 8 hours to two minutes, not in a single leap or through the introduction of radical new technology, but as a result of thousands of small changes over time (Kaplinsky and Hoffman, 1988).
9Development and LDCs
more difficult to measure, and have much less influence on budget allocation than do throughput numbers.
Consider, further, targets relevant to the SDG indicators seeking to capture the incidence of inequality. The most common measure of living standards and inequality is that which relates to comparable standards between individuals (Milanovic 2004). Whilst this has considerable importance in indicating changes which affect the mass of the global population, these particular indicators ignore differences between genders, age groups, ethnicities, sub-national regions, and other differences which have considerable significance for global welfare. Some of these differences are recognised both by the MDGs and the SDGs (for example gender), but others are not.
3.2.2. The integrity of numbers
Many numbers are presented as “facts,” whereas in reality they may bear little relationship to the real world. Consider, for example, official records of employment in Botswana’s mining and quarrying sector. This sector accounts for around 40 percent of global diamond output, as well as producing coal, soda ash, and other commodities. Total recorded employment in this sector in Botswana (as reported in the ILO Surveys) more than doubled between 2008 and 2009 — from 68 to 139 ! These numbers are clearly not credible and are a reflection of a wide and deep atrophy of statistical services in many countries, particularly in Africa. Jerven has recently surveyed a range of statistical offices responsible for feeding data into a variety of national and international publications on the structure and performance of African economies (Jerven 2013). He reports a system which has been devastated by financial cuts and poor remuneration, producing “facts” which bear very little relation to what occurs in the real world.
The lack of credibility of numbers is not confined to African statistical offices. Sometimes the errors arise as a consequence of the reward systems used to monitor performance. UK hospitals, for example, are provided with targets which involve the length which patients
wait to see a consultant and are rewarded or penalised on the outcomes. Hence, many hospitals do not formally enter a referral into their number-collecting system until such time as they can be seen within the time guidelines. Targets are “met,” but only because the recording system is manipulated in such a way that real and adverse performance is ignored.
This problem of data-integrity and the biases arising from incentive systems is directly relevant to the measurement of SDGs in GVCs. As will be seen in Section 4 below, many of the data relevant to the measurement and targeting of progress on SDGs are subject to the issue of data-integrity. Without due consideration, apparent progress on the SDGs (or indeed, deterioration) may be a misleading guide to policy.
3.2.3. The comparability of numbers
Perhaps one of the most important caveats in the use of numbers arises from their incomparability. From the perspective of the MDGs and SDGs, this has particular relevance with regard to measures of living standards and poverty. For many years, comparable living standards were measured by per capita incomes, until it was recognised that price differences across national boundaries made this an unreliable indicator. Therefore, systematic attempts were made to adjust for these differences through the use of purchasing power parity (PPP) comparisons, but this in turn was beset by a series of measurement problems. Confronting these problems has periodically led to major revisions in PPP conversion rates, the most recent of which (in 2011) resulted in major revisions to the estimated number of people living below the MDG1 target (Edward and Sumner 2014).
3.2.4. Conceptual problems
A related concern arises with regard to the conceptual underpinning of numbers. For example, the SDGs advance the MDG framework by paying more attention to issues of inequality. But how is inequality to be measured? One key widely used indicator is the Gini-coefficient. However, the problem with the Gini is that it
10
tends to ignore the impact on individuals at the bottom and top end of the income scale. The recognition of this drawback has resulted in attempts to introduce alternative measures. For example, the UNDP Human Development Indicators (HDI) use the 20:20 ratio, comparing the income of the top 20 percent to the bottom 20 percent. This correlates better with SDG indicators such as the index of child wellbeing, the index of health and social problems, the prison population, physical health, and mental health than does the Gini-coefficient. Another recent suggestion for a more accurate measure of real inequality is the Palma Index which compares the share of national income of the top 10 of the population with that of the bottom 40 percent.
3.3 Macro and Micro, Secondary, and Primary Measures
Beyond the above caveats on the numbers which might be relevant to the achievement of SDGs lies the distinction between macro and micro numbers, numbers collected through secondary sources, and those generated through primary, field-enquiry.
Each country has its own statistical institutions and procedures which invariably follow a variety of international protocols designed to provide comparable datasets. For example, industrial statistics are collected with a lens defined by the International Standard Industrial Classification, Rev.3.1, (ISIC). Similarly, trade data is collected through the Standard International Trade Classification, Rev.3 (SITC) and employment statistics through protocols defined by the ILO. The World Bank’s World Development Indicators (WDI) is an invaluable resource which brings together these nationally generated macro datasets, each of which is contributed by individual governments and aggregated into country specific, region specific, and income group categories. The UNDP’s HDI adopt similar procedures, and draw on this country level specific data to generate aggregate indices designed to provide composite pictures of development outcomes
which transcend the dominance of the income, trade, and employment statistics used to assess and compare global growth and trade performance.
The central feature of all of these macro datasets is that they provide country-, region-, and sector-wide data. However, GVCs operate across countries, regions, and sectors. Leaving aside the problems discussed in Section 3.2 above concerning the integrity and comparability of these data, they throw almost no light on what is happening with regard to the SDGs within particular GVCs and groups of GVCs.
The OECD’s innovation surveys3 (and the related protocols developed specifically to reflect developing country economic structures, notably the Bogota Manual)4 are an exception to the GVC irrelevance of macro datasets. The innovation surveys provide a broad dataset, comparable across countries, and data (specifically on product and process upgrading) which are relevant to the upgrading challenge which affects the sustainability of incomes generated in GVCs. However, by their nature, these panel data are protected by statistics legislation and cannot be decomposed on a firm or establishment basis. Hence, whatever their potential for throwing light on the progress of SDGs in GVCs, in reality they have limited practical significance in the development of evidence-based policies designed to further the achievement of SDGs in GVCs.
In conclusion, aside from the innovation surveys, little of available secondary and macro data are relevant to the contribution which GVCs can make to the achievement of the SDGs. In particular, as we have seen above, deepening participation in GVCs does not in itself guarantee that progress will be made on SDGs. This therefore requires that attention be paid to the development of specific indicators which are SDG-relevant to the character of GVC growth and which can inform appropriate responses in public, private sector, and civil society policy development, a subject which we now turn to.
3 Eurostat. 2016. “Community Innovation Survey”. Accessed February 18, 2016
4 United Nations Educational, Scientific and Cultural Organization. 2014. “Measuring Innovation”. Accessed February 18, 2016.

11Development and LDCs
We now turn to the practical implications of the discussion in Sections 2 and 3 above, mindful of the following caveats. First, insofar as we are looking at the SDG relevance of GVCs, there are no macro datasets which throw light on the topic. Existing statistical categories and macro datasets are unable to measure the character and contributions of value chains to the SDGs. Second, there are some large scale micro surveys which have relevance to the achievement of SDGs in GVCs, notably the Innovation Surveys, but these provide restricted data, with restricted access, and cover a limited number of economies. Third, it is thus necessary to assess the SDG-GVC nexus through the collection and collation of primary data but this detailed and specific information will tend to offer limited scope for country-to-country comparison. Fourth, although it is possible to identify broad families of GVCs, notably the contrast between vertically specialised and additive GVCs, context is important. There are significant variations between and within chains and countries. The same sector in one set of countries (for example, clothing in Italy) will have very different characteristics to the same sector in another country (for example, clothing in Lesotho). And fifth, and perhaps most importantly, the measures discussed below are essentially those which throw light on the structures and processes which lead to SDG relevant outcomes in GVCs. And this interaction is necessarily contextual. Not all SDGs are affected, or affected equally, by the character of GVCs. Similarly, not all GVCs (even in the same sector) have the same impacts on SDGs.
We now turn to a discussion of the manner in which GVCs may influence the achievement of the SDGs. As will be seen, many of these SDGs overlap and hence we will in many cases, pursue the discussion by grouping SDGs. As observed in the introduction to this framework paper, the discussion which follows in this section sets out a comprehensive toolkit
of research and policy questions, almost certainly too detailed, and not necessarily all policy relevant, for any one investigation.
As noted above, substantive and relevant policy analysis of the linkages between particular GVCs and SDGs in any specific developing country cannot be undertaken by adopting a mechanical “tick box” and “all sizes fit” approach. Context is important, and so too, is the objective of the policy intervention. Seeking to address a particular SDG concern (for example employment) will require a more focused and smaller data-gathering exercise than an attempt to develop policies to address multiple SDG objectives. Policy analysts using this framework paper as a guide to understand the GVC/SDG dynamics operating in any particular country will therefore necessarily need to adopt a fit-for-purpose approach towards this toolkit.
The discussion of methodology which follows begins with SDG1 and proceeds in a largely sequential manner. In some cases, it makes sense to consider SDGs as separate policy objectives requiring the collection of specific data relevant to a single SDG. But in other cases, SDGs are closely interlinked, so it makes more sense to collect multiple data sets in the same exercise.
End poverty in all its forms everywhere (SDG1)
It is necessary to see poverty in its widest sense as comprising two measures (Kaplinsky 2005). The first is absolute poverty (SDG1); the second is relative poverty (which will be considered below in the discussion of SDG10).
The success of many countries in achieving the MDG1 target has led to enhanced ambitions in the SDGs, with greater emphasis being placed on the higher “$2 p.d.” target (in reality $3.80 p.d in the PPP revision of 2011). An essential measurable outcome for participation in GVCs consistent with SDG1 is that, at a minimum, all workers and farmers
4. CONTRIBUTING TO EVIDENCE-INFORMED POLICY: TARGETING THE CONTRIBUTION GVCs CAN MAKE TO ACHIEVING THE SDGs
12
should receive incomes which exceed this level (adjusted to reflect purchasing power).
However, this measurement is not as simple as it might seem (Figure 1). For one thing, many stakeholders in GVCs participate on a part-time basis; this is particularly the case in the agricultural sector where production is affected by seasonal factors. But it is not confined to agriculture; for example, it is also evident in industries manufacturing products for seasonal festivities such as Christmas. Hence, a decision must be made as to whether performance is to be measured on the basis of actual annual incomes or annual equivalent incomes earned on a temporary basis.5 A second qualification is that many GVCs involve a combination of formal sector workers, whose incomes are generally transparent and recorded, and informal sector and often casually employed workers who may be employed on an irregular basis and whose incomes are sometimes not easily identifiable. A third factor, again particularly characteristic of agriculture, but also evident in the services sector, is that many participants in the chain are self employed, so that the relevant indicator of absolute income is not the level of wages, but the levels of incomes earned. Critically, the appropriate measure for earnings is not gross incomes (“sales,” “turnover”), but net incomes, that is with input and other costs (such as the cost of loans) deducted. Fourth, in some chains,
rewards may be non-pecuniary as when part of the output is for self-consumption, and this may not be easy to measure. Fifth, when households are involved, income will need to be apportioned across family members (including age [SDG3] and gender [SDG5]), some of whom may have incomes earned from other sources.
Further, the first round income effects within the value chain require paying attention to all links in the chain, that is upstream suppliers and downstream processors and buyers. This may often create measurement difficulties, not least because many firms in a chain also participate in other chains so it is not easy to determine what components of their total income arise from participation in the chain. When a chain “begins” and “ends” may not be easily determined.
The virtue of the SDG1 absolute poverty target is that, when corrected for purchasing power, it provides the capacity to measure progress over time, across sectors, and within and across national boundaries. However, it is evident from the above qualifications that there is no unambiguous measure for the SDG1 target, and analysis of specific GVCs will have to take account of seasonal factors and the difficulties in deciding, and then measuring, who is included as income recipients in a given chain.
5 This problem is not confined to low income countries. Some higher income economies have weakened employee protection and introduced “zero-hours contracts” in which the length of the working day and month is variable and entirely at the discretion of the employer.

13Development and LDCs
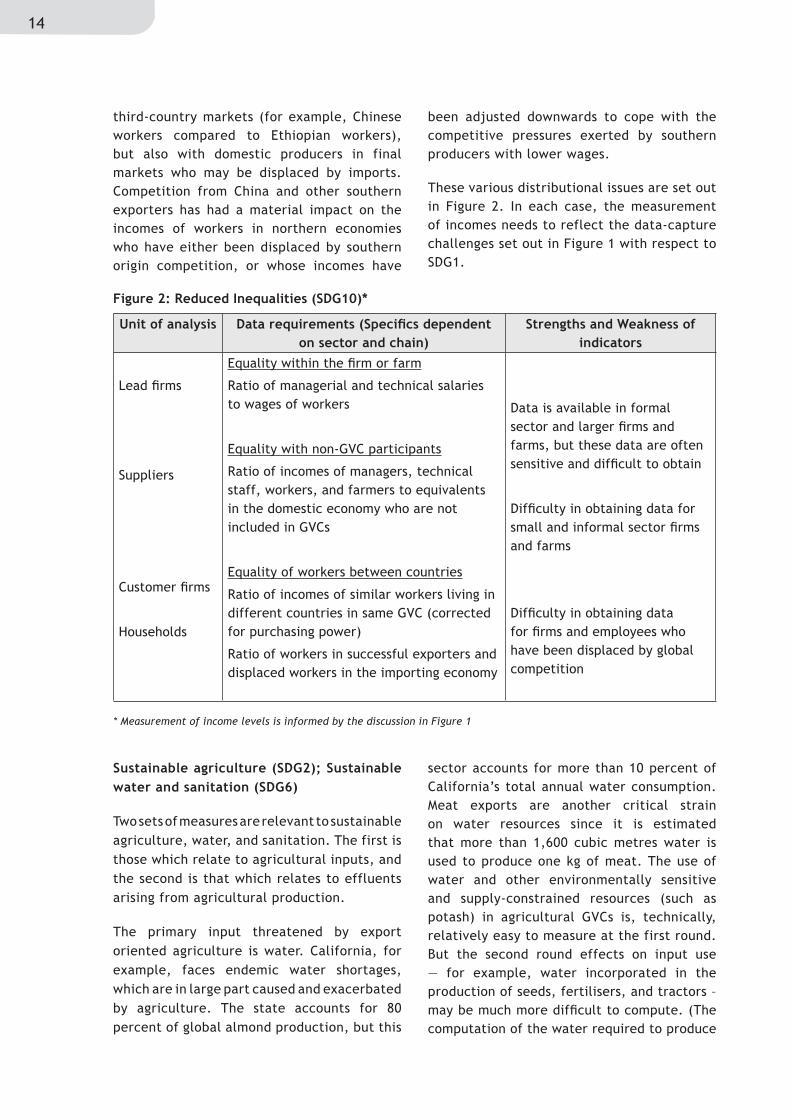
Reduce inequality within and among countries (SDG10)
The expansion of global trade through GVCs has had complex impacts on intra- and inter-country inequality. Inclusion in dynamic GVCs is often associated with a growing spread of incomes within enterprises and farms with the incomes of senior management and skilled workers raised nearer to the levels of their counterparts in subsidiaries in higher income economies. By contrast the incomes of lesser skilled workers have been dragged down by the wages of their equivalents in economies with lower standards of living.
A second distributional outcome is the trajectory of incomes of those included in the GVCs compared to their equivalents which are not included in GVCs. As a general rule,
despite growing unequalisation of salaries within the domestic operations of the GVCs, their incomes have tended to rise more sharply than their non-GVC counterparts.
A third distributional outcome arises with respect to incomes earned within a GVC between those resident in different economies. In general, these incomes will approximate to the salary levels of their economies, so that for example a cleaner undertaking the same tasks in subsidiaries of the same firm in a GVC will earn different salaries depending on the country in which they are working.
Fourth, the exports of successful economies will compete with those of unsuccessful economies. This not only applies to producing economies competing with each other in
Unit of analysis Data requirements (Specifics dependent on sector and chain)
Strengths and Weakness of indicators
Lead firms
Suppliers
Customer firms
Households
Entrepreneurship data
Total sales per annum
Total costs per annum (physical inputs, services, capital costs, land/rental costs)
[Calculate net incomes]
Wages and salaries
Average wages/salaries
Full-time employees
Part-time employees (corrected for number of days worked p.a)
Minimum and maximum salaries/wages
Full-time employees
Part-time employees (corrected for number of days worked p.a)
Distribution of wages and salaries across enterprise/farm
Share of informal/casual workers in labour force
Other sources of income for casual/informal workers
[Calculate annual and seasonal incomes]
Comparability high
How to compute value of self-consumption?
How to compute value of unpaid family work?
Defining where to begin and to end the list of suppliers and customers
Figure 1: Absolute Poverty Indicator (SDG1)
14
third-country markets (for example, Chinese workers compared to Ethiopian workers), but also with domestic producers in final markets who may be displaced by imports. Competition from China and other southern exporters has had a material impact on the incomes of workers in northern economies who have either been displaced by southern origin competition, or whose incomes have
been adjusted downwards to cope with the competitive pressures exerted by southern producers with lower wages.
These various distributional issues are set out in Figure 2. In each case, the measurement of incomes needs to reflect the data-capture challenges set out in Figure 1 with respect to SDG1.
Sustainable agriculture (SDG2); Sustainable water and sanitation (SDG6)
Two sets of measures are relevant to sustainable agriculture, water, and sanitation. The first is those which relate to agricultural inputs, and the second is that which relates to effluents arising from agricultural production.
The primary input threatened by export oriented agriculture is water. California, for example, faces endemic water shortages, which are in large part caused and exacerbated by agriculture. The state accounts for 80 percent of global almond production, but this
sector accounts for more than 10 percent of California’s total annual water consumption. Meat exports are another critical strain on water resources since it is estimated that more than 1,600 cubic metres water is used to produce one kg of meat. The use of water and other environmentally sensitive and supply-constrained resources (such as potash) in agricultural GVCs is, technically, relatively easy to measure at the first round. But the second round effects on input use — for example, water incorporated in the production of seeds, fertilisers, and tractors – may be much more difficult to compute. (The computation of the water required to produce
Unit of analysis Data requirements (Specifics dependent on sector and chain)
Strengths and Weakness of indicators
Lead firms
Suppliers
Customer firms
Households
Equality within the firm or farm
Ratio of managerial and technical salaries to wages of workers
Equality with non-GVC participants
Ratio of incomes of managers, technical staff, workers, and farmers to equivalents in the domestic economy who are not included in GVCs
Equality of workers between countries
Ratio of incomes of similar workers living in different countries in same GVC (corrected for purchasing power)
Ratio of workers in successful exporters and displaced workers in the importing economy
Data is available in formal sector and larger firms and farms, but these data are often sensitive and difficult to obtain
Difficulty in obtaining data for small and informal sector firms and farms
Difficulty in obtaining data for firms and employees who have been displaced by global competition
Figure 2: Reduced Inequalities (SDG10)*
* Measurement of income levels is informed by the discussion in Figure 1

15Development and LDCs
one kg of meat does take account of water inputs throughout the chain).
On the effluent side, there are a variety of discharges from agriculture which threaten the sustainability of agriculture and the environment. Some of these are organic (and are relatively easily contained, with short life spans), and others are inorganic (frequently with very long after lives, and which have particularly harmful impacts on the environment). A further category of effluent which is not agriculture-specific is general waste, such as packaging materials. As in the case of inputs, the first round discharge of
effluents in farms and enterprises participating directly in the chain is much easier to measure than are the second round impacts such as suppliers’ suppliers, customer’s suppliers, and customers.
In some cases, CSR programmes are designed to support sustainable agriculture, water access, and sanitation, generally outside of the GVC itself and affecting the wider community.
Figure 3 summarises the data requirements for the analysis of these SDG-related impacts in GVCs.
Age (SDG3); Gender (SDG4)
The nexus between GVCs, age, and gender comprises two sets of effects. The first is on their incorporation in processes of production, and the second concerns their role as consumers (Figure 4).
Referring back to the discussion of performance with respect to SDG1 (absolute incomes) above, Figure 1 identified various measures
of income – earned and unearned, full time and part-time, individual and household, and incomes earned as part of a portfolio of livelihood incomes. Each of these categories can be decomposed by age and gender and few additional methodological problems are raised. However, beyond these methodological issues, the sociology of age and gender discrimination may be such that there may be differential access to gathering these sets of data.
Unit of analysis Data requirements (Specifics dependent on sector and chain)
Strengths and Weakness of indicators
Lead firms
Suppliers
Customer firms
Households
Inputs: Levels of use and Environmental impacts:
Absolute water use and water intensity in context of sustainability of water supplies
Land utilised in context of land availability
Other scarce or environmentally sensitive inputs (e.g., potash)
Effluents: Levels and frequency of discharge, and environmental impacts
Organic
Inorganic
Waste disposal
Utilisation and discharges relatively easy to measure in large and formal sector units
Utilisation and discharges more difficult to measure in small and informal sector units and where specific technical skills are required
Much of this data (especially on discharges) very sensitive and access to data particularly difficult
Often difficult to measure environmental impacts
CSR programmes affect the provision of these inputs outside of the GVC itself.
Figure 3: Sustainable Agriculture (SDG2); Water and Sanitation (SDG6)

16
Much of conventional GVC analysis which focuses on age and gender confines itself to their role as producers. Yet, each of these groups are also consumers, and with specific category defined needs. For example, older people are more likely to require specific products which meet their health needs; similarly, women have regular menstrual cycles which are gender
specific. Hence, the question arises in GVC analysis of whose needs are being met by the products of the GVCs. This is largely a matter of market destination and innovation trajectories (which will be considered in the discussion of SDG 9 below), but it is important that they be addressed explicitly as part of a gender and age specific analysis of GVCs.
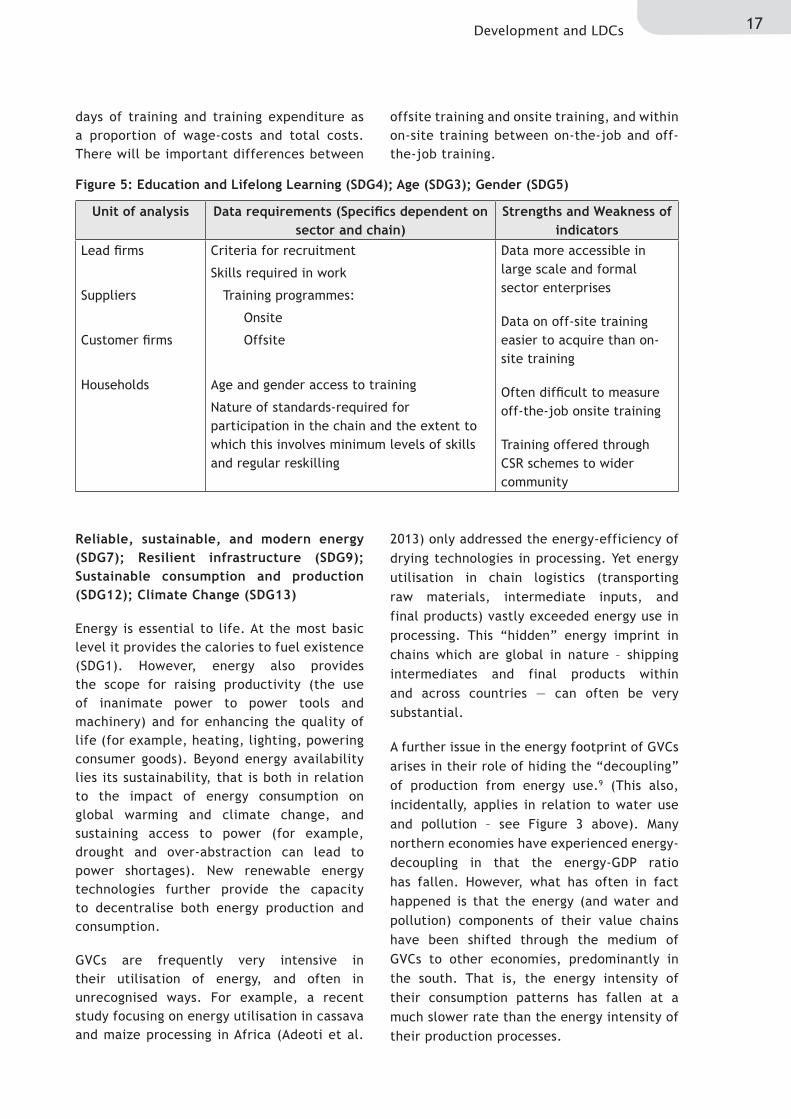
Education and lifelong learning (SDG4); Age (SDG3); Gender (SDG5)
The knowledge-intensity of technology has grown exponentially over recent decades and in many sectors, there is little call for unskilled labour. This applies even in labour-intensive assembly where robots are beginning to substitute for labour.6 As we observed in Section 2 above, the extension of GVCs in recent decades has been largely driven by growth in high income markets and this has led to increasingly standards intensive value chains. At a minimum, standards intensive production processes require basic levels of numeracy and literacy, and these demands have tended to disadvantage the inclusion of small scale, informal sector suppliers
and uneducated labour. Moreover, global competition in the context of increasing technological change requires that all levels of the workforce are required to improve and/or change their skills at regular intervals, as part of a lifelong process.
Whilst these skill challenges are predominantly met outside of GVCs in societal education systems (and sometimes through GVC CSR programmes), there are nevertheless important ways in which the skills of the workforce are affected by the organisation of the GVCs. What are the criteria for recruiting workers, what provisions are made for their enskilling and reskilling, and how does this differ by age and gender? Where possible measures should include hours/
Unit of analysis Data requirements (Specifics dependent on sector and chain)
Strengths and Weakness of indicators
Lead firms
Suppliers
Customer firms
Households
As producers
Income*
As in analysis of absolute incomes (SDG1) – see Figure 1 above
Numbers and ratios
Absolute numbers of different genders and age groups
Share of total employment
As Consumers
Products and services specifically meeting, or specifically not meeting the needs of age and gender populations
Same strengths and weaknesses as in analysis of absolute incomes (SDG1) – see Figure 1 above
Additional problems arise in the sociology of data-collection, that is, it may be difficult to access these data.
Figure 4: Age (SDG3); Gender (SDG5)
* Measurement of income levels is informed by the discussion in Figure 1
6 For example, Foxconn, the world’s largest assembler of robots plans to install one million robots to assemble devices such as the iPhone6 in China. This in part a cost-saving exercise, but also because it reduces the problems which Foxconn has in some of its subsidiaries complying with SDG8 on decent work. Accessed February 23, 2016.
17Development and LDCs
Unit of analysis Data requirements (Specifics dependent on sector and chain)
Strengths and Weakness of indicators
Lead firms
Suppliers
Customer firms
Households
Criteria for recruitment
Skills required in work
Training programmes:
Onsite
Offsite
Age and gender access to training
Nature of standards-required for participation in the chain and the extent to which this involves minimum levels of skills and regular reskilling
Data more accessible in large scale and formal sector enterprises
Data on off-site training easier to acquire than on-site training
Often difficult to measure off-the-job onsite training
Training offered through CSR schemes to wider community
Figure 5: Education and Lifelong Learning (SDG4); Age (SDG3); Gender (SDG5)
Reliable, sustainable, and modern energy (SDG7); Resilient infrastructure (SDG9); Sustainable consumption and production (SDG12); Climate Change (SDG13)
Energy is essential to life. At the most basic level it provides the calories to fuel existence (SDG1). However, energy also provides the scope for raising productivity (the use of inanimate power to power tools and machinery) and for enhancing the quality of life (for example, heating, lighting, powering consumer goods). Beyond energy availability lies its sustainability, that is both in relation to the impact of energy consumption on global warming and climate change, and sustaining access to power (for example, drought and over-abstraction can lead to power shortages). New renewable energy technologies further provide the capacity to decentralise both energy production and consumption.
GVCs are frequently very intensive in their utilisation of energy, and often in unrecognised ways. For example, a recent study focusing on energy utilisation in cassava and maize processing in Africa (Adeoti et al.
2013) only addressed the energy-efficiency of drying technologies in processing. Yet energy utilisation in chain logistics (transporting raw materials, intermediate inputs, and final products) vastly exceeded energy use in processing. This “hidden” energy imprint in chains which are global in nature – shipping intermediates and final products within and across countries — can often be very substantial.
A further issue in the energy footprint of GVCs arises in their role of hiding the “decoupling” of production from energy use.9 (This also, incidentally, applies in relation to water use and pollution – see Figure 3 above). Many northern economies have experienced energy-decoupling in that the energy-GDP ratio has fallen. However, what has often in fact happened is that the energy (and water and pollution) components of their value chains have been shifted through the medium of GVCs to other economies, predominantly in the south. That is, the energy intensity of their consumption patterns has fallen at a much slower rate than the energy intensity of their production processes.
days of training and training expenditure as a proportion of wage-costs and total costs. There will be important differences between
offsite training and onsite training, and within on-site training between on-the-job and off-the-job training.

18
Unit of analysis Data requirements (Specifics dependent on sector and chain)
Strengths and Weakness of indicators
Lead firms
Suppliers
Customer firms
Households
Providers of infrastructure
Energy-intensity of production in individual firms and farms throughout the chain (including logistics and trade) (Energy as % of total costs)
Energy-intensity of production in individual firms and farms in adjacent chains which feed into the GVC (Energy as % of total costs)
Renewables as % of total energy utilisation
Assessment of the extent to which energy utilisation in the chain reflects displacement of energy from/to chains in other countries
Accessibility to and reliability of energy sources
Cost of alternative energy sources
Relatively easy to measure energy utilisation in large scale and formal sector firms and farms
Difficulty of measuring intensity in logistics and trade links in chain and in feeder chains
Difficultly in assessing and measuring cross-border displacement of energy utilisation
CSR programmes may provide sustainable energy to wider community
Figure 6: Reliable, Sustainable, and Modern Energy (SDG7); Resilient Infrastructure (SDG9); Sustainable Consumption and Production (SDG12); Climate Change (SD13); Oceans and Marine (SDG14); Forestry and Biodiversity (SDG15)
These differing elements can be measured with varying levels of accuracy in GVCs (Figure 6). The energy intensity of production can be measured within production processes in individual links in the chain. Less easily, attempts can be made to measure the energy intensity of the whole chain, including logistics and international transport. Even more difficult is the capability to measure the extent to which the energy-GDP ratio in a given economy is disguised through the globalisation of energy-intensive processes to other economies.
A further category of sustainable energy concerns lies in access to energy. Grid-based systems are often inaccessible in regions outside major cities, and this is one advantage of renewable energy sources. On the other hand, renewable energy sources may be intermittent and may disfavour those without access to grid-based infrastructure.
Inclusive and sustainable economic growth, full and productive employment, and decent work (SDG8); Resilient infrastructure, inclusive industrialisation, and fostering innovation (SDG9)
The links between GVCs and sustainable and inclusive growth is complex and includes interactions with growth and export expansion, the quality of work, the capacity to upgrade, and inclusive innovation.
Inclusive growth impacts
Dynamic GVCs which respond appropriately in competitive global markets are an important source of employment and sustainable growth. This is abundantly evident from the experience of the Chinese economy since the mid-1980s, where high-growth export oriented GVCs have provided, directly and indirectly, tens of millions of jobs, and have provided the wherewithal for China to make massive inroads in reducing levels
19Development and LDCs
of absolute poverty. This experience in China replicates events in an earlier era in Japan, and then in the Asian Tigers (Hong Kong, Korea, Singapore, and Taiwan). It is also an experience which is currently spreading to some other Asian economies, including Bangladesh (which has, over a relatively short period, become the world’s second largest exporter of apparel), Vietnam, and other Asian economies. The positive impact of this growth to the SDGs includes employment, and the growth of value added and net exports (recognising the difference between gross and net export and output values — see Section 2 above). Data on gross output and employment growth are relatively easy to gather from formal sector and large scale enterprises and farms. Data on net output and net exports are more difficult to obtain (for example since much of locally-sourced material inputs are imported), but this may be unknown to purchasing enterprises (Figure 7).
Measuring the excluding character of GVCs is not just important, but also creates difficult problems of measurement, partly because the excluded are not just to be found in the exporting economies, but also in economies whose competitiveness is undermined by the success of the exporting economies. Further, it is naturally much easier to record phenomena which currently exist (for example, the numbers of employees in a given plant) than the numbers which no longer exist (for example, displaced employment in enterprises forced out of business by successful GVCs). An additional problem is how far down the chain to chase employment loss, including in chains which feed into the primary chain under investigation.
These are not the only indirect income, growth, and employment impacts of GVCs. For example, when land is diverted to produce crops for foreign consumers through the expansion of GVCs, it can result in a diversion of land and other critical inputs (such as water) from meeting the needs of local and domestic consumers. This will result in an increase in hunger, nutrition, and food security (SDG2). On the other hand, when export-oriented agriculture increases the efficiency of resource-use, this may augment local food supplies. Even more problematic, in a world where there is not unlimited demand, the success of some exporting economies may be at the cost of other potential exporting economies. For example, without Africa’s preferential access through The African Growth and Opportunities Act (AGOA), Asian economies would remove the space for more than US$1billion annual apparel exports from Africa to the US (Morris et al. 2016)
A further excluding characteristic in GVCs arises when particular sets of producers lack the capabilities to participate in GVCs. As observed in Section 2 above, standards intensive GVCs may exclude small-scale, illiterate, and enumerate farms, firms, and workers who are unable to afford certification or lack the skills required to participate productively in these standards-intensive GVCs. The significance of this will vary with the standards-intensity of final markets and, as observed in Section 2, when exports are directed to low and middle-income regional and southern markets, GVCs are less excluding of these marginalised communities.
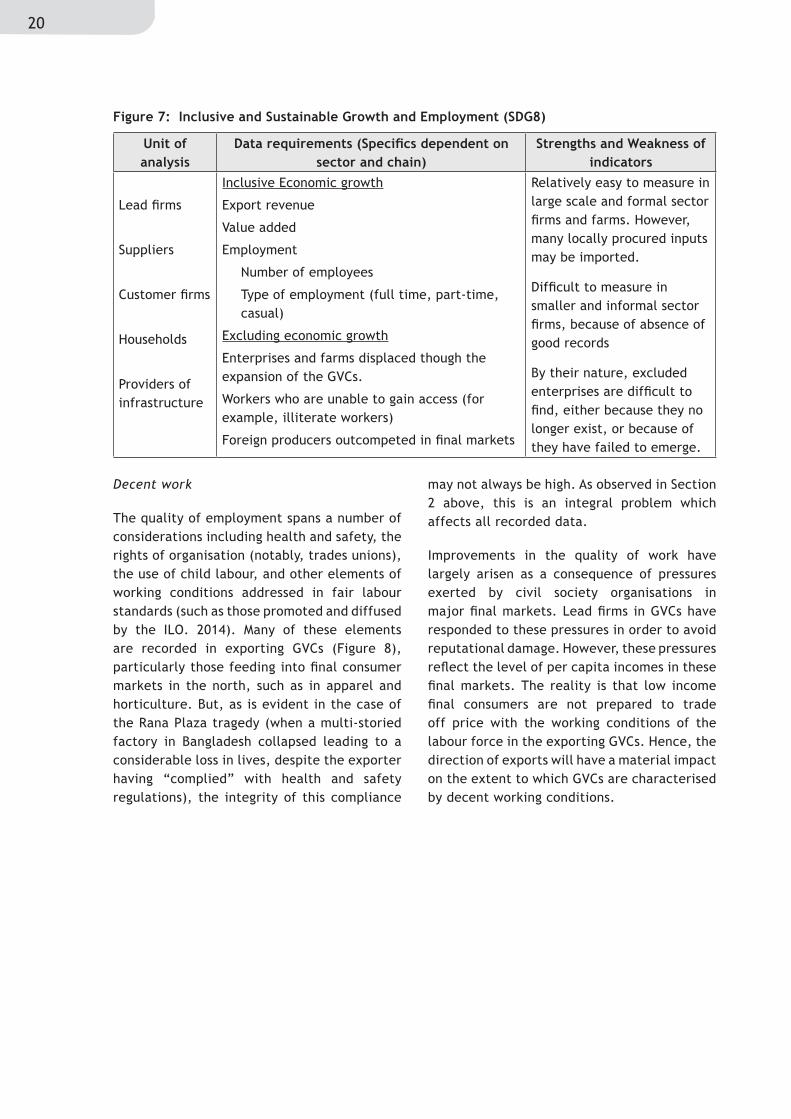
20
Decent work
The quality of employment spans a number of considerations including health and safety, the rights of organisation (notably, trades unions), the use of child labour, and other elements of working conditions addressed in fair labour standards (such as those promoted and diffused by the ILO. 2014). Many of these elements are recorded in exporting GVCs (Figure 8), particularly those feeding into final consumer markets in the north, such as in apparel and horticulture. But, as is evident in the case of the Rana Plaza tragedy (when a multi-storied factory in Bangladesh collapsed leading to a considerable loss in lives, despite the exporter having “complied” with health and safety regulations), the integrity of this compliance
may not always be high. As observed in Section 2 above, this is an integral problem which affects all recorded data.
Improvements in the quality of work have largely arisen as a consequence of pressures exerted by civil society organisations in major final markets. Lead firms in GVCs have responded to these pressures in order to avoid reputational damage. However, these pressures reflect the level of per capita incomes in these final markets. The reality is that low income final consumers are not prepared to trade off price with the working conditions of the labour force in the exporting GVCs. Hence, the direction of exports will have a material impact on the extent to which GVCs are characterised by decent working conditions.
Unit of analysis
Data requirements (Specifics dependent on sector and chain)
Strengths and Weakness of indicators
Lead firms
Suppliers
Customer firms
Households
Providers of infrastructure
Inclusive Economic growth
Export revenue
Value added
Employment
Number of employees
Type of employment (full time, part-time, casual)
Excluding economic growth
Enterprises and farms displaced though the expansion of the GVCs.
Workers who are unable to gain access (for example, illiterate workers)
Foreign producers outcompeted in final markets
Relatively easy to measure in large scale and formal sector firms and farms. However, many locally procured inputs may be imported.
Difficult to measure in smaller and informal sector firms, because of absence of good records
By their nature, excluded enterprises are difficult to find, either because they no longer exist, or because of they have failed to emerge.
Figure 7: Inclusive and Sustainable Growth and Employment (SDG8)
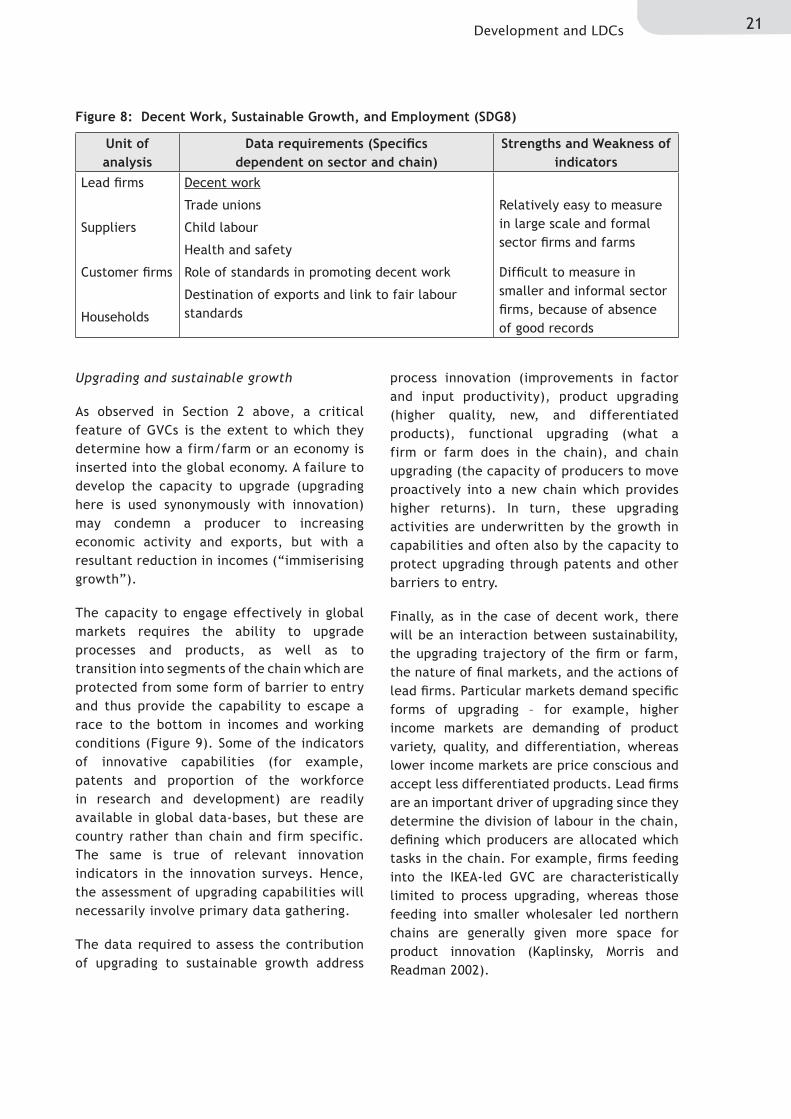
21Development and LDCs
Unit of analysis
Data requirements (Specifics dependent on sector and chain)
Strengths and Weakness of indicators
Lead firms
Suppliers
Customer firms
Households
Decent work
Trade unions
Child labour
Health and safety
Role of standards in promoting decent work
Destination of exports and link to fair labour standards
Relatively easy to measure in large scale and formal sector firms and farms
Difficult to measure in smaller and informal sector firms, because of absence of good records
Figure 8: Decent Work, Sustainable Growth, and Employment (SDG8)
Upgrading and sustainable growth
As observed in Section 2 above, a critical feature of GVCs is the extent to which they determine how a firm/farm or an economy is inserted into the global economy. A failure to develop the capacity to upgrade (upgrading here is used synonymously with innovation) may condemn a producer to increasing economic activity and exports, but with a resultant reduction in incomes (“immiserising growth”).
The capacity to engage effectively in global markets requires the ability to upgrade processes and products, as well as to transition into segments of the chain which are protected from some form of barrier to entry and thus provide the capability to escape a race to the bottom in incomes and working conditions (Figure 9). Some of the indicators of innovative capabilities (for example, patents and proportion of the workforce in research and development) are readily available in global data-bases, but these are country rather than chain and firm specific. The same is true of relevant innovation indicators in the innovation surveys. Hence, the assessment of upgrading capabilities will necessarily involve primary data gathering.
The data required to assess the contribution of upgrading to sustainable growth address
process innovation (improvements in factor and input productivity), product upgrading (higher quality, new, and differentiated products), functional upgrading (what a firm or farm does in the chain), and chain upgrading (the capacity of producers to move proactively into a new chain which provides higher returns). In turn, these upgrading activities are underwritten by the growth in capabilities and often also by the capacity to protect upgrading through patents and other barriers to entry.
Finally, as in the case of decent work, there will be an interaction between sustainability, the upgrading trajectory of the firm or farm, the nature of final markets, and the actions of lead firms. Particular markets demand specific forms of upgrading – for example, higher income markets are demanding of product variety, quality, and differentiation, whereas lower income markets are price conscious and accept less differentiated products. Lead firms are an important driver of upgrading since they determine the division of labour in the chain, defining which producers are allocated which tasks in the chain. For example, firms feeding into the IKEA-led GVC are characteristically limited to process upgrading, whereas those feeding into smaller wholesaler led northern chains are generally given more space for product innovation (Kaplinsky, Morris and Readman 2002).
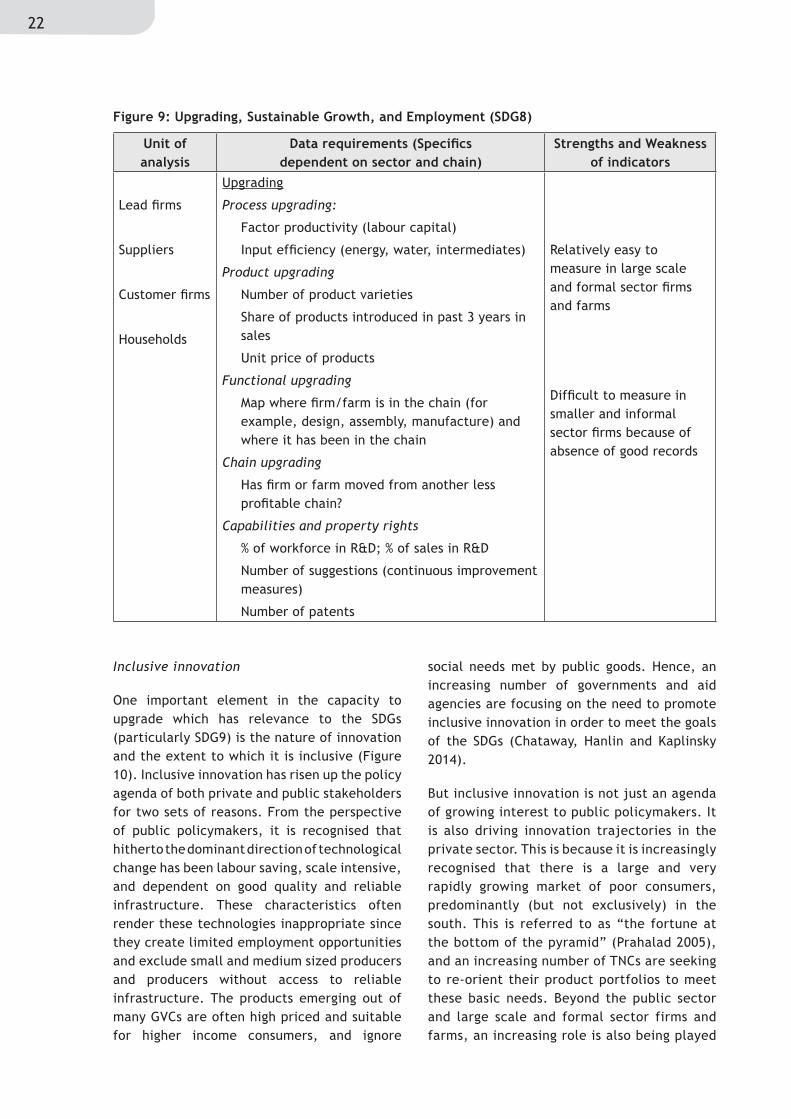
22
Unit of analysis
Data requirements (Specifics dependent on sector and chain)
Strengths and Weakness of indicators
Lead firms
Suppliers
Customer firms
Households
Upgrading
Process upgrading:
Factor productivity (labour capital)
Input efficiency (energy, water, intermediates)
Product upgrading
Number of product varieties
Share of products introduced in past 3 years in sales
Unit price of products
Functional upgrading
Map where firm/farm is in the chain (for example, design, assembly, manufacture) and where it has been in the chain
Chain upgrading
Has firm or farm moved from another less profitable chain?
Capabilities and property rights
% of workforce in R&D; % of sales in R&D
Number of suggestions (continuous improvement measures)
Number of patents
Relatively easy to measure in large scale and formal sector firms and farms
Difficult to measure in smaller and informal sector firms because of absence of good records
Figure 9: Upgrading, Sustainable Growth, and Employment (SDG8)
Inclusive innovation
One important element in the capacity to upgrade which has relevance to the SDGs (particularly SDG9) is the nature of innovation and the extent to which it is inclusive (Figure 10). Inclusive innovation has risen up the policy agenda of both private and public stakeholders for two sets of reasons. From the perspective of public policymakers, it is recognised that hitherto the dominant direction of technological change has been labour saving, scale intensive, and dependent on good quality and reliable infrastructure. These characteristics often render these technologies inappropriate since they create limited employment opportunities and exclude small and medium sized producers and producers without access to reliable infrastructure. The products emerging out of many GVCs are often high priced and suitable for higher income consumers, and ignore
social needs met by public goods. Hence, an increasing number of governments and aid agencies are focusing on the need to promote inclusive innovation in order to meet the goals of the SDGs (Chataway, Hanlin and Kaplinsky 2014).
But inclusive innovation is not just an agenda of growing interest to public policymakers. It is also driving innovation trajectories in the private sector. This is because it is increasingly recognised that there is a large and very rapidly growing market of poor consumers, predominantly (but not exclusively) in the south. This is referred to as “the fortune at the bottom of the pyramid” (Prahalad 2005), and an increasing number of TNCs are seeking to re-orient their product portfolios to meet these basic needs. Beyond the public sector and large scale and formal sector firms and farms, an increasing role is also being played

23Development and LDCs
in inclusive innovation by community-based organisations and civil society organisations
(particularly by environmentally-oriented CSOs) (Smith, Fressoli and Thomas 2014).
Implementation of SDGs (SDG17)
One of the problems bedevilling all policy is that of implementation, including with respect to many of the factors affecting the realisation of SDGs in value chains. Policy rhetoric is often ineffective, despite the best of intentions by relevant stakeholders. However, there is growing evidence that value chains have an important role to play in filling the gap between intention and practice. This is referred to as Value Chain Alignment. Here, strategy and then the detailed policies which underpin strategy are developed and implemented by a consortium of parties drawn from across the value chain (Figure 11). The nature of these stakeholder aligned value chains is very context specific, but there are many examples. The success of Japanese industry during the 1970s and 1980s was underwritten by the introduction of pioneering forms of supply chain management and
learning in which firms along the supply chain worked closely together to slim inventories, improve quality, and improve product offerings (Cusumano 1985). This chain alignment predominantly involved private sector participants drawn from the across chain, but in other cases, the alignment included state participants (the success of the South African auto assembling and components sector was built on close collaboration between the state, lead TNCs, domestic suppliers, and the trades unions) (Barnes and Morris 2008). In yet other cases, such as the timber GVC, the alignment also included CSOs collaborating with private sector firms and governments (UNECA 2016). Even within individual enterprises, sustainable growth (SDG1 and SDG8), equity (SDG10), decent work (SDG8), and other elements of the SDG agenda are best achieved when different stakeholders cooperate in order to achieve common objectives.
Unit of analysis
Data requirements (Specifics dependent on sector and chain)
Strengths and Weakness of indicators
Lead firms
Suppliers
Customer firms
Households
Inclusion in process:
Labour intensity
Scale
Reliance on infrastructure
Inclusion in products
Unit price
Public goods
Reliance on infrastructure
Inclusion in innovation process itself
Role of workforce in innovation
Role of small enterprises in innovation
Role of community-based and civil society organisations in innovation
Relatively easy to measure in large scale and formal sector firms and farms and CSOs
Difficult to measure in smaller and informal sector firms and community-based organisations because of absence of good records
Figure 10: Inclusive Innovation, Sustainable Growth, and Employment (SDG8, SDG9)
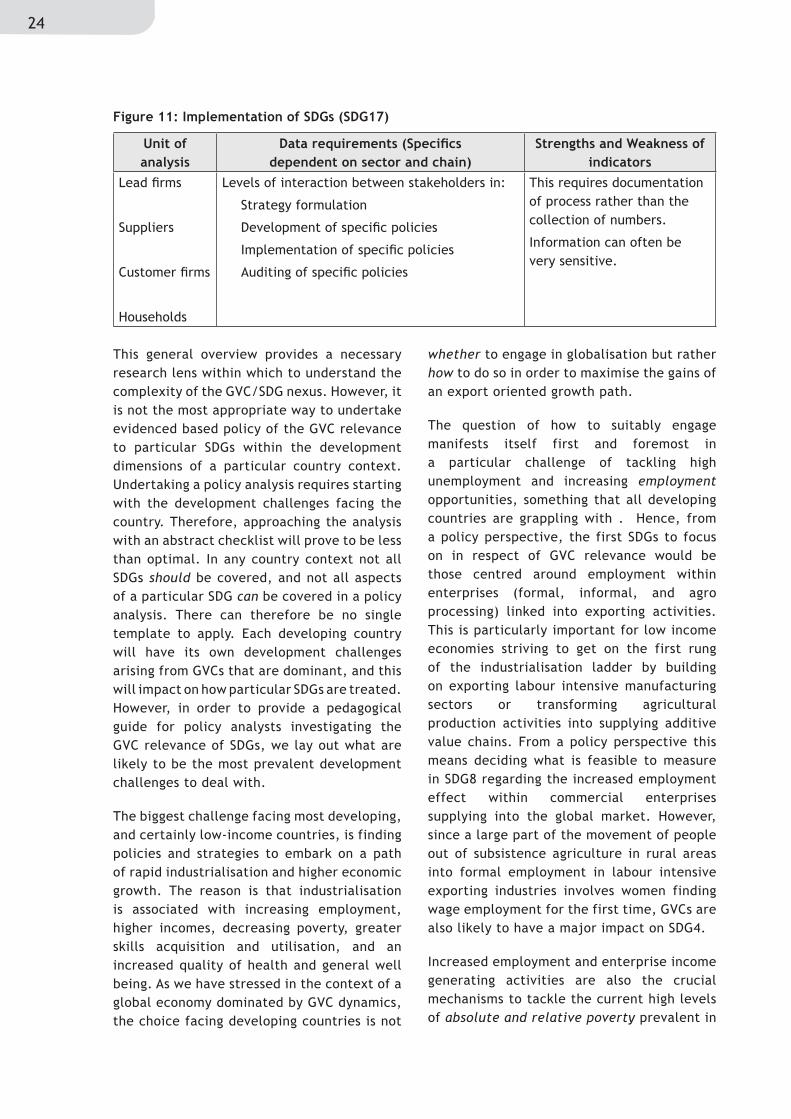
24
This general overview provides a necessary research lens within which to understand the complexity of the GVC/SDG nexus. However, it is not the most appropriate way to undertake evidenced based policy of the GVC relevance to particular SDGs within the development dimensions of a particular country context. Undertaking a policy analysis requires starting with the development challenges facing the country. Therefore, approaching the analysis with an abstract checklist will prove to be less than optimal. In any country context not all SDGs should be covered, and not all aspects of a particular SDG can be covered in a policy analysis. There can therefore be no single template to apply. Each developing country will have its own development challenges arising from GVCs that are dominant, and this will impact on how particular SDGs are treated. However, in order to provide a pedagogical guide for policy analysts investigating the GVC relevance of SDGs, we lay out what are likely to be the most prevalent development challenges to deal with.
The biggest challenge facing most developing, and certainly low-income countries, is finding policies and strategies to embark on a path of rapid industrialisation and higher economic growth. The reason is that industrialisation is associated with increasing employment, higher incomes, decreasing poverty, greater skills acquisition and utilisation, and an increased quality of health and general well being. As we have stressed in the context of a global economy dominated by GVC dynamics, the choice facing developing countries is not
whether to engage in globalisation but rather how to do so in order to maximise the gains of an export oriented growth path.
The question of how to suitably engage manifests itself first and foremost in a particular challenge of tackling high unemployment and increasing employment opportunities, something that all developing countries are grappling with . Hence, from a policy perspective, the first SDGs to focus on in respect of GVC relevance would be those centred around employment within enterprises (formal, informal, and agro processing) linked into exporting activities. This is particularly important for low income economies striving to get on the first rung of the industrialisation ladder by building on exporting labour intensive manufacturing sectors or transforming agricultural production activities into supplying additive value chains. From a policy perspective this means deciding what is feasible to measure in SDG8 regarding the increased employment effect within commercial enterprises supplying into the global market. However, since a large part of the movement of people out of subsistence agriculture in rural areas into formal employment in labour intensive exporting industries involves women finding wage employment for the first time, GVCs are also likely to have a major impact on SDG4.
Increased employment and enterprise income generating activities are also the crucial mechanisms to tackle the current high levels of absolute and relative poverty prevalent in
Unit of analysis
Data requirements (Specifics dependent on sector and chain)
Strengths and Weakness of indicators
Lead firms
Suppliers
Customer firms
Households
Levels of interaction between stakeholders in:
Strategy formulation
Development of specific policies
Implementation of specific policies
Auditing of specific policies
This requires documentation of process rather than the collection of numbers.
Information can often be very sensitive.
Figure 11: Implementation of SDGs (SDG17)
25Development and LDCs
most developing countries. This is essentially measuring the impact, in whatever way is feasible, of GVCs on poverty reduction (SDG1 and SDG10). Practically speaking, it means measuring wage levels in the formal sectors where GVCs are dominant, and if possible in informal activities feeding in further down the supply chain. However, given the pervasiveness of the agricultural sector in these economies and the policy relevance of GVCs concerned with agricultural value addition of export products, measuring the GVC relevance of SDGs means also evaluating positive income accrual of rural enterprises engaged in such production activities through SDG2.
As we have noted, not all industrialisation and employment trajectories within an export oriented strategy lead to an upward development path. Competing within GVCs primarily on low labour costs can also lead a developing country in to a path of “immiserising growth.” Hence analysing skills development activities in particular sectors, and educational standards in general, is critical in order to ensure that the industrialisation path in any country being analysed follows more of an upgrading
trajectory. This involves unpacking SDG5 as well as parts of SDG8 and SDG9 in so far as these relate to various forms of upgrading and innovation.
Rapid rates of urbanisation stretching existing infrastructure, energy, water, and food resources to their limits is another major challenge that developing countries face. The causes are manifold and complex and only some of this issue of adjusting to, and benefitting from, rapid urbanisation can be attributable and relevant to a country’s insertion into GVCs. Infrastructure provision is key for industrialisation, transformation of rural areas, and ensuring urban life is palatable for ordinary citizens. This mostly includes the involvement of foreign capital to upgrade infrastructural networks across the board. Rapidly growing cities require both increased energy and a move away from fossil fuel dependency. This can only be achieved by moving into renewable energy supply, which requires the involvement of foreign energy utilities developing renewable energy supply and distribution networks. The relevance and impact of GVCs on this challenge requires investigating SDG 2, SDG 6, SDG 7, and SDG9 in their pertinent aspects.

26
Achievement of the SDG targets is underpinned by the nature and trajectory of economic growth. As we saw in Section 2, in the contemporary period, throughout the global economy, economic growth occurs in the context of increasing globalisation. Within this, more than two-thirds of global export growth occurs within GVCs. Particularly for smaller and low income economies whose domestic markets are limited, the role played by GVCs will have a powerful bearing on SDG outcomes. As observed in Section 2, the expansion of GVCs does not automatically lead to outcomes which result in the achievement of SDGs; it very much depends on the character of the GVCs which insert an economy into the global economy . The key character of GVCs is that many are governed by lead firms; that they comprise two main families (additive and vertically specialised GVCs) with great diversity within and between three types of GVCs; that they are standards-intensive; and that they demand the capacity to upgrade (innovate) on an ongoing basis if farms, firms, economies, and even individuals are to capture the share of rents generated in the chain. It also depends greatly on the character of the economy as well. Least developed countries have different attributes to middle and high income economies, for example, with regard to human resource development and infrastructure. Similarly, economies with low levels of industrialisation face different challenges and opportunities from those which are overwhelmingly dependent on primary commodities, and so on.
The introduction of MDG and SDG targets as a way of achieving developmental goals follows on from the successful experience of industry and many governments in using targets as a way of monitoring — and then stretching — performance in the achievement of strategic objectives (Section 3). Although this international experience with targets shows their positive contribution, care must be taken with numbers which can suffer from a variety of types of distortion. The data can be
biased, can often have poor levels of integrity, may not be comparable across firms, sectors, and countries, and may suffer from conceptual problems. A distinction can also be drawn between SDG-relevant data which is available as macro-datasets, and more detailed data generated through primary investigation.
It is clear that little of the macro data is relevant to an understanding of how GVCs can contribute to the achievement of the SDGs. But without a clear understanding of the GVC-SDG nexus, policies designed to achieve SDGs will be poorly focused. Evidence informed policy is thus critical to the achievement of the SDGs. In Section 4 we considered 11 categories of enquiry which throw light on the GVC-SDG nexus. In each case we specified the unit of analysis involved (for example, household, farm, and firm), listed the main categories of data which inform this interaction, and listed the main opportunities and obstacles to the gathering of relevant data. The list of researchable topics in this discussion is formidable and it is not expected that any one study will consider them all. Each research enquiry will necessarily have to be fit-for-purpose and draw on this toolkit selectively.
Two central conclusions emerge from this exercise. First, there is no magic bullet, no single questionnaire or method which throws light on all the SDG concerns in all chains in all sectors and in all economies. Each of these experiences will be specific and the relevance of the data categories specified in Section 4 will vary in importance. Moreover, it is unlikely that a single GVC study will seek to examine all of the SDG-relevant issues. Therefore, enquiry seeking to produce evidence-informed policy will necessarily have to be fit-for purpose and tailored to meet the demands of specific issues and the resources available to undertake the research. There will also of course be a trade-off on the integrity of the data collected and the resources and time span available for the enquiry.
5. CONCLUSION
27Development and LDCs
The second main conclusion which we can draw concerns the importance of documenting changes over time. One of the powers arising from collecting measures of performance is that it allows for comparative benchmarking. That is, comparing across units of analysis (for example, farms, and firms), across sectors and between countries at a single point allows for the assessment of comparative performance. But the collection of measures over time, within a single unit of analysis, provides the capacity to set targets and to monitor performance. Of course both cross sectoral and temporal data gathering is important. Yet too often a data collecting exercise is undertaken with great competence, but is not followed up to assess what changes have occurred over time,
and what qualitative factors have determined outcomes.
In summary, therefore, GVCs offer great potential in the achievement of SDG targets. But they must be explicitly fashioned to achieve these developmental ends since left to market forces alone, GVCs may not contribute optimally to desired development outcomes. The participation of key stakeholders is critical to realising these outcomes, but for this to achieved, evidence informed policy is a necessary input. The measures set out in Section 4 above seek to define key elements of GVC performance which can be measured and used to benchmark comparative achievements and to provide targets for sustained improvement.
28
REFERENCES
Adeoti, J., R. Kemp, J. Ndichu, A. E. Obayelu, J. Blohmke, R. Kaplinsky, and K. Urama. 2013. Diffusion strategy of green technology and green industry in Africa: A study of renewable energy technology market, and energy efficiency adoption in Cassava and Maize processing industries in Kenya and Nigeria. Final report of study for KEEI and UNIDO.
Baldwin, Richard, and Philippe Martin. 1999. “Two Waves Of Globalisation: Superficial Similarities, Fundamental Differences”. NBER Working Paper 6904.
Barnes, Justin, and Mike Morris. 2008. “Staying Alive In The Global Automotive Industry: What Can Developing Economies Learn From South Africa About Linking Into Global Automotive Value Chains?” The European Journal of Development. Res. 20 (1): 31-55. doi:10.1080/09578810701853157.
Chataway, Joanna, Rebecca Hanlin, and Raphael Kaplinsky. 2014. “Inclusive Innovation: An Architecture For Policy Development.” Innovation And Development 4 (1): 33-54.
Cusumano, Michael A. 1985. The Japanese Automobile Industry. Cambridge, Mass. Published by the Council on East Asian Studies, Harvard University.
Edward, P., and A. Sumner. 2014. “Estimating the Scale and Geography of Global Poverty Now and in the Future: How Much Difference Do Method And Assumptions Make?” World Development 58: 67-82.
Eurostat. 2016. “Community Innovation Survey.” http://ec.europa.eu/eurostat/web/microdata/community-innovation-survey.
Hamel, Gary, and C.K. Prahalad. 1994. “Competing for the Future.” Harvard Business Review July-August.
International Labour Organization. 2014. “Introduction to International Labour Standards.” http://www.ilo.org/global/standards/introduction-to-international-labour-standards/lang--en/index.htm.
Jerven, Morten. 2013. Poor Numbers: How We Are Misled By African Development Statistics And What To Do About It. Cornell University Press.
Kaplinsky, Raphael. 2005. Globalization, Poverty And Inequality. Cambridge, UK: Polity.
Kaplinsky, Raphael, and Mike Morris. 2015. “Thinning And Thickening: Productive Sector Policies In The Era Of Global Value Chains.” European Journal of Development.
Kaplinsky, Raphael, and Mike Morris. 2014. “Developing Industrial Clusters And Supply Chains To Support Diversification And `Sustainable Development Of Exports In Africa - The Composite Report.” African Export-Import Bank.
Kaplinsky, Raphael, Mike Morris, and Jeff Readman. 2002. “The Globalization Of Product Markets And Immiserizing Growth: Lessons From The South African Furniture Industry.” World Development 30 (7): 1159-1177.
Milanovic, Branko. 2005. Worlds Apart. Princeton, N.J.: Princeton University Press.
Morris, Mike, Leonhard Plank, and Cornelia Staritz. 2015. “Regionalism, End Markets And Ownership Matter: Shifting Dynamics In The Apparel Export Industry In Sub Saharan Africa.” Environment And Planning A 48 (7): 1244-1265.
29Development and LDCs
Piore, Michael J., and Charles F. Sabel. 1984. The Second Industrial Divide. New York: Basic Books.
Prahalad, C. K. 2005. The Fortune At The Bottom Of The Pyramid. Upper Saddle River, NJ: Wharton School Pub.
Schumpeter, Joseph A., and Redvers Opie. 1934. The Theory Of Economic Development. Cambridge, Massachusetts: Harvard University Press.
Smith, Adrian, Mariano Fressoli, and Hernán Thomas. 2014. “Grassroots Innovation Movements: Challenges And Contributions.” Journal Of Cleaner Production 63: 114-124.
United Nations Conference on Trade and Development. 2013. World Investment Report.
United Nations Economic Commission for Africa. 2016. Economic Report on Africa.
Yuqing, and Neal Detert. 2010. “How The Iphone Widens the United States Trade Deficit With the People’s Republic Of China.” ADBI Working Paper Series.
United Nations Educational Scientific and Cultural Organization. 2014. “Measuring Innovation.” http://www.uis.unesco.org/ScienceTechnology/Pages/innovation-statistics.aspx.
www.ictsd.org
ICTSD’s Programme on Development and LDCs aims to empower low income countries to leverage trade opportunities for inclusive growth and sustainable development. Programmatic activities cover regional integration, global value chains, and services trade.
Other publications from the Development and LDCs programme include:
• Global Value Chains, Industrial Policy, and Sustainable Development - Ethiopia’s Apparel Export Sector. By Cornelia Staritz, Leonhard Plank, and Mike Morris, 2016.
• Trade Policies and Sustainable Development in the Context of Global Value Chains. By ICTSD, 2016.
• Global Value Chains, Sustainable Development and the Apparel Industry in Lesotho. By Mike Morris, Justin Barnes, and Moshe Kao, 2016.
• The Gender Dimensions of Global Value Chains. By Penny Bamber and Cornelia Staritz, 2016.
• Global Value Chains and Trade Facilitation: Opportunities for Sustainable Development. By Ben Shepherd, 2016.
About ICTSDThe International Centre for Trade and Sustainable Development (ICTSD) is an independent think-and-do-tank, engaged in the provision of information, research and analysis, and policy and multistakeholder dialogue, as a not-for-profit organisation based in Geneva, Switzerland. Established in 1996, ICTSD’s mission is to ensure that trade and investment policy and frameworks advance sustainable development in the global economy.