Embed Size (px)
Citation preview

INCLUSIONARY ZONING IN PHILADELPHIA
An Economic Analysis of the City’s Proposed “Mixed Income Housing Program”
Published By:
Authored By:
Kevin C. Gillen, Ph.D.
October 2017
INCLUSIONARY ZONING IN PHILADELPHIA An Economic Analysis of the City’s Proposed “Mixed Income Housing Program”
1
EXECUTIVE SUMMARY
In an effort designed to promote the construction of more affordable housing, the City of Philadelphia is considering amending Title Seven of Philadelphia’s Housing Code to mandate that 10% of all future new dwelling units in housing developments containing 10 or more units be affordable. Such mandates are more commonly known as “Inclusionary Zoning,” or “IZ” for short.
This report analyzes both the existing research literature on housing affordability and how similar IZ programs and mandates in other U.S. jurisdictions have fared, and also undertakes a cost-benefit analysis of how the proposed IZ mandate would affect housing outcomes in Philadelphia.
Among this report’s key findings are:
Philadelphia easily meets the federal government’s definition of an “affordable” housing stock:
o The median Philadelphia home is priced at 2.4 times the median Philadelphia household income, which is significantly less than the government’s threshold of 3.1.
o Using the government’s definition of “affordability,” Philadelphia is more affordable than 24 of the 32 largest U.S. cities.
o Seventy-two percent of Philadelphia’s housing stock is affordable to the median income Philadelphia household. Using this definition, Philadelphia is more affordable than 22 of the 32 largest U.S. cities
o Philadelphians who rent currently spend only 28.2% of their income on rent, which is also less than the 30% threshold of affordability defined by the federal government.
By contrast, large U.S. cities that currently have existing IZ programs in place easily meet the federal government’s definition of having an “unaffordable” housing stock:
o The average house is priced at 6.4 times the median household income. o The percent of each city’s housing stock that is affordable to its median income
household is an average of 30%. o Households who rent in those cities spend an average of 39.7% of their income
on rent.
INCLUSIONARY ZONING IN PHILADELPHIA An Economic Analysis of the City’s Proposed “Mixed Income Housing Program”
2
Where IZ has been implemented on a large scale, the academic literature has generally found that the results have ranged from mixed to only slightly positive:
o Most jurisdictions have experienced a modest to sharp decline in housing starts. o As a consequence of declining housing starts, the supply of new housing is
smaller than otherwise expected, thus causing additional increases in house prices and exacerbating housing unaffordability.
o The average number of affordable new units that have been produced has been exceedingly small: in large cities or states with IZ, the average increase in affordable units was only 43 units per year.
Finally, a cost-benefit study of four actual residential development projects in Philadelphia found that the IZ mandate would cause the average return on investment (ROI) to decline from 8.2% to 0.6%, thus rendering each project non-viable.
o Moreover, this cost-benefit analysis was executed under the “best case” scenario for the affordable units: the rent or price of the affordable units was computed by assuming that the household renting or buying those units earned the maximum allowable income and spent the maximum allowable percentage of this income, as defined in the proposed IZ bill.
The findings indicate that the implementation of the IZ bill in its current form would have serious adverse effects on Philadelphia’s housing stock, in terms of its quantity and affordability.
A more constructive approach to increasing the quality and quantity of affordable housing is likely to be found in a public-private partnership that seeks to lower the cost of constructing new housing and increasing the ROI for improving and rehabilitating Philadelphia’s existing housing.
INCLUSIONARY ZONING IN PHILADELPHIA An Economic Analysis of the City’s Proposed “Mixed Income Housing Program”
3
OVERVIEW AND MOTIVATION
In an effort designed to promote the construction of more affordable housing, the City of Philadelphia is considering amending Title Seven of Philadelphia’s Housing Code to mandate the inclusion of affordable units. The proposed ordinance, which is titled the “Mixed Income Housing Program,” would require that one out of every 10 units in any new residential construction project with 10 or more units be rented or sold at an “affordable” rate to qualifying low-to-moderate income households, or the developer must make a payment in lieu of building the affordable units that would be used to increase the amount of affordable housing in Philadelphia overall. In essence, the legislation compels the developer to sell or rent 10% of any future units that they build at a significant discount from what they would otherwise get in the market, or else pay a fee to the city that is equal to the total value of that discount. While the provision of new affordable housing is one of the roles of city government, the proposed mandate places the burden of supplying the affordable units on the private sector, i.e., real estate developers. Therefore, it is worth examining the capacity of this segment of the local economy to effectively provide such units, and subsequently, to characterize the legislation’s potential impact on the overall housing market in Philadelphia. The purpose of this report is to analyze this ordinance in both the larger context of how affordable (or unaffordable) Philadelphia’s housing stock may be, and in the more specific context that this ordinance would likely have on the housing market if enacted. This report is structured into four main parts:
I. Inclusionary Zoning and its use by other U.S. jurisdictions. II. Definition of “housing affordability” and how affordable Philadelphia is compared to other
cities. III. A review of academic research literature on the effect Inclusionary Zoning has had in other
U.S. jurisdictions that have enacted it. IV. The applicability of Inclusionary Zoning to Philadelphia’s housing market and the likely
impact of the currently proposed mandate.
INCLUSIONARY ZONING IN PHILADELPHIA An Economic Analysis of the City’s Proposed “Mixed Income Housing Program”
4
I. INCLUSIONARY ZONING: BACKGROUND AND CONTEXT
In recent decades, many communities across the country have seen house prices appreciate faster than local incomes. The rapid price appreciation of the 2000-2007 housing bubble and the current robust recovery have raised public concern that an increasing number of households are facing significant challenges to housing affordability. Since housing is typically a locally-provided good, a growing number of municipalities have implemented policies to promote greater housing affordability, such as “Inclusionary Zoning.” Inclusionary Zoning (hereafter “IZ”) essentially mandates that developers provide new units at below-market rates to low- and moderate-income households, either in the form of reduced prices or reduced rents. Currently, there are approximately 500 communities in the U.S. that have implemented some form of IZ.1 Although the particular details of these mandates vary significantly across communities, such initiatives are typically seen as attractive by both local politicians and households because the onus of providing these affordable units is on private developers, and thus does not require increased taxes or expenditure of public monies that would fall on the citizens and taxpayers of the community. However, just as the size and scope of IZ initiatives differs considerably from one community to the next, so too do the local market conditions that determine how successful such initiatives can be. One critical aspect of most IZ ordinances is that they offer incentives to local developers in order to help (at least partially) offset the losses incurred from providing housing units at below-market prices or rents. These incentives typically take the form of allowing an increased size, height and/or density of development than what the local zoning code may allow for a particular site. In addition, the incentives may include reduced parking requirements, favorable tax treatment and/or the option to make an in-lieu dollar payment to the municipal government instead of developing the affordable units. II. DEFINING “HOUSING AFFORDABILITY”
IZ may take different forms, but it has a single objective: to improve the overall quantity of affordable housing in a particular locale. As such, it is first worth examining the general level of housing affordability in Philadelphia in order to identify to what extent such a policy solution is—or is not—needed. While there is substantial research literature that examines and measures housing affordability, one consistent and universally agreed-upon factor is that the degree of affordability is typically measured as the percent of household income that is spent on housing. The absolute level of either prices or rents is not an appropriate metric; rather, it is the relative level of prices and rents compared to local incomes. This is because a given jurisdiction may have a high cost of housing
1 Source: Jacobus, Rick. Inclusionary Housing: Creating and Maintaining Equitable Communities. Lincoln Institute
of Land Policy, 2015.
INCLUSIONARY ZONING IN PHILADELPHIA An Economic Analysis of the City’s Proposed “Mixed Income Housing Program”
5
compared to other jurisdictions, but also high enough incomes to offset that expense; e.g. Cambridge, Massachusetts or Santa Monica, California. A second generally agreed-upon factor is that it is important to differentiate localities where there is a genuine housing affordability problem from those where there is a general low income and/or high poverty problem. While there are many areas of the U.S. where households spend a relatively high percentage of their income on housing, this can be driven by two very different conditions:
Case 1: house prices and rents are exceptionally high not only relative to local incomes but also relative to house prices and rents in most other metro areas.
Case 2: house prices and rents are high when compared to local incomes but not when compared to house prices and rents in most other metro areas.
A city characterized by Case 1 would be considered a city with a genuine housing affordability problem. A city characterized by Case 2 would be considered a city that has a general poverty problem. Residents of the city in Case 2 may meet the minimum definitional requirement of housing unaffordability by spending a high percentage of their income on housing, but they also spend a high percentage of their income on other necessities as well, e.g., food, clothing, transportation. In cities with true housing unaffordability problems, residents are forced to spend a disproportionate amount of their incomes on housing, but not on other necessities. Definition of “Housing Unaffordability”: In general, a jurisdiction that is considered to have a housing affordability problem is one where the typical household must consistently spend more than thirty percent of their income on housing, but the allocation of their remaining income to other necessities (food, clothing, transportation) is in line with what households in other jurisdictions spend.2 To examine to what extent Philadelphia may meet this condition, data was gathered on median house prices and median household (family) incomes for both Philadelphia and comparable major U.S. cities. The ratio of the former to the latter is computed as the “Median Multiple Indicator,” and is a metric used by both the World Bank and United Nations to characterize relative housing affordability for countries, regions and cities.3 These institutions then use the following criteria to characterize an area’s housing affordability:4
2 Source: U.S. Census Bureau and U.S. Department of HUD
3 Source: http://siteresources.worldbank.org/INTURBANDEVELOPMENT/Resources/336387-1169578899171/rd-
hs7.htm 4 Note: these categorizations are based upon a general finding in the economic literature that a household cannot
typically spend more than 30% of its income on housing without having to reduce expenditures on other necessities. Hence, a house price-to-income ratio greater than 3.0 implies that housing is relatively unaffordable to the typical household in that market.

INCLUSIONARY ZONING IN PHILADELPHIA An Economic Analysis of the City’s Proposed “Mixed Income Housing Program”
6
Categorizing Housing Affordability
Affordability Rating Median Multiple Ratio=Med. Price/Med. Income
Severely Unaffordable Greater than 5.0
Seriously Unaffordable 4.1 to 5.0
Moderately Unaffordable 3.1 to 4.0
Affordable Less than 3.1
Philadelphia currently has a median family income of $57,300 and a median house price of $137,000, which gives it a Median Multiple Indicator value of 2.4. This means Philadelphia easily meets the definition of an “affordable” city, since it is well below the critical threshold of 3. For context, the following chart shows the value of the Median Multiple Indicator for each city and ranks them in descending order:
Source: US Census, Zillow. Data is as-of 2017 Q1 Only seven cities are ranked as more affordable than Philadelphia and they are all relatively low-income, formerly industrial “Rust Belt” cities. By this metric, Philadelphia is more affordable than 24 of the 32 largest U.S. cities. Even Montgomery County, which is Philadelphia’s suburban
0 1 2 3 4 5 6 7 8 9 10 11
Cleveland
Pittsburgh
Cincinnati
Detroit
St. Louis
Milwaukee
Baltimore
Philadelphia
Minneapolis
Montgomery County
Atlanta
Chicago
San Antonio
Houston
Washington
Orlando
Phoenix
Dallas
Las Vegas
Denver
Boston
Jacksonville
Portland
Sacramento
Seattle
Miami
New York
Urban Honolulu
San Diego
San Jose
Los Angeles
San Francisco
Housing Median Multiple Indicator by City
SEVERELY UNAFFORDABLE
SERIOUSLY UNAFFORDABLE
MODERATELY UNAFFORDABLE
AFFORDABLE

INCLUSIONARY ZONING IN PHILADELPHIA An Economic Analysis of the City’s Proposed “Mixed Income Housing Program”
7
neighbor and the highest-priced county in the region for housing, meets the affordability criteria with an Indicator value of 2.6. At the other extreme, cities which have “severe unaffordability” problems have Indicator values greater than 5, and include the well-known expensive markets of San Francisco, Honolulu and New York City. These are also jurisdictions with extensive IZ programs. A valid criticism of the Median Multiple Indicator is that it is a citywide ratio that only measures the affordability of housing in the middle of both the house price and household income distribution, so that there could still be large numbers of households and/or significant areas of the city for which housing affordability is a real issue. To determine if there is a meaningful percentage of households with housing affordability problems, the next chart shows the percentage of each city’s housing stock that is affordable to a household with the median local income:5
Source: NAHB and Wells Fargo
5 This number was computed by identifying the number of housing units that were either priced (i.e. sold) or
valued (i.e. assessed) at a number that was no more than three times the city’s median income.

INCLUSIONARY ZONING IN PHILADELPHIA An Economic Analysis of the City’s Proposed “Mixed Income Housing Program”
8
The numbers indicate that 72% of Philadelphia’s housing stock—nearly three-fourths—is affordable to the typical local household earning the median income. By this metric, Philadelphia is more affordable than 22 of the largest U.S. cities. Only 10 cities are ranked as more affordable than Philadelphia. Interestingly, Montgomery County is characterized as even more affordable at 76%. Despite having more expensive housing than Philadelphia, Montgomery County has sufficiently higher incomes (and lower poverty) to more than offset its relatively higher house prices. At the other extreme, in the large California cities of San Francisco and Los Angeles, barely more than 10% of housing units there are priced to be affordable to a household making the median local family income. Lastly, these results are combined in the chart below to create an overall Housing Affordability Score for each city by adding together the ranking of each in both of the above metrics. This metric has the advantage of measuring both the general level of unaffordability, as well as how many households are actually affected by that level of unaffordability.
Source: Kevin C. Gillen, Ph.D.
0 5 10 15 20 25 30 35 40 45 50 55 60 65
San Francisco
Los Angeles
San Jose
San Diego
Urban Honolulu
Miami
New York
Seattle
Portland
Sacramento
Jacksonville
Boston
Denver
Dallas
Las Vegas
Orlando
Houston
Phoenix
Chicago
San Antonio
Washington
Atlanta
Philadelphia
Minneapolis
Montgomery County
Baltimore
Detroit
Milwaukee
St. Louis
Pittsburgh
Cincinnati
Cleveland
U.S. Cities Ranked by Overall Housing Affordability
Housing Affordability Score
INCLUSIONARY ZONING IN PHILADELPHIA An Economic Analysis of the City’s Proposed “Mixed Income Housing Program”
9
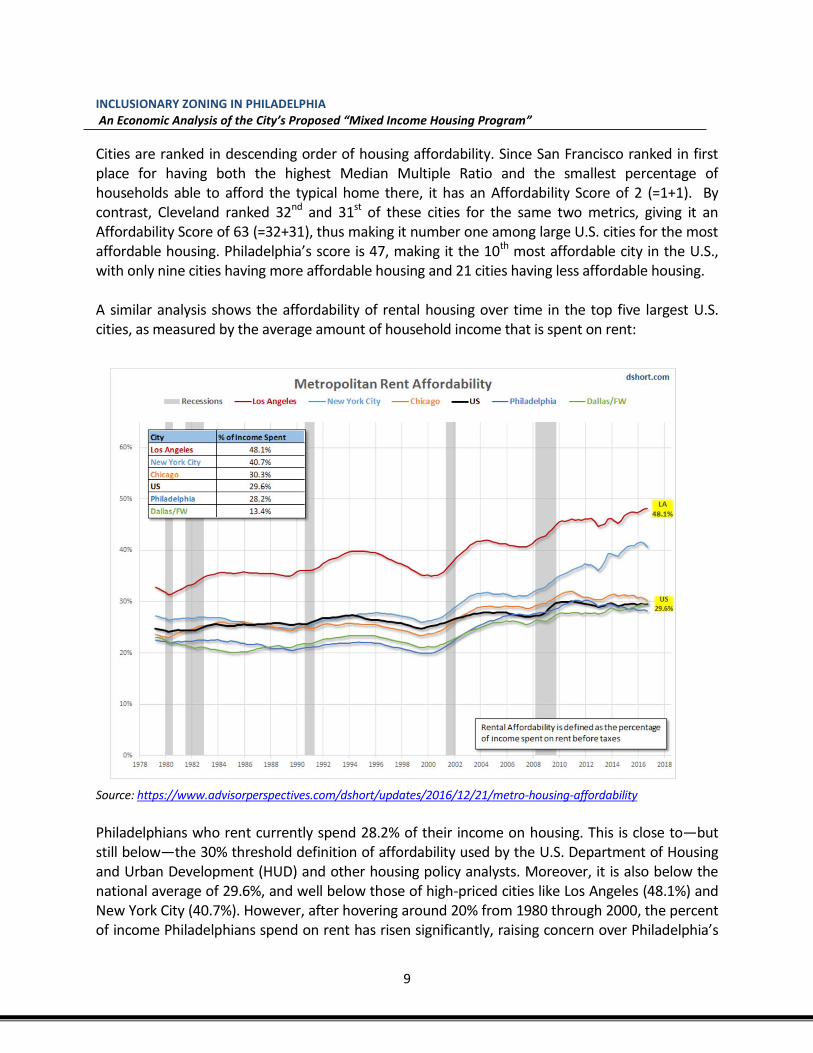
Cities are ranked in descending order of housing affordability. Since San Francisco ranked in first place for having both the highest Median Multiple Ratio and the smallest percentage of households able to afford the typical home there, it has an Affordability Score of 2 (=1+1). By contrast, Cleveland ranked 32nd and 31st of these cities for the same two metrics, giving it an Affordability Score of 63 (=32+31), thus making it number one among large U.S. cities for the most affordable housing. Philadelphia’s score is 47, making it the 10th most affordable city in the U.S., with only nine cities having more affordable housing and 21 cities having less affordable housing. A similar analysis shows the affordability of rental housing over time in the top five largest U.S. cities, as measured by the average amount of household income that is spent on rent:
Source: https://www.advisorperspectives.com/dshort/updates/2016/12/21/metro-housing-affordability
Philadelphians who rent currently spend 28.2% of their income on housing. This is close to—but still below—the 30% threshold definition of affordability used by the U.S. Department of Housing and Urban Development (HUD) and other housing policy analysts. Moreover, it is also below the national average of 29.6%, and well below those of high-priced cities like Los Angeles (48.1%) and New York City (40.7%). However, after hovering around 20% from 1980 through 2000, the percent of income Philadelphians spend on rent has risen significantly, raising concern over Philadelphia’s
INCLUSIONARY ZONING IN PHILADELPHIA An Economic Analysis of the City’s Proposed “Mixed Income Housing Program”
10
housing affordability. But while this trend remains worth watching, Philadelphia’s rental housing stock still meets the definition of “affordable.” In summary, the traditional metrics of housing affordability used by most economists and housing analysts do not indicate that Philadelphia has a housing affordability problem. Its median-priced home is easily affordable to the median-income household and nearly 75% of its housing stock is affordable to that same household. For renter households, only 28.2% of their income is consumed by rent, which is below both the U.S. national average and the 30% threshold to meet the definition of “affordable.” While some pockets of unaffordability may exist, especially in transitioning neighborhoods, there is no empirical evidence that housing affordability is a problem at a citywide scale in Philadelphia. III. EXISTING RESEARCH ON INCLUSIONARY ZONING
While significant research literature on the effects and efficacy of inclusionary zoning exist, much of this literature has limitations that make it difficult to draw lessons for other cities that are considering IZ, including Philadelphia:
1) The studies are funded by industry or activist groups with a vested stake in IZ (whether affordability advocates or homebuilders) and are not published in peer-reviewed journals; and/or
2) The geographic scope of the study is limited to just one city, which is often not comparable to Philadelphia; and/or
3) The studies tend to disproportionately focus on only one impact of IZ rather than the whole spectrum of housing outcomes that could be affected by IZ, e.g. IZ’s effect on house prices, but not new housing starts.
A recently published report by the Urban Land Institute,6 however, provides a national survey of the entire IZ literature, giving particular weight to independent academic studies published in peer-reviewed journals. The report identified a total of 487 local jurisdictions in 28 states with some form of IZ program, although they are not uniformly spread across the country. Municipalities in New Jersey and California alone accounted for nearly two-thirds of all programs. The remaining one-third is disproportionately concentrated in Massachusetts, New York and Rhode Island – states including cities with very high-cost housing, as well as Colorado and North Carolina.
6 Williams, Stockton, et al. “The Economics of Inclusionary Development”, Washington, DC: Urban Land Institute:
2016.

INCLUSIONARY ZONING IN PHILADELPHIA An Economic Analysis of the City’s Proposed “Mixed Income Housing Program”
11
The following table summarizes the impacts IZ has had in jurisdictions with extensive programs that have existed for a sufficiently long enough period of time to have had an effect: Summary of Research Literature on Inclusionary Zoning
Source: Business and Professional People for the Public Interest, Chicago IL.
Although there may be local cases where IZ has encouraged the production of more affordable housing than otherwise would have occurred, the results in the table above indicate that the overall impact of IZ on the housing economy where it has been implemented has generally been, at best, slight, and at worst, inconclusive. In addition, the number of new affordable units that are directly attributable to IZ has been very small, both in absolute and relative terms:
In California, IZ has not promoted any increase in new housing production, but it hasn’t adversely affected it either.
In the Boston area, IZ is associated with a 10% decline in new housing production and a slight increase in house prices in some jurisdictions, decreasing housing affordability overall. In other jurisdictions, it has had no measurable or observable effect.
In California jurisdictions with strict IZ programs, rents declined slightly.
Most significantly, in jurisdictions where the number of new affordable units was measured, the average annual increase in affordable units was only 43 units, which is only a 0.0013% increase in the jurisdiction’s total housing stock.
Even if IZ has only modest adverse impacts on a jurisdiction’s overall housing market, the benefits have been tiny.
Jurisdiction Period
Impacts on overall
housing supply
Impacts on home
prices/rents
Number of affordable
units produced
Number of
affordable units
produced per year
Total Housing
Stock (# Units)
California
(28 programs)
1981-2001 No negative effect
on housing starts
Not available Not available Not available 13,680,081
California
(65 programs)
1988-2005 No decline in single-
family starts
Increase in
multifamily starts
Increased home
price by 2.2 percent
1,883 units 105 13,680,081
California
(125 programs)
2007-2013 Not available Stricter programs
associated with 1.9
percent decline in
rents
Not available Not available 13,680,081
San Francisco
(55 programs)
1987-2004 No impact on
housing starts
No impact on home
prices
218 units 12 805,235
Los Angeles and
Orange counties
(17 programs)
1998-2005 No impact on
housing starts
Not available Not available Not available 9,818,605
Boston area
(99 programs)
1987-2004 Up to a 10 percent
decline in housing
starts
Increased home
prices by 1 percent
200 units 11 617,594
INCLUSIONARY ZONING IN PHILADELPHIA An Economic Analysis of the City’s Proposed “Mixed Income Housing Program”
12
However, housing affordability is a real issue in all of the jurisdictions analyzed in the above table and house prices and rents are significantly higher than in Philadelphia —conditions that may make IZ both necessary and viable. As the analysis in the previous section indicates, Philadelphia’s housing market and affordability are very different than locations which have extensive IZ programs in place. Although the research literature does not provide conclusive results in support of IZ, the authors of the ULI report point out that even in cases where programs have not been as successful as hoped, there are still lessons to be drawn about how IZ could have been made more effective. In general, the ULI study identifies four critical conditions for IZ to be effective in producing more affordable housing without adversely affecting the overall housing market where it is enacted:
1) IZ policies depend upon a significant amount of robust market-rate development already occurring.
2) IZ policies work best in regions where a majority of local municipalities have IZ policies. 3) IZ policies are most successful in assisting moderate-income households rather than low-
income households. 4) IZ policies must be carefully crafted to avoid adverse effects, such as making a substantial
amount of market-rate development unworkable. The next section empirically examines to what extent Philadelphia’s housing market meets—or doesn’t meet—these conditions. IV. PHILADELPHIA’S HOUSING MARKET AND THE NECESSARY CONDITIONS FOR IZ TO BE SUCCESSFUL Condition 1: IZ policies depend upon a significant amount of robust market-rate development already occurring. The ULI report does not specify exactly what constitutes “a significant amount of robust market-rate development”; however, it implies that there must be a meaningful amount of new housing construction occurring, and occurring at a steady pace over time. To examine this condition, data was gathered on current levels of new housing construction for Philadelphia and those jurisdictions with the greatest number of active IZ programs: California, New Jersey, the New York City7 metro area and Massachusetts. Numbers for the U.S. were also collected for context. New housing construction is measured as the number of residential units
7 New York City was chosen instead of New York State as a whole because the overwhelming amount of the state’s
new housing construction, population and IZ programs are in the New York City area.

INCLUSIONARY ZONING IN PHILADELPHIA An Economic Analysis of the City’s Proposed “Mixed Income Housing Program”
13
authorized by building permits issued in 2016, the most recent period for which a full year’s worth of data was available. Since these jurisdictions vary greatly by population, the number of permits was normalized by dividing it by each jurisdiction’s population (in 000s) in 2016. The result is the number of new housing units per 1,000 people currently under construction or recently completed. A larger number implies a relatively more active and robust level of market-rate development.
Source: U.S. Census
Currently, there are four new units of housing being built in New York City for every 1,000 residents. New Jersey is next with three units and California with 2.6 units. Massachusetts meets the current U.S. national average of 2.4 units for every 1,000 residents. In Philadelphia, the average is two units for every 1,000 residents. All jurisdictions with active IZ programs have current rates of housing construction equal to or exceeding—often by a significant margin—the national average. By contrast, Philadelphia is not only below the rate of housing construction in these IZ jurisdictions, it is also below the national average. By this measure, Philadelphia does not have a sufficiently robust level of market-rate construction to make IZ effective or feasible.
4.0
3.0
2.6
2.4 2.4
2.0
0.00
0.50
1.00
1.50
2.00
2.50
3.00
3.50
4.00
4.50
New York New Jersey California U.S. Massachusetts Philadelphia
Current Number of Residential Construction Units Per 1,000 Residents

INCLUSIONARY ZONING IN PHILADELPHIA An Economic Analysis of the City’s Proposed “Mixed Income Housing Program”
14
Condition 2: IZ policies work best in regions where a majority of local municipalities have IZ policies. The ULI study recognizes that mandatory IZ programs are more effective at a regional or state level for the simple reason that it is more difficult to evade compliance by simply relocating new housing development to a neighboring municipality that does not have IZ requirements in place. The following table shows the number of individual municipalities with IZ programs in those states that have the largest concentration of such programs:
Sources: See footnote 8 below
8
8 https://en.wikipedia.org/wiki/Massachusetts_Comprehensive_Permit_Act:_Chapter_40B
http://www.state.nj.us/dca/affiliates/coah/regulations/fha.pdf http://www.calruralhousing.org/publications/265-affordable-by-choice-trends-in-california-inclusionary-housing-programs http://www.pattern-for-progress.org/wp-content/uploads/2015/04/Urban-Pioneering-in-the-Hudson-Valley-FINAL-1.pdf http://www.lihp.org/inclusionary.html https://www1.nyc.gov/site/planning/plans/mih/mandatory-inclusionary-housing.page http://crossroads.newsworks.org/index.php/local/keystone-crossroads/91987-ideas-worth-stealing-inclusionary-zoning-to-grow-affordable-housing-
565
351
170
20 12
0
100
200
300
400
500
600
New Jersey Massachusetts California New York Pennsylvania
Number of Municipalities with Inclusionary Zoning Programs, by State
INCLUSIONARY ZONING IN PHILADELPHIA An Economic Analysis of the City’s Proposed “Mixed Income Housing Program”
15
New Jersey and Massachusetts, where IZ is enforced at the state level,9 have the most cities or towns with mandatory IZ. California has 170 municipalities with IZ programs, most of which were enacted by local jurisdictions. New York has 20 municipalities with IZ, which are concentrated in the high-priced cities and towns of New York City and its adjacent suburbs in the Hudson Valley and on Long Island. Although the number of jurisdictions in New York with IZ may seem comparatively low, the percent of the state’s population affected by such programs is nearly 60%. Pennsylvania has only 12 municipalities with IZ; however, this number is actually high compared to other states with IZ programs for two reasons. First, the two largest cities in Pennsylvania–Philadelphia and Pittsburgh – do not have active IZ programs, unlike the other states. The jurisdictions in Pennsylvania with IZ programs, by contrast, are all small-to-mid-sized cities. So while the number of cities and towns with IZ in New York State and Pennsylvania may both seem relatively low compared to other states, the number of actual housing units affected is very large in New York State and very small in Pennsylvania. Secondly, every IZ program currently in existence in Pennsylvania is voluntary; they are incentive-based programs that a homebuilder may or may not use depending on its feasibility for any given project. But, the IZ program currently under consideration in Philadelphia would be mandatory. As such, compliance with it could be easily evaded by simply relocating any future homebuilding activity to outside of the city. Philadelphia does not have a significant number of nearby municipalities with effective IZ programs. Not only is this number relatively small, the voluntary nature of these programs makes the implementation and enforcement of a mandatory IZ in Philadelphia less workable when investment in future housing can be shifted to nearby suburbs. Condition 3: IZ policies are most successful in assisting moderate-income households rather than low-income households. The research shows that in jurisdictions where IZ has resulted in an increased number of affordable units, the majority of units were rented or sold to moderate-income (as opposed to low-income) households. The loss developers must incur for providing a below-market rent or price to a moderate-income household is much less than for a low-income household. Hence, insofar as IZ programs may force a developer to provide affordable units, he or she is incentivized to minimize that loss by seeking to rent or sell to moderate-income households. In areas with very high numbers or percentages of low-income households and insufficient numbers of moderate-income households to help developers meet their obligatory affordability quota, IZ programs are less beneficial. If developers are forced to disproportionately sell or rent to
9 In Massachusetts, IZ is a result of state law. In New Jersey, IZ is a result of a ruling by the New Jersey Supreme
Court as well as subsequent acts by the state legislature.
INCLUSIONARY ZONING IN PHILADELPHIA An Economic Analysis of the City’s Proposed “Mixed Income Housing Program”
16
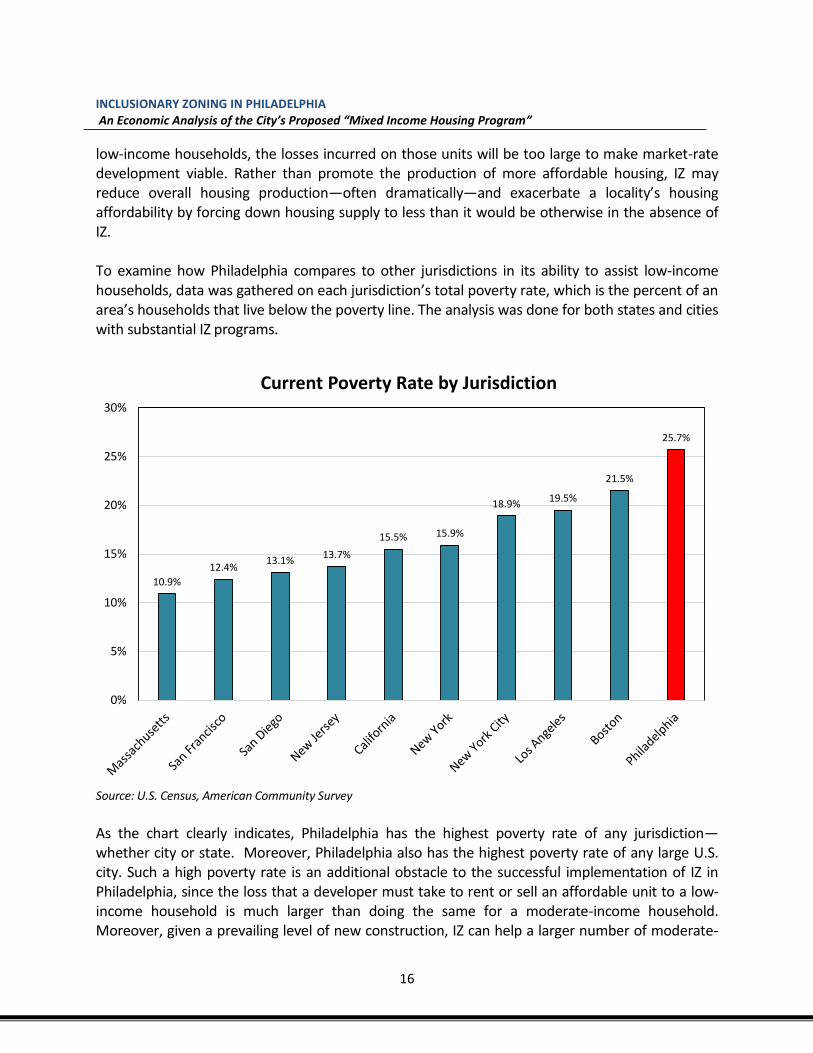
low-income households, the losses incurred on those units will be too large to make market-rate development viable. Rather than promote the production of more affordable housing, IZ may reduce overall housing production—often dramatically—and exacerbate a locality’s housing affordability by forcing down housing supply to less than it would be otherwise in the absence of IZ. To examine how Philadelphia compares to other jurisdictions in its ability to assist low-income households, data was gathered on each jurisdiction’s total poverty rate, which is the percent of an area’s households that live below the poverty line. The analysis was done for both states and cities with substantial IZ programs.
Source: U.S. Census, American Community Survey
As the chart clearly indicates, Philadelphia has the highest poverty rate of any jurisdiction—whether city or state. Moreover, Philadelphia also has the highest poverty rate of any large U.S. city. Such a high poverty rate is an additional obstacle to the successful implementation of IZ in Philadelphia, since the loss that a developer must take to rent or sell an affordable unit to a low-income household is much larger than doing the same for a moderate-income household. Moreover, given a prevailing level of new construction, IZ can help a larger number of moderate-
10.9%
12.4%13.1%
13.7%
15.5% 15.9%
18.9%19.5%
21.5%
25.7%
0%
5%
10%
15%
20%
25%
30%
Current Poverty Rate by Jurisdiction
INCLUSIONARY ZONING IN PHILADELPHIA An Economic Analysis of the City’s Proposed “Mixed Income Housing Program”
17
income households than low-income households because moderate-income household can afford a relatively higher rent or price. So, in essence, IZ programs are more cost-effective in jurisdictions with a relatively lower poverty rate and relatively higher amount of moderate-income households. Philadelphia’s very high poverty rate, especially when compared to cities with IZ, would seem to inhibit how successful it could be if implemented here. Condition 4. IZ policies must be carefully crafted to avoid adverse effects, such as making a substantial amount of market-rate development unworkable. To test the efficacy of the currently proposed IZ legislation in Philadelphia, the affordability requirement was applied to both hypothetical and actual residential development projects in the city. The analysis is first conducted on the developments in the absence of the IZ requirements and then with the proposed mandate added to determine how the outcome would change. To do this, a pro forma cash flow model that is representative of a typical residential development project in Philadelphia was developed by the author of this report. This model is run for the baseline scenario where 100% of all units are developed and sold or rented at market rates. The model is then modified and re-run to comply with the IZ mandate requiring 10% of all units to be sold or rented at an affordable rate. The results are then compared and the after-tax profit and ROI for both scenarios are presented to determine whether or not the project remains profitable once the IZ requirement is in place. A hypothetical development project is used to demonstrate the model’s structure, composed of 10 new townhomes in a neighborhood that is adjacent to, but not in Center City, e.g., Northern Liberties, Brewerytown or Point Breeze. The units will be allowed a maximum height of 45 feet, in order to take advantage of the density bonus offered by the IZ legislation. The units will have above average, but not luxury, finishes and amenities. The developer will take one year to build the units and sell them all immediately upon completion. According to various public sources10 and conversations with local developers and realtors, a typical all-in total construction cost for each unit would be $325,000 and the final sales price would be $410,000. In addition, upon the sale of the units, the developer must pay the city’s transfer tax rate of 2.05%, a sales commission of 6.0% and closing costs equal to 1% of total sales revenue.11 A discount rate of 5% is assumed to compute the present value of any future cash flows.
10
. These are typical construction costs and sales prices for such dwellings in these locations in Philadelphia. Sources: R.S. Means, McGraw-Hill Construction, www.Building-cost.net, Philadelphia Recorder of Deeds, Philadelphia Office of Property Assessment. 11
Source: Philadelphia Department of Revenue

INCLUSIONARY ZONING IN PHILADELPHIA An Economic Analysis of the City’s Proposed “Mixed Income Housing Program”
18
In the absence of any IZ requirements, the following table shows what the development’s cash flow would be in the form of a simple pro forma income statement:
Pro Forma Cash Flow for 100% Market-Rate 10-unit Hypothetical Townhome Development Source: Computed by Kevin C. Gillen, Ph.D.
The developer spends a total of $3.25million (=$325,000 x 10 units) to build the units and sells them for a total of $4.1million (=$410,000 x 10 units). Upon completion of sale, he/she pays $246,000 in commission to the sales team, $84,050 in transfer taxes to the city and $41,000 in closing costs. The net sales revenue is just over $3.7million. However, before deducting the cost of developing these units from this amount, the number must first be discounted, since the revenue is received one year after development begins and the units are completed and sold. Discounting $3.7million by 5% over one year yields a present value of future revenue of just over $3.5million. Once the total development costs of $3.25million are deducted, the developer receives a final net profit of just over $301,000. Given the development costs, the project has a cash-on-cash return of $1.09: for every $1 spent on the project, it yielded $1.09 in net revenue. The ROI is 9.27%, which would be considered a realistic and respectable return for such a real estate project in Philadelphia in today’s current market environment.12 These numbers are re-run after applying the affordability requirement mandated by the proposed IZ legislation, which requires one affordable unit for every nine units of market-rate housing. Since this hypothetical project has 10 units total, one of them must be sold at an “affordable” price.
12
Historically, bonds have yielded annual returns of 2-3% while stocks have yielded annual returns of 7-8%. Since real estate is not only riskier than stocks and bonds, but also more time-consuming to engage in, it must offer greater returns than stocks or bonds to make it both feasible and able to attract the necessary capital from investors to finance it.
Baseline Scenario
Gross Sales Revenue $4,100,000
-Sales Commission $246,000
-Transfer Tax $84,050
-Closing Costs $41,000
=Net Sales Revenue $3,728,950
PV of Net Sales Revenue $3,551,381
-Total Development Cost $3,250,000
=Net Profit $301,381
Cash-on-Cash Return $1.09
ROI 9.27%

INCLUSIONARY ZONING IN PHILADELPHIA An Economic Analysis of the City’s Proposed “Mixed Income Housing Program”
19
The proposed IZ legislation in Philadelphia defines a unit’s “affordable” price (or rent) using the same guidelines and income limits set by the U.S. Department of Housing and Urban Development (HUD). Not only is this standard industry practice, it is also supported and used by Philadelphia’s Office of Housing and Community Development (OHCD). Specifically, the legislation states that:
1) An “affordable” sales or rental price must not exceed 30% of an eligible household’s income; and
2) Downtown for-sale units must be affordable to households earning up to 80% of area median income, while neighborhood for-sale units must be affordable to households earning up to 50% of area median income; and
3) In the case of rental units, the income limits are 50% and 30% for downtown and neighborhood locations, respectively.
Currently, HUD reports that the area median income for Philadelphia is $83,200.13 Since our hypothetical example is a for-sale project in a neighborhood (i.e. non-downtown) location, the 50% income limit applies. Therefore, the required affordable unit must be sold to a household earning no more than $41,600 (=$83,200 x 0.5). Since the legislation specifies that the sales price of the unit cannot consume more than 30% of their annual income, the buyer’s annual mortgage payment cannot exceed $12,480 (=$41,600 x 0.3), or $1,040 per month. Assuming a 20% down payment, a 4% fixed-rate mortgage and a 30-year term, the household’s total mortgage amount is $217,840.14 With a 20% down payment, this amount represents 80% of the unit’s sales price. The unit’s maximum “affordable” price, then, is $272,300 (=$217,840/0.8), which is substantially less than the price of the market-rate units at $410,000. If the developer sells nine units for $410,000 and one unit for $272,300, the cash flow now looks like this:
13
Source: https://www.huduser.gov/portal/datasets/il/il2017/2017summary.odn 14
Computed using a mortgage calculator.

INCLUSIONARY ZONING IN PHILADELPHIA An Economic Analysis of the City’s Proposed “Mixed Income Housing Program”
20
Pro Forma Cash Flow for 10-unit Hypothetical Townhome Development with 9 Market-Rate Units and 1 Affordable Unit
Source: Computed by Kevin C. Gillen, Ph.D.
Under the IZ scenario, the project’s net profit has dropped from over $301,000 to $185,106. Its cash-on-cash return declined from $1.09 to $1.06 and its ROI from approximately 9.27% to 5.6%. While these declines may be significant, the project is still technically profitable. However, this project is hypothetical, with two notable factors to consider:
1) This is a “best case” scenario in which the affordable price was computed using a buyer making the maximum allowable income and paying the maximum allowable price under the IZ’s affordability guidelines. Many buyers (and renters) will be poorer than this and/or will not be able to spend the full 30% of their income on housing.
Affordability Scenario
Market-Rate Units
Gross Sales Revenue $3,690,000
-Sales Commission $221,400
-Transfer Tax $75,645
-Closing Costs $36,900
=Net Sales Revenue $3,356,055
PV of Net Sales Revenue $3,196,243
Affordable Units
Gross Sales Revenue $272,300
-Sales Commission $16,338
-Transfer Tax $5,582
-Closing Costs $2,723
=Net Sales Revenue $247,656
PV of Net Sales Revenue $235,863
Total
PV of Total Net Sales Rev. $3,432,106
-Total Development Cost $3,250,000
=Net Profit $182,106
Cash-on-Cash Return $1.06
ROI 5.6%

INCLUSIONARY ZONING IN PHILADELPHIA An Economic Analysis of the City’s Proposed “Mixed Income Housing Program”
21
2) Since real estate development is a relatively time-consuming and risky type of investment,
it must offer higher returns than other competing assets in order to make the project both worthwhile to the developer to undertake and to attract the necessary financial capital to make it possible.15 Historically, the stock market offers annual returns in the range of 7-8%.16 Most real estate projects must offer a return greater than this to make them viable. Otherwise, it would be both easier and less risky for the developer and investors to simply invest in a broad-based index fund of stocks. Under the IZ mandate, this project would not meet that threshold and would thus be rendered non-viable.
The pro forma cash flow model is now applied to four actual real estate development projects that were recently completed in Philadelphia. They were chosen to represent the four types of projects enumerated in the IZ legislation:17
1) Downtown rental: The Avenir 2) Downtown for-sale: Symphony House 3) Neighborhood rental: 31 Brewerytown 4) Neighborhood for-sale: 1300 South Chadwick
The developer of each project generously provided detailed information on the development costs, sales or rent revenue, and operating expenses. These numbers were entered into the same model used for the hypothetical project and the appropriate city tax rates applied to the cash flows. The final net profit, cash-on-cash return and ROI were then computed. The key findings of each case study analysis are presented in the body of this report. All inputs and calculations can be found in the appendix.
15
Almost all real estate development projects of more than a few units are done with a significant percent of borrowed money. 16
Source: http://pages.stern.nyu.edu/~adamodar/New_Home_Page/datafile/histretSP.html 17
The hypothetical example used a for-sale project. Rental projects were analyzed by assuming the developer rented out and managed the finished property for ten years, then sold it at the end of year ten.
INCLUSIONARY ZONING IN PHILADELPHIA An Economic Analysis of the City’s Proposed “Mixed Income Housing Program”
22
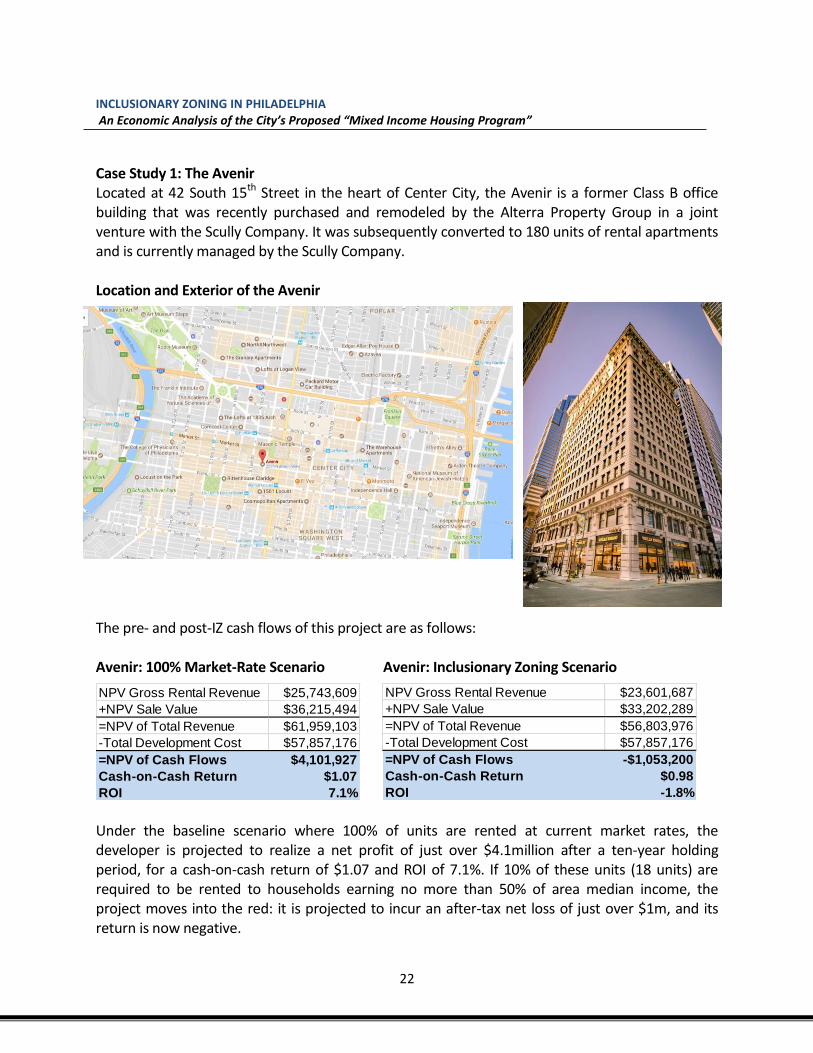
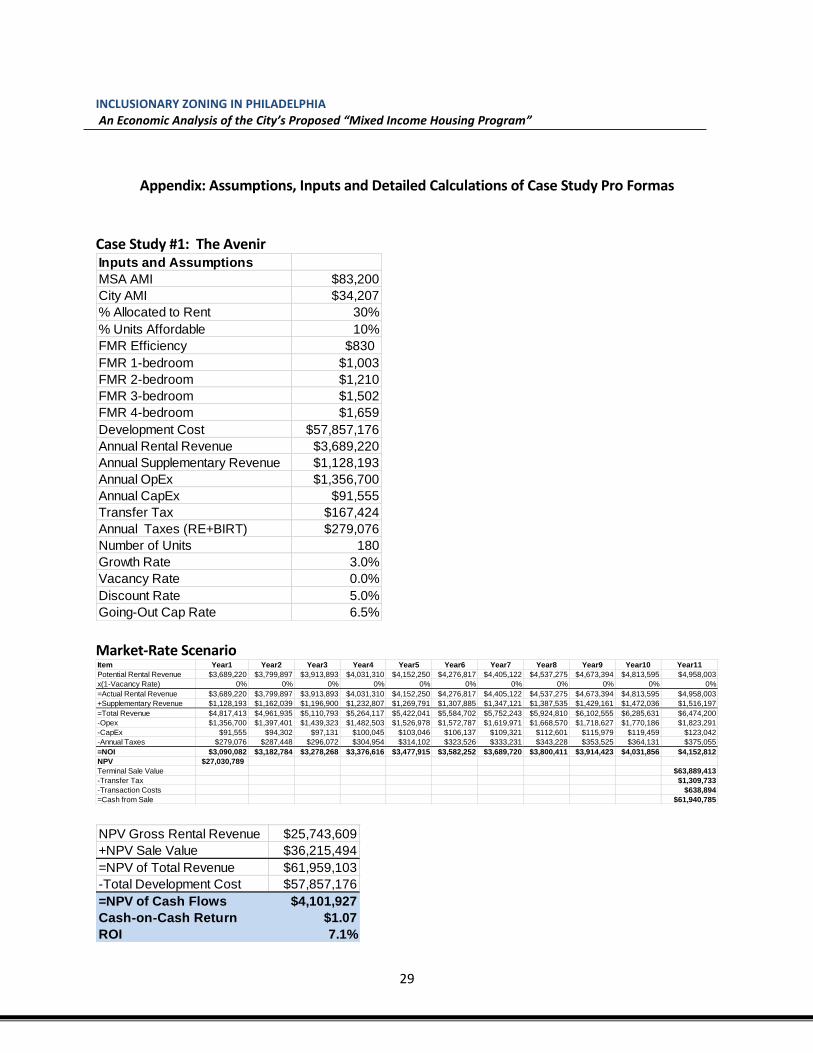
Case Study 1: The Avenir Located at 42 South 15th Street in the heart of Center City, the Avenir is a former Class B office building that was recently purchased and remodeled by the Alterra Property Group in a joint venture with the Scully Company. It was subsequently converted to 180 units of rental apartments and is currently managed by the Scully Company. Location and Exterior of the Avenir
The pre- and post-IZ cash flows of this project are as follows: Avenir: 100% Market-Rate Scenario Avenir: Inclusionary Zoning Scenario
Under the baseline scenario where 100% of units are rented at current market rates, the developer is projected to realize a net profit of just over $4.1million after a ten-year holding period, for a cash-on-cash return of $1.07 and ROI of 7.1%. If 10% of these units (18 units) are required to be rented to households earning no more than 50% of area median income, the project moves into the red: it is projected to incur an after-tax net loss of just over $1m, and its return is now negative.
NPV Gross Rental Revenue $25,743,609
+NPV Sale Value $36,215,494
=NPV of Total Revenue $61,959,103
-Total Development Cost $57,857,176
=NPV of Cash Flows $4,101,927
Cash-on-Cash Return $1.07
ROI 7.1%
NPV Gross Rental Revenue $23,601,687
+NPV Sale Value $33,202,289
=NPV of Total Revenue $56,803,976
-Total Development Cost $57,857,176
=NPV of Cash Flows -$1,053,200
Cash-on-Cash Return $0.98
ROI -1.8%
INCLUSIONARY ZONING IN PHILADELPHIA An Economic Analysis of the City’s Proposed “Mixed Income Housing Program”
23
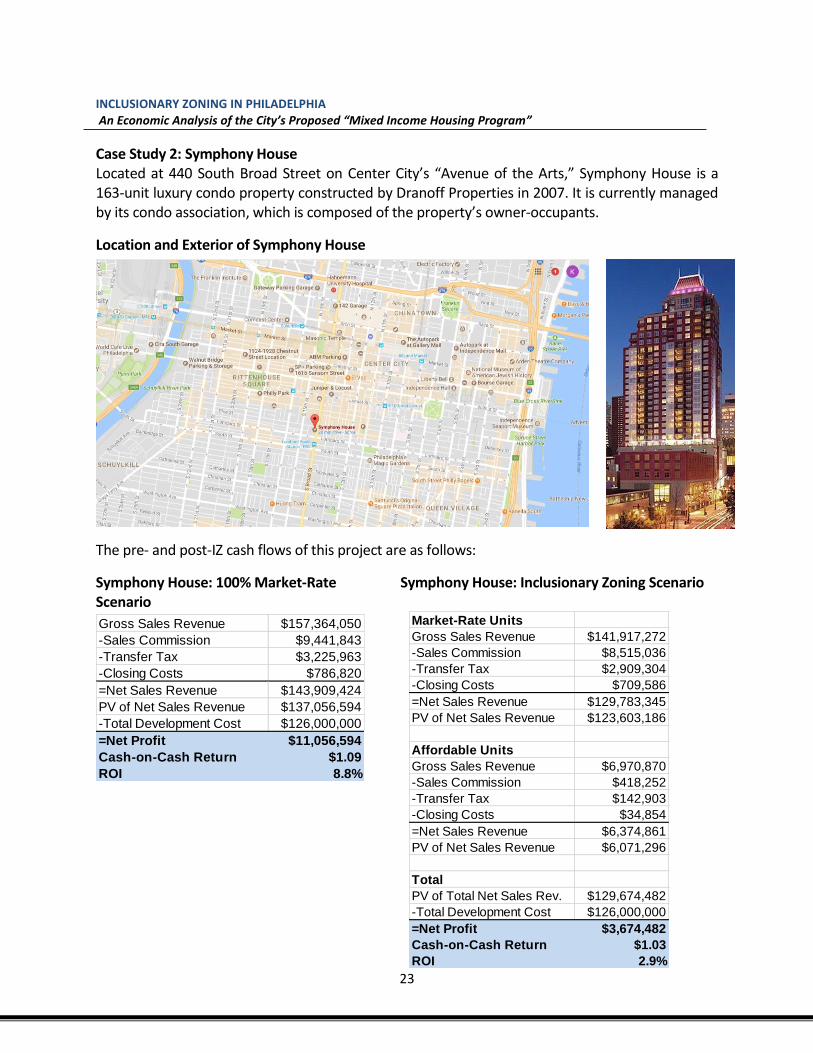
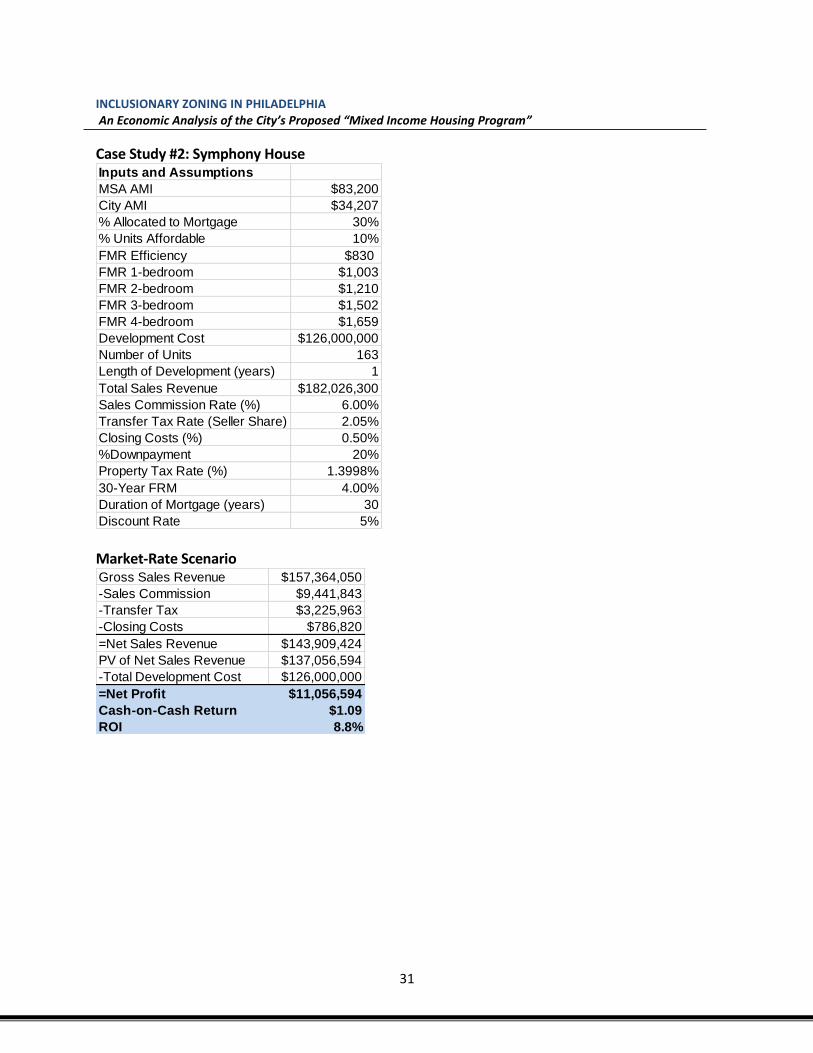
Case Study 2: Symphony House Located at 440 South Broad Street on Center City’s “Avenue of the Arts,” Symphony House is a 163-unit luxury condo property constructed by Dranoff Properties in 2007. It is currently managed by its condo association, which is composed of the property’s owner-occupants.
Location and Exterior of Symphony House
The pre- and post-IZ cash flows of this project are as follows:
Symphony House: 100% Market-Rate Symphony House: Inclusionary Zoning Scenario Scenario
Gross Sales Revenue $157,364,050
-Sales Commission $9,441,843
-Transfer Tax $3,225,963
-Closing Costs $786,820
=Net Sales Revenue $143,909,424
PV of Net Sales Revenue $137,056,594
-Total Development Cost $126,000,000
=Net Profit $11,056,594
Cash-on-Cash Return $1.09
ROI 8.8%
Market-Rate Units
Gross Sales Revenue $141,917,272
-Sales Commission $8,515,036
-Transfer Tax $2,909,304
-Closing Costs $709,586
=Net Sales Revenue $129,783,345
PV of Net Sales Revenue $123,603,186
Affordable Units
Gross Sales Revenue $6,970,870
-Sales Commission $418,252
-Transfer Tax $142,903
-Closing Costs $34,854
=Net Sales Revenue $6,374,861
PV of Net Sales Revenue $6,071,296
Total
PV of Total Net Sales Rev. $129,674,482
-Total Development Cost $126,000,000
=Net Profit $3,674,482
Cash-on-Cash Return $1.03
ROI 2.9%
INCLUSIONARY ZONING IN PHILADELPHIA An Economic Analysis of the City’s Proposed “Mixed Income Housing Program”
24
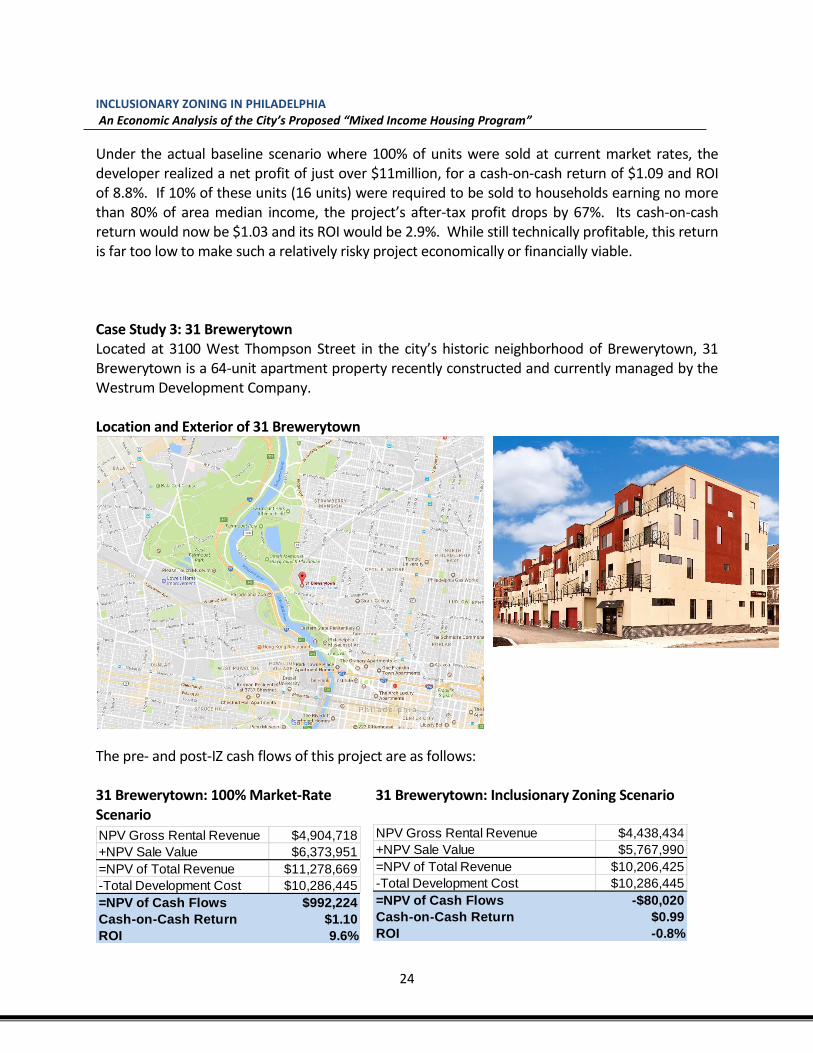
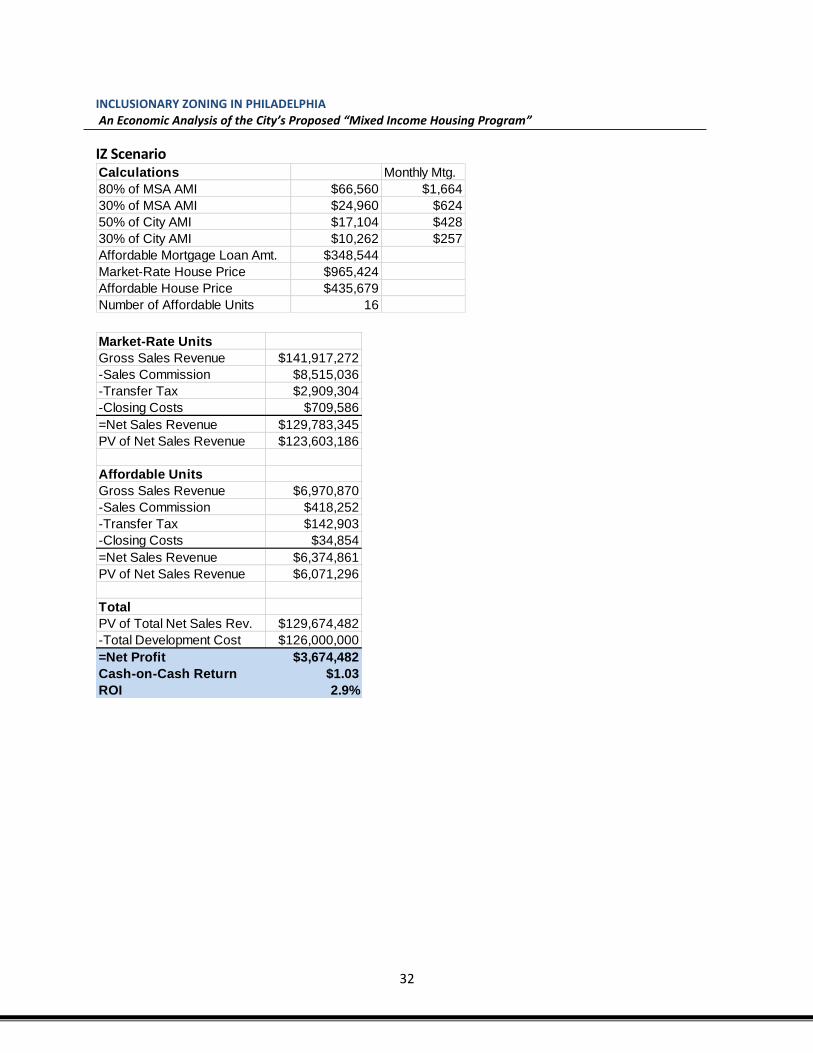
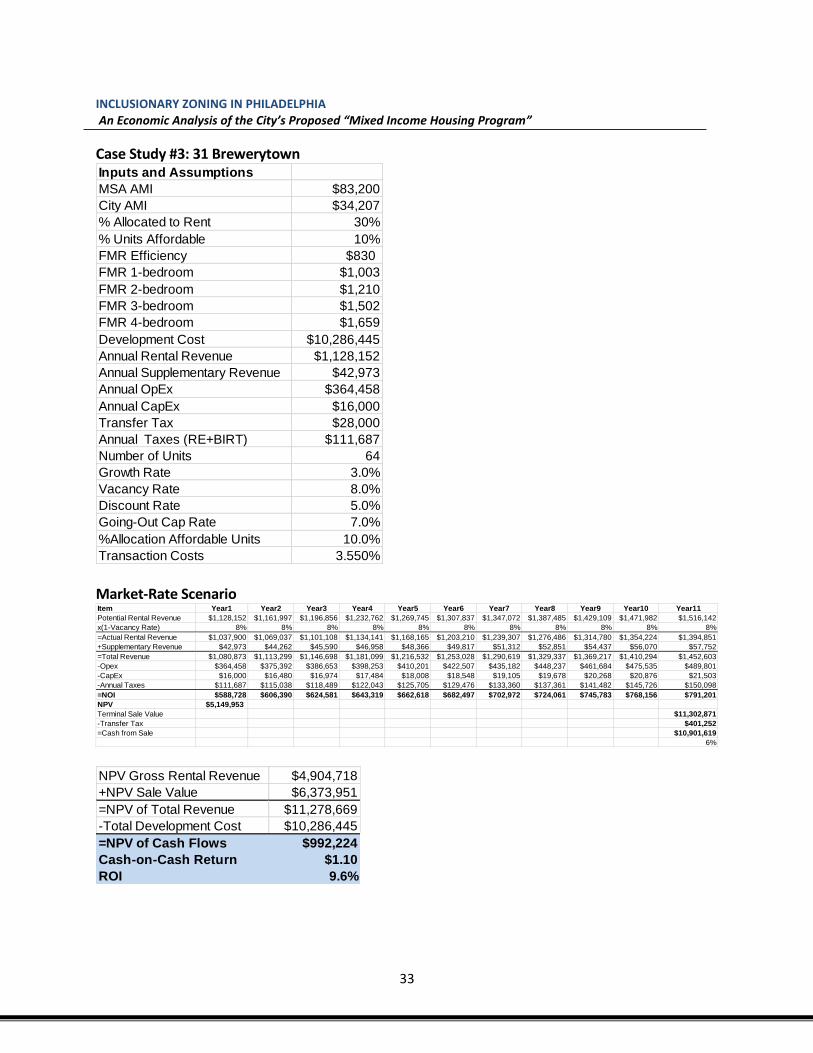
Under the actual baseline scenario where 100% of units were sold at current market rates, the developer realized a net profit of just over $11million, for a cash-on-cash return of $1.09 and ROI of 8.8%. If 10% of these units (16 units) were required to be sold to households earning no more than 80% of area median income, the project’s after-tax profit drops by 67%. Its cash-on-cash return would now be $1.03 and its ROI would be 2.9%. While still technically profitable, this return is far too low to make such a relatively risky project economically or financially viable. Case Study 3: 31 Brewerytown Located at 3100 West Thompson Street in the city’s historic neighborhood of Brewerytown, 31 Brewerytown is a 64-unit apartment property recently constructed and currently managed by the Westrum Development Company. Location and Exterior of 31 Brewerytown
The pre- and post-IZ cash flows of this project are as follows: 31 Brewerytown: 100% Market-Rate 31 Brewerytown: Inclusionary Zoning Scenario Scenario
NPV Gross Rental Revenue $4,438,434
+NPV Sale Value $5,767,990
=NPV of Total Revenue $10,206,425
-Total Development Cost $10,286,445
=NPV of Cash Flows -$80,020
Cash-on-Cash Return $0.99
ROI -0.8%
NPV Gross Rental Revenue $4,904,718
+NPV Sale Value $6,373,951
=NPV of Total Revenue $11,278,669
-Total Development Cost $10,286,445
=NPV of Cash Flows $992,224
Cash-on-Cash Return $1.10
ROI 9.6%

INCLUSIONARY ZONING IN PHILADELPHIA An Economic Analysis of the City’s Proposed “Mixed Income Housing Program”
25
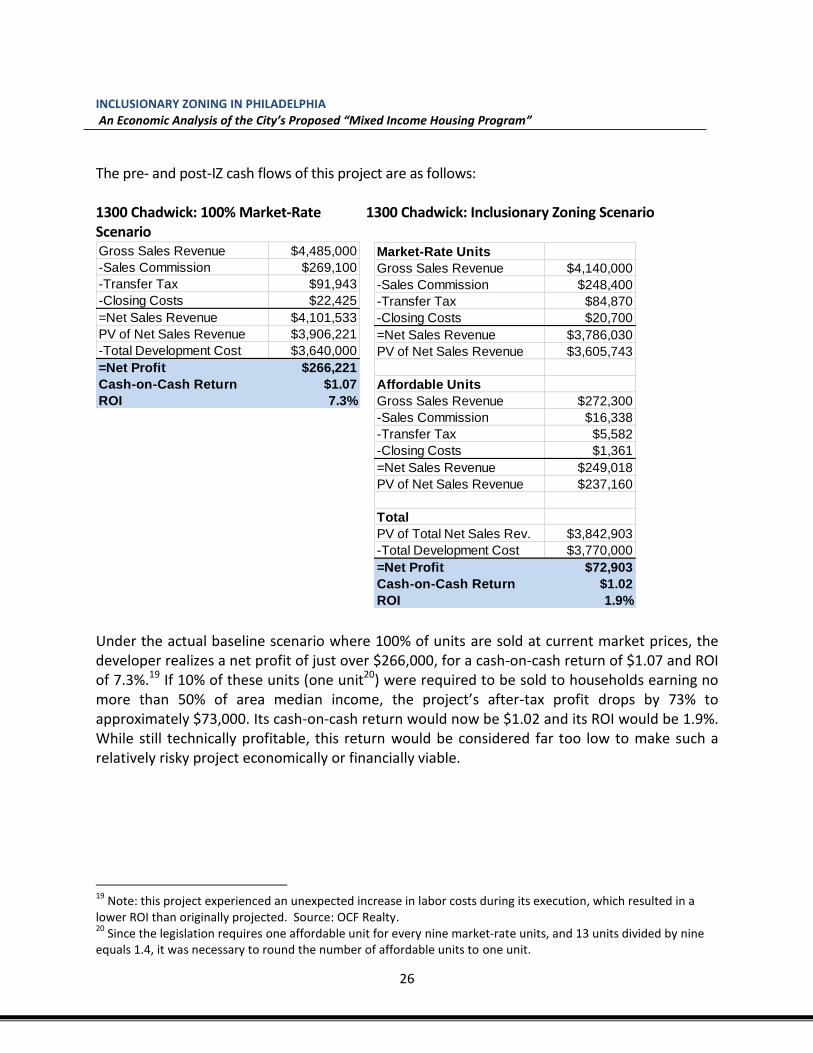
Under the actual baseline scenario where 100% of units are rented at current market rates, the developer realizes a net profit of just under $1million, for a cash-on-cash return of $1.10 and ROI of 9.6%. If 10% of these units (seven units18) were required to be rented to households earning no more than 30% of area median income, the project’s after-tax profit plunges into negative territory. The developer would take a net loss of just over $80,000 and its ROI would be -0.8%. With these parameters, the IZ mandate would clearly render this project impossible to undertake. The reason the effect of the IZ mandate on this project is so adverse is because the rent levels for this project are relatively high for its neighborhood, but the IZ income limit imposed by this legislation for neighborhood rental properties (30% of area median income) is exceptionally stringent. So, the downward adjustment from market-rate rents to affordable rents is especially large, thus causing a dramatic drop in the project’s profitability. Case Study 4: 1300 South Chadwick Located on the 1300 block of South Chadwick Street in the city’s Point Breeze neighborhood, the project is composed of 13 recently constructed townhomes that were developed and sold by OCF Realty. Location and Exterior of 1300 Chadwick
18
Since the legislation requires one affordable unit for every nine market-rate units, and 64 units divided by nine equals 7.1, it was necessary to round the number of affordable units to seven units.
INCLUSIONARY ZONING IN PHILADELPHIA An Economic Analysis of the City’s Proposed “Mixed Income Housing Program”
26
The pre- and post-IZ cash flows of this project are as follows: 1300 Chadwick: 100% Market-Rate 1300 Chadwick: Inclusionary Zoning Scenario Scenario
Under the actual baseline scenario where 100% of units are sold at current market prices, the developer realizes a net profit of just over $266,000, for a cash-on-cash return of $1.07 and ROI of 7.3%.19 If 10% of these units (one unit20) were required to be sold to households earning no more than 50% of area median income, the project’s after-tax profit drops by 73% to approximately $73,000. Its cash-on-cash return would now be $1.02 and its ROI would be 1.9%. While still technically profitable, this return would be considered far too low to make such a relatively risky project economically or financially viable.
19
Note: this project experienced an unexpected increase in labor costs during its execution, which resulted in a lower ROI than originally projected. Source: OCF Realty. 20
Since the legislation requires one affordable unit for every nine market-rate units, and 13 units divided by nine equals 1.4, it was necessary to round the number of affordable units to one unit.
Gross Sales Revenue $4,485,000
-Sales Commission $269,100
-Transfer Tax $91,943
-Closing Costs $22,425
=Net Sales Revenue $4,101,533
PV of Net Sales Revenue $3,906,221
-Total Development Cost $3,640,000
=Net Profit $266,221
Cash-on-Cash Return $1.07
ROI 7.3%
Market-Rate Units
Gross Sales Revenue $4,140,000
-Sales Commission $248,400
-Transfer Tax $84,870
-Closing Costs $20,700
=Net Sales Revenue $3,786,030
PV of Net Sales Revenue $3,605,743
Affordable Units
Gross Sales Revenue $272,300
-Sales Commission $16,338
-Transfer Tax $5,582
-Closing Costs $1,361
=Net Sales Revenue $249,018
PV of Net Sales Revenue $237,160
Total
PV of Total Net Sales Rev. $3,842,903
-Total Development Cost $3,770,000
=Net Profit $72,903
Cash-on-Cash Return $1.02
ROI 1.9%

INCLUSIONARY ZONING IN PHILADELPHIA An Economic Analysis of the City’s Proposed “Mixed Income Housing Program”
27
To summarize these results, the following chart shows the calculated ROI of each project under both the baseline and IZ scenarios:
A simple but credible pro forma cash flow model was developed and applied to four actual residential development projects in Philadelphia. These projects are representative of the four types of development projects for which there are four different income limits.21 In all four cases, the ROI of each project was driven to either below zero or the low single-digits, effectively rendering each project infeasible. This model used the “best case” scenario for IZ. The rent or price of the affordable units was computed by assuming that the household renting or buying those units made the maximum allowable income and spent the maximum allowable percentage of that income required under the proposed IZ bill. Many households that will be seeking to occupy these affordable units will be earning a lesser income and/or allocating a smaller percentage of their income to housing than the maximum allowed by law. This would certainly drive down profit margins and investment returns on the development of these units even further.
21
The four types of projects and their respective income limits (expressed as a % of area median income) are: downtown-rental (50%), downtown for-sale (80%), neighborhood-rental (30%) and neighborhood for-sale (50%).
7.1%
8.8%
9.6%
7.3%
-1.8%
2.9%
-0.8%
1.9%
-4%
-2%
0%
2%
4%
6%
8%
10%
12%
The Avenir Symphony House 31 Brewerytown 1300 Chadwick
ROI by Project: Market-Rate v. with IZ
Market-Rate
With IZ

INCLUSIONARY ZONING IN PHILADELPHIA An Economic Analysis of the City’s Proposed “Mixed Income Housing Program”
28
SUMMARY AND CONCLUSIONS:
This report analyzed the existing research literature on how similar IZ programs and mandates in other U.S. jurisdictions have fared and examined the implications of these findings for how the proposed IZ mandate would affect future housing outcomes in Philadelphia. In general, the research and data strongly suggest four results:
1) Philadelphia does not have a housing affordability problem, whereas comparable large cities with IZ programs do have serious housing affordability problems, as defined by the federal government’s housing affordability guidelines.
2) There is no single example of a jurisdiction where IZ has produced significant amounts of new affordable housing or has had absolutely no adverse effect on other housing outcomes. At best, its results have been mixed to very modest.
3) Philadelphia does not meet any of the necessary conditions for IZ to be successfully implemented, as outlined by the Urban Land Institute’s survey of IZ programs.
4) An examination of four representative case studies of recently completed large-scale residential development projects in Philadelphia found that the average profit margin declined by 88%, thus making each project impractical, even under very generous assumptions.
These results indicate that not only is housing affordability not a general or citywide issue in Philadelphia, but that the implementation of the IZ bill in its current form would likely have serious adverse effects on the quantity and affordability of Philadelphia’s housing stock. A more constructive approach to increasing the quality and quantity of affordable housing is likely to be found in a public-private partnership that seeks to lower the cost of constructing new housing and increasing the ROI for improving and rehabilitating Philadelphia’s existing housing.
INCLUSIONARY ZONING IN PHILADELPHIA An Economic Analysis of the City’s Proposed “Mixed Income Housing Program”
29
Appendix: Assumptions, Inputs and Detailed Calculations of Case Study Pro Formas
Case Study #1: The Avenir
Market-Rate Scenario
Inputs and Assumptions
MSA AMI $83,200
City AMI $34,207
% Allocated to Rent 30%
% Units Affordable 10%
FMR Efficiency $830
FMR 1-bedroom $1,003
FMR 2-bedroom $1,210
FMR 3-bedroom $1,502
FMR 4-bedroom $1,659
Development Cost $57,857,176
Annual Rental Revenue $3,689,220
Annual Supplementary Revenue $1,128,193
Annual OpEx $1,356,700
Annual CapEx $91,555
Transfer Tax $167,424
Annual Taxes (RE+BIRT) $279,076
Number of Units 180
Growth Rate 3.0%
Vacancy Rate 0.0%
Discount Rate 5.0%
Going-Out Cap Rate 6.5%
Item Year1 Year2 Year3 Year4 Year5 Year6 Year7 Year8 Year9 Year10 Year11
Potential Rental Revenue $3,689,220 $3,799,897 $3,913,893 $4,031,310 $4,152,250 $4,276,817 $4,405,122 $4,537,275 $4,673,394 $4,813,595 $4,958,003
x(1-Vacancy Rate) 0% 0% 0% 0% 0% 0% 0% 0% 0% 0% 0%
=Actual Rental Revenue $3,689,220 $3,799,897 $3,913,893 $4,031,310 $4,152,250 $4,276,817 $4,405,122 $4,537,275 $4,673,394 $4,813,595 $4,958,003
+Supplementary Revenue $1,128,193 $1,162,039 $1,196,900 $1,232,807 $1,269,791 $1,307,885 $1,347,121 $1,387,535 $1,429,161 $1,472,036 $1,516,197
=Total Revenue $4,817,413 $4,961,935 $5,110,793 $5,264,117 $5,422,041 $5,584,702 $5,752,243 $5,924,810 $6,102,555 $6,285,631 $6,474,200
-Opex $1,356,700 $1,397,401 $1,439,323 $1,482,503 $1,526,978 $1,572,787 $1,619,971 $1,668,570 $1,718,627 $1,770,186 $1,823,291
-CapEx $91,555 $94,302 $97,131 $100,045 $103,046 $106,137 $109,321 $112,601 $115,979 $119,459 $123,042
-Annual Taxes $279,076 $287,448 $296,072 $304,954 $314,102 $323,526 $333,231 $343,228 $353,525 $364,131 $375,055
=NOI $3,090,082 $3,182,784 $3,278,268 $3,376,616 $3,477,915 $3,582,252 $3,689,720 $3,800,411 $3,914,423 $4,031,856 $4,152,812
NPV $27,030,789
Terminal Sale Value $63,889,413
-Transfer Tax $1,309,733
-Transaction Costs $638,894
=Cash from Sale $61,940,785
NPV Gross Rental Revenue $25,743,609
+NPV Sale Value $36,215,494
=NPV of Total Revenue $61,959,103
-Total Development Cost $57,857,176
=NPV of Cash Flows $4,101,927
Cash-on-Cash Return $1.07
ROI 7.1%

INCLUSIONARY ZONING IN PHILADELPHIA An Economic Analysis of the City’s Proposed “Mixed Income Housing Program”
30
IZ Scenario
Calculations Monthly Rent
50% of MSA AMI $41,600 $1,040
30% of MSA AMI $24,960 $624
Item Year1 Year2 Year3 Year4 Year5 Year6 Year7 Year8 Year9 Year10 Year11
Potential Rental Rev.: Mkt.-Rate $3,320,298 $3,419,907 $3,522,504 $3,628,179 $3,737,025 $3,849,135 $3,964,609 $4,083,548 $4,206,054 $4,332,236 $4,462,203
x(1-Vacancy Rate) 0% 0% 0% 0% 0% 0% 0% 0% 0% 0% 0%
=Actual Rental Revenue: Mkt.-Rate $3,320,298 $3,419,907 $3,522,504 $3,628,179 $3,737,025 $3,849,135 $3,964,609 $4,083,548 $4,206,054 $4,332,236 $4,462,203
Potential Rental Rev.: Affordable $224,640.00 $231,379 $238,321 $245,470 $252,834 $260,419 $268,232 $276,279 $284,567 $293,104 $301,897
x(1-Vacancy Rate) 0% 0% 0% 0% 0% 0% 0% 0% 0% 0% 0%
=Actual Rental Revenue: Affordable $224,640 $231,379 $238,321 $245,470 $252,834 $260,419 $268,232 $276,279 $284,567 $293,104 $301,897
Total Actual Rental Revenue $3,544,938 $3,651,286 $3,760,825 $3,873,649 $3,989,859 $4,109,555 $4,232,841 $4,359,827 $4,490,621 $4,625,340 $4,764,100
+Supplementary Revenue $1,015,374 $1,045,835 $1,077,210 $1,109,526 $1,142,812 $1,177,096 $1,212,409 $1,248,782 $1,286,245 $1,324,832 $1,364,577
=Total Revenue $4,560,312 $4,697,121 $4,838,035 $4,983,176 $5,132,671 $5,286,651 $5,445,251 $5,608,608 $5,776,866 $5,950,172 $6,128,678
-Opex $1,356,700 $1,397,401 $1,439,323 $1,482,503 $1,526,978 $1,572,787 $1,619,971 $1,668,570 $1,718,627 $1,770,186 $1,823,291
-CapEx $91,555 $94,302 $97,131 $100,045 $103,046 $106,137 $109,321 $112,601 $115,979 $119,459 $123,042
-Annual Taxes $279,076 $287,448 $296,072 $304,954 $314,102 $323,526 $333,231 $343,228 $353,525 $364,131 $375,055
=NOI $2,832,981 $2,917,970 $3,005,509 $3,095,675 $3,188,545 $3,284,201 $3,382,727 $3,484,209 $3,588,735 $3,696,397 $3,807,289
NPV $24,781,771
Terminal Sale Value $58,573,679
-Transfer Tax $1,200,760
-Transaction Costs $585,737
=Cash from Sale $56,787,182
NPV Gross Rental Revenue $23,601,687
+NPV Sale Value $33,202,289
=NPV of Total Revenue $56,803,976
-Total Development Cost $57,857,176
=NPV of Cash Flows -$1,053,200
Cash-on-Cash Return $0.98
ROI -1.8%
INCLUSIONARY ZONING IN PHILADELPHIA An Economic Analysis of the City’s Proposed “Mixed Income Housing Program”
31
Case Study #2: Symphony House
Market-Rate Scenario
Inputs and Assumptions
MSA AMI $83,200
City AMI $34,207
% Allocated to Mortgage 30%
% Units Affordable 10%
FMR Efficiency $830
FMR 1-bedroom $1,003
FMR 2-bedroom $1,210
FMR 3-bedroom $1,502
FMR 4-bedroom $1,659
Development Cost $126,000,000
Number of Units 163
Length of Development (years) 1
Total Sales Revenue $182,026,300
Sales Commission Rate (%) 6.00%
Transfer Tax Rate (Seller Share) 2.05%
Closing Costs (%) 0.50%
%Downpayment 20%
Property Tax Rate (%) 1.3998%
30-Year FRM 4.00%
Duration of Mortgage (years) 30
Discount Rate 5%
Gross Sales Revenue $157,364,050
-Sales Commission $9,441,843
-Transfer Tax $3,225,963
-Closing Costs $786,820
=Net Sales Revenue $143,909,424
PV of Net Sales Revenue $137,056,594
-Total Development Cost $126,000,000
=Net Profit $11,056,594
Cash-on-Cash Return $1.09
ROI 8.8%
INCLUSIONARY ZONING IN PHILADELPHIA An Economic Analysis of the City’s Proposed “Mixed Income Housing Program”
32
IZ Scenario
Calculations Monthly Mtg.
80% of MSA AMI $66,560 $1,664
30% of MSA AMI $24,960 $624
50% of City AMI $17,104 $428
30% of City AMI $10,262 $257
Affordable Mortgage Loan Amt. $348,544
Market-Rate House Price $965,424
Affordable House Price $435,679
Number of Affordable Units 16
Market-Rate Units
Gross Sales Revenue $141,917,272
-Sales Commission $8,515,036
-Transfer Tax $2,909,304
-Closing Costs $709,586
=Net Sales Revenue $129,783,345
PV of Net Sales Revenue $123,603,186
Affordable Units
Gross Sales Revenue $6,970,870
-Sales Commission $418,252
-Transfer Tax $142,903
-Closing Costs $34,854
=Net Sales Revenue $6,374,861
PV of Net Sales Revenue $6,071,296
Total
PV of Total Net Sales Rev. $129,674,482
-Total Development Cost $126,000,000
=Net Profit $3,674,482
Cash-on-Cash Return $1.03
ROI 2.9%
INCLUSIONARY ZONING IN PHILADELPHIA An Economic Analysis of the City’s Proposed “Mixed Income Housing Program”
33
Case Study #3: 31 Brewerytown
Market-Rate Scenario
Inputs and Assumptions
MSA AMI $83,200
City AMI $34,207
% Allocated to Rent 30%
% Units Affordable 10%
FMR Efficiency $830
FMR 1-bedroom $1,003
FMR 2-bedroom $1,210
FMR 3-bedroom $1,502
FMR 4-bedroom $1,659
Development Cost $10,286,445
Annual Rental Revenue $1,128,152
Annual Supplementary Revenue $42,973
Annual OpEx $364,458
Annual CapEx $16,000
Transfer Tax $28,000
Annual Taxes (RE+BIRT) $111,687
Number of Units 64
Growth Rate 3.0%
Vacancy Rate 8.0%
Discount Rate 5.0%
Going-Out Cap Rate 7.0%
%Allocation Affordable Units 10.0%
Transaction Costs 3.550%
Item Year1 Year2 Year3 Year4 Year5 Year6 Year7 Year8 Year9 Year10 Year11
Potential Rental Revenue $1,128,152 $1,161,997 $1,196,856 $1,232,762 $1,269,745 $1,307,837 $1,347,072 $1,387,485 $1,429,109 $1,471,982 $1,516,142
x(1-Vacancy Rate) 8% 8% 8% 8% 8% 8% 8% 8% 8% 8% 8%
=Actual Rental Revenue $1,037,900 $1,069,037 $1,101,108 $1,134,141 $1,168,165 $1,203,210 $1,239,307 $1,276,486 $1,314,780 $1,354,224 $1,394,851
+Supplementary Revenue $42,973 $44,262 $45,590 $46,958 $48,366 $49,817 $51,312 $52,851 $54,437 $56,070 $57,752
=Total Revenue $1,080,873 $1,113,299 $1,146,698 $1,181,099 $1,216,532 $1,253,028 $1,290,619 $1,329,337 $1,369,217 $1,410,294 $1,452,603
-Opex $364,458 $375,392 $386,653 $398,253 $410,201 $422,507 $435,182 $448,237 $461,684 $475,535 $489,801
-CapEx $16,000 $16,480 $16,974 $17,484 $18,008 $18,548 $19,105 $19,678 $20,268 $20,876 $21,503
-Annual Taxes $111,687 $115,038 $118,489 $122,043 $125,705 $129,476 $133,360 $137,361 $141,482 $145,726 $150,098
=NOI $588,728 $606,390 $624,581 $643,319 $662,618 $682,497 $702,972 $724,061 $745,783 $768,156 $791,201
NPV $5,149,953
Terminal Sale Value $11,302,871
-Transfer Tax $401,252
=Cash from Sale $10,901,619
6%
NPV Gross Rental Revenue $4,904,718
+NPV Sale Value $6,373,951
=NPV of Total Revenue $11,278,669
-Total Development Cost $10,286,445
=NPV of Cash Flows $992,224
Cash-on-Cash Return $1.10
ROI 9.6%
INCLUSIONARY ZONING IN PHILADELPHIA An Economic Analysis of the City’s Proposed “Mixed Income Housing Program”
34
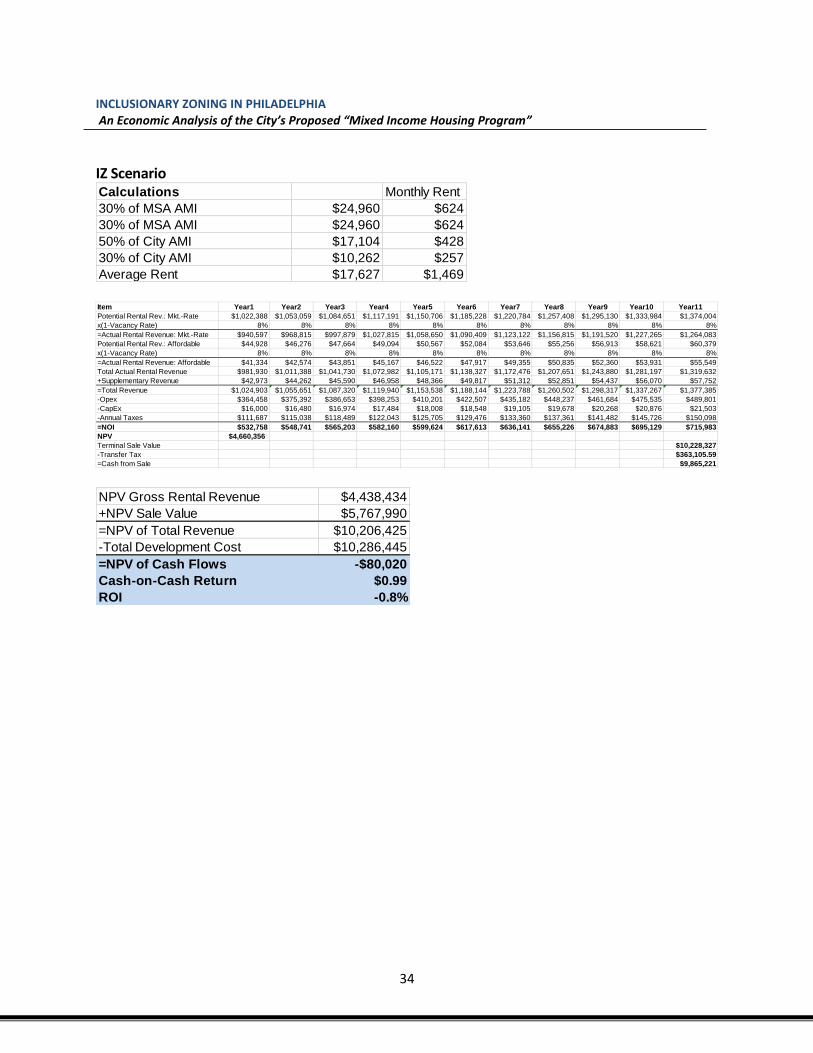
IZ Scenario
Calculations Monthly Rent
30% of MSA AMI $24,960 $624
30% of MSA AMI $24,960 $624
50% of City AMI $17,104 $428
30% of City AMI $10,262 $257
Average Rent $17,627 $1,469
Item Year1 Year2 Year3 Year4 Year5 Year6 Year7 Year8 Year9 Year10 Year11
Potential Rental Rev.: Mkt.-Rate $1,022,388 $1,053,059 $1,084,651 $1,117,191 $1,150,706 $1,185,228 $1,220,784 $1,257,408 $1,295,130 $1,333,984 $1,374,004
x(1-Vacancy Rate) 8% 8% 8% 8% 8% 8% 8% 8% 8% 8% 8%
=Actual Rental Revenue: Mkt.-Rate $940,597 $968,815 $997,879 $1,027,815 $1,058,650 $1,090,409 $1,123,122 $1,156,815 $1,191,520 $1,227,265 $1,264,083
Potential Rental Rev.: Affordable $44,928 $46,276 $47,664 $49,094 $50,567 $52,084 $53,646 $55,256 $56,913 $58,621 $60,379
x(1-Vacancy Rate) 8% 8% 8% 8% 8% 8% 8% 8% 8% 8% 8%
=Actual Rental Revenue: Affordable $41,334 $42,574 $43,851 $45,167 $46,522 $47,917 $49,355 $50,835 $52,360 $53,931 $55,549
Total Actual Rental Revenue $981,930 $1,011,388 $1,041,730 $1,072,982 $1,105,171 $1,138,327 $1,172,476 $1,207,651 $1,243,880 $1,281,197 $1,319,632
+Supplementary Revenue $42,973 $44,262 $45,590 $46,958 $48,366 $49,817 $51,312 $52,851 $54,437 $56,070 $57,752
=Total Revenue $1,024,903 $1,055,651 $1,087,320 $1,119,940 $1,153,538 $1,188,144 $1,223,788 $1,260,502 $1,298,317 $1,337,267 $1,377,385
-Opex $364,458 $375,392 $386,653 $398,253 $410,201 $422,507 $435,182 $448,237 $461,684 $475,535 $489,801
-CapEx $16,000 $16,480 $16,974 $17,484 $18,008 $18,548 $19,105 $19,678 $20,268 $20,876 $21,503
-Annual Taxes $111,687 $115,038 $118,489 $122,043 $125,705 $129,476 $133,360 $137,361 $141,482 $145,726 $150,098
=NOI $532,758 $548,741 $565,203 $582,160 $599,624 $617,613 $636,141 $655,226 $674,883 $695,129 $715,983
NPV $4,660,356
Terminal Sale Value $10,228,327
-Transfer Tax $363,105.59
=Cash from Sale $9,865,221
NPV Gross Rental Revenue $4,438,434
+NPV Sale Value $5,767,990
=NPV of Total Revenue $10,206,425
-Total Development Cost $10,286,445
=NPV of Cash Flows -$80,020
Cash-on-Cash Return $0.99
ROI -0.8%

INCLUSIONARY ZONING IN PHILADELPHIA An Economic Analysis of the City’s Proposed “Mixed Income Housing Program”
35
Case Study #4: 1300 Chadwick
Market-Rate Scenario
Inputs and Assumptions
MSA AMI $83,200
City AMI $34,207
% Allocated to Mortgage 30%
% Units Affordable 10%
FMR Efficiency $830
FMR 1-bedroom $1,003
FMR 2-bedroom $1,210
FMR 3-bedroom $1,502
FMR 4-bedroom $1,659
Development Cost $3,770,000
Number of Units 13
Length of Development (years) 1
Total Sales Revenue $4,485,000
Sales Commission Rate (%) 6.00%
Transfer Tax Rate (Seller Share) 2.05%
Closing Costs (%) 0.50%
%Downpayment 20%
Property Tax Rate (%) 1.3998%
30-Year FRM 4.00%
Duration of Mortgage (years) 30
Discount Rate 5%
Gross Sales Revenue $4,485,000
-Sales Commission $269,100
-Transfer Tax $91,943
-Closing Costs $22,425
=Net Sales Revenue $4,101,533
PV of Net Sales Revenue $3,906,221
-Total Development Cost $3,640,000
=Net Profit $266,221
Cash-on-Cash Return $1.07
ROI 7.3%
INCLUSIONARY ZONING IN PHILADELPHIA An Economic Analysis of the City’s Proposed “Mixed Income Housing Program”
36
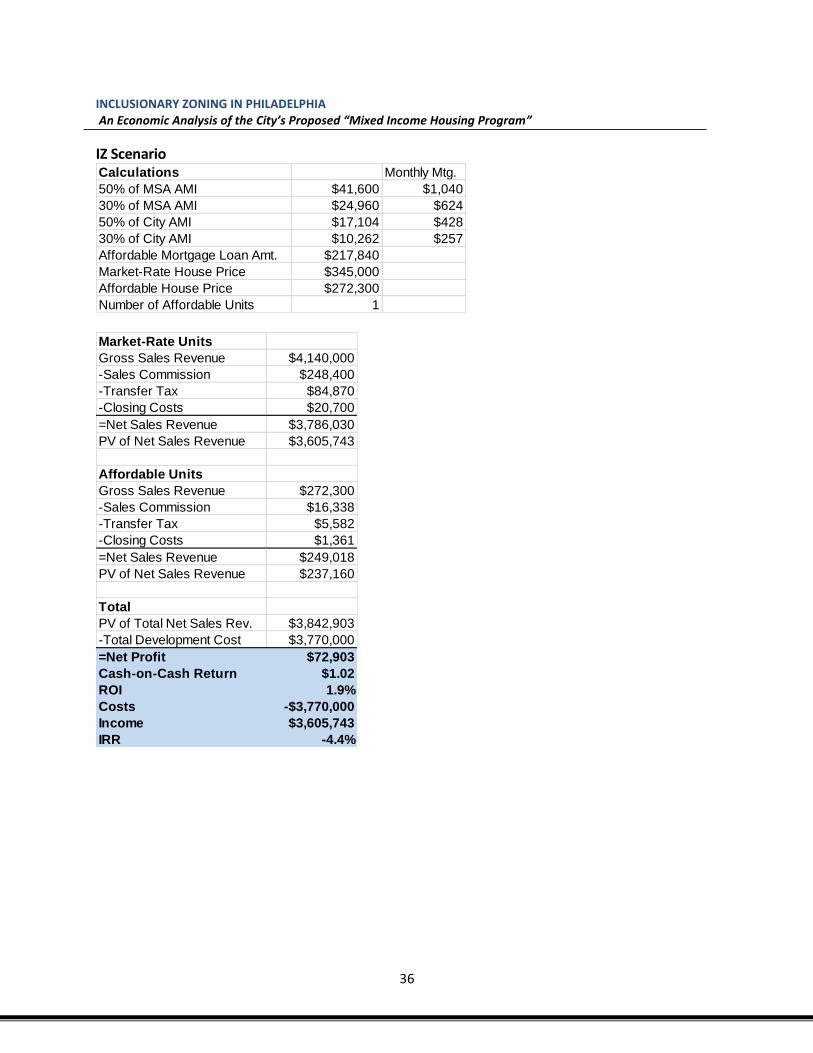
IZ Scenario
Calculations Monthly Mtg.
50% of MSA AMI $41,600 $1,040
30% of MSA AMI $24,960 $624
50% of City AMI $17,104 $428
30% of City AMI $10,262 $257
Affordable Mortgage Loan Amt. $217,840
Market-Rate House Price $345,000
Affordable House Price $272,300
Number of Affordable Units 1
Market-Rate Units
Gross Sales Revenue $4,140,000
-Sales Commission $248,400
-Transfer Tax $84,870
-Closing Costs $20,700
=Net Sales Revenue $3,786,030
PV of Net Sales Revenue $3,605,743
Affordable Units
Gross Sales Revenue $272,300
-Sales Commission $16,338
-Transfer Tax $5,582
-Closing Costs $1,361
=Net Sales Revenue $249,018
PV of Net Sales Revenue $237,160
Total
PV of Total Net Sales Rev. $3,842,903
-Total Development Cost $3,770,000
=Net Profit $72,903
Cash-on-Cash Return $1.02
ROI 1.9%
Costs -$3,770,000
Income $3,605,743
IRR -4.4%


I hereby certify that the data provided for the analysis in this report are both true and correct,
to the best of our knowledge, and are offered to a reasonable degree of professional certainty
in the field of real estate development.
Ori Feibush Date
President, OCF Realty
DocuSign Envelope ID: 7894C44C-D4F7-4709-B1CA-B63AEF6BB9B3
10/3/2017