Embed Size (px)
Citation preview

Scholars' Mine Scholars' Mine
Masters Theses Student Theses and Dissertations
Fall 2020
Inclusion control in steel castings Inclusion control in steel castings
Koushik Karthikeyan Balasubramanian
Follow this and additional works at: https://scholarsmine.mst.edu/masters_theses
Part of the Materials Science and Engineering Commons
Department: Department:
Recommended Citation Recommended Citation Balasubramanian, Koushik Karthikeyan, "Inclusion control in steel castings" (2020). Masters Theses. 7961. https://scholarsmine.mst.edu/masters_theses/7961
This thesis is brought to you by Scholars' Mine, a service of the Missouri S&T Library and Learning Resources. This work is protected by U. S. Copyright Law. Unauthorized use including reproduction for redistribution requires the permission of the copyright holder. For more information, please contact [email protected].

INCLUSION CONTROL IN STEEL CASTINGS
by
KOUSHIK KARTHIKEYAN BALASUBRAMANIAN
A THESIS
Presented to the Graduate Faculty of the
MISSOURI UNIVERSITY OF SCIENCE AND TECHNOLOGY
In Partial Fulfillment of the Requirements for the Degree
MASTER OF SCIENCE
in
MATERIALS SCIENCE AND ENGINEERING
2020
Approved by:
Dr.Laura Bartlett, Advisor Dr.Ronald O’Malley
Dr.Simon Lekakh

© 2020
KOUSHIK KARTHIKEYAN BALASUBRAMANIAN
All Rights Reserved
PUBLICATION THESIS OPTION
iii
This thesis consists of the following three articles, prepared for journal publication
in the style used by the Missouri University of Science and Technology:
Paper I, found on pages 39-68, has been published in the International Journal of
Metalcasting (IJMC).
Paper II, found on pages 69-107, are intended for submission to International
Journal of Metalcasting (IJMC).
Paper III, found on pages 108-135, are intended for submission to International
Journal of Metalcasting (IJMC).
iv
ABSTRACT
Non-metallic inclusions are mainly comprised of oxides, sulfides, and nitrides, and
are formed in liquid steel during the melting and refining process, as a result of reoxidation,
worn-out refractories, or entrained slag. The notch toughness of high strength steels is
particularly susceptible to the type, number, size, and distribution of non-metallic
inclusions. High manganese and aluminum austenitic steels, or Fe-Mn-Al steels, have
gained much interest in the military and automotive sector because of their excellent
combinations of high strength and toughness. However, these steels are subject to both
oxide bifilms and aluminum nitride, AlN, inclusions which form during melting and
casting. During the casting process, the gating system plays an important role in
determining the casting quality and the overall level of inclusions and bifilm defects. Two
solutions to control inclusions during mold filling include molten metal filtration and
design of novel “naturally pressurized” gating systems that control metal flow into the
casting cavity and reduce air entrainment. However, the use of filters and these naturally
pressurized gating systems add an additional cost and generally reduce casting yield. In
the current study, the effects of filtration and gating design on reduction of bifilms and
inclusions in Fe-Mn-Al steel were determined using two novel mold designs. A parallel
gating study involving an aluminum deoxidized, cast composition of SAE 8630 was also
performed. The results of this study showed that ceramic foam filters were more effective
at removing solid oxide bifilms and aluminum nitride inclusions from Fe-Mn-Al steel
castings than the naturally pressurized gating systems. Future studies should be directed
at developing naturally pressurized gating systems with filters.

v
First, I would like to thank God and my parents, Mr. M.S. Balasubramanian and
Mrs. Uma Balu, for all their love, support, and sacrifices without which I would not have
been able to make it this far in life. I would like to extend my heartfelt thanks and gratitude
to my advisor, Dr. Laura Bartlett, for believing in me and providing me with an opportunity
to work under her wing. Apart from being an advisor, she was also a great mentor, guide,
and motivation. I would like to thank her for all her time and knowledge, and for helping
me better myself at every stage of my journey, in graduate school. I would like to
acknowledge the support provided by Dr. Ronald O’Malley, Dr. Simon Lekakh, and Dr.
Mingzhi Xu for helping me understand and solve the challenges, faced in my research. I
am grateful to Mr. Doug Imrie and Mr. Zach Henderson from SouthernCast Products for
all their inputs and being the industrial sponsors. I am thankful to Mr. Miguel Gastelum
and Mr. Dan Coyle from MagmaSoft for all the technical guidance. I would like to extend
my gratitude to Mr. Nathan Inskip, Mr. Brian Bullock, Ms. Denise Eddings and Ms. Teneke
Hill for their patience and time, experimental support and for ensuring that all the processes
happened in a smooth and organized manner. I would like to thank the American Foundry
Society for sponsoring this project. I would like to thank all my fellow graduate and
undergraduate students for their support during experiments. I extend my special thanks to
Michael Piston, Rairu Vaz Penna, and Soumava Chakraborty. Finally, I would like to thank
my roommates, friends, and family without whom I would not be standing here. I would
take this opportunity to specially mention Sivaramakrishnan Jayaram and Poorna
Hariramakrishnan for being a constant source of emotional and moral support.
ACKNOWLEDGMENTS
vi
TABLE OF CONTENTS
Page
PUBLICATION THESIS OPTION.......................................................................................... iii
ABSTRACT..................................................................................................................................iv
ACKNOWLEDGMENTS...........................................................................................................v
LIST OF ILLUSTRATIONS...................................................................................................... x
LIST OF TABLES....................................................................................................................xvii
SECTION
1. INTRODUCTION..............................................................................................................1
1.1. PROJECT PURPOSE AND OVERVIEW...............................................................1
1.2. NON-METALLIC INCLUSIONS............................................................................ 6
1.2.1. Classification of Inclusions............................................................................ 6
1.2.2. Effect of Inclusions on Casting Quality........................................................ 13
1.3. BIFILMS.................................................................................................................... 17
1.3.1. Formation......................................................................................................... 17
1.3.2. Effect on Mechanical Properties....................................................................20
1.4. HIGH MANGANESE HIGH ALUMINUM STEELS.........................................23
1.4.1. Composition and Heat Treatment..................................................................24
1.4.2. Inclusions.........................................................................................................25
1.5. FILTRATION........................................................................................................... 26
1.5.1. Filtration Mechanism................................................................................... 26
1.5.2. Parameters Affecting Filtration 29
1.6. GATING SYSTEM IN CASTINGS....................................................................30
1.6.1. Components of a Gating System....................................................................31
1.6.2. Pouring Cup......................................................................................................31
1.6.3. Downsprue.......................................................................................................31
1.6.4. Runners............................................................................................................ 34
1.6.5. Gating................................................................................................................35
1.6.6. Riser/Feeder.....................................................................................................38
PAPER
I. FILTRATION EFFICIENCY OF INCLUSIONS IN LIGHTWEIGHTFeMnAl STEELS........................................................................................................... 39
ABSTRACT........................................................................................................................ 39
1. INTRODUCTION.........................................................................................................40
1.1. NON-METALLIC INCLUSIONS IN Fe-Mn-Al-C STEEL.............................40
1.2. FILTRATION.........................................................................................................41
2. METHODOLOGY........................................................................................................42
3. RESULTS....................................................................................................................... 47
3.1. CHEMISTRY ANALYSIS................................................................................... 48
3.2. BIFILM AND INCLUSION ANALYSIS........................................................... 50
4. DISCUSSION.................................................................................................................59
5. CONCLUSION...............................................................................................................65
ACKNOWLEDGEMENTS................................................................................................ 66
REFERENCES..................................................................................................................... 66
II. QUANTIFYING THE EFFECT OF FILLING CONDITIONS ON8630 STEEL CASTING QUALITY............................................................................69
vii

ABSTRACT.......................................................................................................................... 69
1. INTRODUCTION......................................................................................................... 70
2. DESIGN OF MOLDS AND TEST CASTINGS........................................................75
3. EXPERIMENTAL PROCEDURE..............................................................................83
4. RESULTS....................................................................................................................... 88
4.1. CHEMISTRY ANALYSIS................................................................................... 89
4.2. NON-METALLIC INCLUSION ANALYSIS.................................................. 91
4.3. MECHANICAL PROPERTIES............................................................................96
5. DISCUSSION.................................................................................................................97
6. CONCLUSION.............................................................................................................104
ACKNOWLEDGEMENTS...............................................................................................105
REFERENCES................................................................................................................... 106
III. QUANTIFYING THE EFFECT OF FILLING CONDITIONS ON HIGH MANGANESE AND ALUMINUM STEEL CASTING QUALITY................................................................................................................... 108
ABSTRACT........................................................................................................................ 108
1. INTRODUCTION....................................................................................................... 109
2. DESIGN OF TEST CASTINGS................................................................................ 112
3. EXPERIMENTAL PROCEDURE............................................................................116
4. RESULTS..................................................................................................................... 120
4.1. CHEMISTRY........................................................................................................ 120
4.2. BIFILM ANALYSIS............................................................................................ 121
4.3. MECHANICAL PROPERTIES..........................................................................125
viii
5. DISCUSSION 1 27

ix
6. CONCLUSION............................................................................................................. 133
ACKNOWLEDGEMENTS...............................................................................................134
REFERENCES................................................................................................................... 134
SECTION
2. CONCLUSION..............................................................................................................136
BIBLIOGRAPHY..................................................................................................................... 138
VITA........................................................................................................................................... 144

x
LIST OF ILLUSTRATIONS
SECTION Page
Figure 1.1. Defects in FeMnAl castings......................................................................................5
Figure 1.2. Morphologies of alumina inclusions....................................................................... 8
Figure 1.3. The growth of the different morphologies of oxide inclusions shown as a function of the deoxidizer activity (dashed line) and O activity (solid line)................................................................................................ 9
Figure 1.4. The manganese sulfides appear in various morphologies as shownin (a) globular type I sulfide (b) eutectic type II sulfide (c) type III angular faceted sulfide.......................................................................................................... 10
Figure 1.5. The work by Griffin and Bates showed that 83 % of all inclusions in lowalloy steel castings are caused as the result of reoxidation................................. 12
Figure 1.6. For a low carbon alloy steel, the variation in inclusion volume (Vinc) is shown as a function of relative entrained air volume (Va) at room temperature and when air is at 1600°C................................................................ 13
Figure 1.7. Inclusions leading to fracture................................................................................ 15
Figure 1.8. The stress concentration between different inclusions and steel matrixwas simulated for different inclusion types and morphologies..........................15
Figure 1.9. The nucleation of micro voids created by the presence of inclusionsaiding in crack propagation and subsequent fracture.......................................... 16
Figure 1.10. The formation of a bifilm defect generally takes place due to turbulentflow of metal.......................................................................................................... 18
Figure 1.11. Hydrogen induced porosity form ation...............................................................20
Figure 1.12. The RPT was performed on Al356 alloys, showing that the bifilm index had a direct impact on the (a) ultimate tensile strength and(b) elongation in the test specimens..................................................................21
Figure 1.13. The Weibull modulus for the top gated system is 3.4 while for thebottom gated system it was observed to be 12...................................................22
xi
Figure 1.14. Increasing the aluminum content from 6.5 to 12% in aFe-30Mn-XAl-0.9C steel leads to a total reduction in density from7.5 to 6.2 g/cm3.................................................................................................... 23
Figure 1.15. Secondary electron images of the different inclusions identified by Parket al. in a of Fe-(10-20) Mn-(1-6) Al composition steel...................................26
Figure 1.16. Photographs showing (a) tabular filters (b) monolithic filters(c) ceramic foam filters...................................................................................... 27
Figure 1.17. Cake filtration showing the filter medium........................................................ 27
Figure 1.18. A filter enables in trapping particles from the incoming metal and helps to reduce turbulence when the metal passes to the other side of the filter............................................................................................28
Figure 1.19. The comparison between the streamlined flow of a fluid (green line)and the flow path of the fluid inside a porous media (red lin e ) ................... 29
Figure 1.20. Elements of a gating system showing the pouring cup, sprue, sprue base, runner, runner extension, and multiple gates leading into the casting......................................................................................................32
Figure 1.21. Use of offset basin and an undercut.................................................................... 32
Figure 1.22. The transition of a sprue from a circular opening to a slim rectangularcross section ensures smooth filling and flow velocity....................................33
Figure 1.23. The vortex gate showing the presence of a gate and the velocitytracker which collects the incoming metal from the runner and trapsall the slag and aids in velocity control............................................................. 36
Figure 1.24. A gating system with a terminal trap...................................................................37
PAPER I
Figure 1. Drawing of the vertically parted mold design showing the two-bottomgated modified Y-block castings attached to two balancing gating systems.......43
Figure 2. The velocity profile during filling at (a) 10% (b) 20% (c) 30% and 50%filled............................................................................................................................ 45

Figure 3. The temperature profile directly after filling shows that alltemperatures are above the calculated liquidus temperature of 1338°Cat all points in the design............................................................................................45
Figure 4. Thermodynamic modeling of the equilibrium solidification of a Fe-30Mn-9Al-1Si-0.9C-0.5Mo steel with 0.007%N, 0.005%O and 0.005% S...............................................................................................................46
Figure 5. Experimental procedure of sectioning filter and obtaining specimensfor AFA analysis........................................................................................................49
Figure 6. Optical micrographs of sections taken before the filter show a matrix ofmainly austenite with less than 15% ferrite ............................................................ 51
Figure 7. Optical micrographs of samples taken after the filter in (a) mold 1 (b) mold 2 (c) mold 3 show that bifilms have been effectively removed by filtration...................................................................................................51
Figure 8. The backscattered electron image of a network of bifilms presentin the sectioned sample taken before the filter from mold 1 ................................ 52
Figure 9. SEM images of different inclusions found in the steel......................................... 54
Figure 10. Inclusion density of inclusions by type, taken from the three molds beforefilter, indicating a high density of AlN inclusions................................................55
Figure 11. Inclusion density of inclusions by type, taken from the three molds after the filter, indicating a reduction in AlN inclusions and a slight increase in the number of MnS inclusions.......................................................................... 55
Figure 12. The area fraction of inclusion coverage, as a function of filtration and mold pouring order shows a reduction in the amount of inclusions in filtered specimens by as much as 54% in mold 3 .................................................56
Figure 13. Inclusion density as a function of the size distribution for the unfiltered andfiltered samples in (a) mold 1 (b) mold 2 and (c) mold 3 ......................................57
Figure 14. Size distribution of aluminum nitride inclusions as a function of area fraction for filtered and unfiltered samples in (a) mold 1 (b) mold 2 and (c) mold 3 ........................................................................................................... 58
Figure 15. LECO analysis of N, O, and S concentration content from samples taken from the unfiltered runners and in the runners after filters as a function of mold pouring order....................................................................................................60
xii
Figure 16. Calculated total nitrogen contribution of inclusions from specimens sectioned before and after the filter as compared to the measured total nitrogen after filtration............................................................................................ 62
PAPER II
Figure 1. Horizontally parted gating systems that are typically used in the steelcasting industry......................................................................................................... 73
Figure 2. The complete design of the four gating systems in (a) isometric view(b) top view................................................................................................................76
Figure 3. The castings were designed to ensure a microporosity less than 0.08%............79
Figure 4. The castings were designed to have a Niyama number of greater than 6for obtaining quality castings without shrinkage defects...................................... 80
Figure 5. The velocity profile during filling for the top riser naturally pressurizedgating system at (a) 30% (b) 35% (c) 50% and (d) 75% of complete filling of the mold, observed between a scale of 0-1.5 m /s...............................................81
Figure 6. The velocity profile of filling when the molten metal enters the casting in(a) the naturally pressurized top riser system (b) the naturally pressurized side riser system (c) the pressurized system and(d) the non-pressurized system............................................................................. 82
Figure 7. The air entrapment for filling when the metal enters the casting in (a) TR system (b) SR system (c) NP system and (d) P system taken between a scale of 0-15 % ....................................................................................... 83
Figure 8. CAD drawing of the mold assembly shows the cope box containing therisers and the casting cavities while the drag box contains the runners and the gates......................................................................................................................85
Figure 9. Image of the mold directly after pouring at the industrial partner foundryshows a full pouring basin and no spillage.............................................................85
Figure 10. CAD drawing of the casting showing location of chemistry samples,inclusion analysis samples, and CVN test bars................................................... 86
Figure 11. CAD drawing showing the position of samples obtained for inclusionanalysis from the vortex overflows in the naturally pressurized systems......... 88
Figure 12. Total oxygen, sulfur, and nitrogen (in ppm) for samples taken from thecastings of different gating systems......................................................................90
xiii
xiv
Figure 13. The optical micrographs taken from the different gating systems in mold 1 reveal the presence of inclusions presence in clusters throughout the samples............................................................................................................... 91
Figure 14. Backscattered electron images of different inclusions and theircorresponding chemistries observed in 8630 steel castings............................... 92
Figure 15. The area fraction of alumina inclusions with respect to the different positions from the top sections of castings from (a) mold 1 and (b) mold 2 ........................................................................................................... 93
Figure 16. The area fraction of alumina inclusions comparison between the two moldsfor the TR gating system across different positions............................................ 94
Figure 17. The overall average area fraction of the alumina, AhO 3-MnS complexand the MnS inclusions for (a) mold 1 and (b) mold 2 respectively................ 95
Figure 18. Comparison of size distribution of alumina and the complex inclusions forall the four systems in (a) mold 1 and (b) mold 2 ..................................................95
Figure 19. Inclusion analysis in overflows...............................................................................96
Figure 20. The hardness and toughness properties were compared for the barsobtained from the two layers of the castings from each gating systemin (a) mold 1 and (b) mold 2 ................................................................................. 97
Figure 21. From the pressurized system of mold 1, fractography was performed on the bars which showed the presence of type II eutectic manganese sulfides formed in the chain or fan structure.................................................................... 97
Figure 22. Calculated total oxygen contribution of inclusions from specimens obtained from the top section of the castings as compared to the measured oxygen from LECO analysis............................................................. 100
Figure 23. Thermodynamic modeling of the equilibrium solidification of 8630 steelwith 0.0075% N, 0.006% O, and 0.007% S........................................................100
Figure 24. Magma inclusion tracers showing the position of reoxidation inclusionsafter filling..............................................................................................................102
Figure 25. Notch toughness plotted along with the density of manganesesulfide inclusions for (a) mold 1 and (b) mold 2 ................................................ 104
xv
PAPER III
Figure 1. The complete design of the four gating systems in (a) isometric view(b) top view............................................................................................................114
Figure 2. The castings were designed to have a Niyama number of greater than 6 (C-s)1/2/mm for obtaining quality castings with low levels of microporosity.......................................................................................................... 115
Figure 3. The velocity for filling when the metal enters the casting at various filling times in the (a) naturally pressurized top riser system at (b) naturally pressurized side riser system (c) pressurized system(d) the non-pressurized system.............................................................................. 117
Figure 4. CAD drawing showing the position of samples obtained for inclusionanalysis from the vortex overflows in the naturally pressurized systems......... 119
Figure 5. Measured concentrations of oxygen, sulfur, and nitrogen(in ppm) for samples taken from the castings of different gating systemsfor (a) mold 1 and (b) mold 2 ................................................................................. 122
Figure 6. Bifilms analysis on images using ImageJ...............................................................123
Figure 7. The percentage area of bifilm cover obtained as a function of position inthe casting as referenced in Figure 4 for (a) mold 1and (b) mold 2 .................... 124
Figure 8. The percentage area of bifilm cover obtained as an average of all the samples obtained from the different positions of top layer of the castings as referenced in Figure 4 of various gating systems for mold 1 and mold 2 ................................................................................................................. 124
Figure 9. The hardness and notch toughness from layer 1 and layer 2 of the castings of various gating systems shown for (a) mold 1 and (b) mold 2 respectively............................................................................................ 126
Figure 10. Backscattered electron images of fractured Charpy bars obtained from the SR system of mold 2 showing a dense layer of bifilms rich in aluminum oxide...................................................................................................... 127
Figure 11. A comparison shown between the total oxygen concentration (ppm) and area % of bifilm cover in the castings obtained from different gating systems for mold 1 and mold 2 .............................................................................. 129
Figure 12. The comparison between the 8 notch toughness obtained from layer 1 and layer 2 of every gating system and the area % of bifilm cover from the top section of the casting for (a) mold 1 and (b) mold 2 ...........................130
xvi
Figure 13. A comparison between the breaking energy of the Charpy bars and thearea cover of bifilms obtained from right underneath the Charpy bar.............131
Figure 14. Backscattered electron images of the area sectioned underneath the fractured surface of a Charpy bar from the SR system shows alumina bifilms on the surface confirming that the bifilms were the main reason for failure..................................................................................................132
Figure 15. The area fraction of the AlN, AlN-MnO and AlN-MnS inclusions shown for the different gating systems obtained from the surface underneath the fractured Charpy bars.................................................................................... 132
LIST OF TABLES
PAPER I Page
Table 1. LECO analysis of N, O, and S (ppm) content from samples taken fromunfiltered runners and after filters...............................................................................49
Table 2. Measured chemistry and target composition in weight percent asdetermined using OES and LECO C/S analyzer.......................................................50
Table 3. Comparison of bifilm chemistries compared with the matrix chemistryin samples sectioned before the filter........................................................................ 51
Table 4. The average chemistry of the different types of inclusions obtainedusing EDS..................................................................................................................... 53
PAPER II
Table 1. Abbreviation of different gating systems and the molds......................................... 89
Table 2. Steel chemistry in weight percent as determined usingOES and LECO*.......................................................................................................... 89
PAPER III
Table 1. Abbreviation for the different gating systems and the molds.............................120
Table 2. Target and measured chemistry in weight percent as determinedusing OES and LECO *..............................................................................................121
xvii
1. INTRODUCTION
1.1. PROJECT PURPOSE AND OVERVIEW
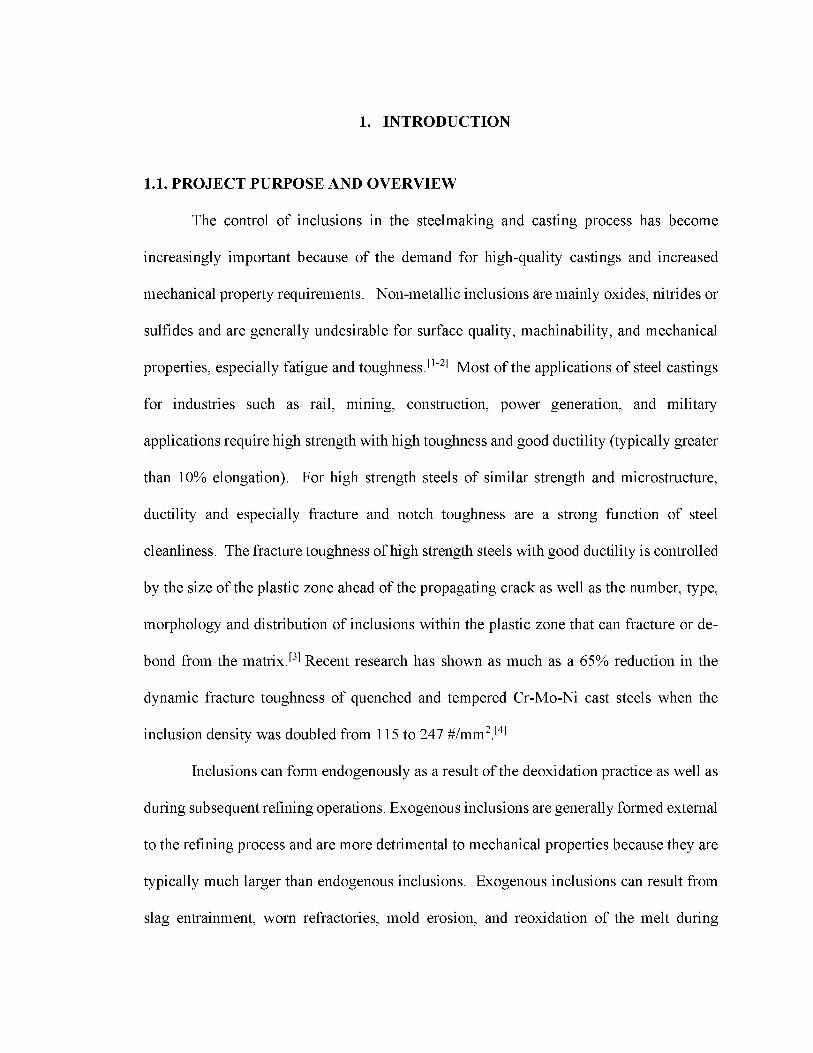
The control of inclusions in the steelmaking and casting process has become
increasingly important because of the demand for high-quality castings and increased
mechanical property requirements. Non-metallic inclusions are mainly oxides, nitrides or
sulfides and are generally undesirable for surface quality, machinability, and mechanical
properties, especially fatigue and toughness.[1-2] Most of the applications of steel castings
for industries such as rail, mining, construction, power generation, and military
applications require high strength with high toughness and good ductility (typically greater
than 10% elongation). For high strength steels of similar strength and microstructure,
ductility and especially fracture and notch toughness are a strong function of steel
cleanliness. The fracture toughness of high strength steels with good ductility is controlled
by the size of the plastic zone ahead of the propagating crack as well as the number, type,
morphology and distribution of inclusions within the plastic zone that can fracture or de
bond from the matrix.[3] Recent research has shown as much as a 65% reduction in the
dynamic fracture toughness of quenched and tempered Cr-Mo-Ni cast steels when the
inclusion density was doubled from 115 to 247 #/mm2.[4]
Inclusions can form endogenously as a result of the deoxidation practice as well as
during subsequent refining operations. Exogenous inclusions are generally formed external
to the refining process and are more detrimental to mechanical properties because they are
typically much larger than endogenous inclusions. Exogenous inclusions can result from
slag entrainment, worn refractories, mold erosion, and reoxidation of the melt during

2
pouring and mold filling operations. Recent work has shown that up to 80% of the
inclusions found in steel castings may be the result of reoxidation products that are often
created during pouring and mold filling.[5] Other filling related reoxidation defects such as
solid oxide bifilms and entrained gas defects are particularly detrimental to toughness and
ductility and can cost the foundry in weld repair and casting rejects. Inclusions can be
discrete or clustered, however, oxide bifilms are solid oxide films that become folded into
the melt during pouring and mold filling. During mold filling, bifilms can result from air
entrainment and abrupt changes in molten metal flow rate and direction that result in
hydraulic jumps and eddy current formation when the liquid is in the turbulent regime.[6]
For surface reactive metals such as aluminum alloys, ductile irons, and aluminum added
steels, these conditions result in entrained surface oxide films that are primarily composed
of alumina, spinel, or complex magnesium oxides.[7,8] These oxides films typically have a
thickness of less than a micron, however, they are extensive in area, and can be up to tens
of millimeters in length, essentially producing a crack-like flaw and a significant reduction
in mechanical properties.[7] Bifilms can also absorb dissolved gases and act as nucleation
sites for both gas and shrinkage microporosity.[8]
Unfortunately, prediction of the actual metal damage due to reoxidation inclusions
and bifilm defects created by the filling process is largely based on theory. Most foundries
in the United States are still using the rule-of-thumb gating practices for steel castings that
were developed by the American Foundry Society in the 1960’s; and these rules do not
consider the effect of turbulent fill on metal damage.[9,10] Work by Campbell has shown
that surface turbulence plays a critical role in the entrainment of oxide bifilms in aluminum
alloys and that for smooth flow, the velocity of any metal should not exceed a critical
3
velocity of 0.5 m/s.[9] In reality however, practical industrial gating design is often a
compromise between metal quality and yield. Recent advances in gating systems with
counter gravity filling in aluminum alloys have shown a reduction in the overall level of
defects, however the beneficial use of these systems at reducing the level of inclusions and
bifilm defects has not been proven out. In addition, these gating systems often add
additional mass to the system and can reduce the already poor yield of steel castings when
compared with aluminum alloys. Molten metal filtration using various types of ceramic
filters in the gating system is another solution remove inclusions. However, the efficiency
of inclusion filtration varies with the type of filter and has been shown to be a function of
physical and chemical characteristics of the inclusion [11]. In addition, many foundries are
hesitant to add filters as they create additional expense. Modern use of computational fluid
mechanics and heat transfer simulation packages that model filling and solidification have
greatly enhanced the ability to spot potential areas of excessive metal velocity and air
entrainment. Commercially available simulation packages can model the change in metal
flow due to the incorporation of filters, however, they cannot predict the filtration
efficiency of the filter. Additionally, these simulation tools do not incorporate the actual
formation of oxide defects during different filling conditions and they cannot predict the
effect of filling related defects on porosity or mechanical properties. In addition, the
computational models do not take into account the thermodynamics or morphology of
inclusion and bifilm formation that will be different based on the chemistry and deoxidation
practice of the steel. Because of this, serious consequences can occur when attempting to
interpret simulation results. This highlights the need for studies that link filling and
4
solidification modeling to actual measured defect levels as a function of gating practice
and the associated effect on mechanical properties.
High manganese and aluminum steels, or Fe-Mn-Al steels, are particularly sensitive
to reoxidation and solid oxide film formation during melt transfer operations and mold
filling. These steels typically contain between 3-12 wt.% of aluminum, which is balanced
by additions of 15 to 30 wt.% Mn and 0.7 to 1.2% wt.% C to produce a mainly austenitic
steel with high combinations of strength and toughness.[12] Depending on the composition,
the addition of Al produces up to an 18% reduction in density below that of quenched and
tempered martensitic steels without a sacrifice in mechanical properties.[13] However, the
elevated levels of aluminum also promote the formation of alumina bifilms during melting
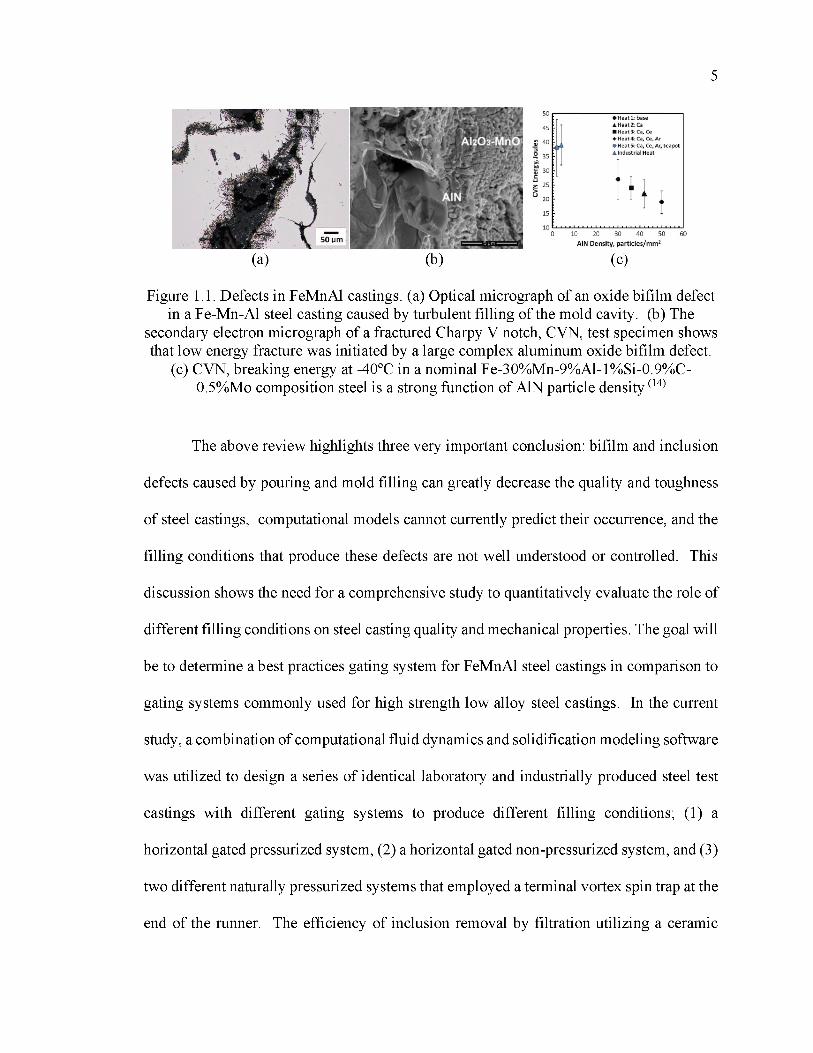
and pouring of these steels. Figure 1.1 (a) shows an optical micrograph of an oxide bifilm
defect in a Fe-Mn-Al steel casting caused by turbulent filling of the mold cavity. These
bifilm defects cause a reduction in Charpy V notch, CVN, impact toughness and an oxide
bifilm defect are shown covering the fracture surface in Figure 1.1 (b). Oxide bifilms in
FeMnAl steels can also absorb nitrogen resulting in nucleation of gas porosity as well as
precipitation of AlN plates during subsequent heat treatment.
Solid AlN inclusions are also stable in FeMnAl steels during steelmaking and their
hard and angular morphology negatively affects ductility and toughness. As shown in
Figure 1.1 (c), the CVN breaking energy at -40°C in a nominal Fe-30wt.%Mn-9wt.%Al-
1wt.%Si-0.9wt.%C-0.5 wt.% Mo composition steel was reduced by almost 50% when the
AlN particle density increased to 50 inclusions/mm2.[14]
5
\ . f 1 ‘•y 1 AIN Density, part
(a) ' 1 (b) (c)
Figure 1.1. Defects in FeMnAl castings. (a) Optical micrograph of an oxide bifilm defect in a Fe-Mn-Al steel casting caused by turbulent filling of the mold cavity. (b) The
secondary electron micrograph of a fractured Charpy V notch, CVN, test specimen shows that low energy fracture was initiated by a large complex aluminum oxide bifilm defect.
(c) CVN, breaking energy at -40°C in a nominal Fe-30%Mn-9%Al-1%Si-0.9%C- 0.5%Mo composition steel is a strong function of AlN particle density (14)
The above review highlights three very important conclusion: bifilm and inclusion
defects caused by pouring and mold filling can greatly decrease the quality and toughness
of steel castings, computational models cannot currently predict their occurrence, and the
filling conditions that produce these defects are not well understood or controlled. This
discussion shows the need for a comprehensive study to quantitatively evaluate the role of
different filling conditions on steel casting quality and mechanical properties. The goal will
be to determine a best practices gating system for FeMnAl steel castings in comparison to
gating systems commonly used for high strength low alloy steel castings. In the current
study, a combination of computational fluid dynamics and solidification modeling software
was utilized to design a series of identical laboratory and industrially produced steel test
castings with different gating systems to produce different filling conditions; (1) a
horizontal gated pressurized system, (2) a horizontal gated non-pressurized system, and (3)
two different naturally pressurized systems that employed a terminal vortex spin trap at the
end of the runner. The efficiency of inclusion removal by filtration utilizing a ceramic

6
foam filter was also evaluated. The ability of these gating systems to reduce inclusions and
bifilm defects in a lightweight FeMnAl steel was quantitatively compared to that of a cast
composition of SAE 8630 steel utilizing a combination of computational fluid dynamics,
optical metallography, automated non-metallic inclusion analysis, and evaluation of CVN
impact toughness. The outcome of this project is intended to significantly increase the
technical understanding of how filling affects metal quality and mechanical properties in
steel castings that are prone to reoxidation defects.
1.2. NON-METALLIC INCLUSIONS IN STEEL
Efforts to control non-metallic inclusions in steel have gained prominence over the
last 50 years because of the increased demand for cleaner steels with higher mechanical
property performance. A greater understanding of the effect of the type, size and
morphology of inclusions, casting performance combined with research on their origins
within the manufacturing process have led to increased casting quality and a reduction in
costs associated with defect re-work and casting rejections.
1.2.1. Classification of Inclusions. The sources of inclusion formation can be
briefly described as exogenous or endogenous in nature. The inclusions that are generated
primarily in the steelmaking process (deoxidation practices) are called endogenous
inclusions, while inclusions which originate from the external sources like worn-out
refractories, reoxidation and entrapped slag are called exogenous inclusions. Most
inclusions can be classified as oxides, sulfides, or nitride-based inclusions. [1]
Endogenous inclusions are formed in liquid steel because of deoxidation practice
and subsequent refining additions as well as during cooling and solidification. The
deoxidation practice generally dictates type, number, size, and distribution of endogenous
7
inclusions in steel castings. Deoxidation is the practice of adding small amounts of reactive
elements to liquid steel that have a high thermodynamic affinity to react with dissolved
oxygen within the melt. This aids in the removal of excess oxygen from steel by forming
stable solid or liquid oxide inclusions, thus preventing the formation of blow holes that are
formed when the oxygen in steel combines with the excess carbon to form carbon
monoxide. [15] The most common deoxidizers used in steel foundries are aluminum,
manganese, silicon, and calcium or a combination of these elements. Sometimes complex
deoxidation practices are also performed in the presence of other metals like titanium and
zirconium that are used to control nitrogen. This process of addition of deoxidizers to steel
is called killing the steel, since there is no gas evolution during solidification.
Solid alumina in low alloy aluminum killed steels and liquid manganese silicate
inclusions in manganese and silicon killed steels are the primary deoxidation products.[2]
Various alumina morphologies have been reported in steel like dendritic, faceted,
aggregates, planar and spherical. The morphology of these inclusions and their growth is
controlled by a variety of factors like holding time, liquid flow conditions and the degree
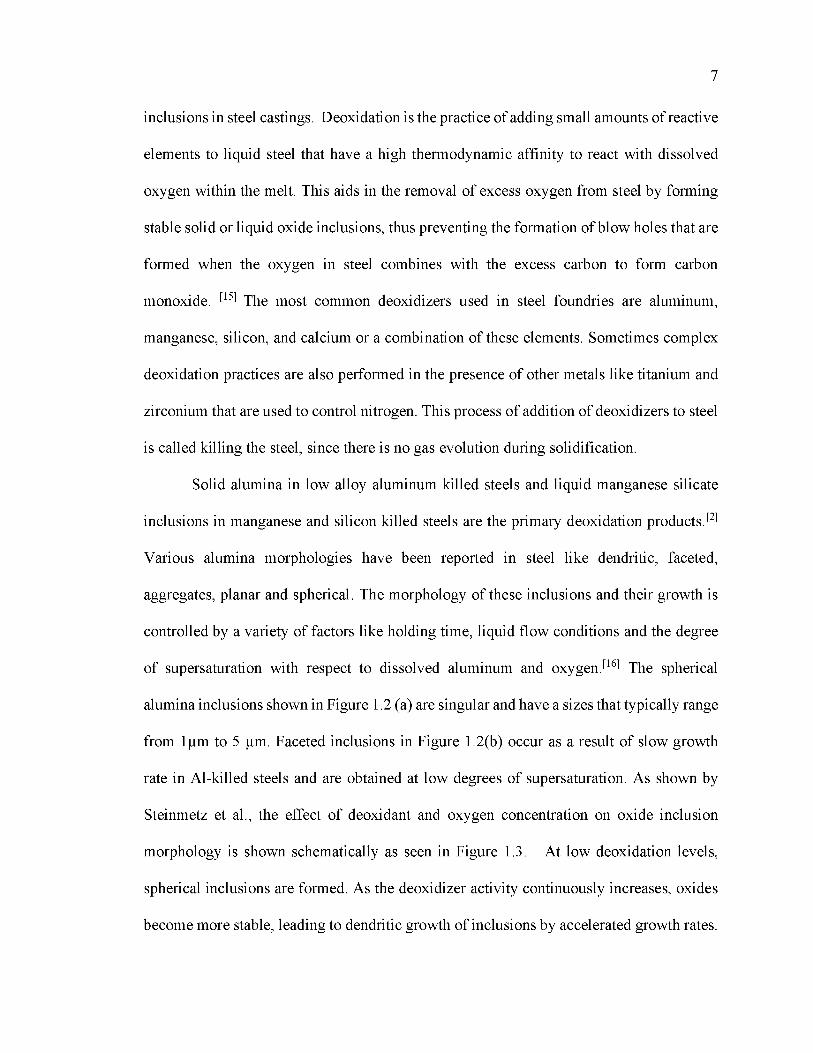
of supersaturation with respect to dissolved aluminum and oxygen.[16] The spherical
alumina inclusions shown in Figure 1.2 (a) are singular and have a sizes that typically range
from 1pm to 5 pm. Faceted inclusions in Figure 1.2(b) occur as a result of slow growth
rate in Al-killed steels and are obtained at low degrees of supersaturation. As shown by
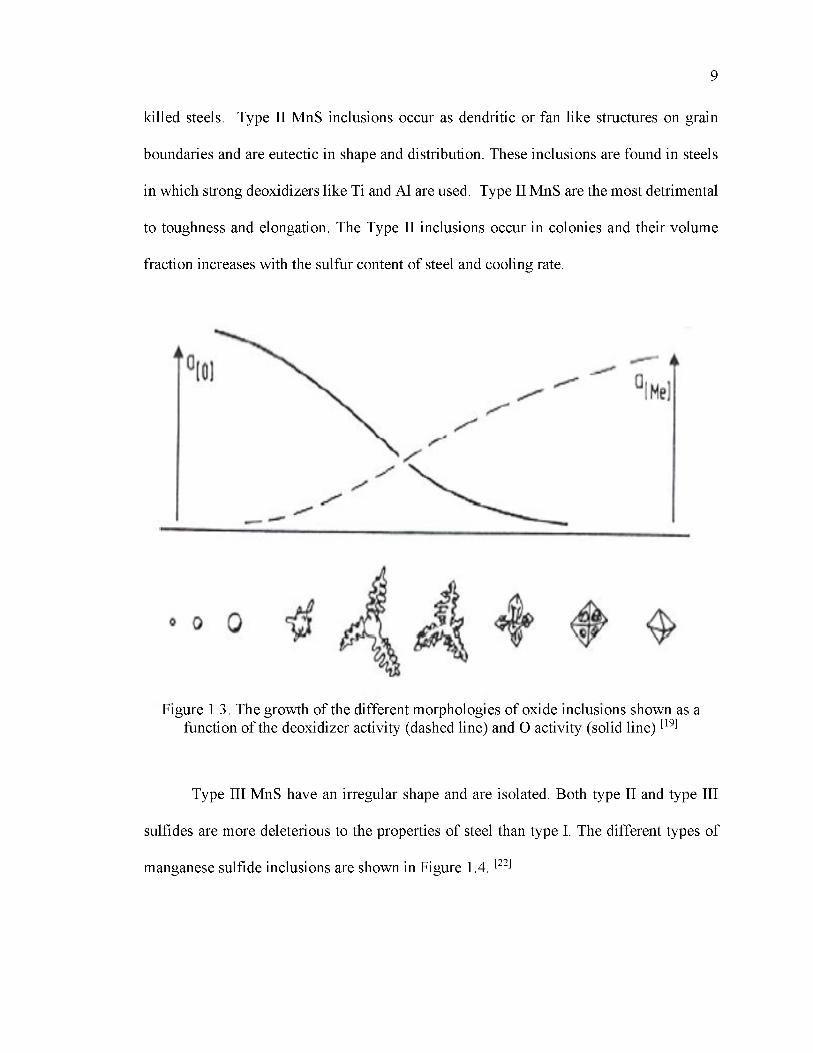
Steinmetz et al., the effect of deoxidant and oxygen concentration on oxide inclusion
morphology is shown schematically as seen in Figure 1.3. At low deoxidation levels,
spherical inclusions are formed. As the deoxidizer activity continuously increases, oxides
become more stable, leading to dendritic growth of inclusions by accelerated growth rates.
8
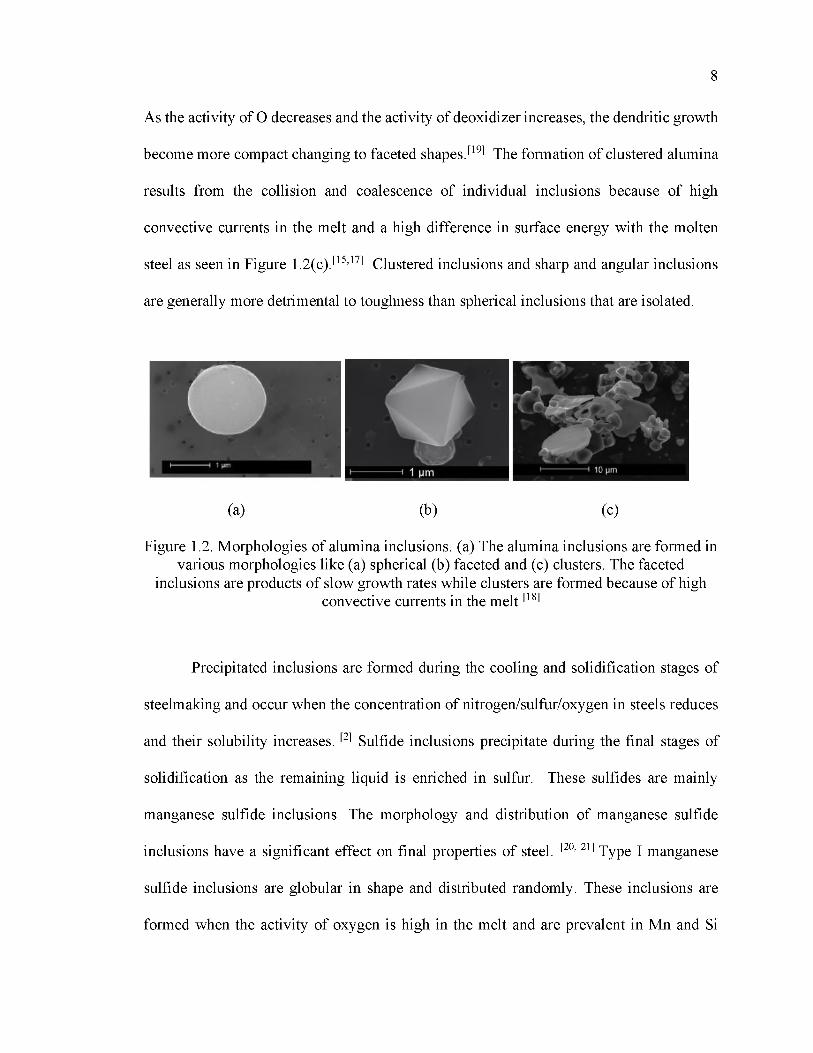
As the activity of O decreases and the activity of deoxidizer increases, the dendritic growth
become more compact changing to faceted shapes.[19] The formation of clustered alumina
results from the collision and coalescence of individual inclusions because of high
convective currents in the melt and a high difference in surface energy with the molten
steel as seen in Figure 1.2(c).[15,17] Clustered inclusions and sharp and angular inclusions
are generally more detrimental to toughness than spherical inclusions that are isolated.
(a) (b) (c)
Figure 1.2. Morphologies of alumina inclusions. (a) The alumina inclusions are formed in various morphologies like (a) spherical (b) faceted and (c) clusters. The faceted
inclusions are products of slow growth rates while clusters are formed because of highconvective currents in the melt [18]
Precipitated inclusions are formed during the cooling and solidification stages of
steelmaking and occur when the concentration of nitrogen/sulfur/oxygen in steels reduces
and their solubility increases. [2] Sulfide inclusions precipitate during the final stages of
solidification as the remaining liquid is enriched in sulfur. These sulfides are mainly
manganese sulfide inclusions. The morphology and distribution of manganese sulfide
inclusions have a significant effect on final properties of steel. [20, 21] Type I manganese
sulfide inclusions are globular in shape and distributed randomly. These inclusions are
formed when the activity of oxygen is high in the melt and are prevalent in Mn and Si
9
killed steels. Type II MnS inclusions occur as dendritic or fan like structures on grain
boundaries and are eutectic in shape and distribution. These inclusions are found in steels
in which strong deoxidizers like Ti and Al are used. Type II MnS are the most detrimental
to toughness and elongation. The Type II inclusions occur in colonies and their volume
fraction increases with the sulfur content of steel and cooling rate.
Figure 1.3. The growth of the different morphologies of oxide inclusions shown as a function of the deoxidizer activity (dashed line) and O activity (solid line) [19]
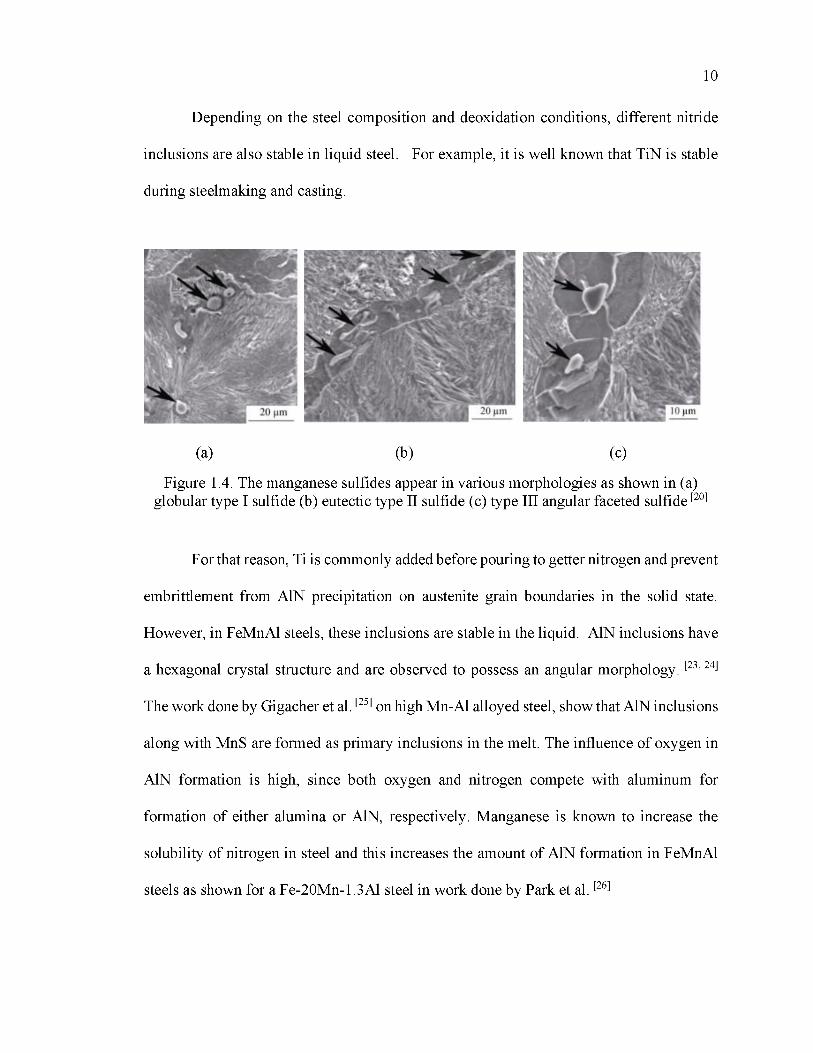
Type III MnS have an irregular shape and are isolated. Both type II and type III
sulfides are more deleterious to the properties of steel than type I. The different types of
manganese sulfide inclusions are shown in Figure 1.4. [22]
10
Depending on the steel composition and deoxidation conditions, different nitride
inclusions are also stable in liquid steel. For example, it is well known that TiN is stable
during steelmaking and casting.
(a) (b) (c)
Figure 1.4. The manganese sulfides appear in various morphologies as shown in (a) globular type I sulfide (b) eutectic type II sulfide (c) type III angular faceted sulfide [20]
For that reason, Ti is commonly added before pouring to getter nitrogen and prevent
embrittlement from AlN precipitation on austenite grain boundaries in the solid state.
However, in FeMnAl steels, these inclusions are stable in the liquid. AlN inclusions have
a hexagonal crystal structure and are observed to possess an angular morphology. [23, 24]
The work done by Gigacher et al. [25] on high Mn-Al alloyed steel, show that AlN inclusions
along with MnS are formed as primary inclusions in the melt. The influence of oxygen in
AlN formation is high, since both oxygen and nitrogen compete with aluminum for
formation of either alumina or AlN, respectively. Manganese is known to increase the
solubility of nitrogen in steel and this increases the amount of AlN formation in FeMnAl
steels as shown for a Fe-20Mn-1.3Al steel in work done by Park et al. [26]
11
The presence of these hard and angular AlN and AI2O3 inclusions are detrimental
to the mechanical properties of high strength steels, especially ductility and notch
toughness. Schulte et al. showed almost a 50% reduction in CVN toughness in a Fe-
30wt.%Mn-9wt.%Al-1wt.%Si-0.9wt.%C-0.5 wt.% Mo when the number density of AlN
inclusions increased to more than 50/mm2.[14] Hard alumina and AlN inclusions can also
cause excessive tool wear during machining. MnS inclusions are more ductile, however, in
high amounts, these inclusions can also result in poor ductility and toughness in both steel
castings and hot rolled steels [28].
Exogenous inclusions result from outside of the deoxidation practices and
subsequent precipitation reactions that happen as the steel solidifies and cools. These
inclusions are the result of slag entrainment, entrainment of worn refractories, or as a
consequence of reoxidation. Reoxidation inclusions are exogenous inclusions that are
products of unintentional reaction of the liquid metal with the air. The work by Beckerman
[30] on the composition of reoxidation inclusions shows that the composition of the
inclusions varies as a function of deoxidation practice and oxygen concentration. Air
entrainment during melt transfer and mold filling leads to reoxidation inclusions which is
one of the most common sources of endogenous inclusions in steel castings. Reoxidation
inclusions affect a number of various quality aspects of steel castings such as surface
quality, machinability, and mechanical properties. High molten metal velocity, splashing,
as well as improper gating system designs containing sharp corners, abrupt changes in
direction, and downhill filling conditions all lead to the formation of reoxidation inclusions
in steel.[31]. Once these inclusions are formed, they travel to the casting cavity and end up
in the final part. [32]. The work by Griffin and Bates in 1991[5] showed that reoxidation
12
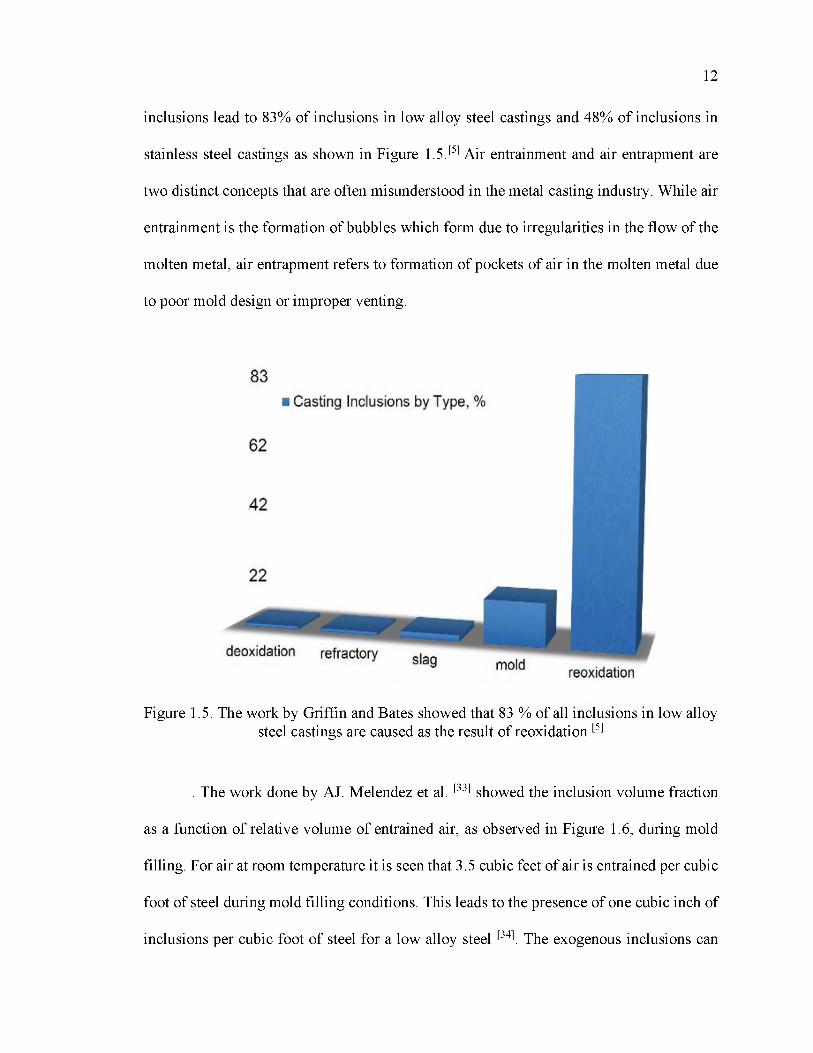
inclusions lead to 83% of inclusions in low alloy steel castings and 48% of inclusions in
stainless steel castings as shown in Figure 1.5.[5] Air entrainment and air entrapment are
two distinct concepts that are often misunderstood in the metal casting industry. While air
entrainment is the formation of bubbles which form due to irregularities in the flow of the
molten metal, air entrapment refers to formation of pockets of air in the molten metal due
to poor mold design or improper venting.
Figure 1.5. The work by Griffin and Bates showed that 83 % of all inclusions in low alloy steel castings are caused as the result of reoxidation [5]
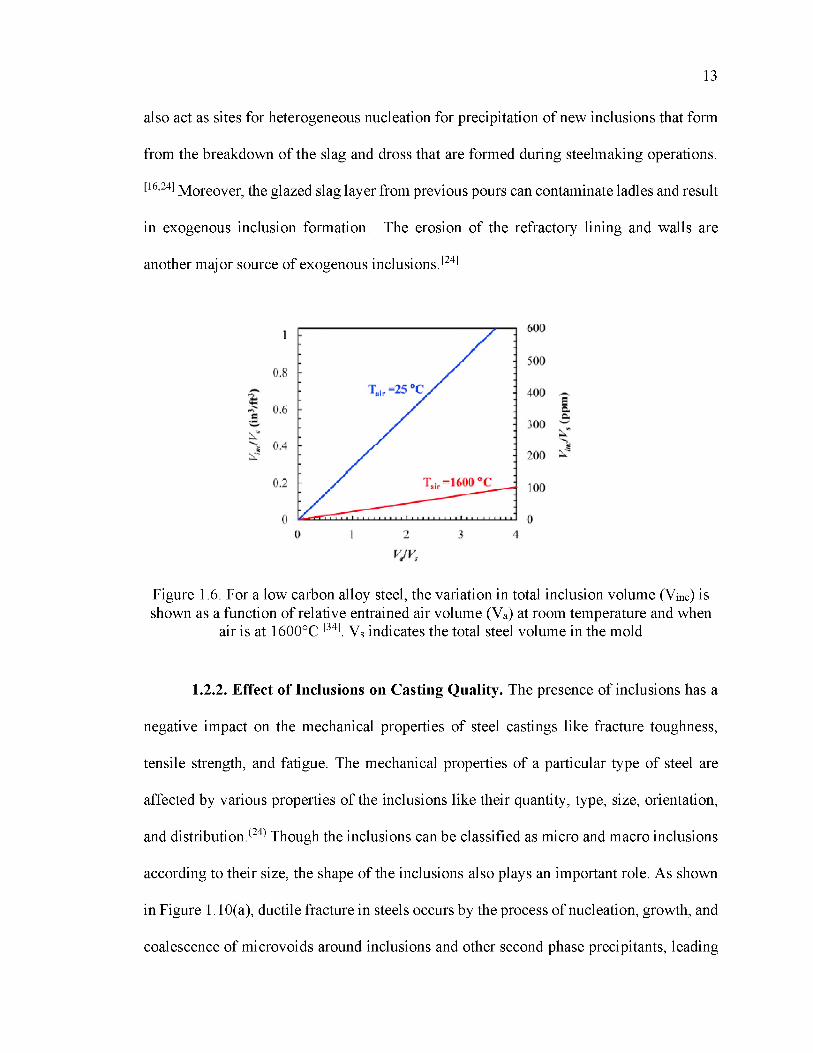
. The work done by AJ. Melendez et al. [33] showed the inclusion volume fraction
as a function of relative volume of entrained air, as observed in Figure 1.6, during mold
filling. For air at room temperature it is seen that 3.5 cubic feet of air is entrained per cubic
foot of steel during mold filling conditions. This leads to the presence of one cubic inch of
inclusions per cubic foot of steel for a low alloy steel [34]. The exogenous inclusions can
13
also act as sites for heterogeneous nucleation for precipitation of new inclusions that form
from the breakdown of the slag and dross that are formed during steelmaking operations.
[16,24] Moreover, the glazed slag layer from previous pours can contaminate ladles and result
in exogenous inclusion formation. The erosion of the refractory lining and walls are
another major source of exogenous inclusions.[24]
Figure 1.6. For a low carbon alloy steel, the variation in total inclusion volume (Vinc) is shown as a function of relative entrained air volume (Va) at room temperature and when
air is at 1600°C [34]. Vs indicates the total steel volume in the mold
1.2.2. Effect of Inclusions on Casting Quality. The presence of inclusions has a
negative impact on the mechanical properties of steel castings like fracture toughness,
tensile strength, and fatigue. The mechanical properties of a particular type of steel are
affected by various properties of the inclusions like their quantity, type, size, orientation,
and distribution/24 Though the inclusions can be classified as micro and macro inclusions
according to their size, the shape of the inclusions also plays an important role. As shown
in Figure 1.10(a), ductile fracture in steels occurs by the process of nucleation, growth, and
coalescence of microvoids around inclusions and other second phase precipitants, leading

14
to final fracture. If the steel matrix is ductile enough to accommodate the plastic strain,
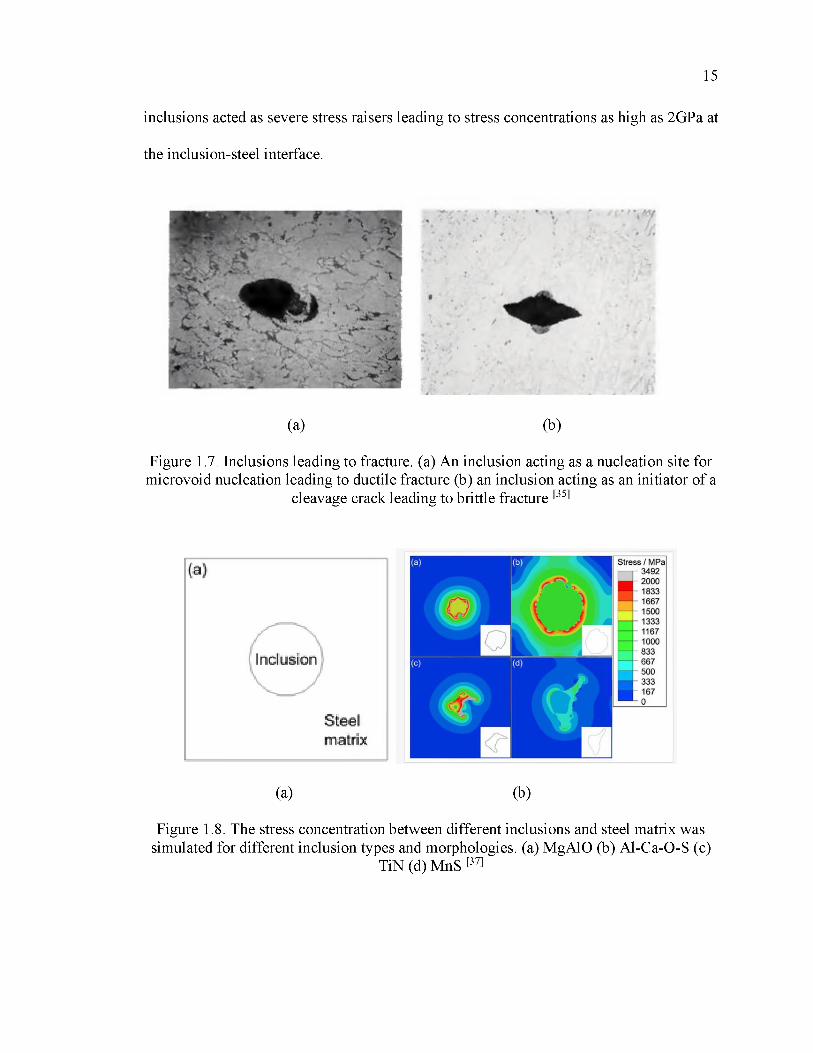
this will result in crack tip blunting during fracture as shown in Figure 1.7 (a). In the case
of brittle fracture, the presence of inclusions in the matrix, act as sites for cleavage crack
initiation as seen in Figure 1.7(b). [35] For steels with high strength and sufficient ductility,
such as quenched and tempered martensitic steels and FeMnAl steels, ductile fracture is
the predominant fracture mode.
Ductile fracture happens by the following steps:
• Nucleation of voids around hard particles in the matrix by cleavage or debonding
• Growth of voids caused by these failures
• Coalescing of voids and their joining with the main crack
This leads to a formation of a fractured surface with a fibrous appearance
characterized by dimples or cup and cone fracture.[36] For steels of similar microstructures
and chemistries, the fracture toughness is influenced by various factors that such as the
type, size, morphology, and distribution of inclusions as well as the solidification structure
and the segregation of impurities. Deoxidation practice and oxygen content plays a major
role because it affects the shape, morphology and distribution of inclusions.[16] The
presence of strong deoxidizers like aluminum promotes type II eutectic sulfides which have
a dendritic structure and are distributed as chain like formations along grain boundaries.
These sulfides act as extreme stress raisers and are associated with low ductility in steel.[21]
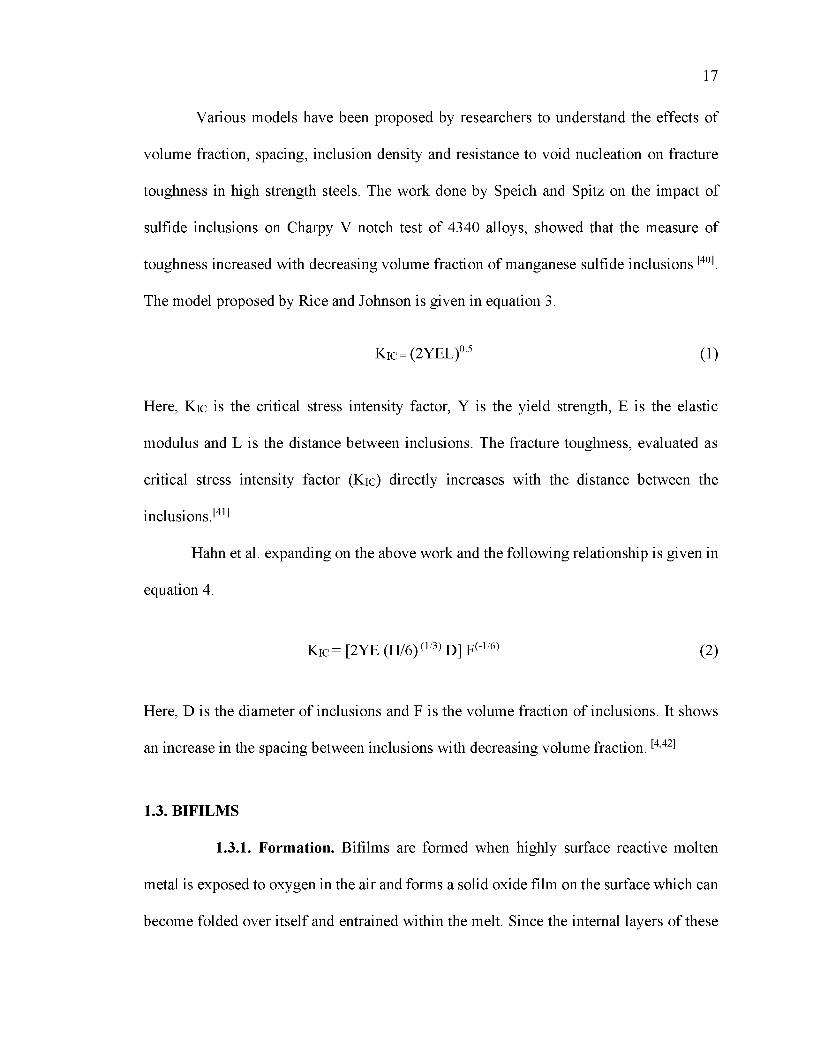
The work done by Chao Gu et al.(37), shows the stress distribution in the steel matrix around
simulated Mg-Al-O, Al-Ca-O-S, TiN and MnS inclusions as shown in Figure 1.8. It is
observed that the residual stress changes with the shape of the inclusion. Sharp edged
15
inclusions acted as severe stress raisers leading to stress concentrations as high as 2GPa at
the inclusion-steel interface.
(a) (b)
Figure 1.7. Inclusions leading to fracture. (a) An inclusion acting as a nucleation site for microvoid nucleation leading to ductile fracture (b) an inclusion acting as an initiator of a
cleavage crack leading to brittle fracture [35]
(a) (b)
Figure 1.8. The stress concentration between different inclusions and steel matrix was simulated for different inclusion types and morphologies. (a) MgAlO (b) Al-Ca-O-S (c)
TiN (d) MnS [37]

16
The nucleation of voids is therefore easier when the inclusion is hard and rigid and
angular or when the inclusion has low cohesion with the surrounding matrix. It is observed
that for hard and brittle inclusions, the void formation can be by inclusion fracture in the
plastic zone ahead of the crack tip or by decohesion at the interface of inclusion/matrix.[38].
Bartlett et al. showed that the presence of TiN inclusions in 4130 steels lead to brittle
fracture causing large void formation from fractured TiN that drastically reduced
toughness. Heats that were deoxidized with Ca or Al, displayed globular inclusions with
ductile fracture and higher dynamic fracture toughness. Reducing the inclusion content is
shown to increase resistance to void nucleation and improve mechanical properties of steel.
[4] The work by Knott et al., shows that decreasing the volume fraction of sulfide inclusions
increases the crack opening displacement of steel.[39]. The presence of small inclusions are
not as significant in crack initiation as very large inclusions are >5pm, although they do
encourage in crack propagation and low energy fracture when they are closely spaced as
seen in Figure 1.9.[38]
Figure 1.9. The nucleation of micro voids created by the presence of inclusions aiding in crack propagation and subsequent fracture [38]
17
Various models have been proposed by researchers to understand the effects of
volume fraction, spacing, inclusion density and resistance to void nucleation on fracture
toughness in high strength steels. The work done by Speich and Spitz on the impact of
sulfide inclusions on Charpy V notch test of 4340 alloys, showed that the measure of
toughness increased with decreasing volume fraction of manganese sulfide inclusions [40].
The model proposed by Rice and Johnson is given in equation 3.
K ic = (2YEL)05 (1)
Here, K ic is the critical stress intensity factor, Y is the yield strength, E is the elastic
modulus and L is the distance between inclusions. The fracture toughness, evaluated as
critical stress intensity factor (Kic) directly increases with the distance between the
inclusions.[41]
Hahn et al. expanding on the above work and the following relationship is given in
equation 4.
K ic = [2YE (n/6) (1/3) D] F(-1/6) (2)
Here, D is the diameter of inclusions and F is the volume fraction of inclusions. It shows
an increase in the spacing between inclusions with decreasing volume fraction. [4,42]
1.3. BIFILMS
1.3.1. Formation. Bifilms are formed when highly surface reactive molten
metal is exposed to oxygen in the air and forms a solid oxide film on the surface which can
become folded over itself and entrained within the melt. Since the internal layers of these
18
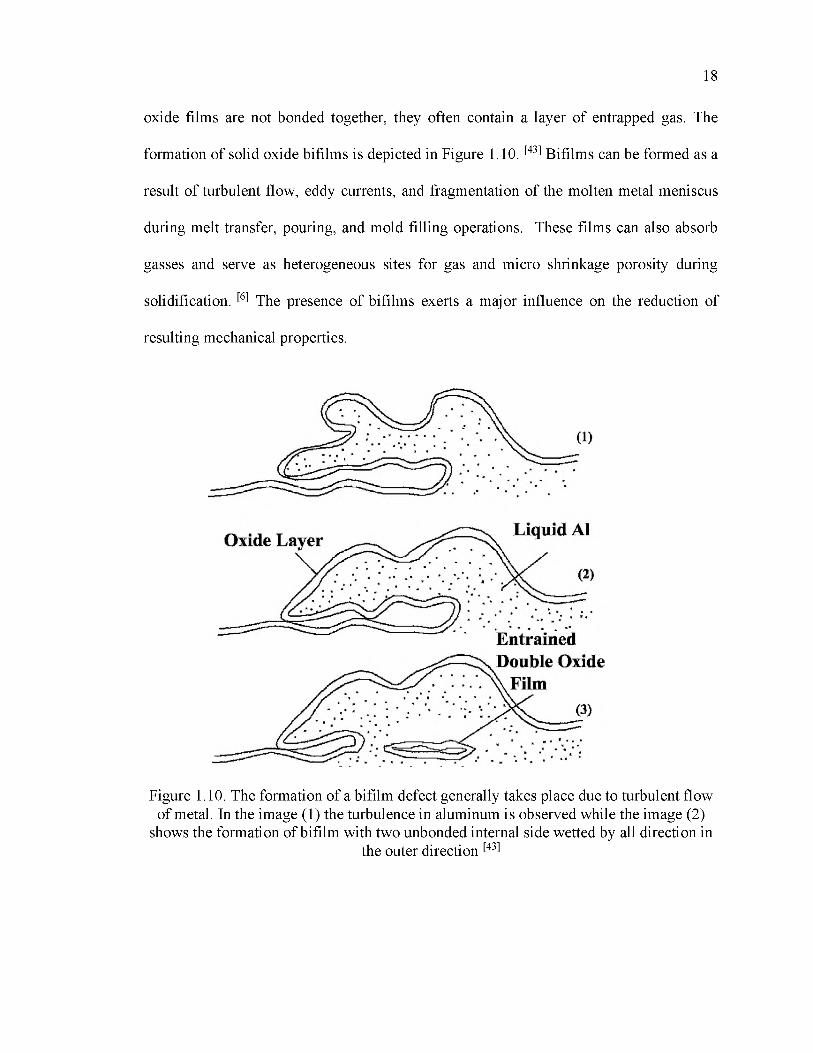
oxide films are not bonded together, they often contain a layer of entrapped gas. The
formation of solid oxide bifilms is depicted in Figure 1.10. [43] Bifilms can be formed as a
result of turbulent flow, eddy currents, and fragmentation of the molten metal meniscus
during melt transfer, pouring, and mold filling operations. These films can also absorb
gasses and serve as heterogeneous sites for gas and micro shrinkage porosity during
solidification. [6] The presence of bifilms exerts a major influence on the reduction of
resulting mechanical properties.
Liquid A1Oxide Layer
EntrainedDouble Oxide
Film
Figure 1.10. The formation of a bifilm defect generally takes place due to turbulent flow of metal. In the image (1) the turbulence in aluminum is observed while the image (2)
shows the formation of bifilm with two unbonded internal side wetted by all direction inthe outer direction [43]
19
Aluminum alloys are known to be especially sensitive to the formation of bifilm
defects during furnace charging, melt transfer, and pouring operations. These oxide biflms
are not able to readily float to the surface and be removed as well as discrete oxide particles.
The feature of an unbonded internal surface with a perfectly wetted outer surface is
a key component of bifilms.[8,44] Surface turbulence is a major reason for bifilm formation
and this is largely because of gravity pouring and creation of a plunging jet and poorly
designed gating or rigging systems that encourage turbulent filling and splashing. Each
time the surface of the liquid metal is broken, new surfaces are exposed to air leading to
high entrainment of gases. [45] The effect of pouring distance was studied by Pavlak et al.
on Al-7Si-Mg-Cu alloy. Pouring distance increases the velocity at the base of the
downsprue and increased amount of gas porosity and oxide film formation. [46]
Bifilms are formed in different shapes and sizes like tangled, network layer,
globular or strip clustered. They can appear as wrinkles on the casting surface or just
beneath the surface and are sometimes several millimeters in thickness depending on their
age. The young bifilms are characterized by their low thickness with only a few nanometers
and are formed with relatively short oxidation times.[8] Formation of MgO bifilms have
also been observed in ductile iron castings and can leads to cracking and failures. [7]
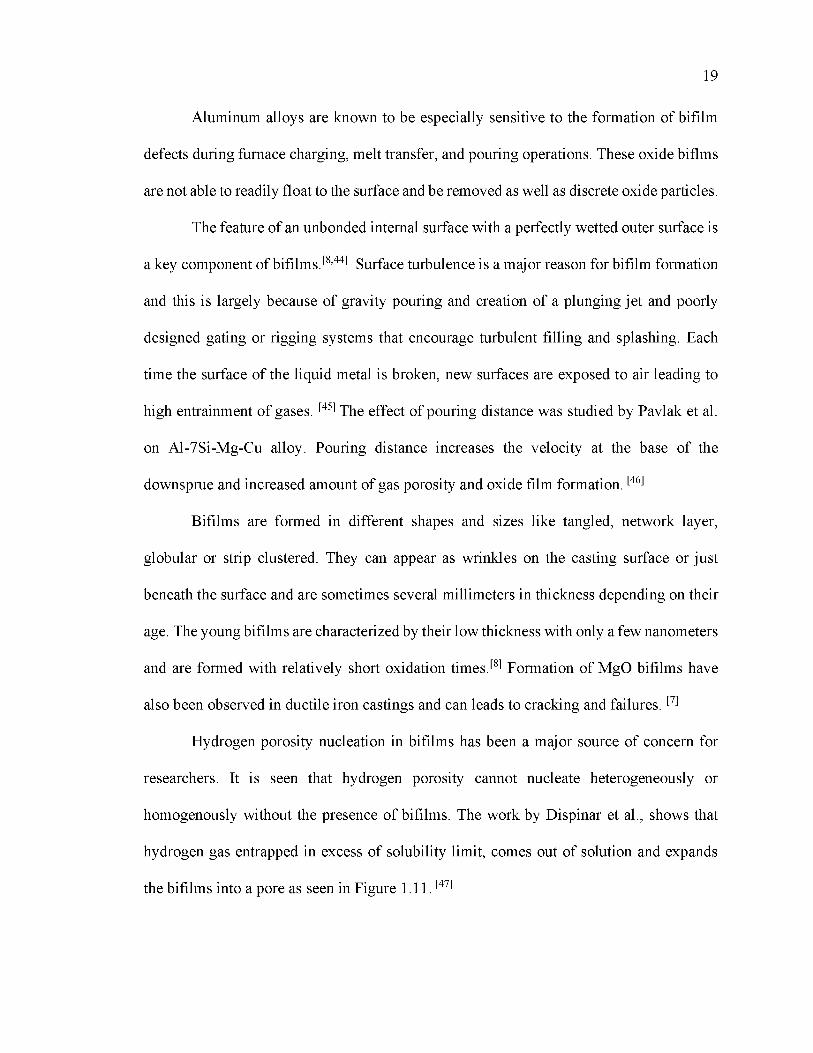
Hydrogen porosity nucleation in bifilms has been a major source of concern for
researchers. It is seen that hydrogen porosity cannot nucleate heterogeneously or
homogenously without the presence of bifilms. The work by Dispinar et al., shows that
hydrogen gas entrapped in excess of solubility limit, comes out of solution and expands
the bifilms into a pore as seen in Figure 1.11. [47]
20
Since the bifilms are formed in all size and shapes, these defects constitute some of
the most detrimental defects in castings. The work done by Griffith and Sayed, on gassed
and degassed Al-7Si-0.3Mg alloys shows that, the size of the oxide films was directly
related to the amount of H found in the castings. When H content was 0.18cm3/100g Al,
they found films of area 4mm2 while for 0.08cm3/100g Al the bifilm are area reduced to
1.8mm2.[48]
air <1JP
" r " OKI
c ^
Figure 1.11. Hydrogen induced porosity formation. (a) The bifilm observed with an air gap in the matrix (b) the formation of an dense and an thin layer of bifilm that is formed
because of pore expansion due to hydrogen diffusion or pressure change (c) The new enlarged area of the bifilm preventing its return to normal size [47]
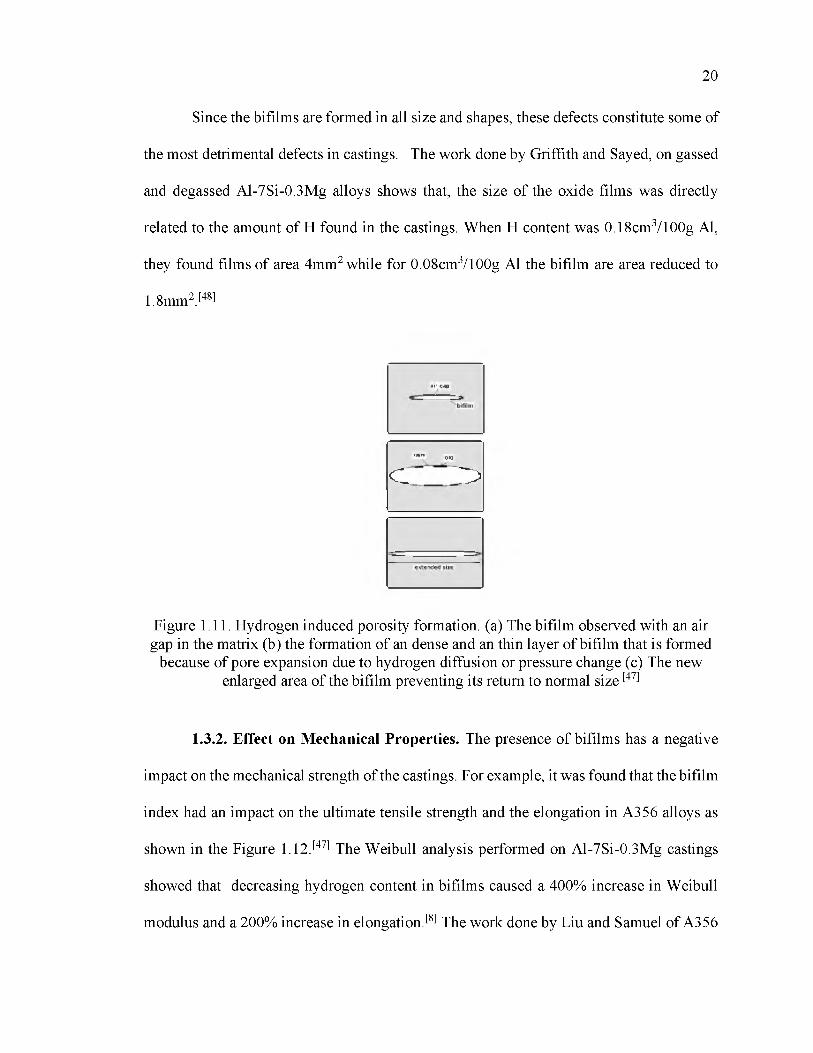
1.3.2. Effect on Mechanical Properties. The presence of bifilms has a negative
impact on the mechanical strength of the castings. For example, it was found that the bifilm
index had an impact on the ultimate tensile strength and the elongation in A356 alloys as
shown in the Figure 1.12.[47] The Weibull analysis performed on Al-7Si-0.3Mg castings
showed that decreasing hydrogen content in bifilms caused a 400% increase in Weibull
modulus and a 200% increase in elongation.[8] The work done by Liu and Samuel of A356
21
castings, established a linear relationship between the percentage elongation and log area
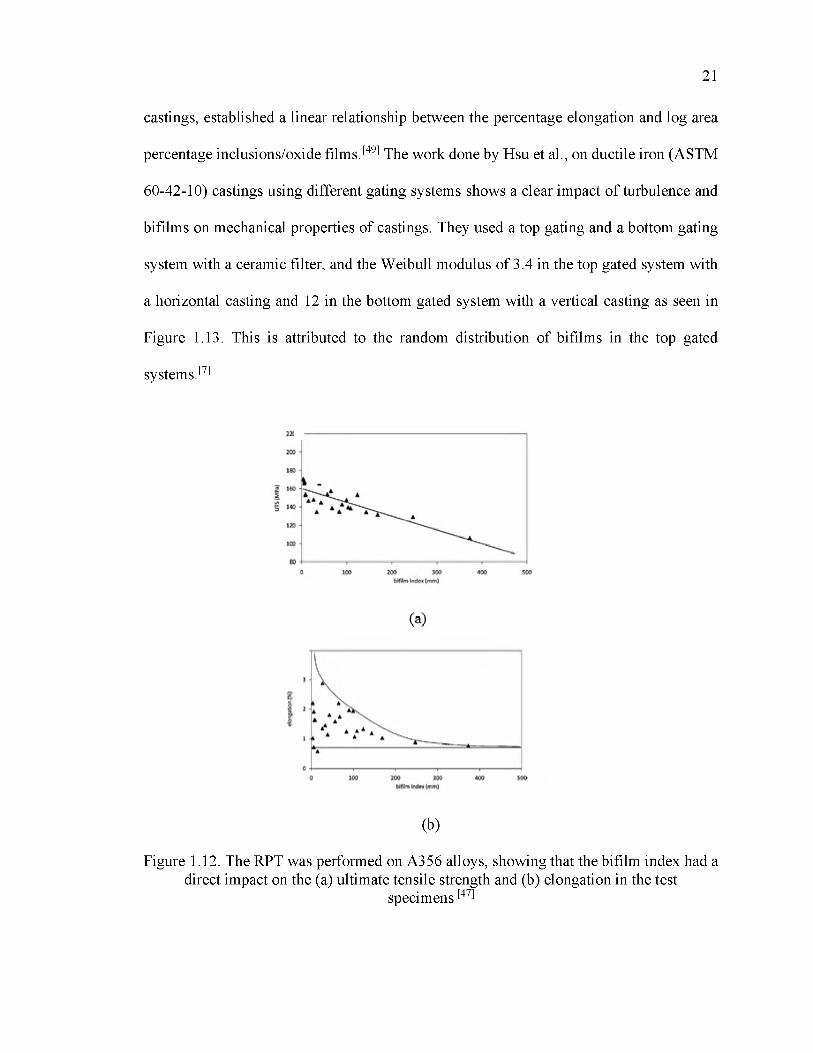
percentage inclusions/oxide films.[49] The work done by Hsu et al., on ductile iron (ASTM
60-42-10) castings using different gating systems shows a clear impact of turbulence and
bifilms on mechanical properties of castings. They used a top gating and a bottom gating
system with a ceramic filter, and the Weibull modulus of 3.4 in the top gated system with
a horizontal casting and 12 in the bottom gated system with a vertical casting as seen in
Figure 1.13. This is attributed to the random distribution of bifilms in the top gated
systems.[7]
(b)
Figure 1.12. The RPT was performed on A356 alloys, showing that the bifilm index had a direct impact on the (a) ultimate tensile strength and (b) elongation in the test
specimens [47]

22
Figure 1.13. The Weibull modulus for the top gated system is 3.4 while for the bottom gated system it was observed to be 12. The difference in elongation, was attributed to the
random distribution of bifilms in the top gated system [7]
In carbon steel castings, when right amount of deoxidizers (Al and Ca) are not used,
it leads to the generation of thick solid oxide films. [50] This causes deep folds constituting
of bifilms on the surface. When the surface oxide of the bifilm, is partially melted it gets
scrambled in the melt and transforms into a sticky ball which floats out easily.[51] When the
oxide film formed has a high melting temperature, it forms as a solid oxide film and gets
entrained in the liquid melt. Some authors have suggested that bifilms in steel are also
responsible for gas porosity and the resulting reduction in mechanical properties.[52] The
presence of these bifilms can act as cracks, initiating failure. As previously noted, bifilm
formation in FeMnAl steels can be problematic and is attributed to the high aluminum
content of these alloys.
23
1.4. HIGH MANGANESE HIGH ALUMINUM STEELS
The high manganese high aluminum steel or FeMnAl steel is a derivative of
austenitic manganese steel that was first developed by Sir Robert Hadfield in 1882.[53]
FeMnAl steels generally contain 0.7-1.4% carbon, 6-25% manganese and 5-12%
aluminum and possess properties like high toughness, high wear resistance, and oxidation
resistance.[12]
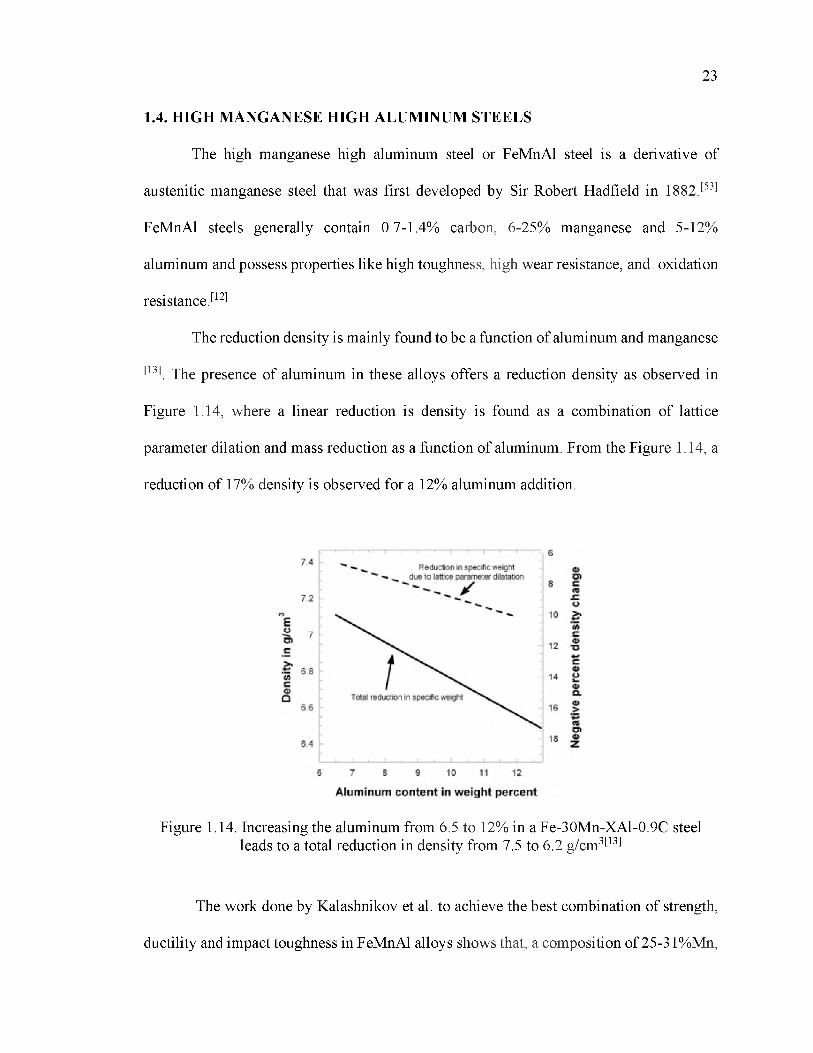
The reduction density is mainly found to be a function of aluminum and manganese
[13]. The presence of aluminum in these alloys offers a reduction density as observed in
Figure 1.14, where a linear reduction is density is found as a combination of lattice
parameter dilation and mass reduction as a function of aluminum. From the Figure 1.14, a
reduction of 17% density is observed for a 12% aluminum addition.
Figure 1.14. Increasing the aluminum from 6.5 to 12% in a Fe-30Mn-XAl-0.9C steel leads to a total reduction in density from 7.5 to 6.2 g/cm3[13]
The work done by Kalashnikov et al. to achieve the best combination of strength,
ductility and impact toughness in FeMnAl alloys shows that, a composition of 25-31%Mn,

24
6.2-9.7%Al, 0.7-1%C is optimum.[54] The addition of silicon is shown to prevent the
precipitation of P-Mn[55] while the addition of molybdenum was shown to mitigate the
impact of phosphorus on the fracture toughness in steel[56]. Thus, an alloy composition of
Fe-28-30Mn-9Al-1C-0.9Si-0.5Mo has been commonly used by researchers for
investigation. [57-59]
1.4.1. Composition and Heat Treatment. The strength of FeMnAl steel can be
greatly increased by the precipitation of K-carbides during aging. It was observed in
FeMnAl alloys that at sufficiently high carbon and Al concentration, these alloys age
hardened between 550-600°C providing a Brinell hardness between 345-475.[60,61]After
age hardening alloys with 20-35%Mn, 10%Al, and 0.4%-1.4%C four phases have been
identified ( austenite, ferrite, K-carbide, and P-Mn).[62]. Increased amounts of aluminum or
carbon is linked to higher volume fraction of k -carbide volume fraction while prolonged
aging leads to P-Mn precipitation and loss of tensile ductility.[63]. Homogenous
precipitation of K-carbide happens under 650°C, while above 650°C, heterogeneous
nucleation of K-carbide appears on grain boundaries. Between temperatures of 500-650°C,
the greatest strength in FeMnAl alloys have been reported and the aging temperature of
550°C has been commonly reported for alloys of composition Fe-30Mn-9Al-1C-0.9Si-
0.5Mo.[13,61,64]Before aging, the FeMnAl specimens are solution treated at temperatures of
1000°C or greater.[57]. For a FeMnAl alloy of composition Fe-30Mn-9Al-0.9C, 5-ferrite is
the primary phase followed by austenite formation well after the liquidus temperature of
1332°C. [65]In solution treated condition, an austenitic matrix with less than 10% ferrite
was observed. For a fully austenitic microstructure steel, yield strengths up to 700Mpa and
Charpy V notch toughness up to 200J have been observed. For an alloy composition of Fe-
25
32Mn-8.5Al-0.9C tensile strengths of up to 823Mpa with elongations of 64% have been
reported in the solution treated condition [66]. Solution treated steels have a higher impact
toughness but lower strength than the aged steels due to the precipitation of K-carbides in
aged specimens. K-carbide precipitation increases the strength and hardness in aged steels
but reduces impact toughness leading to brittle fracture in overaged steels. However, work
done by Van Aken et al. for a steel composition of Fe-30.4Mn-8.83Al-1.07Si-0.9C-0.53Mo
showed good combinations of both strength and toughness in underaged steels with
ultimate tensile strengths of 953Mpa and a CVN toughness of 37 J at -40°C. [68]
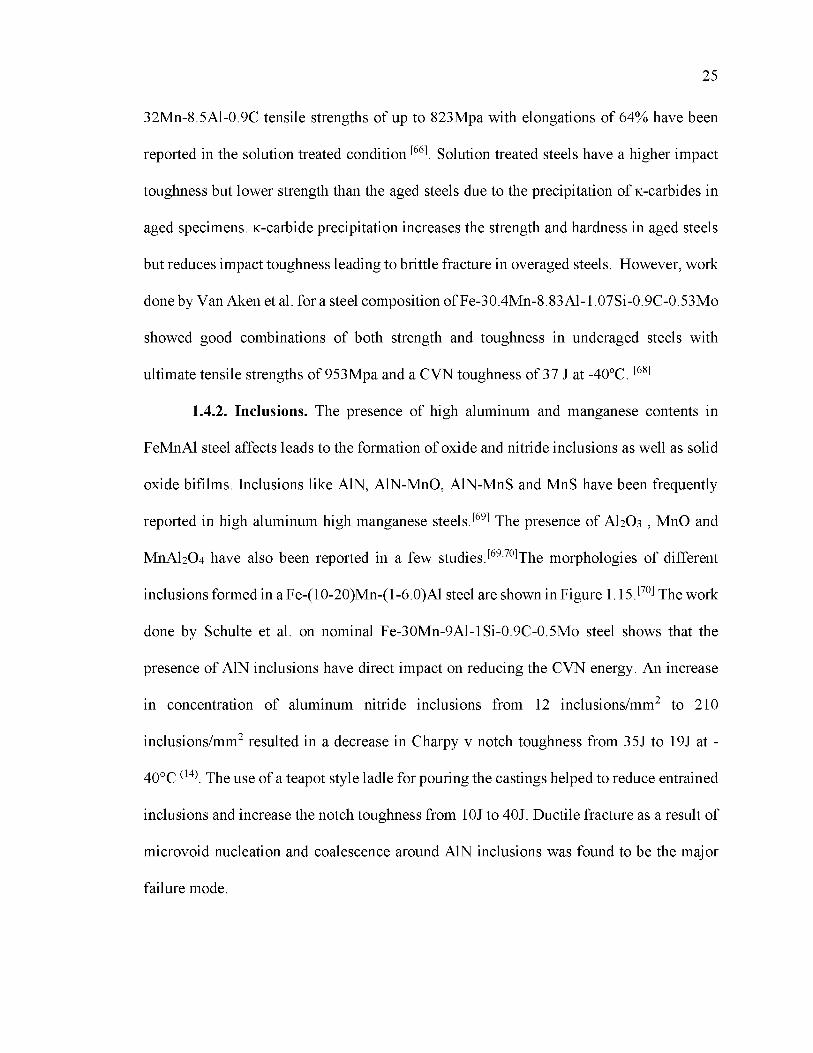
1.4.2. Inclusions. The presence of high aluminum and manganese contents in
FeMnAl steel affects leads to the formation of oxide and nitride inclusions as well as solid
oxide bifilms. Inclusions like AlN, AlN-MnO, AlN-MnS and MnS have been frequently
reported in high aluminum high manganese steels.[69] The presence of AhO 3 , MnO and
M nAhO4 have also been reported in a few studies.[69 70]The morphologies of different
inclusions formed in a Fe-(10-20)Mn-(1-6.0)Al steel are shown in Figure 1.15.[70] The work
done by Schulte et al. on nominal Fe-30Mn-9Al-1Si-0.9C-0.5Mo steel shows that the
presence of AlN inclusions have direct impact on reducing the CVN energy. An increase
in concentration of aluminum nitride inclusions from 12 inclusions/mm2 to 210
inclusions/mm2 resulted in a decrease in Charpy v notch toughness from 35J to 19J at -
40°C (14). The use of a teapot style ladle for pouring the castings helped to reduce entrained
inclusions and increase the notch toughness from 10J to 40J. Ductile fracture as a result of
microvoid nucleation and coalescence around AlN inclusions was found to be the major
failure mode.
26
Figure 1.15. Secondary electron images of the different inclusions identified by Park et al. in a Fe-(10-20) Mn-(1-6) Al composition steel [70]
1.5. FILTRATION
Refining of inclusions in steel is a process which has challenged steelmakers for a
long time and this process can be broadly classified as chemical and physical process.
While ladle refining can be classified as a chemical refining process, filtration is classified
as a physical refining process. Filters are widely used for both aluminum and steel castings
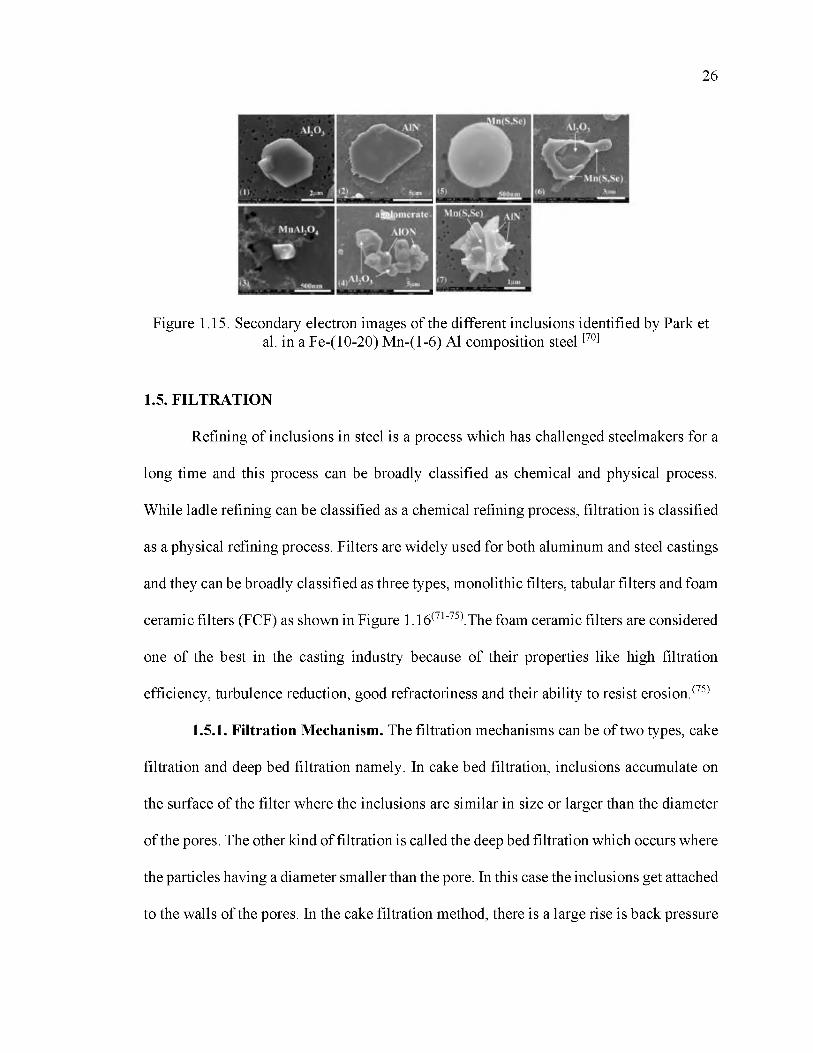
and they can be broadly classified as three types, monolithic filters, tabular filters and foam
ceramic filters (FCF) as shown in Figure 1.16(71-75).The foam ceramic filters are considered
one of the best in the casting industry because of their properties like high filtration
efficiency, turbulence reduction, good refractoriness and their ability to resist erosion.(75)
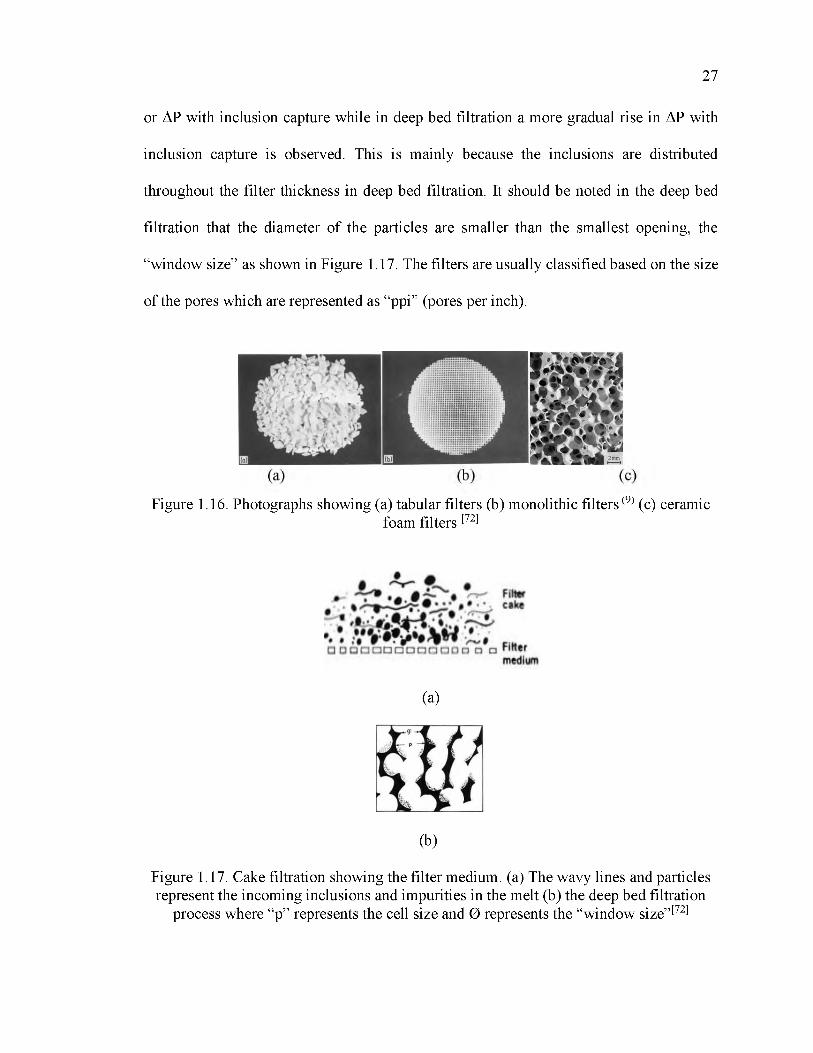
1.5.1. Filtration Mechanism. The filtration mechanisms can be of two types, cake
filtration and deep bed filtration namely. In cake bed filtration, inclusions accumulate on
the surface of the filter where the inclusions are similar in size or larger than the diameter
of the pores. The other kind of filtration is called the deep bed filtration which occurs where
the particles having a diameter smaller than the pore. In this case the inclusions get attached
to the walls of the pores. In the cake filtration method, there is a large rise is back pressure
27
or AP with inclusion capture while in deep bed filtration a more gradual rise in AP with
inclusion capture is observed. This is mainly because the inclusions are distributed
throughout the filter thickness in deep bed filtration. It should be noted in the deep bed
filtration that the diameter of the particles are smaller than the smallest opening, the
“window size” as shown in Figure 1.17. The filters are usually classified based on the size
of the pores which are represented as “ppi” (pores per inch).
Figure 1.16. Photographs showing (a) tabular filters (b) monolithic filters (9) (c) ceramicfoam filters [72]
(a)
(b)
Figure 1.17. Cake filtration showing the filter medium. (a) The wavy lines and particles represent the incoming inclusions and impurities in the melt (b) the deep bed filtration
process where “p” represents the cell size and 0 represents the “window size”[72]
28
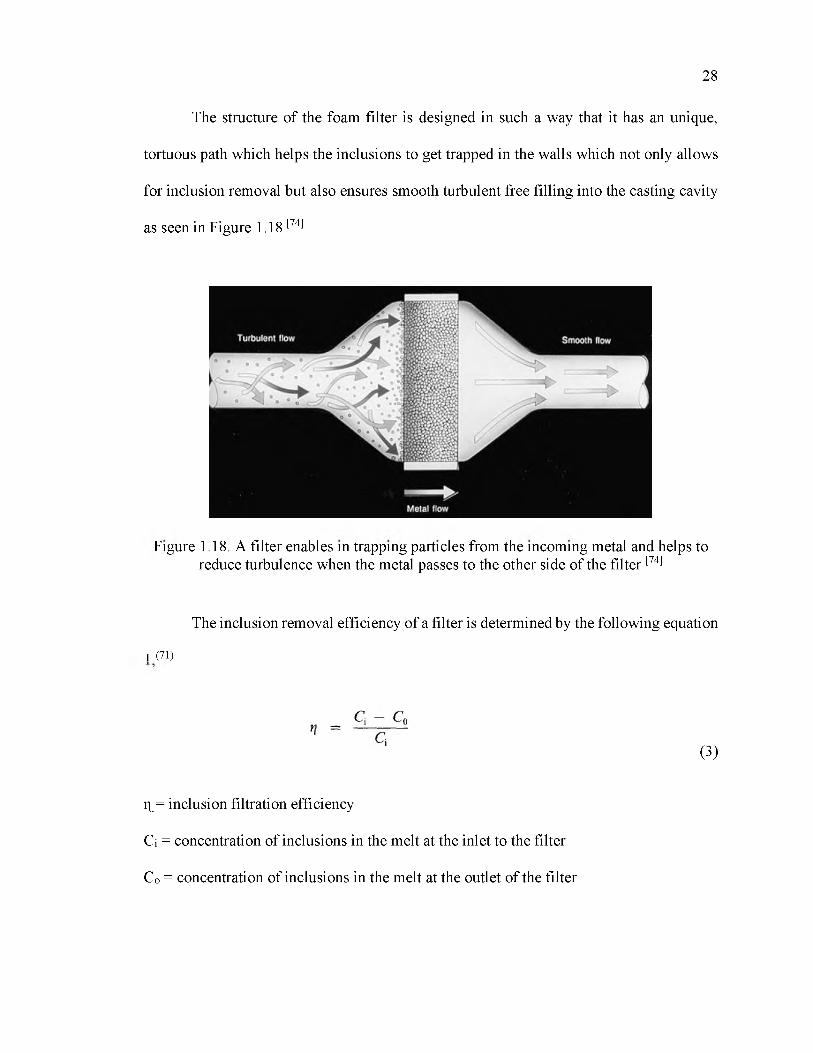
The structure of the foam filter is designed in such a way that it has an unique,
tortuous path which helps the inclusions to get trapped in the walls which not only allows
for inclusion removal but also ensures smooth turbulent free filling into the casting cavity
as seen in Figure 1.18 [74]
Figure 1.18. A filter enables in trapping particles from the incoming metal and helps to reduce turbulence when the metal passes to the other side of the filter [74]
The inclusion removal efficiency of a filter is determined by the following equation
1 (71)
(3)
q_ = inclusion filtration efficiency
Ci = concentration of inclusions in the melt at the inlet to the filter
Co = concentration of inclusions in the melt at the outlet of the filter
29
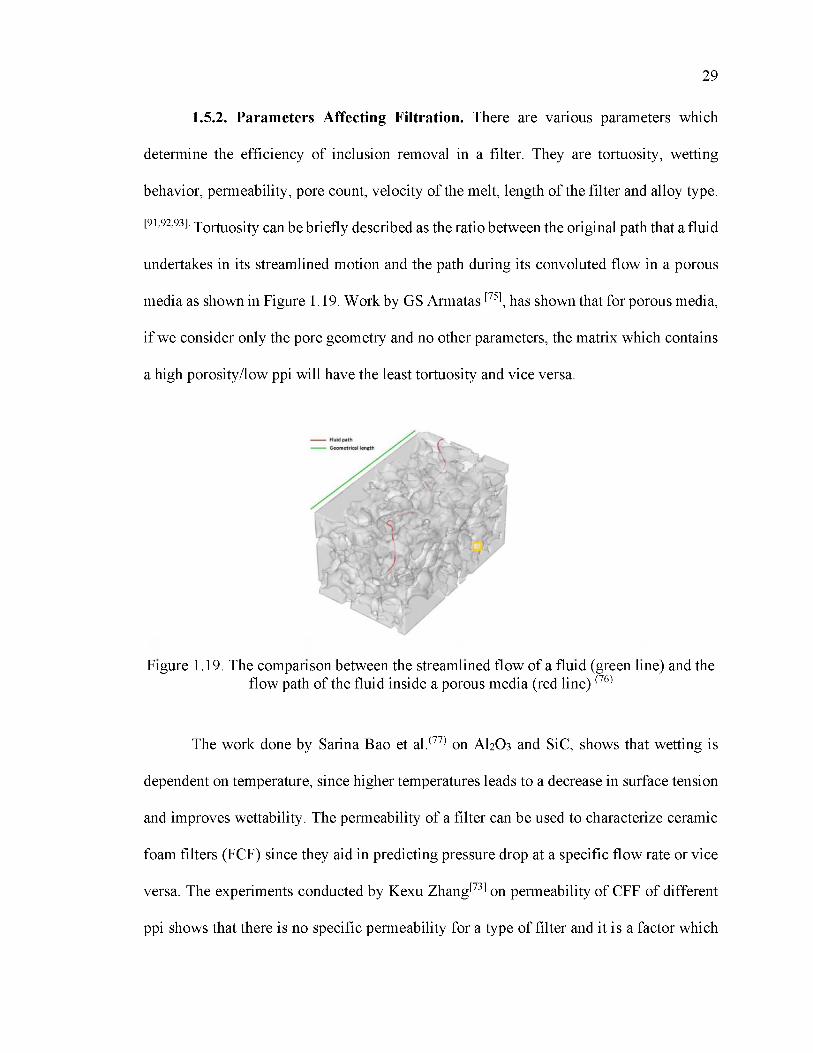
1.5.2. Parameters Affecting Filtration. There are various parameters which
determine the efficiency of inclusion removal in a filter. They are tortuosity, wetting
behavior, permeability, pore count, velocity of the melt, length of the filter and alloy type.
[91,92,93]. Tortuosity can be briefly described as the ratio between the original path that a fluid
undertakes in its streamlined motion and the path during its convoluted flow in a porous
media as shown in Figure 1.19. Work by GS Armatas [75], has shown that for porous media,
if we consider only the pore geometry and no other parameters, the matrix which contains
a high porosity/low ppi will have the least tortuosity and vice versa.
Figure 1.19. The comparison between the streamlined flow of a fluid (green line) and the flow path of the fluid inside a porous media (red line) (76)
The work done by Sarina Bao et al.(77) on AkO 3 and SiC, shows that wetting is
dependent on temperature, since higher temperatures leads to a decrease in surface tension
and improves wettability. The permeability of a filter can be used to characterize ceramic
foam filters (FCF) since they aid in predicting pressure drop at a specific flow rate or vice
versa. The experiments conducted by Kexu Zhang[73] on permeability of CFF of different
ppi shows that there is no specific permeability for a type of filter and it is a factor which
30
is expressed as a function of fluid flow. Regarding the effect of velocity of metal flow on
the filter, the equation derived by Apelian et al. as shown in the following equation (2). (71)
(4)
where, q. = filtration efficiency
K0 = kinetic parameter
L = length of the filter
Um = superficial melt velocity
The equation (2) shows that filtration efficiency increases at the melt velocity decreases
and the efficiency increases with increase in filter length.
1.6. GATING SYSTEM IN CASTINGS
A lot of research has been conducted over the years on understanding gating
systems and it has been observed that the size of and design of the flow patterns have an
impact on the final quality of the castings. The requirements that are essential for designing
a good gating system are as follows
• The mold must fill quickly to minimize air entrainment and prevent premature
freezing
• Reduction of turbulence in metal flow into the gates
• Prevention of reoxidation of metal in the casting
• Compatibility with the pouring system that is being used
• Removal of slag and dross defects entrained during filling

31
• Prevention of distortion and hot tearing during solidification
• Easy removal
• Maximization of casting yield
1.6.1. Components of a Gating System. In a gating or rigging system, the major
elements are the pouring basin, down sprue, sprue well, runner, gates and the casting as
shown in Figure 1.20.(78) Gating systems are the entrance path for molten metal into the
casting cavity and hence play a significant role in maintaining casting quality during
production.(79,80).
1.6.2. Pouring Cup. A pouring cup is the first point of contact from a ladle to the
mold and designing a good pouring cup is essential to avoid bubbles or splashing.
Traditionally, a conical cup is used which is simple and economical for small castings. But
in conical cups, the high velocity of the metal and the vortex effect leads to air aspiration
and oxide formation. [9] In an offset rectangular pouring basin as shown in Figure 1.21, the
initial metal falls directly into the basin first, allowing entrained air to rise and the flow to
stabilize, before rolling over a dam into the sprue. This also helps to separate the bubbles
and slag, which float to the top, from entering the sprue and minimizes metal spillage and
vortex formation. In this type of pouring basins, it is essential to keep the pouring basin
full, to prevent air and dross from entering the system. [9,10]. Figure 1.21(c), shows a direct
comparison in velocity between the three pouring basins where the offset pouring clearly
has a better flow velocity.[81]
1.6.3. Downsprue. The down sprue connects the pouring cup to the runners and
the gates. The sizing and shape of the sprue plays a major role in determining the final
quality of the casting. An oversized sprue affects metal quality by taking in air
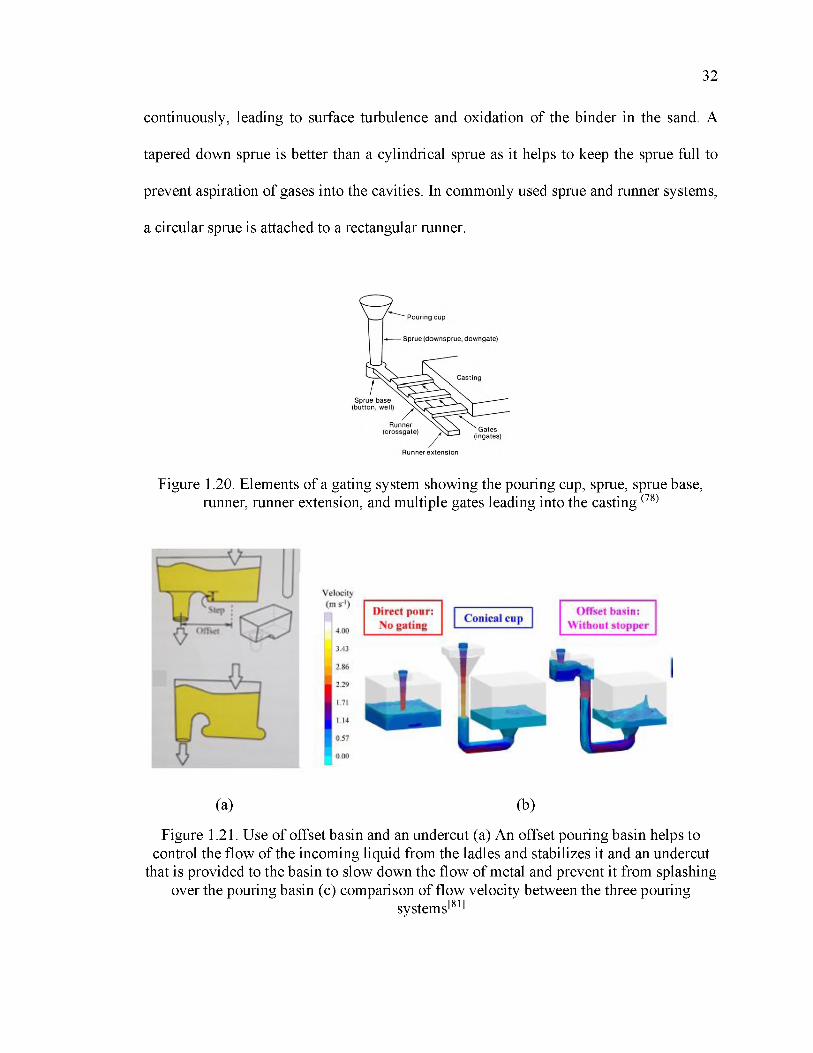
32
continuously, leading to surface turbulence and oxidation of the binder in the sand. A
tapered down sprue is better than a cylindrical sprue as it helps to keep the sprue full to
prevent aspiration of gases into the cavities. In commonly used sprue and runner systems,
a circular sprue is attached to a rectangular runner.
Figure 1.20. Elements of a gating system showing the pouring cup, sprue, sprue base, runner, runner extension, and multiple gates leading into the casting (78)
Velocitv(n \ s ' )
Direct p o u r Offset b a s in :Conical cupNo gating W ithout s topper4 Hi
(a) (b)
Figure 1.21. Use of offset basin and an undercut (a) An offset pouring basin helps to control the flow of the incoming liquid from the ladles and stabilizes it and an undercut
that is provided to the basin to slow down the flow of metal and prevent it from splashing over the pouring basin (c) comparison of flow velocity between the three pouring
systems[81]
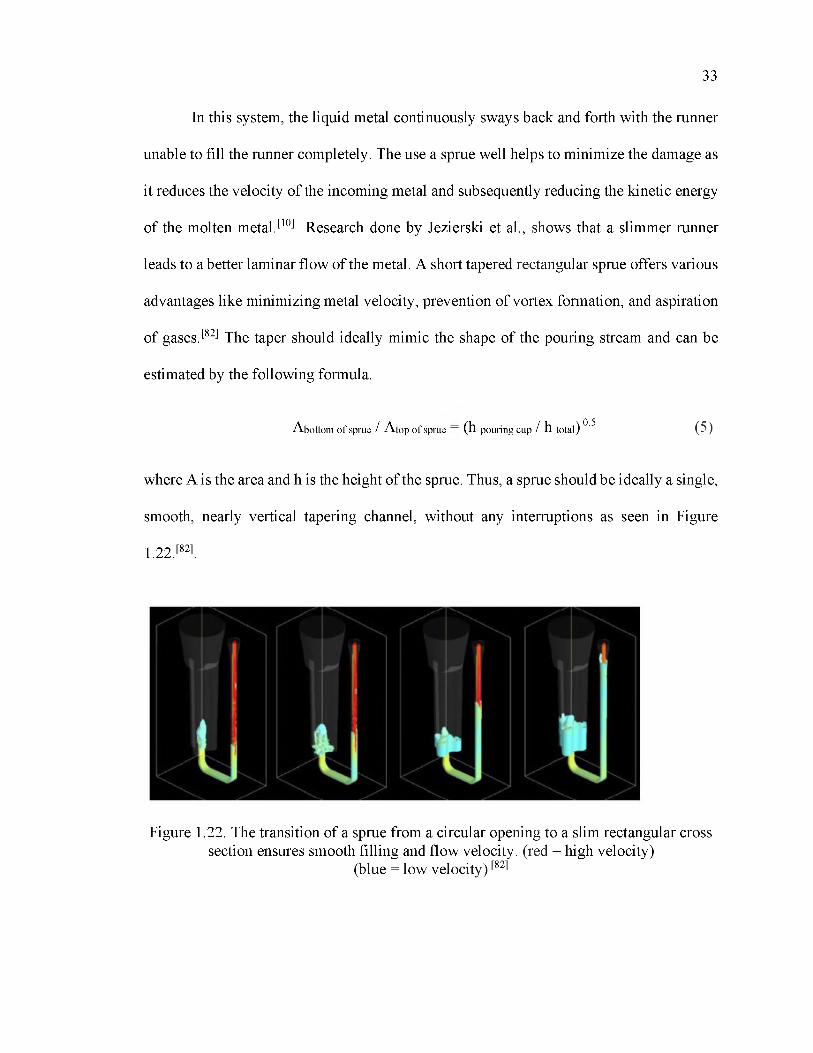
33
In this system, the liquid metal continuously sways back and forth with the runner
unable to fill the runner completely. The use a sprue well helps to minimize the damage as
it reduces the velocity of the incoming metal and subsequently reducing the kinetic energy
of the molten metal.[10] Research done by Jezierski et al., shows that a slimmer runner
leads to a better laminar flow of the metal. A short tapered rectangular sprue offers various
advantages like minimizing metal velocity, prevention of vortex formation, and aspiration
of gases.[82] The taper should ideally mimic the shape of the pouring stream and can be
estimated by the following formula.
Abottom of sprue / Atop of sprue (h pouring cup / h total) 0.5 (5)
where A is the area and h is the height of the sprue. Thus, a sprue should be ideally a single,
smooth, nearly vertical tapering channel, without any interruptions as seen in Figure
1.22.[82].
Figure 1.22. The transition of a sprue from a circular opening to a slim rectangular cross section ensures smooth filling and flow velocity. (red = high velocity)
(blue = low velocity) [82]
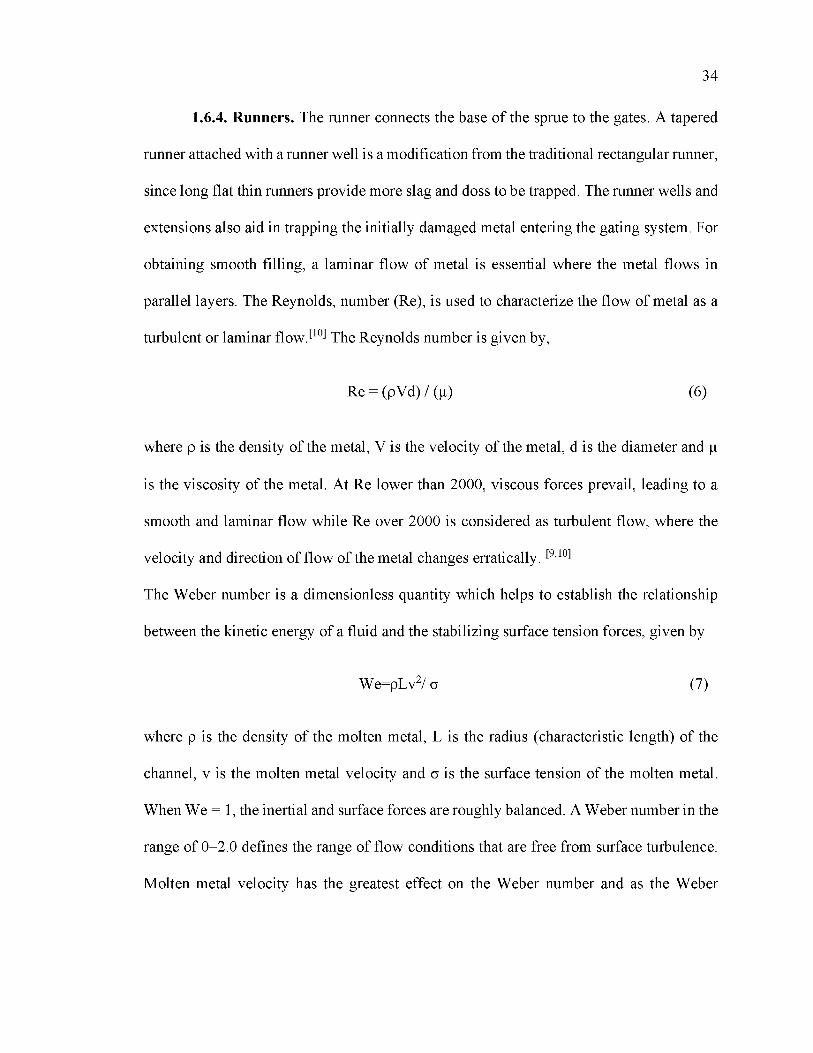
34
1.6.4. Runners. The runner connects the base of the sprue to the gates. A tapered
runner attached with a runner well is a modification from the traditional rectangular runner,
since long flat thin runners provide more slag and doss to be trapped. The runner wells and
extensions also aid in trapping the initially damaged metal entering the gating system. For
obtaining smooth filling, a laminar flow of metal is essential where the metal flows in
parallel layers. The Reynolds, number (Re), is used to characterize the flow of metal as a
turbulent or laminar flow.[10] The Reynolds number is given by,
Re = (pVd) / (p) (6)
where p is the density of the metal, V is the velocity of the metal, d is the diameter and p
is the viscosity of the metal. At Re lower than 2000, viscous forces prevail, leading to a
smooth and laminar flow while Re over 2000 is considered as turbulent flow, where the
velocity and direction of flow of the metal changes erratically. [9,10]
The Weber number is a dimensionless quantity which helps to establish the relationship
between the kinetic energy of a fluid and the stabilizing surface tension forces, given by
We=pLv2/ o (7)
where p is the density of the molten metal, L is the radius (characteristic length) of the
channel, v is the molten metal velocity and o is the surface tension of the molten metal.
When We = 1, the inertial and surface forces are roughly balanced. A Weber number in the
range of 0-2.0 defines the range of flow conditions that are free from surface turbulence.
Molten metal velocity has the greatest effect on the Weber number and as the Weber

35
number keeps increasing, the kinetic energy becomes more dominant leading to high
splashing turbulent flow of metal.[52]
1.6.5. Gating. Gating systems for horizontally parted sand molds are traditionally
designed using a gating ratio. The gating ratio is the ratio of the total cross-sectional area
of the sprue, total runners, and total gates, (A sprue: A runners: Agates). A gating system can be
classified as a pressurized or non-pressurized gating system depending on where the choke
is present. A choke is the smallest cross-sectional area and determines the rate at which the
liquid metal enters the mold. [52] For a non-pressurized system, the choke is present at the
base of the sprue. So, a non-pressurized system might have a gating ratio of 1: 3: 4. These
kind of gating systems are commonly used for aluminum and turbulent sensitive alloys.
The liquid metal at the base of the sprue comes at a very high velocity which is controlled
by the sprue well. Since the runners and gates have an area greater than the choke, the
velocity subsequently reduces, and the metal enters the gating smoothly in a laminar pattern
with low Reynolds number. [9,10]
For a pressurized system, the choke is present at the gates. Thus, a gating ratio,
something akin to 2:4:1 might be found for these kinds of systems. They are commonly
used for metals like gray iron which are not sensitive to damage and turbulence. Due to the
high velocity and turbulence, these alloys experience oxidation and mold erosion higher
than the non-pressurized system. The violent mixing of the metal inside these systems also
leads to slag and dross accumulation and gas porosity.[10]
Due to increased demand for better quality castings and to avoid the formation of
bubbles, bifilms and reoxidation defects, new gating systems have been developed which
are discussed below. The presence of an extended runner with a runner well, helps in
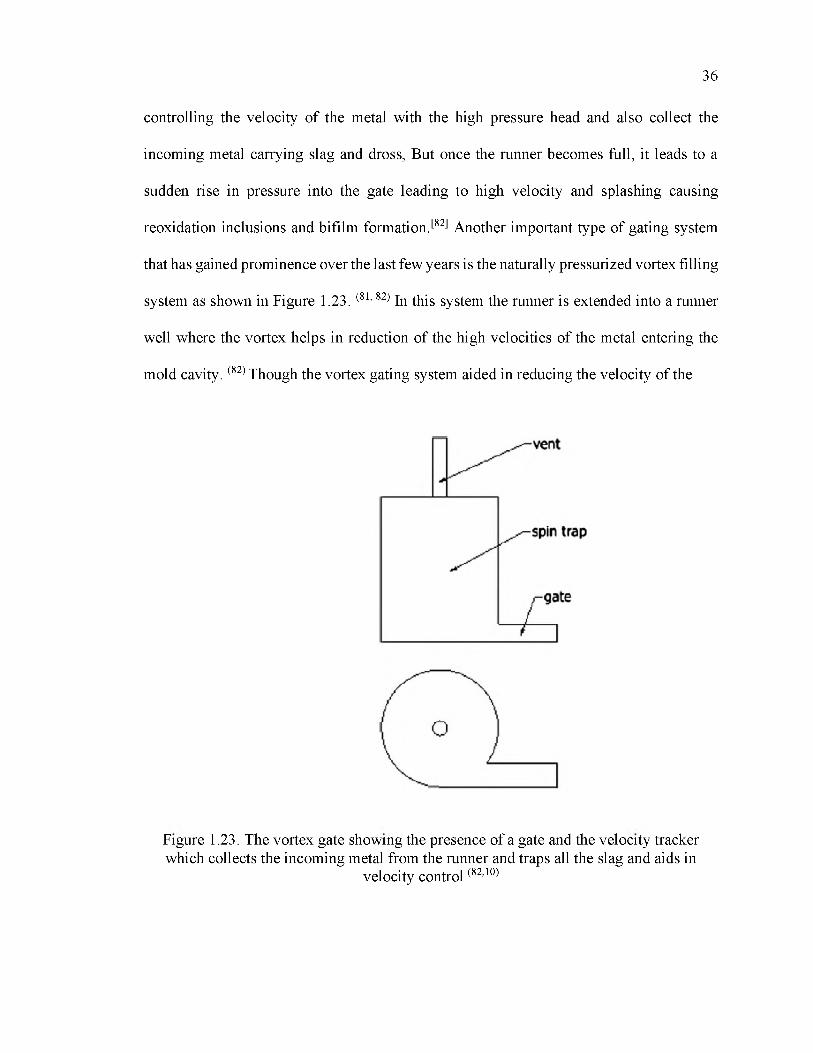
36
controlling the velocity of the metal with the high pressure head and also collect the
incoming metal carrying slag and dross, But once the runner becomes full, it leads to a
sudden rise in pressure into the gate leading to high velocity and splashing causing
reoxidation inclusions and bifilm formation.[82] Another important type of gating system
that has gained prominence over the last few years is the naturally pressurized vortex filling
system as shown in Figure 1.23. (81, 82) In this system the runner is extended into a runner
well where the vortex helps in reduction of the high velocities of the metal entering the
mold cavity. (82) Though the vortex gating system aided in reducing the velocity of the
Figure 1.23. The vortex gate showing the presence of a gate and the velocity tracker which collects the incoming metal from the runner and traps all the slag and aids in
velocity control (82,10)
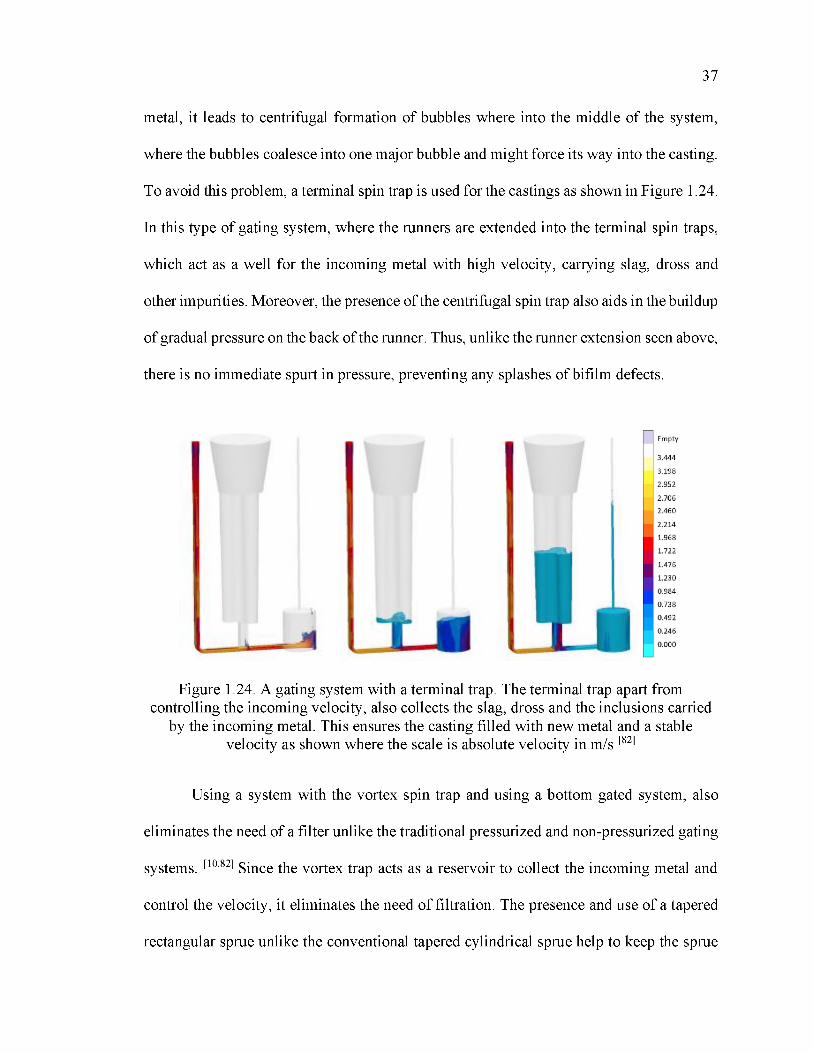
37
metal, it leads to centrifugal formation of bubbles where into the middle of the system,
where the bubbles coalesce into one major bubble and might force its way into the casting.
To avoid this problem, a terminal spin trap is used for the castings as shown in Figure 1.24.
In this type of gating system, where the runners are extended into the terminal spin traps,
which act as a well for the incoming metal with high velocity, carrying slag, dross and
other impurities. Moreover, the presence of the centrifugal spin trap also aids in the buildup
of gradual pressure on the back of the runner. Thus, unlike the runner extension seen above,
there is no immediate spurt in pressure, preventing any splashes of bifilm defects.
Figure 1.24. A gating system with a terminal trap. The terminal trap apart from controlling the incoming velocity, also collects the slag, dross and the inclusions carried
by the incoming metal. This ensures the casting filled with new metal and a stable velocity as shown where the scale is absolute velocity in m/s [82]
Using a system with the vortex spin trap and using a bottom gated system, also
eliminates the need of a filter unlike the traditional pressurized and non-pressurized gating
systems. [10,82] Since the vortex trap acts as a reservoir to collect the incoming metal and
control the velocity, it eliminates the need of filtration. The presence and use of a tapered
rectangular sprue unlike the conventional tapered cylindrical sprue help to keep the sprue
38
fill up with metal faster, thus keeping it full to avoid any gases being aspired into the system
or bubbling to take place.
1.6.6. Riser/Feeder. Risers are feeders are designed to ensure that the casting is fed
with metal completely and to prevent hotspot formation. To feed the casting effectively, a
riser must have a longer solidification time than the casting and prevention of heat loss is
an important consideration. Risers can be either top risers or side risers depending on their
placement. Since the riser must feed the casting completely, it is ensured that the volume
of the riser is at least 1.2 times the volume of the casting and external sleeves is available
in risers to prevent heat loss. [9,10]
Using the above methods and results from previous researchers [9,10,81,82], an off step
pouring basin with an undercut followed by a rectangular down sprue to enable laminar
flow of metal would be an optimum choice. The presence of a vortex terminal trap to collect
the incoming metal, slag and dross, to ensure smooth filling of metal in the bottom gated
system, would be an ideal system of choice for the steel maker to obtain quality castings.
Since the slag and dross are collected by the terminal spin trap this eliminates the necessity
to use a filter.
39
PAPER
I. FILTRATION EFFICIENCY OF INCLUSIONS IN LIGHTWEIGHT FeMnAlSTEELS
K. Balasubramanian,1L.N. Bartlett,1 R.J. O’Malley,1 S. Chakraborty1, and M. Xu2
1Missouri University of Science and Technology, Rolla, MO and 2Georgia SouthernUniversity, Statesboro, GA
Keywords: FeMnAl steel, non-metallic inclusions, filtration, bifilms
ABSTRACT
The efficiency of ceramic foam filters in removing different inclusion populations
in a Fe-30Mn-9Al-1Si-0.9C-0.5 Mo steel was investigated. A mold design was created
utilizing fluid flow and solidification modelling software. The design utilized a common
pouring cup attached to two different but balanced gating systems. One runner utilized a
ceramic foam filter while the other runner was unfiltered. Three molds were poured in
sequence from a teapot style ladle. Metallographic samples revealed extensive Al and Mn
rich oxide bifilms in samples taken before the filter. Samples sectioned after the filter did
not contain bifilms. AlN or complex AlN-MnS or AlN-MnO comprised more than 70% of
all inclusions. Samples sectioned from the first two molds showed an inclusion removal
efficiency of 38% and 39%, respectively. Larger inclusions greater than 3^m were more
efficiently filtered. The third mold with the greatest number of larger inclusions showed
the highest inclusion removal efficiency of 55%.

40
1. INTRODUCTION
Lightweight high strength steel with aluminum contents between 4-12wt.%Al have
found applications for military vehicles as well as in the automotive sector because of a
combination of low density, high strength, and good toughness. Fully austenitic cast steels
of composition Fe-30Mn-9Al-0.9C-1.0Si-0.5Mo offer almost a 15% lower density
compared to quenched and tempered SAE 4130 cast steels with equivalent strengths and
dynamic fracture toughness.1 It should be noted that all compositions in the following study
are in weight percent unless otherwise stated.
1.1. NON-METALLIC INCLUSIONS IN FeMnAl STEELS
Internal defects in FeMnAlC steels such as microporosity and the presence of
faceted aluminum nitride inclusions are a major contributor for loss of toughness in these
steels.2 A high aluminum content of 5-12% is also responsible for the formation of solid
oxide bifilms that can be entrained during pouring and filling and this has been linked to
a significant loss in tensile strength, ductility and fatigue life in aluminum castings.3 Studies
by Schulte et al.4 show that the population density of AlN inclusions directly affects the
impact properties of a Fe-30Mn-9Al-1Si-0.9C-0.5Mo. In the solution treated and aged
condition, Charpy V notch (CVN) toughness at -40°C decreased from 35J to 19J as the
concentration of AlN increased from 12 inclusions/mm2 to 210 inclusions/mm2.4 Clean
steelmaking practices using argon cover can help reduce nitrogen pickup. However, high
nitrogen in charge materials, exposure to air during metal transfer as well as during pouring
and filling always results in a significant amount of AlN inclusions in these castings.
41
1.2. FILTRATION
There have been constant efforts in foundries to increase cleanliness and reduce
inclusions in both high and low alloy steel castings. The use of foam ceramic filters (FCF)
is currently one of the best engineering solutions for increasing metal cleanliness and
reducing velocity and turbulence during mold filling. The cellular structure of foam
ceramic filters results in deep bed filtration leading to attachment of inclusions within the
porous network. The forces of adhesion, that is good wettability, and the presence of a large
specific area within the foam filter improves the efficiency of non-metallic inclusion
removal.5 The porous cellular structure that is present in a FCF plays a major role since it
provides a high surface area and torturous flow path that increases the coefficient of mass
transfer between the metal and filter surface.6 Filtration of alumina inclusions using
ceramic filters has been studied by Apelian et al. for a steel composition of Fe-0.012C-
0.04Ni between with between 12-20ppm of oxygen. It was shown that inclusions greater
than 2.5gm were trapped by the filter.7 In the study by Tian et al. on steels consisting of
composition Fe-0.66Mn-0.005P-0.29C-0.095Cu-0.092Cr-0.001Mo, zirconia filters were
shown to have up to a 90% removal efficiency for alumina inclusions.8
The filtration efficiency expression for liquid metal filtration can be expressed as:
n = (Ci-Co)/Ci (1)
where n = inclusion removal efficiency
Ci = concentration of inclusions at inlet of the filter
Co= concentration of inclusions at the outlet of the filter.7
42
The use of FCFs in castings has been shown to increase the yield of the castings,
reduce the rejection rate, and improve the machinability of the casting.6 The use of filters
gives improvement in the yield and quality of steel castings and understanding of how
inclusions in FeMnAlC steels are filtered by these filters is of high priority. Although there
has been some work published on the filtration of alumina inclusions utilizing foam filters,
the effectiveness of these filters in inclusion removal of FeMnAl steel castings has not been
investigated. The goal of this study is to determine the inclusion filtration efficiency of
ceramic foam filters at removing different inclusion populations and oxide bifilms from a
Fe-30Mn-9Al-0.9C-1Si-0.5Mo steel. In this regard, a mold was designed that allowed
balanced filling of two identical Y-block castings in the same mold that were attached to
two different but balanced rigging systems. One side of the gating systems included a 10
ppi (pores per inch) zirconia ceramic foam filter while the other side was unfiltered. In the
current study the effectiveness of ceramic foam filters at removing different inclusion
populations from the melt was evaluated directly from the filter inlet and outlet in the
runner utilizing a scanning electron microscope with automated feature analysis. The effect
of pouring order on the filtration efficiency was also determined in this study. Subsequent
investigations will be performed to determine the effect of filtration on casting quality and
mechanical properties.
2. METHODOLOGY
The solidification software MagmaSoft (5.3) was used to design the mold. The
design of the mold and experimental procedure has been adapted from the paper by
Chakraborty et al.9 The design consisted of two modified Y-block castings, where one of
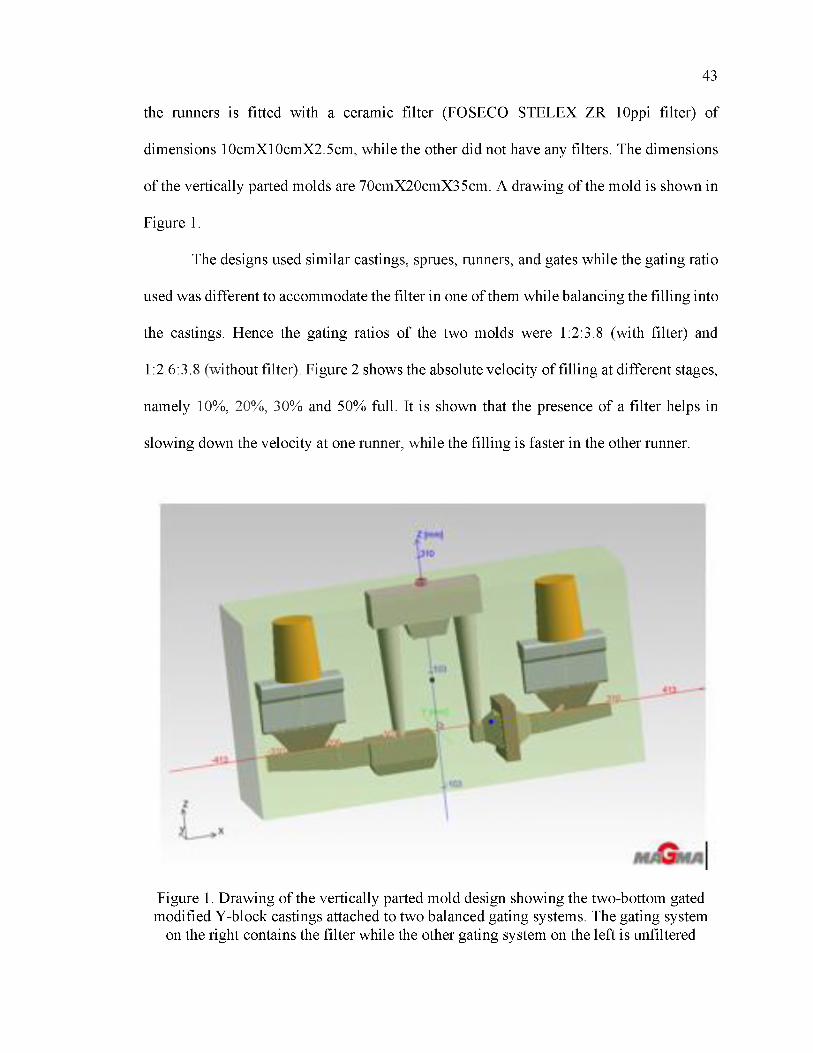
43
the runners is fitted with a ceramic filter (FOSECO STELEX ZR 10ppi filter) of
dimensions 10cmX10cmX2.5cm, while the other did not have any filters. The dimensions
of the vertically parted molds are 70cmX20cmX35cm. A drawing of the mold is shown in
Figure 1.
The designs used similar castings, sprues, runners, and gates while the gating ratio
used was different to accommodate the filter in one of them while balancing the filling into
the castings. Hence the gating ratios of the two molds were 1:2:3.8 (with filter) and
1:2.6:3.8 (without filter). Figure 2 shows the absolute velocity of filling at different stages,
namely 10%, 20%, 30% and 50% full. It is shown that the presence of a filter helps in
slowing down the velocity at one runner, while the filling is faster in the other runner.
Figure 1. Drawing of the vertically parted mold design showing the two-bottom gated modified Y-block castings attached to two balanced gating systems. The gating system
on the right contains the filter while the other gating system on the left is unfiltered

44
Flow through the ingates of the castings takes place at a velocity of less than 0.44
m/s which is lower than the critical velocity of 0.45 m/s recommended by Campbell to
minimize any air entrainment and reoxidation defects.10 Figure 3 shows the temperature at
the end of filling for the steel. The steel was poured at a temperature of 1519°C. Figure 3
shows the temperature profile just after filling with all temperatures in the casting and
rigging system above 1450°C. The liquidus temperature for this composition of steel was
determined utilizing Thermocalc thermodynamic modeling software to be 1338°C. Figures
2 and 3 indicate that the filling of the casting happened at an absolute velocity which was
less than the critical velocity and at the end of the pour all the parts of the casting had a
temperature higher than the liquidus, therefore avoiding any problems regarding premature
solidification.
Thermodynamic modelling for the Fe-30Mn-9Al-1Si-0.9C-0.5Mo steel
composition was performed using the Thermo-Calc 2017a software. Figure 4 shows the
phases that form as a function of equilibrium cooling. The steel was modeled with 0.007%
N, 0.005% O, and 0.005% S in order to determine the stability of different inclusions.
Figure 4 also shows stable precipitation of AhO3 (corundum) and AlN at temperatures well
above the liquidus. MnS forms below the liquidus temperature during solidification. It
should be noted that sulfur tends to highly segregate to interdendritic regions and this can
increase the stability of MnS during solidification of FeMnAlC steels.11
High purity induction iron, ferrosilicon, ferromolybdenum, electrolytic manganese,
high purity aluminum and high purity graphite were melted in a coreless 90.7kg (200lb)
ferrous capacity induction furnace under argon cover with a flow rate of 25 SCFH.
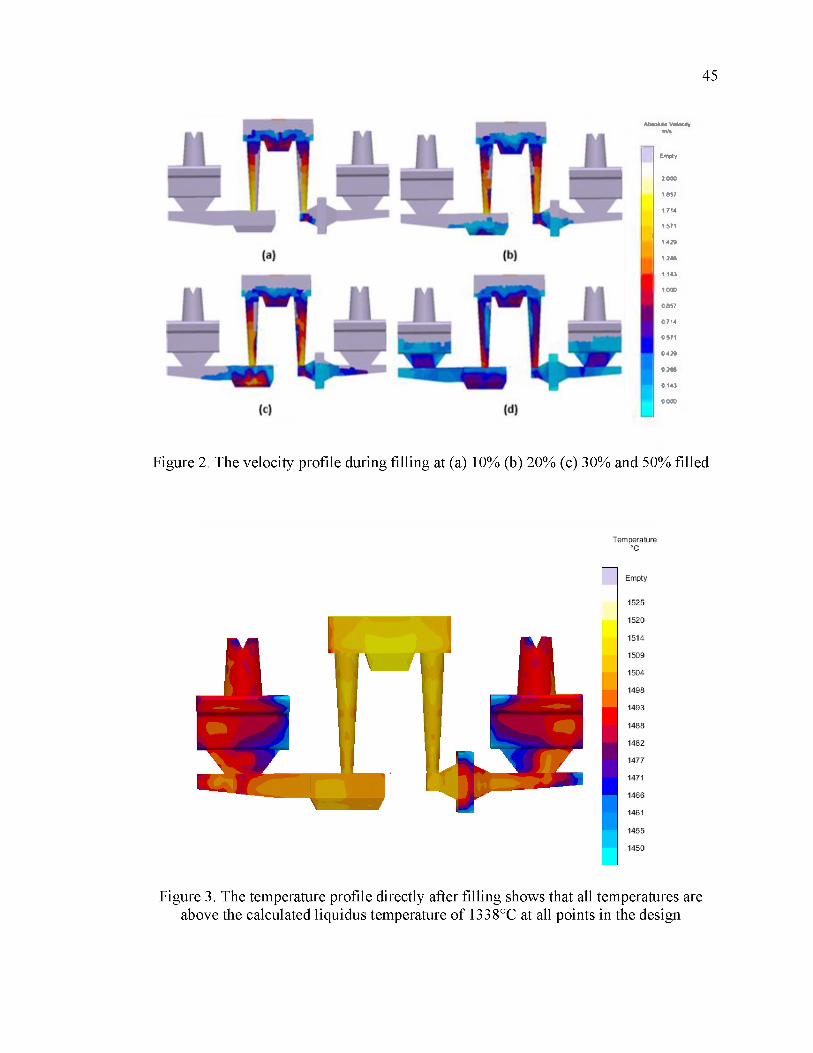
45
AfiaoU* Valoctfymf%
Eirf«>
2000
1837
1714
1571
1 429
1286
1 143
1000
0857
0714
0571
0429
0286
0143
0000
Figure 2. The velocity profile during filling at (a) 10% (b) 20% (c) 30% and 50% filled
Figure 3. The temperature profile directly after filling shows that all temperatures are above the calculated liquidus temperature of 1338°C at all points in the design

46
Figure 4. Thermodynamic modeling of the equilibrium solidification of a Fe-30Mn-9Al- 1Si-0.9C-0.5Mo steel with 0.007% N, 0.005% O, and 0.005% S. AlN and M 2O3 are
stable in the liquid well above the liquidus. MnS forms after the liquidus duringsolidification
The target chemistry was Fe-30%Mn-9% Al-1%Si- 0.9%C-0.5%Mo. The mass of
the total charge was 160lb (72.56kg). The molten metal was tapped at 1630°C into a teapot
style ladle which was used to pour the metal into the three molds. The first mold consisted
of metal poured from the bottom one-third of the ladle while the second mold consisted of
metal from the middle of the ladle. The last mold was poured from the metal at the top of
the ladle.
Specimens were sectioned for microstructural and inclusion analysis at a distance
of 10 mm from the inlet and outlet side of the filter as shown in Figure 5(b). The chemistry
analysis was performed by optical emission arc spectroscopy and combustion analysis
using the LECO CS 500 for carbon and sulfur and a LECO TC 600 for determining the
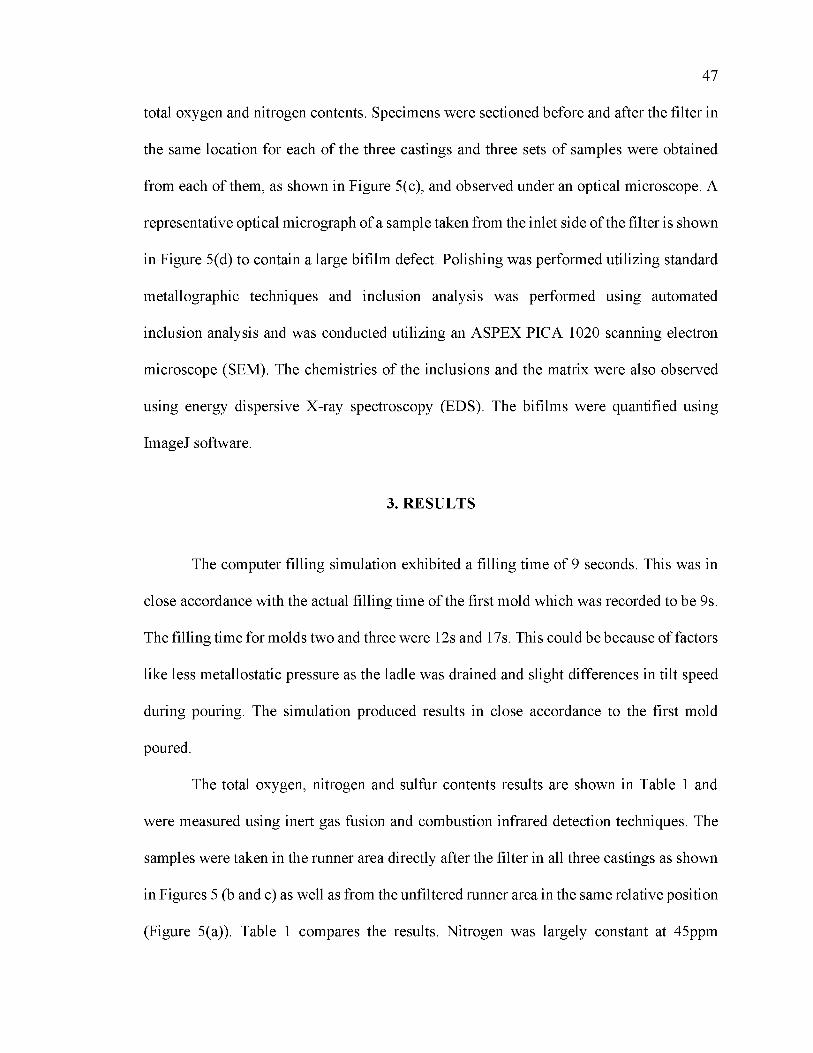
47
total oxygen and nitrogen contents. Specimens were sectioned before and after the filter in
the same location for each of the three castings and three sets of samples were obtained
from each of them, as shown in Figure 5(c), and observed under an optical microscope. A
representative optical micrograph of a sample taken from the inlet side of the filter is shown
in Figure 5(d) to contain a large bifilm defect. Polishing was performed utilizing standard
metallographic techniques and inclusion analysis was performed using automated
inclusion analysis and was conducted utilizing an ASPEX PICA 1020 scanning electron
microscope (SEM). The chemistries of the inclusions and the matrix were also observed
using energy dispersive X-ray spectroscopy (EDS). The bifilms were quantified using
ImageJ software.
3. RESULTS
The computer filling simulation exhibited a filling time of 9 seconds. This was in
close accordance with the actual filling time of the first mold which was recorded to be 9s.
The filling time for molds two and three were 12s and 17s. This could be because of factors
like less metallostatic pressure as the ladle was drained and slight differences in tilt speed
during pouring. The simulation produced results in close accordance to the first mold
poured.
The total oxygen, nitrogen and sulfur contents results are shown in Table 1 and
were measured using inert gas fusion and combustion infrared detection techniques. The
samples were taken in the runner area directly after the filter in all three castings as shown
in Figures 5 (b and c) as well as from the unfiltered runner area in the same relative position
(Figure 5(a)). Table 1 compares the results. Nitrogen was largely constant at 45ppm
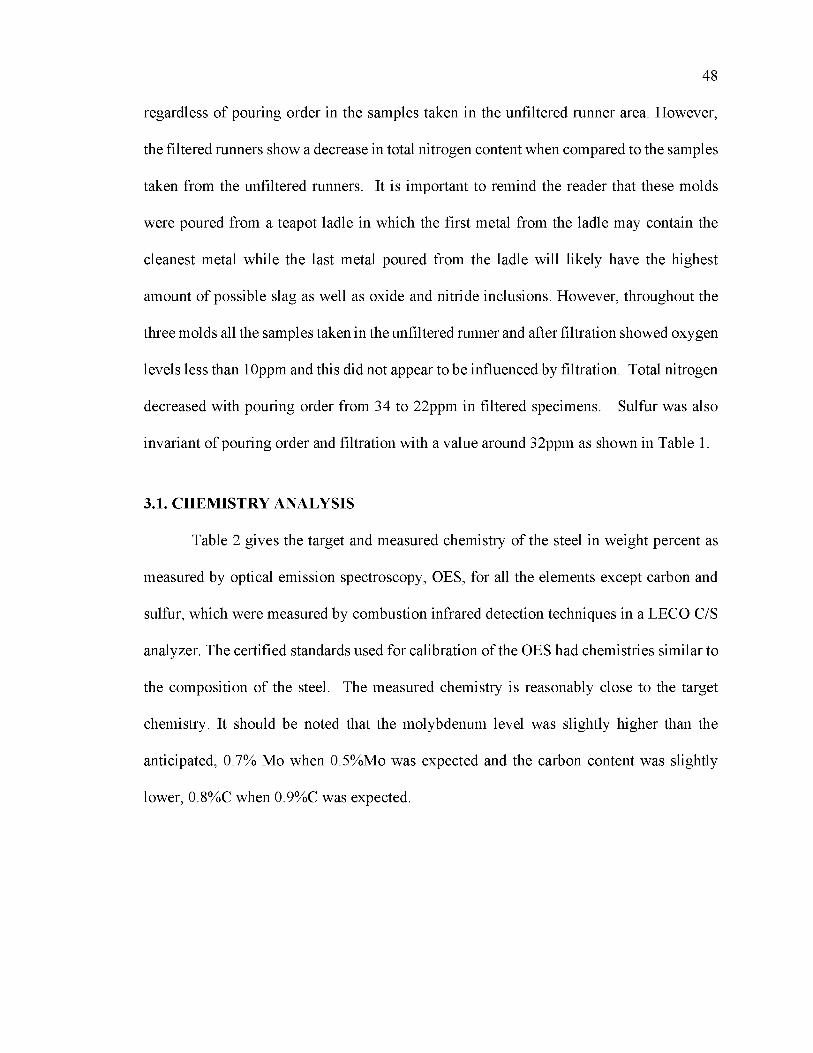
48
regardless of pouring order in the samples taken in the unfiltered runner area. However,
the filtered runners show a decrease in total nitrogen content when compared to the samples
taken from the unfiltered runners. It is important to remind the reader that these molds
were poured from a teapot ladle in which the first metal from the ladle may contain the
cleanest metal while the last metal poured from the ladle will likely have the highest
amount of possible slag as well as oxide and nitride inclusions. However, throughout the
three molds all the samples taken in the unfiltered runner and after filtration showed oxygen
levels less than 10ppm and this did not appear to be influenced by filtration. Total nitrogen
decreased with pouring order from 34 to 22ppm in filtered specimens. Sulfur was also
invariant of pouring order and filtration with a value around 32ppm as shown in Table 1.
3.1. CHEMISTRY ANALYSIS
Table 2 gives the target and measured chemistry of the steel in weight percent as
measured by optical emission spectroscopy, OES, for all the elements except carbon and
sulfur, which were measured by combustion infrared detection techniques in a LECO C/S
analyzer. The certified standards used for calibration of the OES had chemistries similar to
the composition of the steel. The measured chemistry is reasonably close to the target
chemistry. It should be noted that the molybdenum level was slightly higher than the
anticipated, 0.7% Mo when 0.5%Mo was expected and the carbon content was slightly
lower, 0.8%C when 0.9%C was expected.
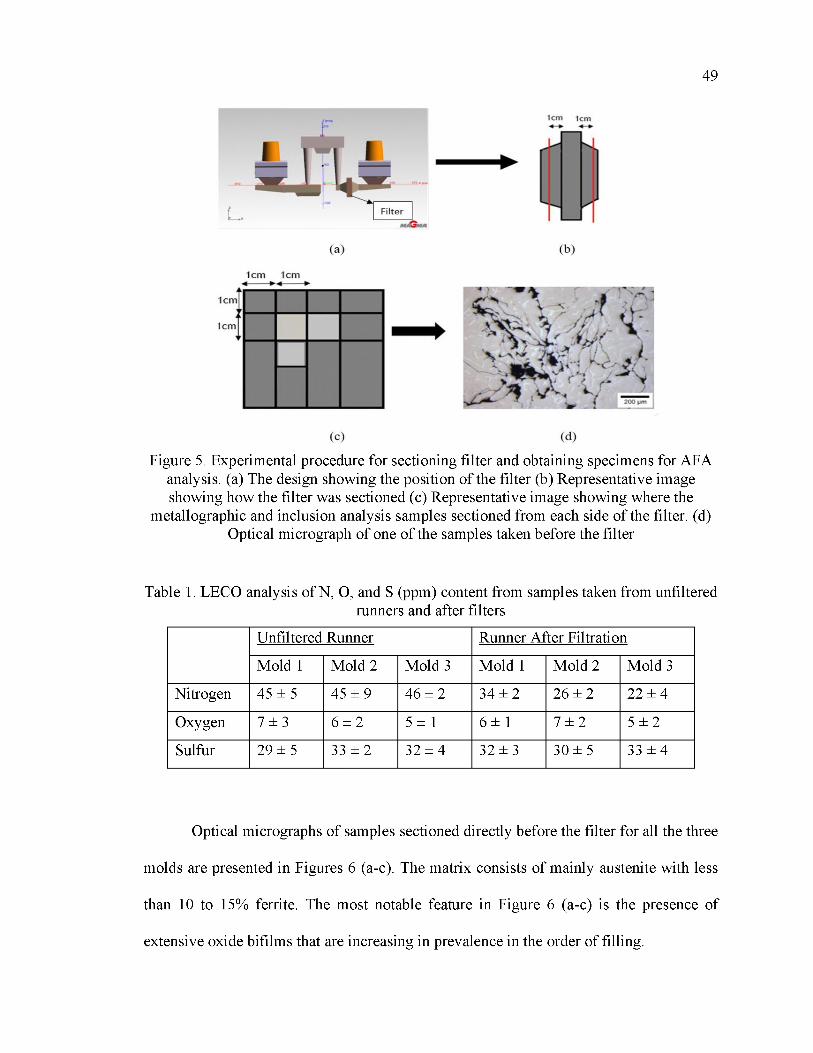
49
Figure 5. Experimental procedure for sectioning filter and obtaining specimens for AFA analysis. (a) The design showing the position of the filter (b) Representative image showing how the filter was sectioned (c) Representative image showing where the
metallographic and inclusion analysis samples sectioned from each side of the filter. (d) Optical micrograph of one of the samples taken before the filter
Table 1. LECO analysis of N, O, and S (ppm) content from samples taken from unfilteredrunners and after filters
Unfiltered Runner Runner After Filtration
Mold 1 Mold 2 Mold 3 Mold 1 Mold 2 Mold 3
Nitrogen 45 ± 5 45 ± 9 46 ± 2 34 ± 2 26 ± 2 22 ± 4
Oxygen 7 ± 3 6 ± 2 5 ± 1 6 ± 1 7 ± 2 5 ± 2
Sulfur 29 ± 5 33 ± 2 32 ± 4 32 ± 3 30 ± 5 33 ± 4
Optical micrographs of samples sectioned directly before the filter for all the three
molds are presented in Figures 6 (a-c). The matrix consists of mainly austenite with less
than 10 to 15% ferrite. The most notable feature in Figure 6 (a-c) is the presence of
extensive oxide bifilms that are increasing in prevalence in the order of filling.

50
Table 2. Measured chemistry and target composition in weight percent as determinedusing OES and LECO C/S analyzer
Fe C* Si Mn S* Mo Ni Al
Target Bal. 0.9 1 30 - 0.5 - 9
Measured Bal. 0.82 0.99 29.10 0.002 0.70 0.15 9.4
These networks of oxide bifilms were found in of all the samples taken before the
filters in all the molds. In some cases, they are associated with areas of porosity caused
through thickness failure of inlet gating system resulting from bifilm separation. The
microstructures of samples taken after the filter are shown in Figure 7. Bifilms were
quantified by determining the average area coverage utilizing image analysis on optical
micrographs.
3.2. BIFILM AND INCLUSION ANALYSIS
Bifilms were not observed in filtered specimens as shown in Figure 7. It should be
noted that the areas presented in Figures 6 and 7 were sectioned in the same positions
before and after the filter in each of the three gating systems as shown in Figures 5 (b and
c). The composition of the bifilm defects was characterized utilizing an SEM with EDS
and compared with the matrix austenite chemistries. Figure 8 shows the backscattered
electron images of a network of bifilm defects from the area before the filter in mold 1.
EDS analysis confirmed that the bifilms are mainly composed of aluminum and manganese
oxides as shown in Table 3. Previous unpublished work by the authors show that nitrogen
and possibly hydrogen gas may nucleate on the bifilms during solidification, causing
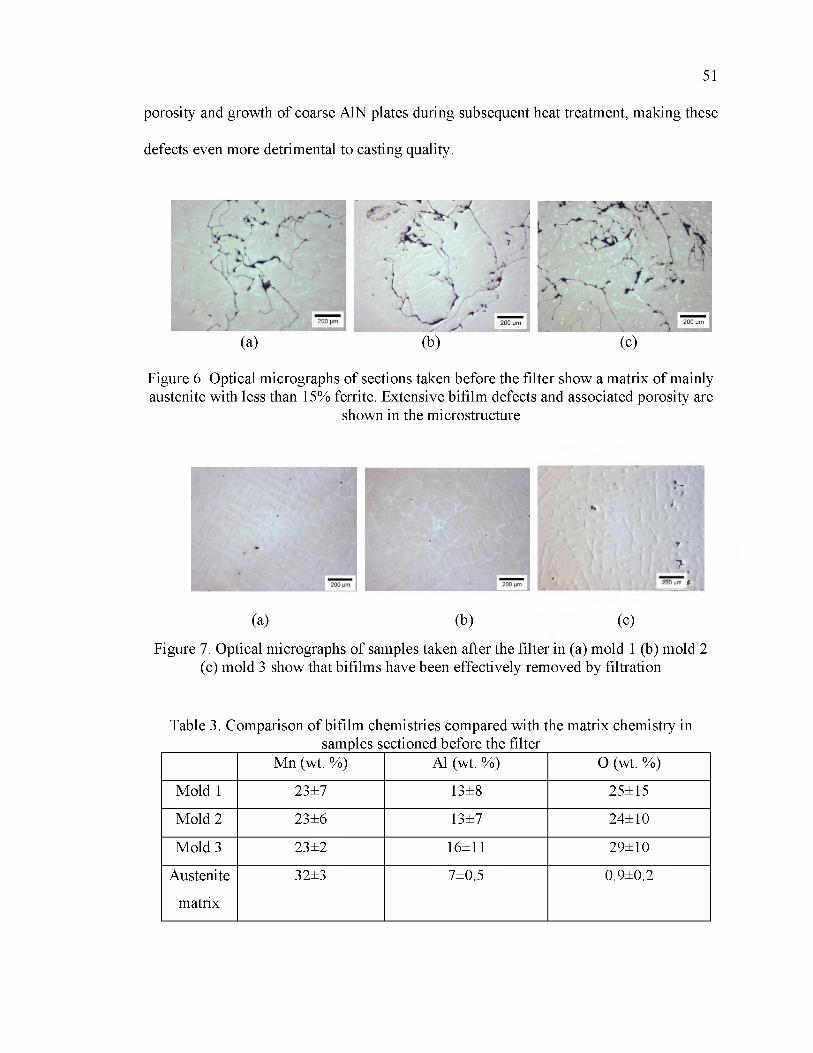
51
porosity and growth of coarse AlN plates during subsequent heat treatment, making these
defects even more detrimental to casting quality.
(a) (b) (c)
Figure 6. Optical micrographs of sections taken before the filter show a matrix of mainly austenite with less than 15% ferrite. Extensive bifilm defects and associated porosity are
shown in the microstructure
• ' '
. 1 i
r '
7-* 2 0 0 p m f '
(a) (b) (c)
Figure 7. Optical micrographs of samples taken after the filter in (a) mold 1 (b) mold 2 (c) mold 3 show that bifilms have been effectively removed by filtration
Table 3. Comparison of bifilm chemistries compared with the matrix chemistry in _________ ___________ samples sectioned before the filter ___________________
Mn (wt. %) Al (wt. %) O (wt. %)
Mold 1 23±7 13±8 25±15
Mold 2 23±6 13±7 24±10
Mold 3 23±2 16±11 29±10
Austenite 32±3 7±0.5 0.9±0.2
matrix

52
Figure 8. The backscattered electron image of a network of bifilms present in the sectioned sample taken before the filter from mold 1. It shows areas of bifilms that were
determined to be mainly aluminum oxide
As seen from Table 3, the bifilms were composed of mainly alumina and possibly
in combination with manganese oxides. However, the high amount of Mn in the matrix
contributes to a background effect and thus the presence of Mn in these bifilms is difficult
to resolve. Inclusion analysis of samples sectioned before and after the filter was
accomplished utilizing an ASPEX PICA 1020 SEM with automated feature analysis. A
backscattered electron detector (BSED) and a magnification of 500X was used for the
analysis.
An emission current of 32-34pA with a dwell time of 12ps were considered for the
analysis. Areas of bifilms and pores were excluded from the inclusion analysis based on
size (greater than 10pm for bifilms) and chemistry. For example, pores and bifilms were
found to have either high carbon levels, and since the diamond paste used for polishing can
accumulate in the cracks in the bifilms and pores, or high concentrations of iron and
manganese at or above the matrix composition and without any other elements in the case
of porosity and bifilm cracks. Inclusions were also differentiated from the bifilms and
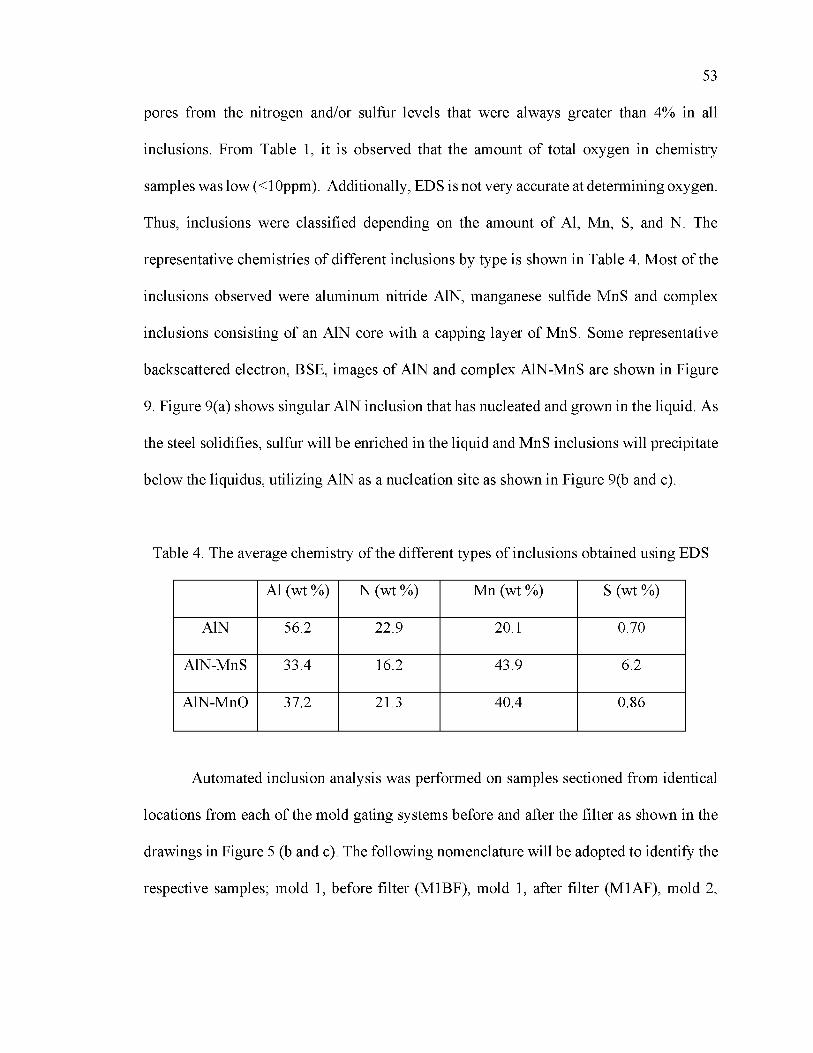
53
pores from the nitrogen and/or sulfur levels that were always greater than 4% in all
inclusions. From Table 1, it is observed that the amount of total oxygen in chemistry
samples was low (<10ppm). Additionally, EDS is not very accurate at determining oxygen.
Thus, inclusions were classified depending on the amount of Al, Mn, S, and N. The
representative chemistries of different inclusions by type is shown in Table 4. Most of the
inclusions observed were aluminum nitride AlN, manganese sulfide MnS and complex
inclusions consisting of an AlN core with a capping layer of MnS. Some representative
backscattered electron, BSE, images of AlN and complex AlN-MnS are shown in Figure
9. Figure 9(a) shows singular AlN inclusion that has nucleated and grown in the liquid. As
the steel solidifies, sulfur will be enriched in the liquid and MnS inclusions will precipitate
below the liquidus, utilizing AlN as a nucleation site as shown in Figure 9(b and c).
Table 4. The average chemistry of the different types of inclusions obtained using EDS
Al (wt %) N (wt %) Mn (wt %) S (wt %)
AlN 56.2 22.9 20.1 0.70
AlN-MnS 33.4 16.2 43.9 6.2
AlN-MnO 37.2 21.3 40.4 0.86
Automated inclusion analysis was performed on samples sectioned from identical
locations from each of the mold gating systems before and after the filter as shown in the
drawings in Figure 5 (b and c). The following nomenclature will be adopted to identify the
respective samples; mold 1, before filter (M1BF), mold 1, after filter (M1AF), mold 2,

54
before filter (M2BF), mold 2, after filter(M2AF), mold 3, before filter(M3BF), mold 3,
after filter (M3AF).
(a) (b)
Figure 9. SEM images of different inclusions found in the steel (a) An image of an aluminum nitride inclusion (b and c) A complex AlN-MnS inclusion with the AlN at its
core and (c) a MnS inclusion around the AlN
Figure 10 shows the inclusion density by type for specimens sectioned before the
filter. It was found that the AlN inclusions formed most of the inclusions followed by AlN-
MnO and AlN-MnS. MnO and MnS were observed to precipitate on AlN. MnS inclusions
had an inclusion density of less than 5/mm2. It should be noted that the MnS inclusions
will form below the liquidus temperature as observed from Figure 4 and are thus unaffected
by filtration.
Complex oxysulfides of Al and Mn and Ti-Mo carbides were found in trace
amounts in all the three molds. However, these inclusions accounted for only 1-1.5% of
the total amount of inclusions and was therefore excluded from the analysis. Figure 11
shows the inclusion density by type for samples sectioned after the filter in all three molds.
The density of AlN decreased in the filtered samples by 27-28% in the first two molds and
by 38% in the last mold poured.
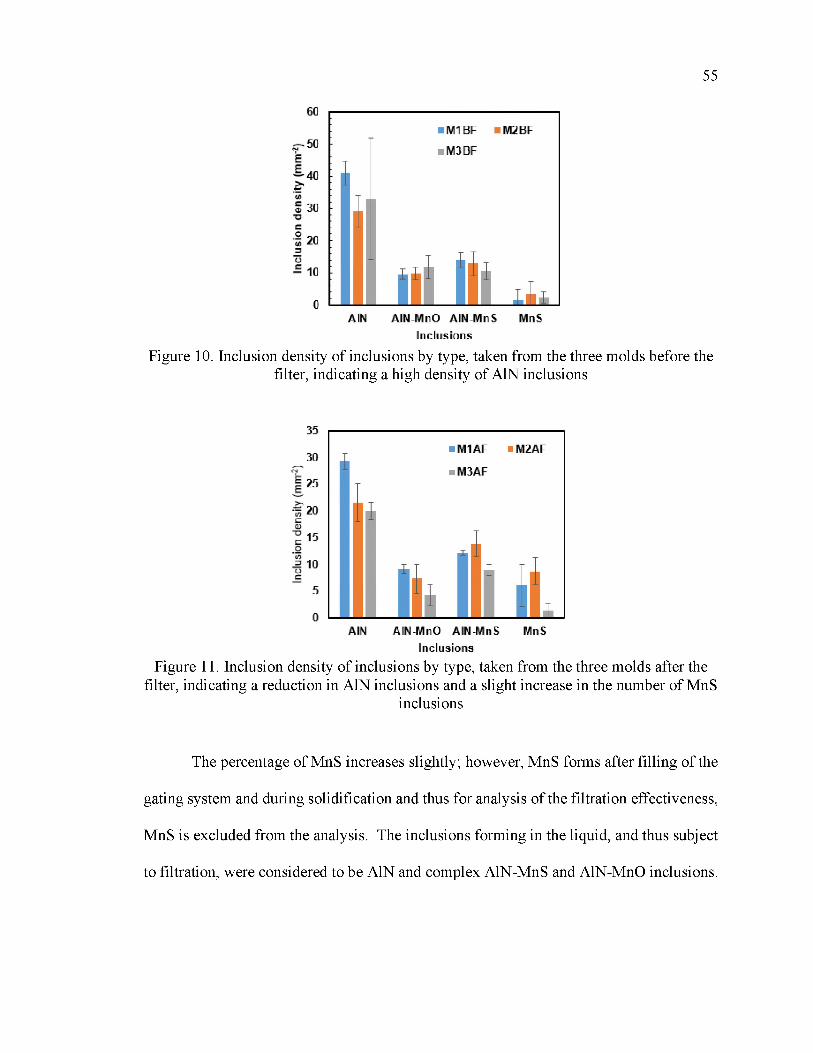
55
Figure 10. Inclusion density of inclusions by type, taken from the three molds before the filter, indicating a high density of AlN inclusions
Figure 11. Inclusion density of inclusions by type, taken from the three molds after the filter, indicating a reduction in AlN inclusions and a slight increase in the number of MnS
inclusions
The percentage of MnS increases slightly; however, MnS forms after filling of the
gating system and during solidification and thus for analysis of the filtration effectiveness,
MnS is excluded from the analysis. The inclusions forming in the liquid, and thus subject
to filtration, were considered to be AlN and complex AlN-MnS and AlN-MnO inclusions.
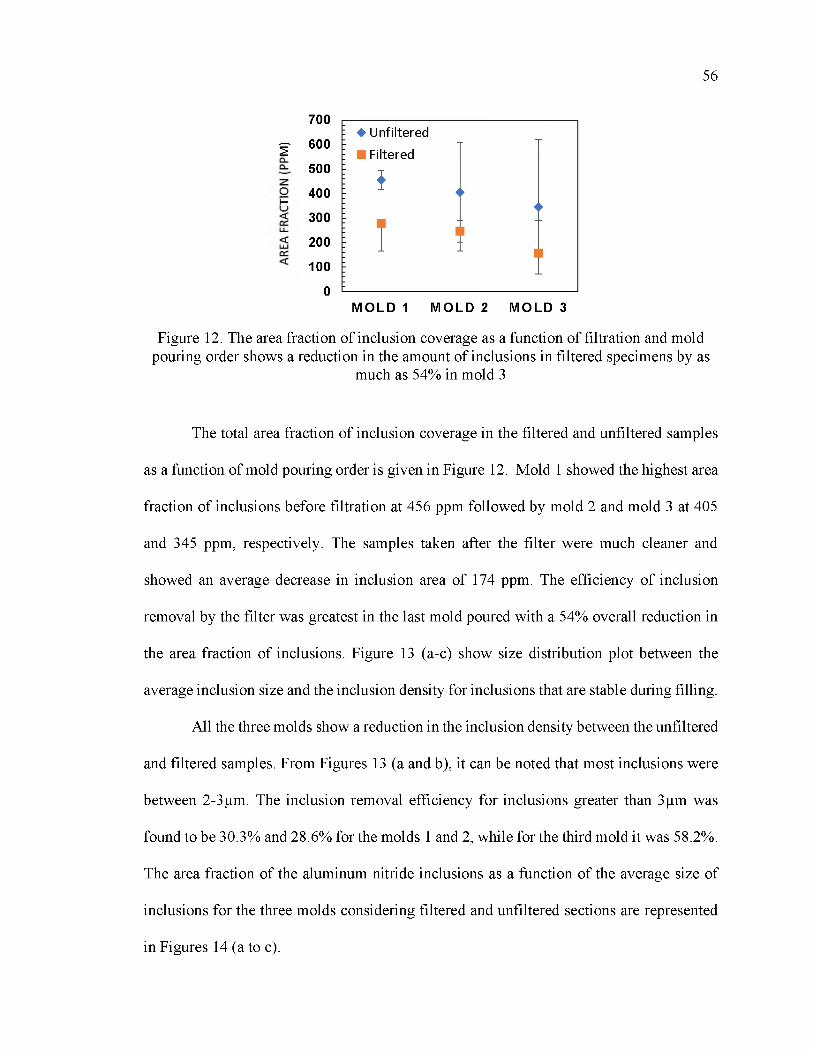
56
700
g- 600
500
400I—300
200
100
0
Figure 12. The area fraction of inclusion coverage as a function of filtration and mold pouring order shows a reduction in the amount of inclusions in filtered specimens by as
much as 54% in mold 3
M O L D 1 M O L D 2 M O L D 3
The total area fraction of inclusion coverage in the filtered and unfiltered samples
as a function of mold pouring order is given in Figure 12. Mold 1 showed the highest area
fraction of inclusions before filtration at 456 ppm followed by mold 2 and mold 3 at 405
and 345 ppm, respectively. The samples taken after the filter were much cleaner and
showed an average decrease in inclusion area of 174 ppm. The efficiency of inclusion
removal by the filter was greatest in the last mold poured with a 54% overall reduction in
the area fraction of inclusions. Figure 13 (a-c) show size distribution plot between the
average inclusion size and the inclusion density for inclusions that are stable during filling.
All the three molds show a reduction in the inclusion density between the unfiltered
and filtered samples. From Figures 13 (a and b), it can be noted that most inclusions were
between 2-3pm. The inclusion removal efficiency for inclusions greater than 3 pm was
found to be 30.3% and 28.6% for the molds 1 and 2, while for the third mold it was 58.2%.
The area fraction of the aluminum nitride inclusions as a function of the average size of
inclusions for the three molds considering filtered and unfiltered sections are represented
in Figures 14 (a to c).
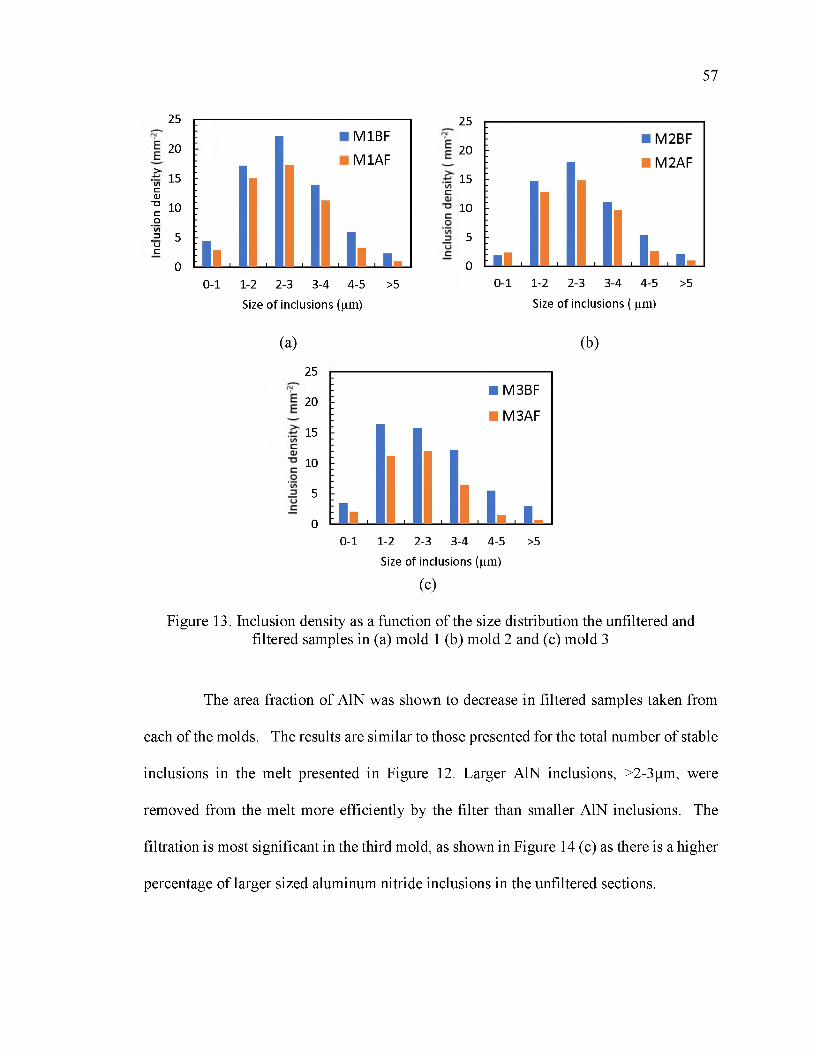
57
25
20
15
10
5
0
>"tncOlT 3
Co" c n_ DUc
M1BFM1AF
0-1 1-2 2-3 3-4 4-5 >5Size of inclusions (^m) Size of inclusions ( ^m)
(a) (b)
Size of inclusions (^m)
(c)
Figure 13. Inclusion density as a function of the size distribution the unfiltered and filtered samples in (a) mold 1 (b) mold 2 and (c) mold 3
The area fraction of AlN was shown to decrease in filtered samples taken from
each of the molds. The results are similar to those presented for the total number of stable
inclusions in the melt presented in Figure 12. Larger AlN inclusions, >2-3gm, were
removed from the melt more efficiently by the filter than smaller AlN inclusions. The
filtration is most significant in the third mold, as shown in Figure 14 (c) as there is a higher
percentage of larger sized aluminum nitride inclusions in the unfiltered sections.
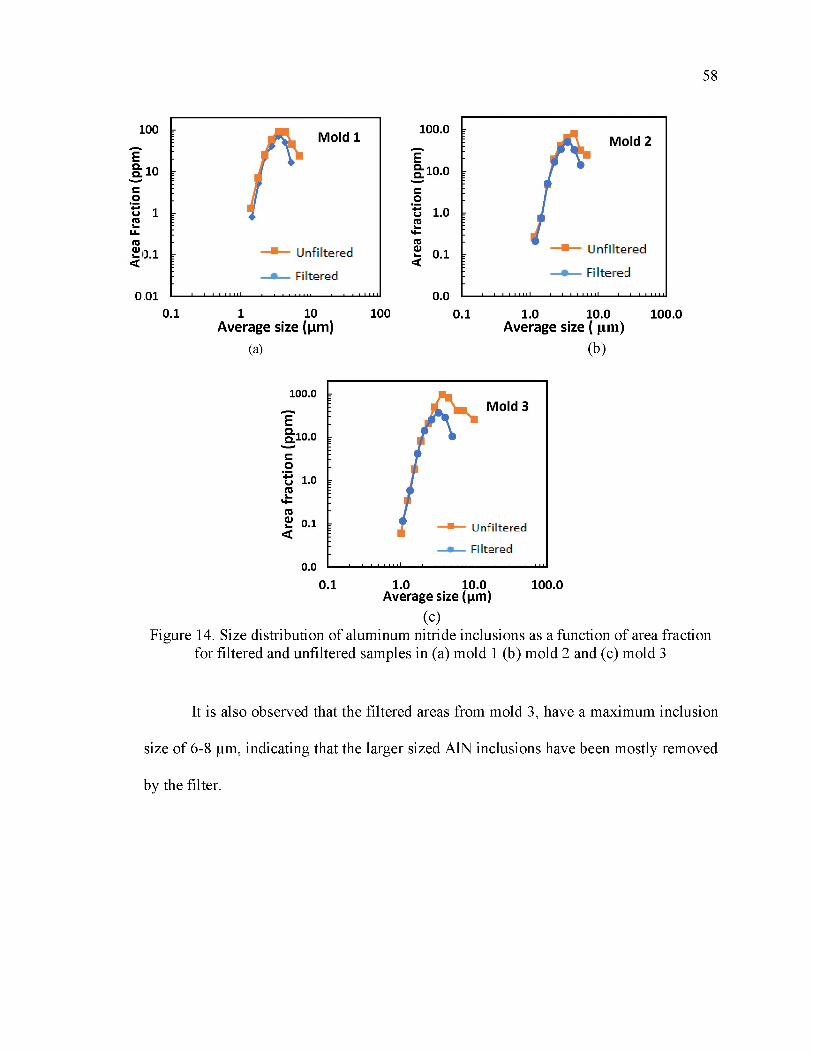
Area
Fra
ctio
n (p
pm)
O
58
Average size (pm)(a)
0.1 1.0 10.0 100.0 Average size ( pm)
(b)
0.1 1.0 10.0 100.0 Average size (pm)
(c)Figure 14. Size distribution of aluminum nitride inclusions as a function of area fraction
for filtered and unfiltered samples in (a) mold 1 (b) mold 2 and (c) mold 3
It is also observed that the filtered areas from mold 3, have a maximum inclusion
size of 6-8 pm, indicating that the larger sized AlN inclusions have been mostly removed
by the filter.
59
4. DISCUSSION
Figure 15 shows the measured N, O, and S contents from samples taken from
unfiltered runners and from samples taken just behind the filter as described in Figure 5.
The amount of sulfur and oxygen was not much different in the unfiltered and filtered
runners and that did not appear to vary with pouring order. The sulfur concentration
corresponds directly to the amount of sulfide inclusions (MnS and complex AlN-MnS) in
the castings. Thermodynamic modeling in Figure 4 shows that MnS is stable below the
liquidus near the end of solidification and this is consistent with the work of Vaz Penna et
al. who show MnS precipitation after the liquidus in a Fe-30Mn-9Al-1C- 1Si-0.5Mo steel
with 40 to 400 ppm S.12 Thus, MnS did not form until after filling and during solidification
and therefore the consistency of the sulfur concentrations in Figure 15 between the filtered
and unfiltered runner areas is understandable. This is consistent with the work of others
who have shown that inclusions in these steels mainly consist of AlN and AlN-MnS
complex inclusions in which MnS is often found to precipitate heterogeneously on AlN
during solidification.1,2,4,11 The amount of measured total oxygen in Figure 15 is low in all
the samples and was less than 10 ppm.
This is consistent with the inclusion analysis presented in Figures 10 and 11 that
show less than 10 inclusions/mm2 were complex oxide inclusions. In general, endogenous
oxide inclusions such as alumina and manganese spinel are not as prevalent as AlN in
castings poured from FeMnAlC steels that are induction melted and this has been reported
by several studies.1, 2,4,11
Samples taken from the unfiltered runner show no real difference in the amount of
nitrogen as a function of pouring order as shown in Figure 15. However, filtered specimens
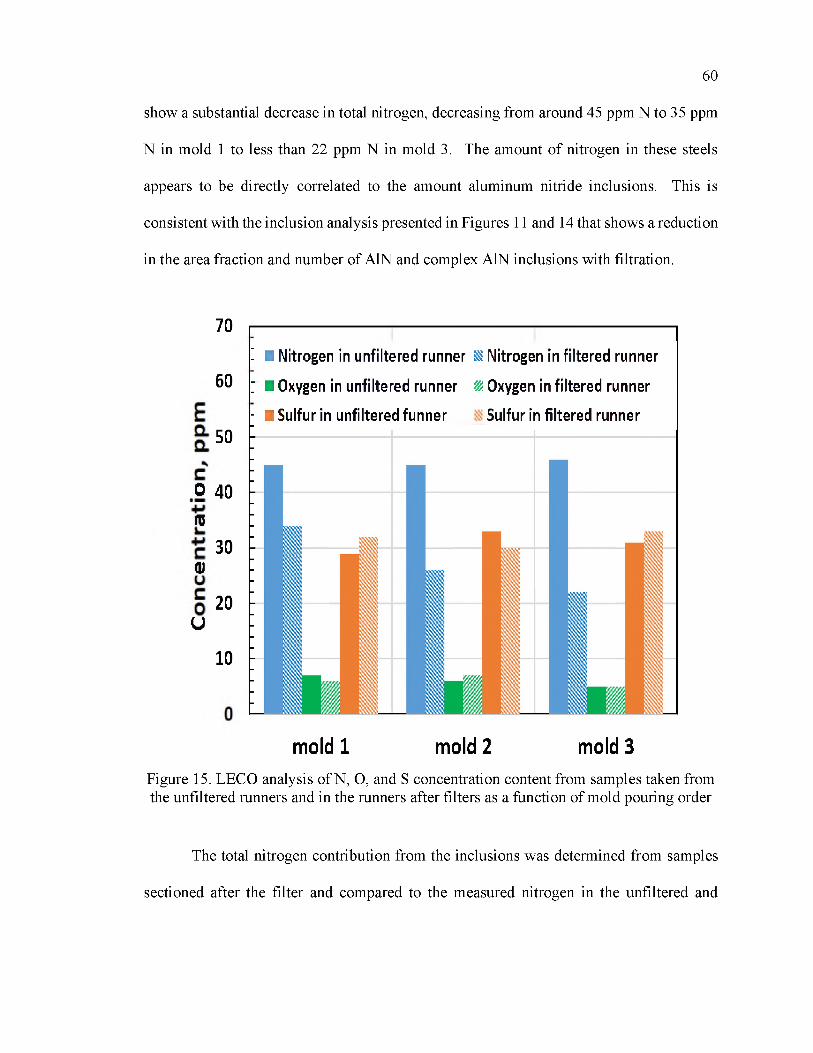
60
show a substantial decrease in total nitrogen, decreasing from around 45 ppm N to 35 ppm
N in mold 1 to less than 22 ppm N in mold 3. The amount of nitrogen in these steels
appears to be directly correlated to the amount aluminum nitride inclusions. This is
consistent with the inclusion analysis presented in Figures 11 and 14 that shows a reduction
in the area fraction and number of AlN and complex AlN inclusions with filtration.
70
60
50
0 40(U
<U
u
30
20
10
I ■ Nitrogen in unfiltered runner ̂Nitrogen in filtered runner
: ■ Oxygen in unfiltered runner $2 Oxygen in filtered runner
- ■ Sulfur in unfiltered funner Sulfur in filtered runner
mold 1 mold 2 mold 3Figure 15. LECO analysis of N, O, and S concentration content from samples taken from the unfiltered runners and in the runners after filters as a function of mold pouring order
The total nitrogen contribution from the inclusions was determined from samples
sectioned after the filter and compared to the measured nitrogen in the unfiltered and

61
filtered runners. The method used for calculating the nitrogen content based on inclusion
was obtained from the work by M Harris et al.13
The areal average elemental composition of inclusions is calculated for each
element as follows:
A total(2)
where %m is the areal average mass percent of a given element, %x is the amount of
respective element in an individual inclusion, Ainclusion and Atotal are the area of the
individual inclusion and total area of all measured inclusions. The mass balance calculation
was performed using the compositional data obtained from the EDS inclusion analysis and
the following equation.13
_ % m Af p i Wj Mppm - WQpm
(3)
In the above equation, Mppm is the mass fraction in ppm of a given element in the steel
sample contained within the inclusions, Af is the total inclusion area fraction, pi and pm are
the densities of the inclusions associated with the given element and the density of the
matrix, respectively. wi is the mass fraction of the given element in the associated inclusion
compound.13
As shown in Figure 16, nitrogen decreases after filtration and the filtered nitrogen
contents are in very good agreement with the nitrogen contribution from the inclusions.
The efficiency of solid inclusion filtration increases with pouring order as shown from
Figures 13 and this is supported by the measured nitrogen contents in Figures 15 and 16.
The measured amount of total nitrogen observed in the filtrated steels is also somewhat

62
lower than previous induction melted Fe-30Mn-(3-9) Al-(0.9-1.8) C steels in which the
total nitrogen content that varied between 50 and 150 ppm.2 It should be noted that results
indicate that the steel in the current study was very clean even in the unfiltered condition
with total inclusion densities before filtration ranging from 50 to 70 inclusions/mm2 as
shown in Figure 1.
Figure 16. Calculated total nitrogen contribution of inclusions from specimens sectioned before and after the filter as compared to the measured total nitrogen after filtration
The total inclusion density of the current steel can be compared with the results of
Bartlett et al.,2 who showed total inclusion densities ranging from 70 to 146 inclusions/mm2
in induction melted Fe-30Mn-(3-9)Al-(0.9-1.8)C steels. The optical microstructural
analysis of the samples in Figures 6 and 8 revealed extensive bifilm networks in samples
taken before the filter with high amounts of porosity. The percentage of area covered by
bifilms in samples taken before and after the filters in molds one, two and three were 1.78,
2.04 and 2.46%, respectively. Bifilms were not observed in samples taken after the filter.
The velocity of the metal was the highest at the base of the downsprue and before the filter
expansion area as shown in Figure 2. In some regions, the velocity reaches as high as 2m/s,

63
which is above the critical value 0.45m/s. This leads to mixing of the metal with the air
and the formation of a surface skin of the metal oxide that folds onto itself with along with
a volume of entrapped air, leading to formation of aluminum oxide bifilms and associated
porosity. This phenomena of bifilm formation and air entrainment has been widely reported
in aluminum castings14-16. The high amount of aluminum in these steels makes these alloys
particularly susceptible to bifilm formation and EDS elemental analysis of the bifilm
defects in the current study shows that they are made of primarily aluminum oxide and
perhaps in some cases Al-Mn-O spinel as shown in Figure 8 and Table 3. The filter was
effective at removing the bifilm defects from the steel as shown in Figure 8. This is an
encouraging result that has not been previously documented for high Mn and Al steels. It
should be noted that the bifilms may have contributed to some inclusion removal because
of their large area to volume ratio and a possible “inclusion netting” mechanism. However,
inclusions were not observed to be attached or associated with bifilms when observed both
optically and with an SEM. Additionally, the high initial velocity in front of the filter of
greater than 1 m/s, as shown in Figure 2, may tend to push inclusions through these
networks suggesting that most of the inclusions were captured by the filter. Further studies
are planned to determine the mechanism of inclusion attachment within the filter.
Inclusions in the FeMnAlC steel consisted mainly of AlN and complex AlN-MnS
and AlN-MnO inclusions. Very few oxide inclusions were observed, other than bifilm
defects, and this is consistent with previous studies that report that inclusions in these steels
are mainly AlN, and complex AlN-MnS and AlN-MnO type inclusions as previously noted
for industrially induction melted and cast Fe-30Mn-9Al-(0.6-1.6)Si-0.9C-0.5Mo steels.1,2
The presence of mainly AlN and complex AlN-MnS and AlN-MnO inclusions in this study
64
are consistent with previous studies of similar compositions of Fe-30Mn-XAl-0.9C steels
with Al contents between 3 and 9%Al.1,2,4,17 A comparison of the inclusion removal of
samples taken from before and after the filter for all the three molds is shown in Figure 12.
The density of AlN decreased in the filtered samples by 27-28% in the first two molds and
by 38% in the last mold poured. The filtration efficiency has been calculated using
Equation 1 and the area fraction of inclusions before and after filtration as per the method
used by Apelian et al.(7) Filtration efficiency of all the nitride based inclusions that form in
the liquid (AlN, AlN-MnO and AlN-MnS namely) was between 38 and 39% for the first
two molds poured and increased to 55% in the last mold poured. It is shown in Figure 13,
that although the incoming inclusion densities are largely similar, the last molds poured
tended to have a higher percentage of larger inclusions, >3pm, and these larger inclusions
tend to be filtered out more efficiently. The inclusion removal efficiency for inclusions
greater than 3 pm was found to be 30.3% and 28.6% for the first two molds, while for the
third molds it was 58.2%. A study for a similar mold design and inclusion filtration study
was recently performed by Chakraborty et al. on a SAE 316 steel that was deoxidized by
aluminum, generating a large amount of solid alumina inclusions.9 The efficiency of solid
nitride inclusion filtration in the current study in mold 1 and mold 3 was higher by 20%
and 10%, respectively, than in the study by Chakraborty et al.9
From Figures 10 and 11, it was observed that aluminum nitride inclusions had
the highest inclusion density among all inclusions. The analysis of aluminum nitride
inclusions across the three sets of molds becomes of paramount importance since it plays
a major role in determining the impact toughness of the steel.4 It was also observed that the
filter displayed an efficiency of 37% removal of AlN inclusions in the first mold followed
65
by 45% and 61% removal of AlN inclusions in the second and third mold respectively.
Figure 13 shows that the samples taken after the filter had a higher amount of smaller sized
inclusions than large sized inclusions The difference in the bar graphs in Figure 13 show
that since the larger inclusions float to the top and since mold three was poured at the end,
it consisted of a high number of larger (>3 pm) sized inclusions. A similar trend is observed
in the filtration of alumina inclusions by Chakraborty et al.9 This is understandable since
the smaller sized inclusions would have passed through the pores of the ceramic filter while
the larger sized inclusions are more easily filtered out.
5. CONCLUSION
The filtration of inclusions from the melt of a Fe-30Mn-9Al-1Si-0.9C-0.7Mo
steel was studied as a function of pouring order and utilizing a novel mold design consisting
of two castings connected to two separate but balanced rigging designs. One of the gating
systems utilized a zirconia 10 ppi foam filter in the runner system while the other one was
unfiltered. The three molds were prepared using no-bake sand and the metal was poured
using a tea pot ladle. Results showed a decrease in the number and area fraction of
inclusions with filtration as well as elimination of bifilm defects in samples sectioned
directly after the filter in the runner system. Samples taken before the filter were covered
with bifilms on their surface, which were mainly composed of aluminum and manganese
oxides. Samples taken after the filter showed an elimination of bifilms. These results show
that filters are extremely effective at removal of bifilm defects from high manganese and
aluminum steels. AlN inclusions contributed to approximately 50% of the total inclusion
population, while AlN-MnS and AlN-MnO contributed about 20% of the total inclusions.
66
The filtration efficiency of inclusions from the melt increased from 38% to 39% in mold 1
and 2, to 55% for mold 3. The filter displayed an efficiency of AlN removal from 37% to
61% from mold 1 to mold 3. Mold 3 exhibited the highest amount of large size inclusions
in the size distribution analysis and showed the highest inclusion filtration rate. These
results show that ceramic foam filters are very effective at decreasing bifilm defects and at
filtration of large inclusions from the steel and should be used when a high degree of
cleanliness and toughness is desired. Future work will quantify the effect of filtration on
casting quality and toughness and verify the inclusion capture mechanism within the filter.
ACKNOWLEDGEMENTS
The authors greatly acknowledge the contributions of the many undergraduate
research assistants that contributed to this research: Kyle Dunsford, Trevor Constance,
Ryan Van Dyke, and Steen Anthony. This project was supported in part by the W olf
Endowed Funds for metal casting education and research at Missouri University of Science
and Technology. The authors also greatly acknowledge MAGMA LLC for their support
of the metal casting program at Missouri S&T and the contribution to the modeling work
within this manuscript.
REFERENCES
1. Laura Bartlett, David Van Aken “High Manganese and Aluminum Steels for the Military and Transportation Industry”, The Minerals, Metals and Materials Society, Vol 66, No 1, (2014)
2. L.N.Bartlett, D.C.Van Aken “Effect of Aluminum and carbon on dynamic fracture toughness of FeMnAlC steels”, American Foundry Society, AFS Transactions, Paper 13-1344,(2013)
67
3. R.Gopalan and Narayan. K. Prabhu “Oxide Bifilms in aluminum alloy castings: A review”, Materials Science and Technology,Vol 27, Issue 12, Pages 1757-1769, (2011)
4. A.M.Schulte, S.N.Lekakh, D.C.Van Aken, V.L.Richards “ Phosphorus mitigation in cast lightweight Fe-Mn-Al-C steel’” 114th MetalCasting Congress, Orlando, Florida, March (2013)
5. A.N. Leonov, M.M.Dechko “ Theory of design of foam ceramic filters for cleaning molten metals”, Refractories and Industrial ceramics, Vol 40, Nos 11-12, (1999)
6. V.N.Antsiferov, S.E.Porozova “ Foam Ceramic Filters for molten metals: Reality and Prospects”, Powder Metallurgy and Metal Ceramics, Vol 42, Nos 9-10, (2003)
7. D.Apelian, R.Mutharasan, S. Ali “Removal of inclusions from steel melts by filtration”, Journal of Materials Science 20, Pp, 3501-3514, (1985)
8. Chenguo Tian, “On the removal of non-metallic inclusions from molten steel through filtration”, Thesis: Mining and Metallurgical Engineering, MNpill University, May (1990)
9. S. Chakraborty, L. Bartlett, R. O ’Malley, M. Xu, “Efficiency of solid inclusion removal from the steel melt by foam ceramic filter: Design and Experimental Validation”,122nd AFS MetalCasting Congress, American Foundry Society, (2018)
10. Campbell J., “Complete Casting Handbook”, Elsevier Ltd., Oxford, UK (2011)
11. R. Vaz Penna, L.N. Bartlett, and T. Constance, “Understanding the Role of Inclusions on the Dynamic Fracture Toughness of High Strength Lightweight FeMnAl Steels,” International Journal of Metal Casting, October, (2018) In Press
12. Gunter Gigacher, Wilfred Krieger, Piotr R Scheller, Corinna Thomser, “Non-metallic Inclusions in High Manganese Alloy steels” Steel Research International, Vol 76, Issue 9, pp.644-649, (2005)
13. M. Harris et al., "Evolution of Non- Metallic Inclusions in Foundry Steel Casting Processes Processes," Proceedings of the 69th Annual Technical and Operating Conference, Steel Founders Society of America (SFSA) (2015, Chicago Illinois), Steel Founders society of America (SFSA) (Dec 2015)
14. D. Dispinar, and J. Campbell, “Porosity, hydrogen, and bifilm content in Al alloy castings,” Materials Science and Engineering, 528 pp. 3860-3865 (2011)
15. G. Bozchaloei, N. Varahram, P. Davami, S. Kim, “Effect of oxide bifilms on the mechanical properties of cast Al-7Si-0.3M g alloy and the roll of runner height after filter on their formation” Materials Science and Engineering A, Vol 548 pp. 99-105 (2012)

68
16. B. Farhoodi, R. Raiszadeh, and M. Ghanaatian, “Role of Double Oxide Film Defects in the Formation of Gas Porosity in Commercial Purity and Sr-containing Al Alloys,” Journal of Materials Science and Technology., Vol 30, pp. 154-162 (2014).
17. L. Bartlett, A. Dash, D. Van Aken, V. Richards, and K. Peaslee, “Dynamic Fracture Toughness of High Strength Cast Steels,” Transactions of the American Foundry Society, pp. 17-33 (2013)
69
II. QUANTIFYING THE EFFECT OF FILLING CONDITIONS ON 8630 STEELCASTING QUALITY
K. Balasubramanian,1L.N. Bartlett,1, M. Xu2
1Missouri University of Science and Technology,Rolla, MO and 2Georgia Southern University, Statesboro, GA
Keywords: vortex gate, non-metallic inclusions, air entrapment, simulation
ABSTRACT
Gating systems play an important role in determining the quality and mechanical
properties of castings. Recently developed naturally pressurized gating systems have been
proclaimed by some to completely eliminate defects in steel castings, however, this has not
been quantitatively studied. In the current study, the efficiency of different gating systems
on reduction of inclusions and the corresponding improvement in notch toughness in
quenched and tempered SAE 8630 high strength steel castings was studied using a
combination of fluid flow and solidification modeling software and coupled with
experimental studies on industrially produced test castings. A novel mold design allowed
for the simultaneous comparison of four different “best practices” gating systems. These
systems included two horizontally gated castings with a pressurized system and a non-
pressurized system as well as two naturally pressurized countergravity systems. The test
castings were identical modified Y-block castings and were modeled to have critical
microporosity of less than 0.06% and Niyama criterion greater than five. This was done to
minimize variation in solidification and to eliminate the effect of microporosity on
70
toughness. Inclusion analysis revealed presence of mainly alumina and complex alumina
and manganese sulfide inclusions. The naturally pressurized system provided the cleanest
casting with the highest Charpy V notch, CVN, toughness. Eutectic type II MnS that
formed during solidification negatively affected notch toughness and this obscured the
effect of pre-existing alumina inclusions. The pressurized system was shown to have the
highest inclusion fraction.
1. INTRODUCTION
Over the last few decades many investigations have been conducted by researchers
to develop “best practices” gating systems that improve steel casting quality (1). Since the
liquid melt enters a casting system through the rigging or gating system these systems play
a significant role in either increasing or degrading casting quality.
Research has shown that a well-designed gating system can help decrease molten
metal turbulence, reduce the slag, dross, and air entrainment within the casting and also
capture detrimental inclusions that might enter the casting cavity.(2) Various other defects
such as blows, cold shuts, ripple marks etc. can also be directly related to the gating system
and metal flow during mold filling.(3) When the metal filling is turbulent, it can lead to air
entrainment, oxide bifilm formation, and reoxidation inclusions as well as sand inclusions
from mold erosion. It has been shown that reoxidation inclusions resulting from pouring
and mold filling can comprise up to 83% of the inclusions in low alloy steel castings and
48% of inclusions in stainless steel castings.[4] The presence of excessive amounts of filling
related inclusions is often detrimental to machinability, casting surface quality, and
mechanical properties. Control of reoxidation inclusions is important as it is estimated that
71
up to 20% of the manufacturing costs associated with the production of steel castings are
associated with repair and rework that results from these filling related defects.
Various types of flows that can occur in gating systems can entrain air into the
molten metal such as the metal falling from a height, formation of breaker waves, or waves
returning from the runner after hitting an obstacle. These cases lead to the entrainment of
oxygen which subsequently causes formation of oxides that get entrapped in the liquid
metal as reoxidation inclusions.(5) Therefore, gating systems must be properly designed to
limit metal turbulence during filling and exposure of the molten metal with air. For
obtaining smooth filling, laminar flow of the molten metal is essential. The Reynolds,
number (Re), is used to characterize the flow of metal as a turbulent or laminar flow.[6] The
Reynolds number is given by,
Re = (pVd) / (p) (1)
where p is the density of the metal, V is the velocity of the metal, d is the diameter and p
is the viscosity of the metal. At Re lower than 2000, viscous forces prevail, leading to a
smooth and laminar flow while Re over 2000 is considered as turbulent flow, where the
velocity and direction of flow of the metal changes erratically. [1,6]
However, it has been shown that surface turbulence (predicted by the Weber
number) and the amount of time the liquid metal is in contact with the air have more of an
effect on air entrainment and reoxidation than Re alone. The Weber number is a
dimensionless quantity which helps to establish the relationship between the kinetic energy
of a fluid and the stabilizing surface tension forces and is given by Equation 2.
72
We=pLv2/ o (2)
where p is the density of the molten metal, L is the radius (characteristic length) of the
channel, v is the molten metal velocity and o is the surface tension of the molten metal. As
the Weber number increases, the kinetic energy becomes more dominant leading to high
splashing an turbulent flow of the metal.[7] It is shown that molten metal velocity has the
greatest effect on the Weber number and therefore one way to decrease turbulent flow and
reduce the amount of filling related defects is to decrease metal velocity, however, cold
shut formation and misruns can occur when the flowrate is below a critical level. Thus,
design of gating systems has a direct impact on proper filling of castings.(5) Campbell gives
a critical ingate velocity of 0.5 m/s where the molten metal is safe from entrainment
problems.[8] However, in practice it is often hard to achieve this in an industrial foundry
and ingate speeds between 0.5 and 1.0 m/s are often recommended.[8]
Most steel foundries use adaptations of the gating system shown in Figure 1 for a
horizontally parted mold, which has been widely accepted for more than 50 years. This
design has a number of features to control molten metal velocity, eliminate oxide damaged
metal, and minimize turbulent flow. For example, rectangular pouring basins are preferred
over conical pouring cups because they minimize air aspiration, allow for stabilization of
the molten metal flow, and allow entrained air bubbles to rise in the basin without being
washed into the downsprue.
Tapering the downsprue reduces air aspiration and a sprue well helps to minimize
the turbulence due to high velocity and molten metal changes in direction. Curved,
rectangular runners and gates also minimize air aspiration and promote laminar flow.
Runner extensions and runner wells are utilized to decrease the gate velocity and provide
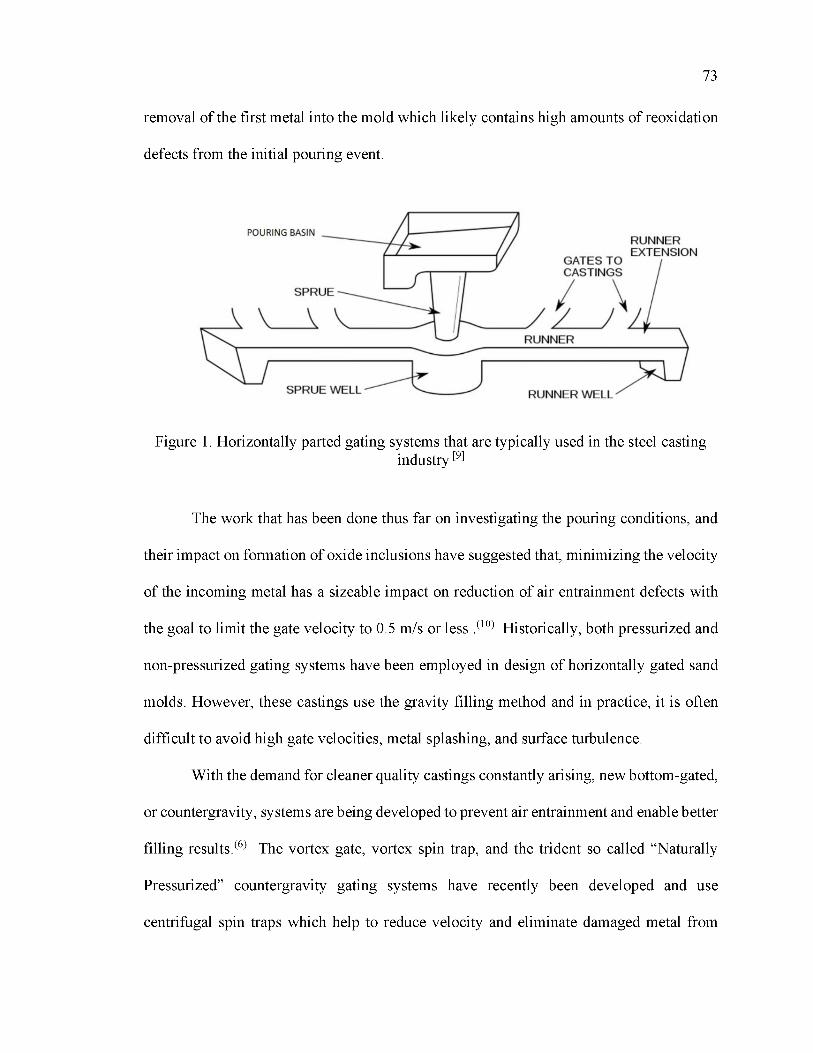
73
removal of the first metal into the mold which likely contains high amounts of reoxidation
defects from the initial pouring event.
Figure 1. Horizontally parted gating systems that are typically used in the steel castingindustry [9]
The work that has been done thus far on investigating the pouring conditions, and
their impact on formation of oxide inclusions have suggested that, minimizing the velocity
of the incoming metal has a sizeable impact on reduction of air entrainment defects with
the goal to limit the gate velocity to 0.5 m/s or less .(10) Historically, both pressurized and
non-pressurized gating systems have been employed in design of horizontally gated sand
molds. However, these castings use the gravity filling method and in practice, it is often
difficult to avoid high gate velocities, metal splashing, and surface turbulence.
With the demand for cleaner quality castings constantly arising, new bottom-gated,
or countergravity, systems are being developed to prevent air entrainment and enable better
filling results.(6) The vortex gate, vortex spin trap, and the trident so called “Naturally
Pressurized” countergravity gating systems have recently been developed and use
centrifugal spin traps which help to reduce velocity and eliminate damaged metal from
74
entering the casting.[11] The vortex gate leads directly into the casting and utilizes a filter
to reduce turbulence due to metal spin. This system effectively reduces the incoming metal
velocity; however, it centrifuges the bubbles into the casting that can lead to oxide defects
and blows. The trident gate was found to be more effective and has a complex design
system that incorporates the use of two filters and a bubble trap and has proven its
capabilities in aluminum alloys, however, the use of filters adds an additional cost that
most foundries are not willing to encumber.(12) Vortex spin trap gating systems with
extended runners were found to be as effective as trident gates at reducing metal velocity
and are less expensive and complex to implement because they do not use filters.
Although these novel gating systems have shown great promise in computer
simulations, there has been limited studies that link the design, modeling, and actual
performance of these gating systems in industrial steel castings. Competition in the
foundry industry and the need for higher quality products with complex designs has made
computer modeling of molten metal flow and solidification simulations almost essential
with the goal of minimizing critical gate velocity (13). However, the use of these software
packages cannot accurately predict filling related defects and as such as reoxidation
inclusions and bifilms. The goal of this study is to use a combination of computational
computer modeling coupled with experimental validation to optimize and compare the
filling conditions of four different “best practices” gating systems during the pouring of
SAE 8630 steel castings. A novel mold design was designed to simultaneously evaluate
two countergravity vortex spin trap gating systems in comparison to traditionally side gated
pressurized and nonpressurized systems. The cleanliness of the resulting castings was then
75
evaluated using scanning electron microscopy, SEM, with automated feature analysis
(AFA) and correlated to Charpy V notch toughness.
2. DESIGN OF MOLDS AND TEST CASTINGS
The commercially available filling and solidification software, MagmaSoft (5.3.1)
was used for designing the molds. The mold design is shown in Figure 2 (a) and (b). The
test castings are shown in gray in Figure 2 and were designed to be modified y-block
castings of length 180 mm and a height of 85 mm. The castings were designed in such a
way to accommodate a flat surface for obtaining samples to understand the effect of filling
conditions on surface quality and provide an evaluation surface for floatation of reoxidation
inclusions. For the study of CVN impact toughness, the length and width of the narrow
section of the y-block was designed to accommodate sectioning of eight ASTM E23
standard sized CVN bars in two layers of four bars each. The size of the castings was
identical between different gating systems to minimize the effect of solidification on the
microstructure and mechanical properties. The goal of the current study is to study the
effect of filling conditions on steel cleanliness and CVN toughness. Therefore, other
defects such as shrinkage and microporosity should be minimized. It is also important to
“catch” filling related damage in the evaluation area of the castings and minimize floatation
of inclusions into risers. Keeping these two requirements in consideration, the castings and
gating systems were meticulously designed to ensure that most of the inclusions that
entered the gate from the filling process remained in the castings while at the same time,
producing sound metal with low levels of microporosity, <0.08%, in the evaluation area.
Table 1 shows the nomenclature for the different gating systems that will be used as
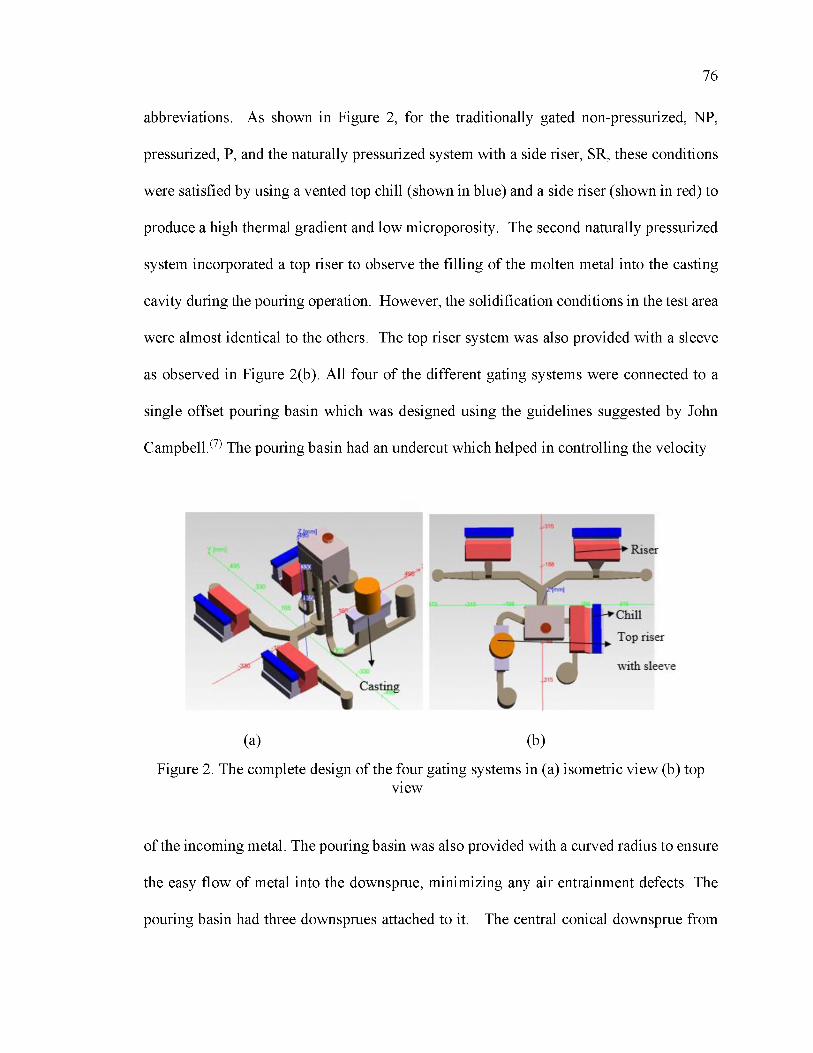
76
abbreviations. As shown in Figure 2, for the traditionally gated non-pressurized, NP,
pressurized, P, and the naturally pressurized system with a side riser, SR, these conditions
were satisfied by using a vented top chill (shown in blue) and a side riser (shown in red) to
produce a high thermal gradient and low microporosity. The second naturally pressurized
system incorporated a top riser to observe the filling of the molten metal into the casting
cavity during the pouring operation. However, the solidification conditions in the test area
were almost identical to the others. The top riser system was also provided with a sleeve
as observed in Figure 2(b). All four of the different gating systems were connected to a
single offset pouring basin which was designed using the guidelines suggested by John
Campbell.(7) The pouring basin had an undercut which helped in controlling the velocity
(a) (b)
Figure 2. The complete design of the four gating systems in (a) isometric view (b) topview
of the incoming metal. The pouring basin was also provided with a curved radius to ensure
the easy flow of metal into the downsprue, minimizing any air entrainment defects. The
pouring basin had three downsprues attached to it. The central conical downsprue from
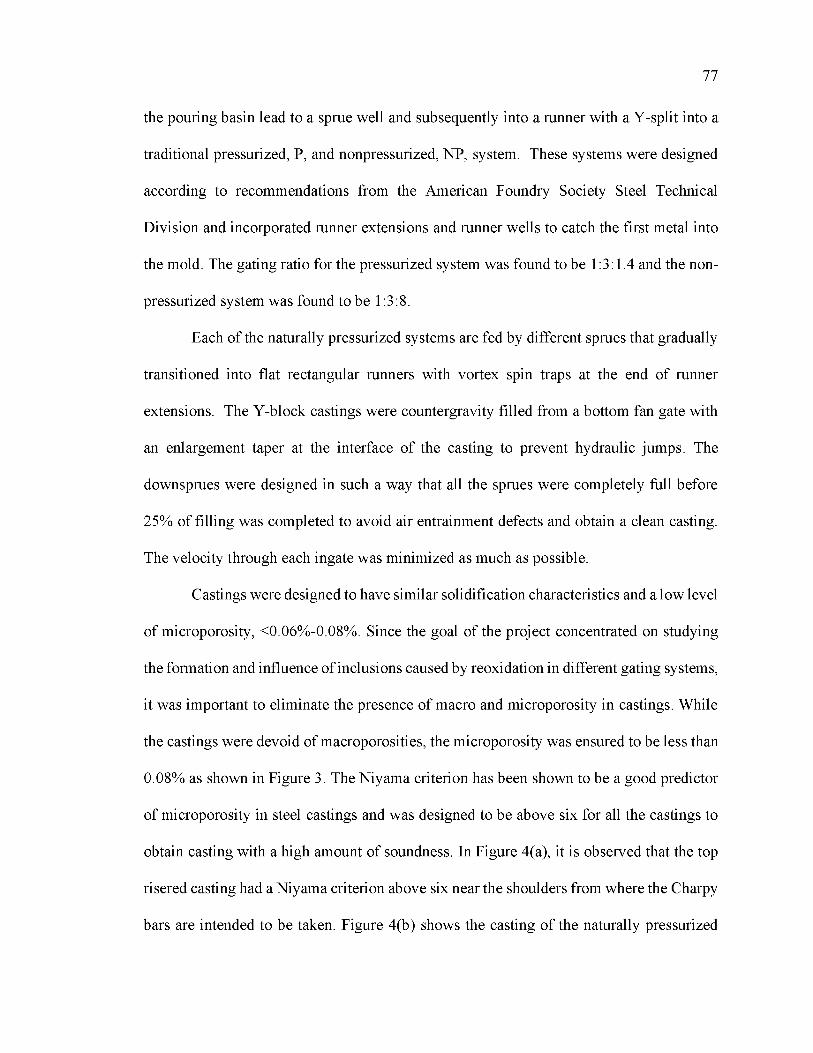
77
the pouring basin lead to a sprue well and subsequently into a runner with a Y-split into a
traditional pressurized, P, and nonpressurized, NP, system. These systems were designed
according to recommendations from the American Foundry Society Steel Technical
Division and incorporated runner extensions and runner wells to catch the first metal into
the mold. The gating ratio for the pressurized system was found to be 1:3:1.4 and the non
pressurized system was found to be 1:3:8.
Each of the naturally pressurized systems are fed by different sprues that gradually
transitioned into flat rectangular runners with vortex spin traps at the end of runner
extensions. The Y-block castings were countergravity filled from a bottom fan gate with
an enlargement taper at the interface of the casting to prevent hydraulic jumps. The
downsprues were designed in such a way that all the sprues were completely full before
25% of filling was completed to avoid air entrainment defects and obtain a clean casting.
The velocity through each ingate was minimized as much as possible.
Castings were designed to have similar solidification characteristics and a low level
of microporosity, <0.06%-0.08%. Since the goal of the project concentrated on studying
the formation and influence of inclusions caused by reoxidation in different gating systems,
it was important to eliminate the presence of macro and microporosity in castings. While
the castings were devoid of macroporosities, the microporosity was ensured to be less than
0.08% as shown in Figure 3. The Niyama criterion has been shown to be a good predictor
of microporosity in steel castings and was designed to be above six for all the castings to
obtain casting with a high amount of soundness. In Figure 4(a), it is observed that the top
risered casting had a Niyama criterion above six near the shoulders from where the Charpy
bars are intended to be taken. Figure 4(b) shows the casting of the naturally pressurized
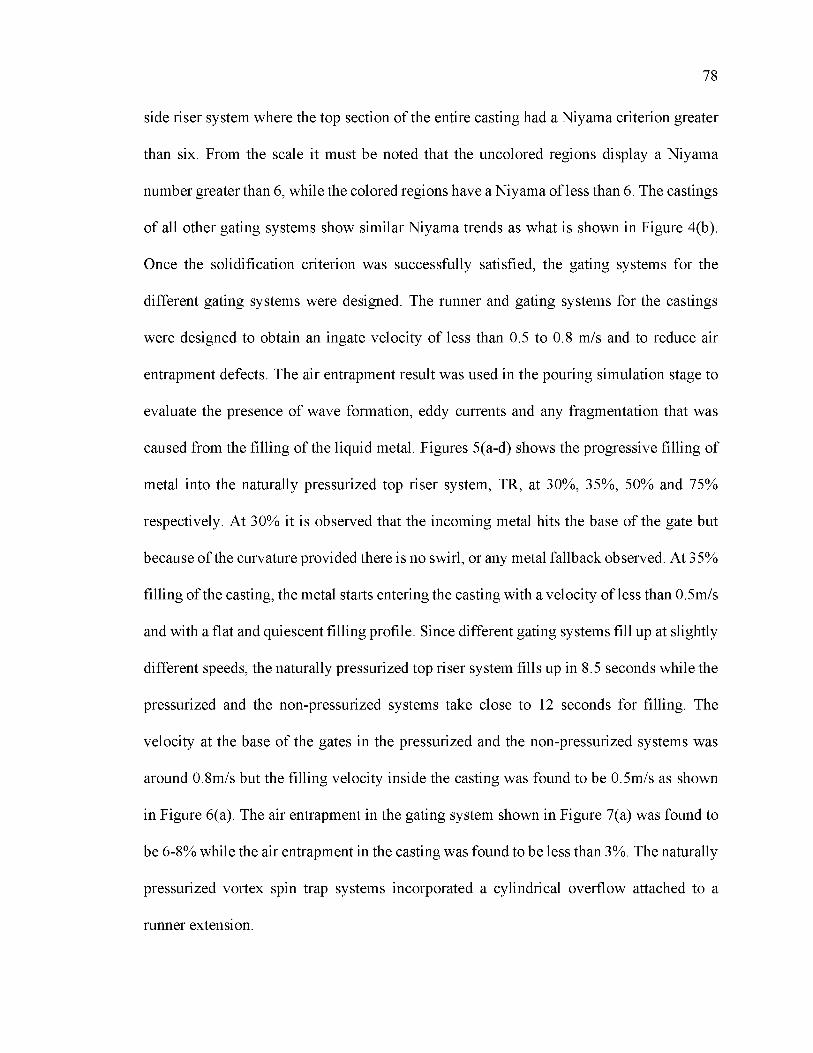
78
side riser system where the top section of the entire casting had a Niyama criterion greater
than six. From the scale it must be noted that the uncolored regions display a Niyama
number greater than 6, while the colored regions have a Niyama of less than 6. The castings
of all other gating systems show similar Niyama trends as what is shown in Figure 4(b).
Once the solidification criterion was successfully satisfied, the gating systems for the
different gating systems were designed. The runner and gating systems for the castings
were designed to obtain an ingate velocity of less than 0.5 to 0.8 m/s and to reduce air
entrapment defects. The air entrapment result was used in the pouring simulation stage to
evaluate the presence of wave formation, eddy currents and any fragmentation that was
caused from the filling of the liquid metal. Figures 5(a-d) shows the progressive filling of
metal into the naturally pressurized top riser system, TR, at 30%, 35%, 50% and 75%
respectively. At 30% it is observed that the incoming metal hits the base of the gate but
because of the curvature provided there is no swirl, or any metal fallback observed. At 35%
filling of the casting, the metal starts entering the casting with a velocity of less than 0.5m/s
and with a flat and quiescent filling profile. Since different gating systems fill up at slightly
different speeds, the naturally pressurized top riser system fills up in 8.5 seconds while the
pressurized and the non-pressurized systems take close to 12 seconds for filling. The
velocity at the base of the gates in the pressurized and the non-pressurized systems was
around 0.8m/s but the filling velocity inside the casting was found to be 0.5m/s as shown
in Figure 6(a). The air entrapment in the gating system shown in Figure 7(a) was found to
be 6-8% while the air entrapment in the casting was found to be less than 3%. The naturally
pressurized vortex spin trap systems incorporated a cylindrical overflow attached to a
runner extension.
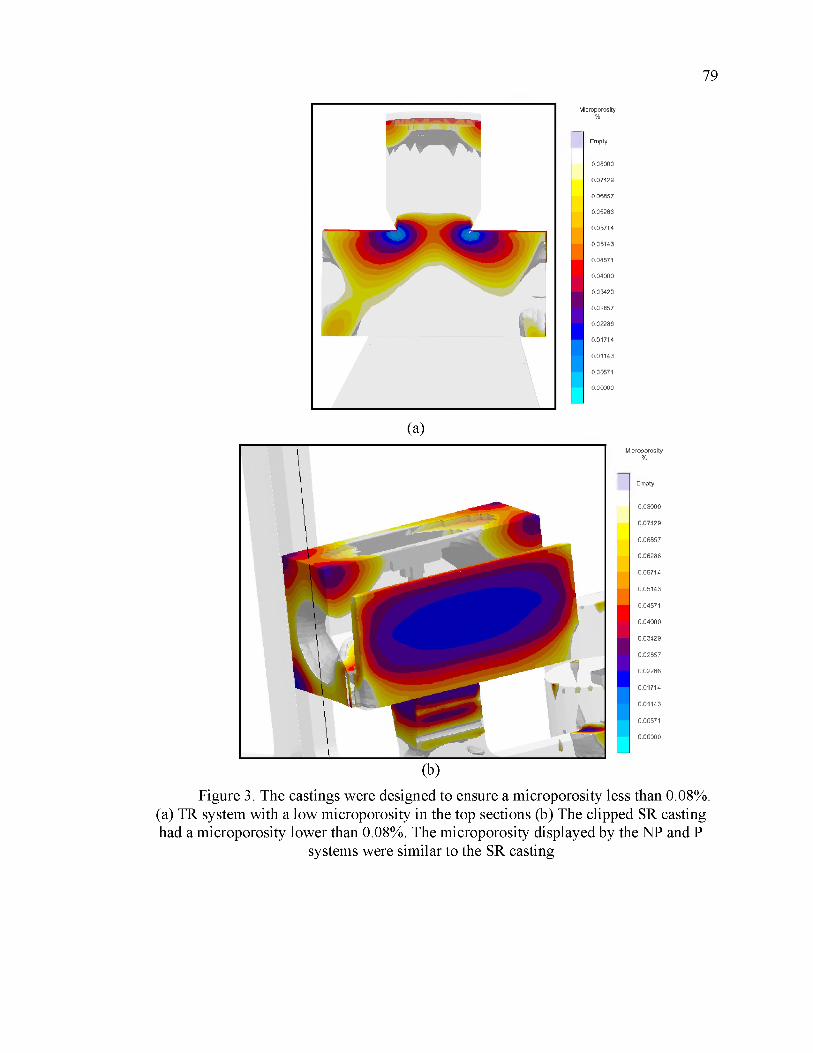
79
Microporosity%
Empty
0 .0 8 0 0 0
0 .0 7 4 2 9
0 .0 6 8 5 7
0 .0 6 2 8 6
0 .0 5 7 1 4
0 .0 5 1 4 3
0 .0 45 7 1
0 .0 4 0 0 0
0 .0 3 4 2 9
0 .0 2 8 5 7
0 .0 2 2 8 6
0 .0 1 7 1 4
0 .0 1 1 4 3
0 .0 05 7 1
0.00000
(a)
(b)
Microporosity% '
Empty
0 .0 8 0 0 0
0 .0 7 4 2 9
0 .0 6 8 5 7
0 .0 6 2 8 6
0 .0 5 7 1 4
0 .0 5 1 4 3
0 .0 45 7 1
0 .0 4 0 0 0
0 .0 3 4 2 9
0 .0 2 8 5 7
0 .0 2 2 8 6
0 .0 1 7 1 4
0 .0 1 1 4 3
0 .0 0 5 7 1
0.00000
Figure 3. The castings were designed to ensure a microporosity less than 0.08%. (a) TR system with a low microporosity in the top sections (b) The clipped SR casting had a microporosity lower than 0.08%. The microporosity displayed by the NP and P
systems were similar to the SR casting
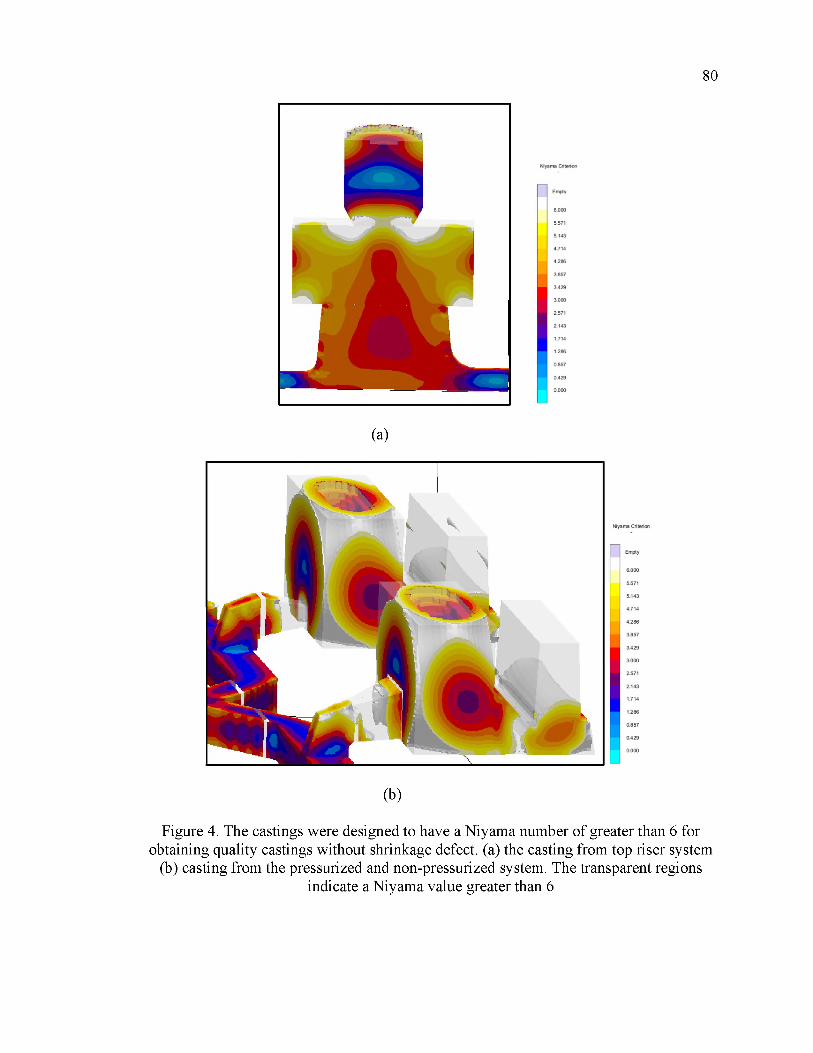
80
(a)
(b)
Figure 4. The castings were designed to have a Niyama number of greater than 6 for obtaining quality castings without shrinkage defect. (a) the casting from top riser system
(b) casting from the pressurized and non-pressurized system. The transparent regionsindicate a Niyama value greater than 6
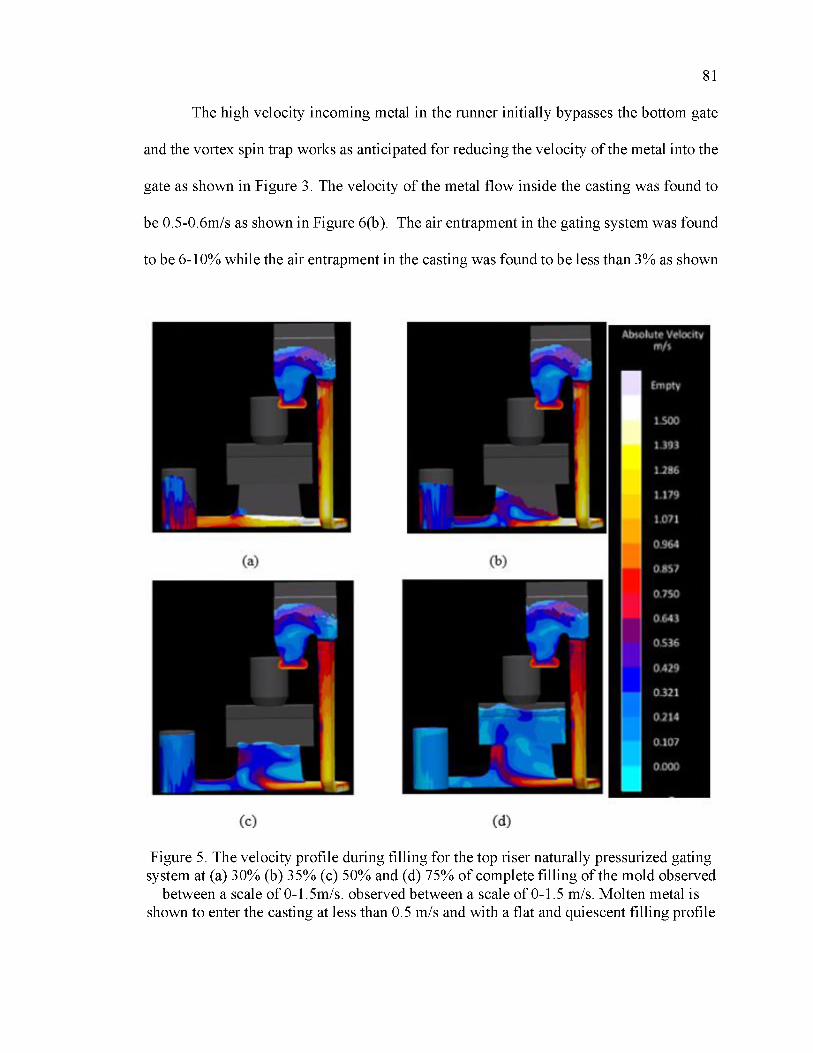
81
The high velocity incoming metal in the runner initially bypasses the bottom gate
and the vortex spin trap works as anticipated for reducing the velocity of the metal into the
gate as shown in Figure 3. The velocity of the metal flow inside the casting was found to
be 0.5-0.6m/s as shown in Figure 6(b). The air entrapment in the gating system was found
to be 6-10% while the air entrapment in the casting was found to be less than 3% as shown
Figure 5. The velocity profile during filling for the top riser naturally pressurized gating system at (a) 30% (b) 35% (c) 50% and (d) 75% of complete filling of the mold observed
between a scale of 0-1.5m/s. observed between a scale of 0-1.5 m/s. Molten metal is shown to enter the casting at less than 0.5 m/s and with a flat and quiescent filling profile

82
Figure 6. The velocity profile of filling when the molten metal enters the casting in (a) the naturally pressurized top riser system (b) the naturally pressurized side riser system
(c) the pressurized system and (d) the non-pressurized system. In (c and d), gate velocity was slightly higher in the traditional pressurized and non-pressurized systems and
increased from less than 0.5 m/s to 0.8m/s
in Figure 7(b). Air entrapment less than 15% is considered a well-designed gating in
castings and the design shows good agreement with the expected values for a good quality
casting.
In the pressurized system, the velocity of the metal into the casting was found to be
less than 0.7m/s and in the non-pressurized system, the velocity less than 0.5m/s as shown
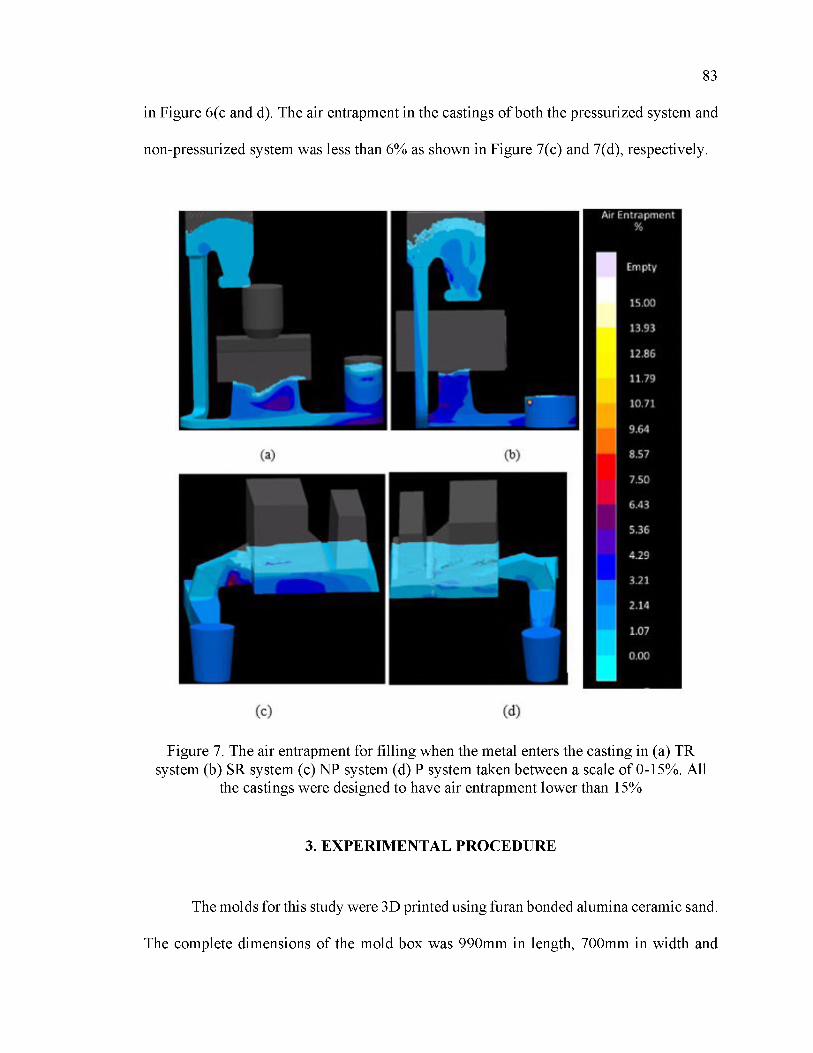
83
in Figure 6(c and d). The air entrapment in the castings of both the pressurized system and
non-pressurized system was less than 6% as shown in Figure 7(c) and 7(d), respectively.
Figure 7. The air entrapment for filling when the metal enters the casting in (a) TR system (b) SR system (c) NP system (d) P system taken between a scale of 0-15%. All
the castings were designed to have air entrapment lower than 15%
3. EXPERIMENTAL PROCEDURE
The molds for this study were 3D printed using furan bonded alumina ceramic sand.
The complete dimensions of the mold box was 990mm in length, 700mm in width and

84
550mm in height. As shown in Figure 8, the cope box on these quad molds consisted of
the risers and the traditionally gated casting cavities while the drag box contained the
runners and the gates. The parting line was irregular and the naturally pressurized casting
cavities were printed separately as cores and glued into place. Openings were provided in
the cope box for inserting the chills. Alumina tubes were inserted into holes in the steel
chills as vents to prevent misrun.
To understand the industrial conditions and replicate actual industrial practices, an
SAE 8630 steel alloy was poured by a partner foundry into two quad molds. The steel was
melted in a 1000lb induction furnace. The melt was protected from oxidation by surface
protective argon liquid, the EGAL process, during steelmaking. The steel was tapped into
a 1000lb teapot style ladle and the ladle temperature was recorded to be 1605°C (2921°F).
The steel was aluminum killed in the ladle prior to pouring. Immersion samples were
obtained in the ladle just prior to pouring and the temperature in the ladle just before the
pour was recorded as 1605°C. The filling time for each mold was measured to be 11
seconds. The top of the castings was sectioned for inclusion analysis. The locations of
samples for inclusion analysis are shown in Figure 10. Samples were sectioned from a
depth of approximately 7.5mm from the top surface of the castings, as shown in Figure
10(a). Five samples, numbered 1, 2, 3, 4 and 5 according to their positions as shown in
Figure 10(b) were obtained for the castings with side risers and four samples were taken
for inclusion analysis in the casting with the top riser as shown in Figure 10(c). Since the
inclusions tend to float to the top, it was decided that analysis near the of the top surface
would be the ideal location for inclusion analysis. The remaining casting was sectioned,
15mm from one end and 25mm from the top (shown as a yellow box), to obtain samples
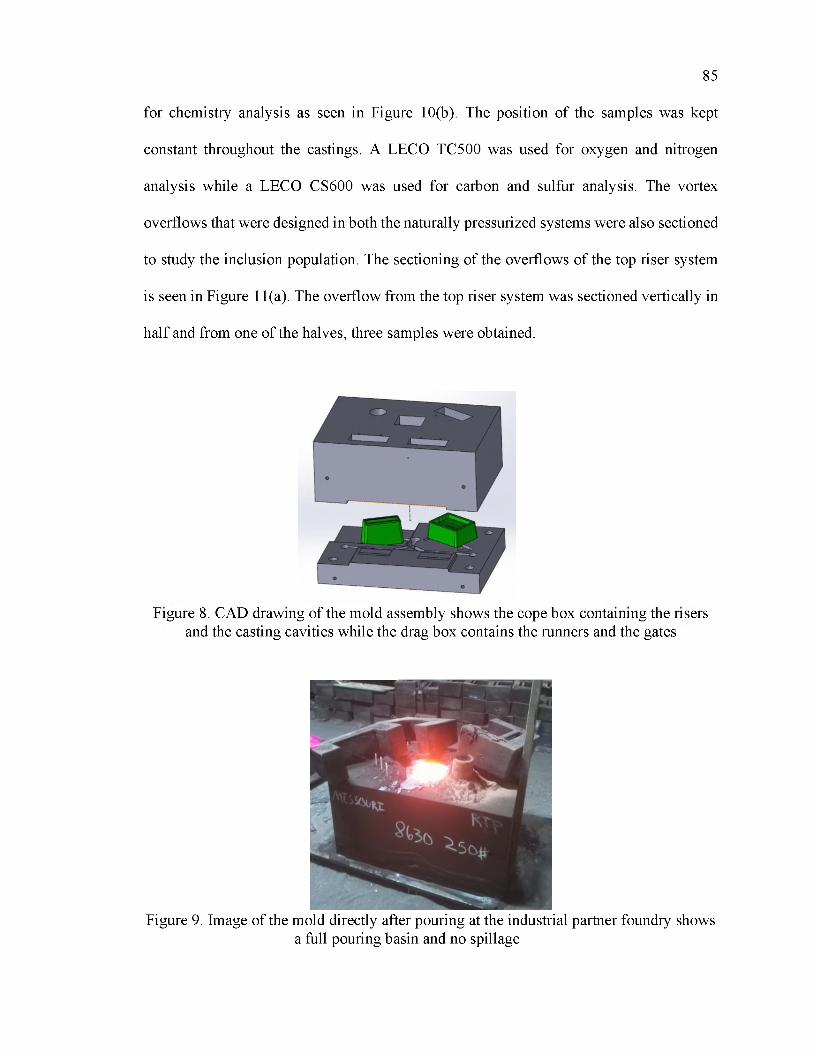
85
for chemistry analysis as seen in Figure 10(b). The position of the samples was kept
constant throughout the castings. A LECO TC500 was used for oxygen and nitrogen
analysis while a LECO CS600 was used for carbon and sulfur analysis. The vortex
overflows that were designed in both the naturally pressurized systems were also sectioned
to study the inclusion population. The sectioning of the overflows of the top riser system
is seen in Figure 11(a). The overflow from the top riser system was sectioned vertically in
half and from one of the halves, three samples were obtained.
Figure 8. CAD drawing of the mold assembly shows the cope box containing the risers and the casting cavities while the drag box contains the runners and the gates
Figure 9. Image of the mold directly after pouring at the industrial partner foundry showsa full pouring basin and no spillage
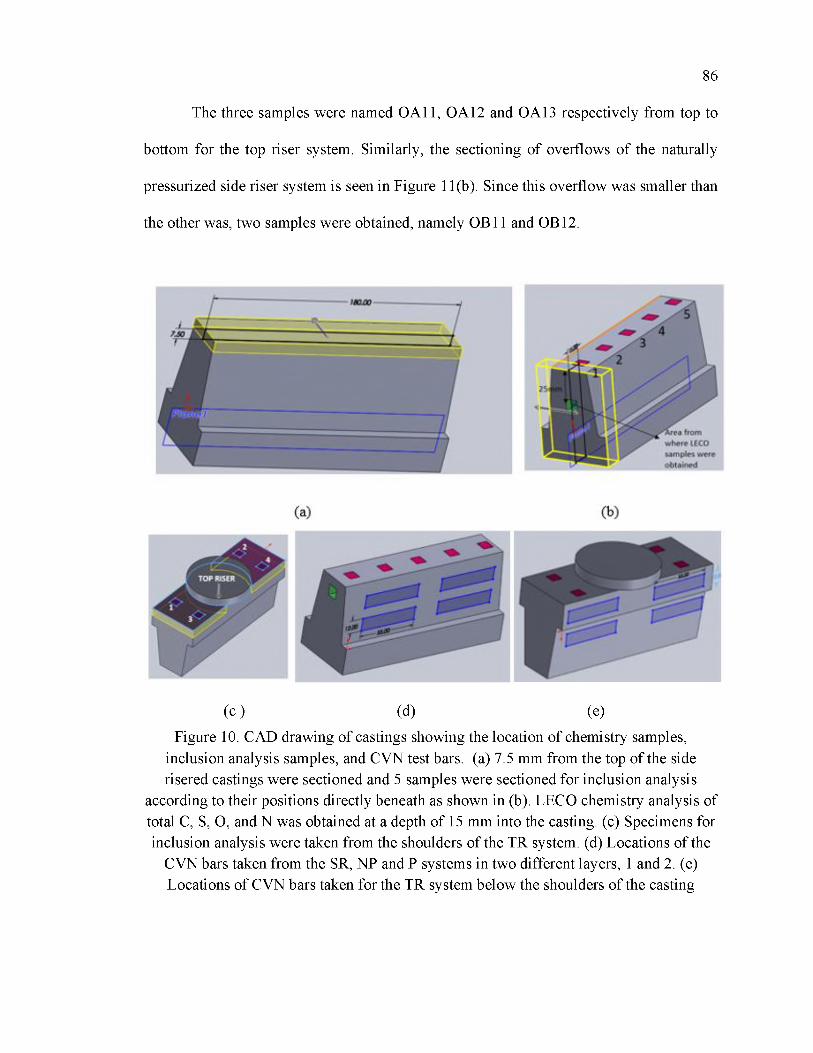
86
The three samples were named OA11, OA12 and OA13 respectively from top to
bottom for the top riser system. Similarly, the sectioning of overflows of the naturally
pressurized side riser system is seen in Figure 11(b). Since this overflow was smaller than
the other was, two samples were obtained, namely OB11 and OB12.
(c ) (d) (e)Figure 10. CAD drawing of castings showing the location of chemistry samples,
inclusion analysis samples, and CVN test bars. (a) 7.5 mm from the top of the side risered castings were sectioned and 5 samples were sectioned for inclusion analysis
according to their positions directly beneath as shown in (b). LECO chemistry analysis of total C, S, O, and N was obtained at a depth of 15 mm into the casting. (c) Specimens for inclusion analysis were taken from the shoulders of the TR system. (d) Locations of the
CVN bars taken from the SR, NP and P systems in two different layers, 1 and 2. (e) Locations of CVN bars taken for the TR system below the shoulders of the casting
87
The samples were metallographically polished and inclusion analysis was
performed. Inclusion analysis of samples was accomplished utilizing an ASPEX PICA
1020 SEM with automated feature analysis. A backscattered electron detector (BSED) and
a magnification of 500X was used for the analysis. An emission current of 32pA with a
dwell time of 12ps was considered for the analysis. To understand and compare the impact
toughness of various gating systems, Charpy V-notch tests were performed at room
temperature as per ASTM E23. The pressurized, non-pressurized and naturally pressurized
side riser system’s castings were sectioned into two layers of 18mm each as shown in the
Figure 10(d). From the first layer 4 samples were obtained, namely 1, 2, 3 and 4 and from
the second layer, four samples were obtained, namely 5, 6, 7 and 8. From Figure 4(a), it
was observed that the naturally pressurized top riser system had a low Niyama criterion the
mid-section. To avoid this shrinkage affecting mechanical properties, samples from this
particular system were obtained as shown in Figure 10(e) from the shoulders of the casting.
These test bars were initially machined to dimensions of 12mmX12mmX55mm. The bars
were normalized by soaking at 900°C for 30 minutes in protective atmosphere and cooled.
The bars were then austenitized at 870°C for 30 minutes, quenched in room temperature
water, and subsequently tempered at 600°C for 30 minutes and water quenched
immediately. The bars were then machined as per ASTM E23 standards and tested at room
temperature using a Tinius Olsen model 84 pendulum type impact testing machine. The
area directly under the fracture surface of selected specimens were metallographically
polished to understand the relationship between area fraction of inclusions and impact
toughness.

88
(a)
(b)
Figure 11. CAD drawing showing the position of samples obtained for inclusion analysis from the vortex overflows in the naturally pressurized systems. These are named OA11, OA12 and OA13 for the top riser, TR, system as shown in (a). (b) Two samples were
obtained for inclusion analysis and named OB11 and OB12 from the side riser, SR,system
4. RESULTS
For the results and discussion section, the following abbreviation would be used for
the different gating systems.
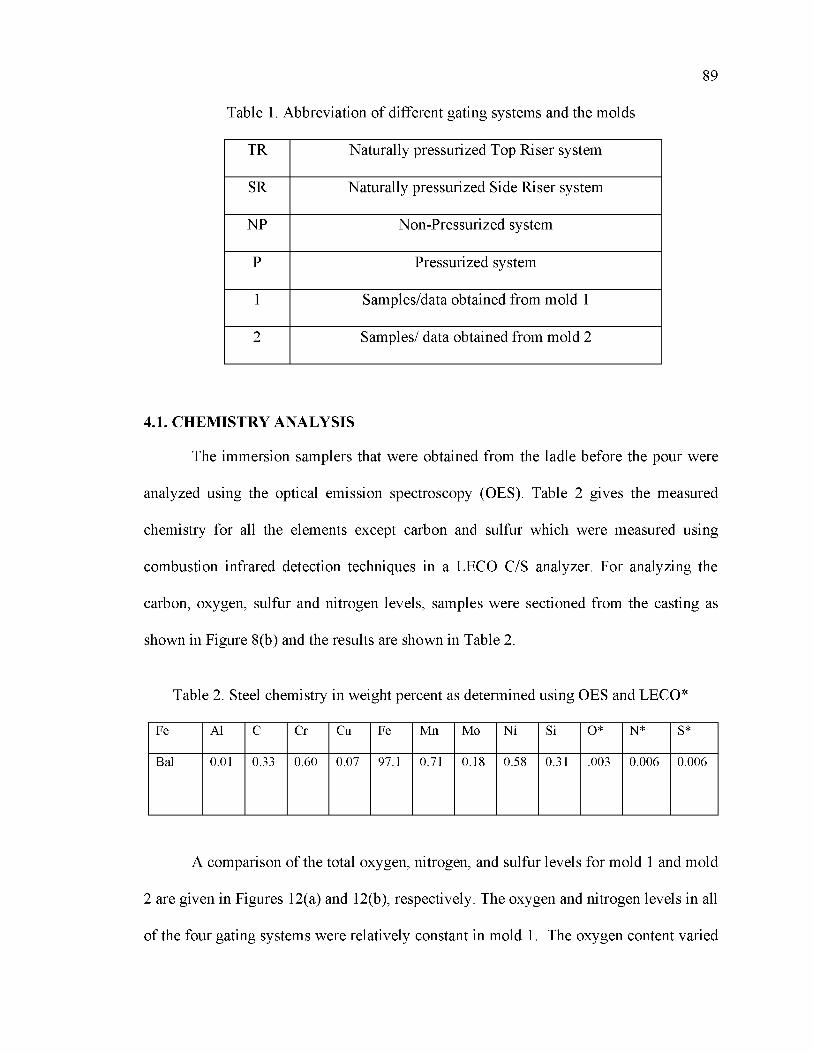
89
Table 1. Abbreviation of different gating systems and the molds
TR Naturally pressurized Top Riser system
SR Naturally pressurized Side Riser system
NP Non-Pressurized system
P Pressurized system
1 Samples/data obtained from mold 1
2 Samples/ data obtained from mold 2
4.1. CHEMISTRY ANALYSIS
The immersion samplers that were obtained from the ladle before the pour were
analyzed using the optical emission spectroscopy (OES). Table 2 gives the measured
chemistry for all the elements except carbon and sulfur which were measured using
combustion infrared detection techniques in a LECO C/S analyzer. For analyzing the
carbon, oxygen, sulfur and nitrogen levels, samples were sectioned from the casting as
shown in Figure 8(b) and the results are shown in Table 2.
Table 2. Steel chemistry in weight percent as determined using OES and LECO*
Fe Al C Cr Cu Fe Mn Mo Ni Si O* N* S*
Bal 0.01 0.33 0.60 0.07 97.1 0.71 0.18 0.58 0.31 .003 0.006 0.006
A comparison of the total oxygen, nitrogen, and sulfur levels for mold 1 and mold
2 are given in Figures 12(a) and 12(b), respectively. The oxygen and nitrogen levels in all
of the four gating systems were relatively constant in mold 1. The oxygen content varied
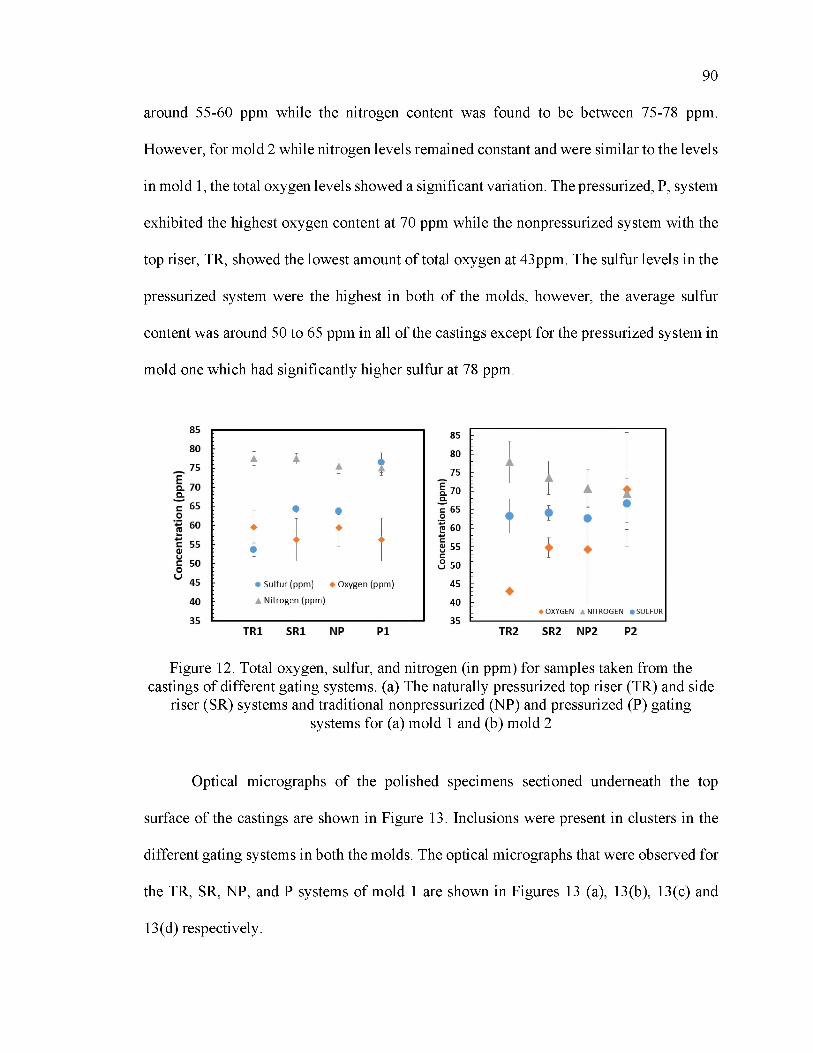
90
around 55-60 ppm while the nitrogen content was found to be between 75-78 ppm.
However, for mold 2 while nitrogen levels remained constant and were similar to the levels
in mold 1, the total oxygen levels showed a significant variation. The pressurized, P, system
exhibited the highest oxygen content at 70 ppm while the nonpressurized system with the
top riser, TR, showed the lowest amount of total oxygen at 43ppm. The sulfur levels in the
pressurized system were the highest in both of the molds, however, the average sulfur
content was around 50 to 65 ppm in all of the castings except for the pressurized system in
mold one which had significantly higher sulfur at 78 ppm.
Figure 12. Total oxygen, sulfur, and nitrogen (in ppm) for samples taken from the castings of different gating systems. (a) The naturally pressurized top riser (TR) and side
riser (SR) systems and traditional nonpressurized (NP) and pressurized (P) gating systems for (a) mold 1 and (b) mold 2
Optical micrographs of the polished specimens sectioned underneath the top
surface of the castings are shown in Figure 13. Inclusions were present in clusters in the
different gating systems in both the molds. The optical micrographs that were observed for
the TR, SR, NP, and P systems of mold 1 are shown in Figures 13 (a), 13(b), 13(c) and
13(d) respectively.

91
'(a) (b)
(c) (d)Figure 13. The optical micrographs taken from the different gating systems in mold 1
reveal the presence of inclusions present in clusters throughout the samples. (a) Naturally pressurized top riser (b) Naturally pressurized side riser (c) Non-pressurized system (d)
Pressurized system
4.2. NON-METALLIC INCLUSION ANALYSIS
Inclusion analysis of samples was accomplished utilizing ASPEX PICA 1020 SEM
with automated feature analysis. Inclusion analysis revealed that most of the inclusions
found in the samples were manganese sulfide (MnS), alumina (AhO 3) and complex AhO 3
- MnS inclusions. Some representative backscattered electron, BSE, images of inclusions
are shown in Figure 14.
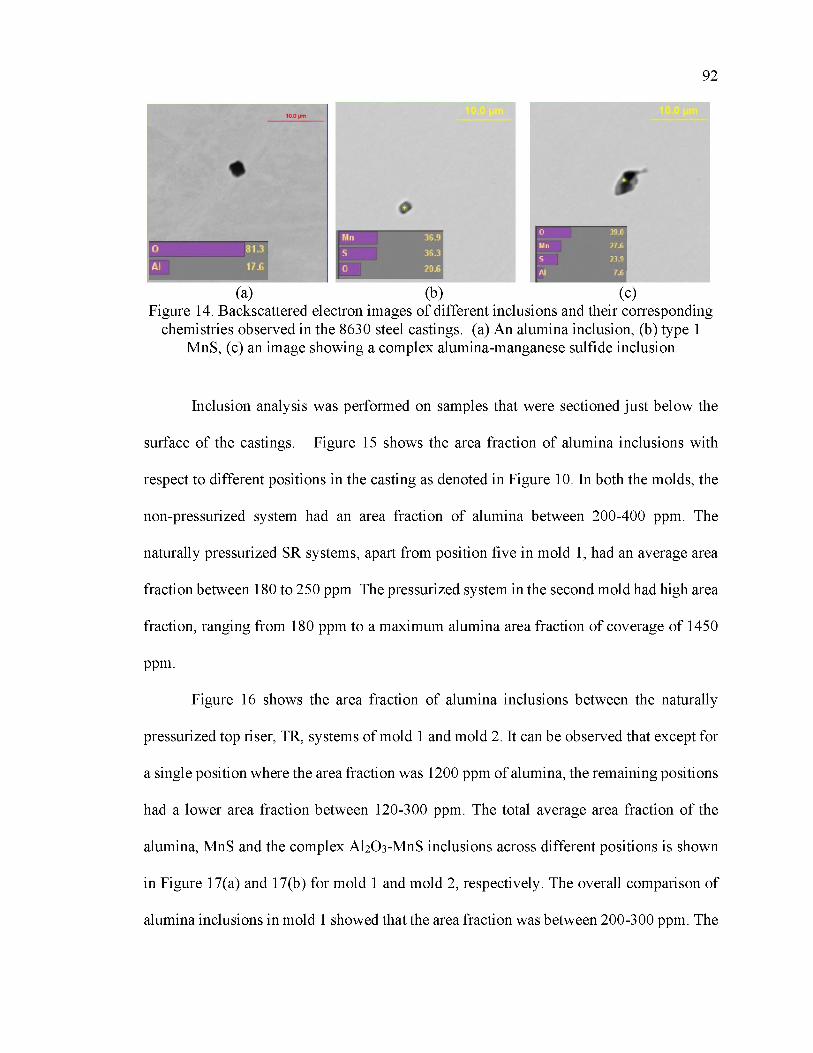
92
(a) (b) (c)Figure 14. Backscattered electron images of different inclusions and their corresponding
chemistries observed in the 8630 steel castings. (a) An alumina inclusion, (b) type 1 MnS, (c) an image showing a complex alumina-manganese sulfide inclusion
Inclusion analysis was performed on samples that were sectioned just below the
surface of the castings. Figure 15 shows the area fraction of alumina inclusions with
respect to different positions in the casting as denoted in Figure 10. In both the molds, the
non-pressurized system had an area fraction of alumina between 200-400 ppm. The
naturally pressurized SR systems, apart from position five in mold 1, had an average area
fraction between 180 to 250 ppm. The pressurized system in the second mold had high area
fraction, ranging from 180 ppm to a maximum alumina area fraction of coverage of 1450
ppm .
Figure 16 shows the area fraction of alumina inclusions between the naturally
pressurized top riser, TR, systems of mold 1 and mold 2. It can be observed that except for
a single position where the area fraction was 1200 ppm of alumina, the remaining positions
had a lower area fraction between 120-300 ppm. The total average area fraction of the
alumina, MnS and the complex AhO 3-MnS inclusions across different positions is shown
in Figure 17(a) and 17(b) for mold 1 and mold 2, respectively. The overall comparison of
alumina inclusions in mold 1 showed that the area fraction was between 200-300 ppm. The
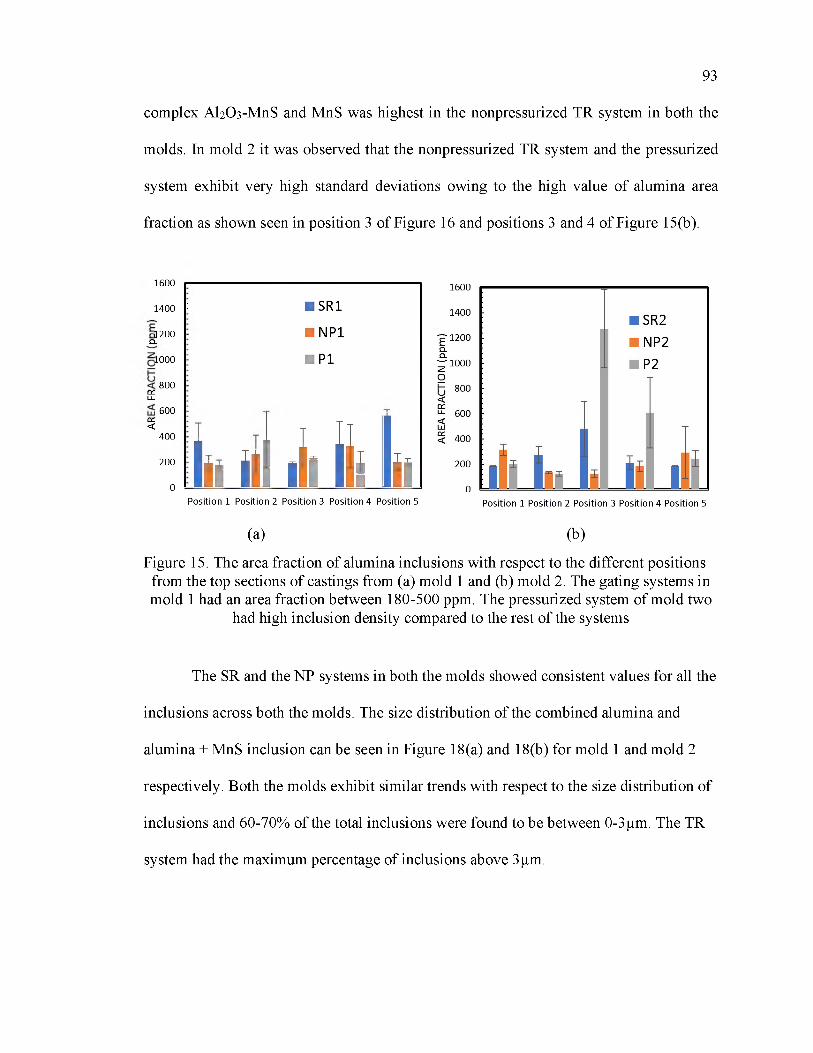
93
complex Al2O3-MnS and MnS was highest in the nonpressurized TR system in both the
molds. In mold 2 it was observed that the nonpressurized TR system and the pressurized
system exhibit very high standard deviations owing to the high value of alumina area
fraction as shown seen in position 3 of Figure 16 and positions 3 and 4 of Figure 15(b).
1 6 0 0
1 4 0 0
1 2 0 0Q.
1 0 0 0
8 0 0DCLl_
6 0 0DC<
4 0 0
2 0 0
0
1 ■ SR1
■ NP1
■ P1
IniI iii iii IiiP o s it io n 1 P o s it io n 2 P o s it io n 3 P o s it io n 4 P o s it io n 5 P o s it io n 1 P o s it io n 2 P o s it io n 3 P o s it io n 4 P o s it io n 5
(a) (b)
Figure 15. The area fraction of alumina inclusions with respect to the different positions from the top sections of castings from (a) mold 1 and (b) mold 2. The gating systems in mold 1 had an area fraction between 180-500 ppm. The pressurized system of mold two
had high inclusion density compared to the rest of the systems
The SR and the NP systems in both the molds showed consistent values for all the
inclusions across both the molds. The size distribution of the combined alumina and
alumina + MnS inclusion can be seen in Figure 18(a) and 18(b) for mold 1 and mold 2
respectively. Both the molds exhibit similar trends with respect to the size distribution of
inclusions and 60-70% of the total inclusions were found to be between 0-3pm. The TR
system had the maximum percentage of inclusions above 3 pm.
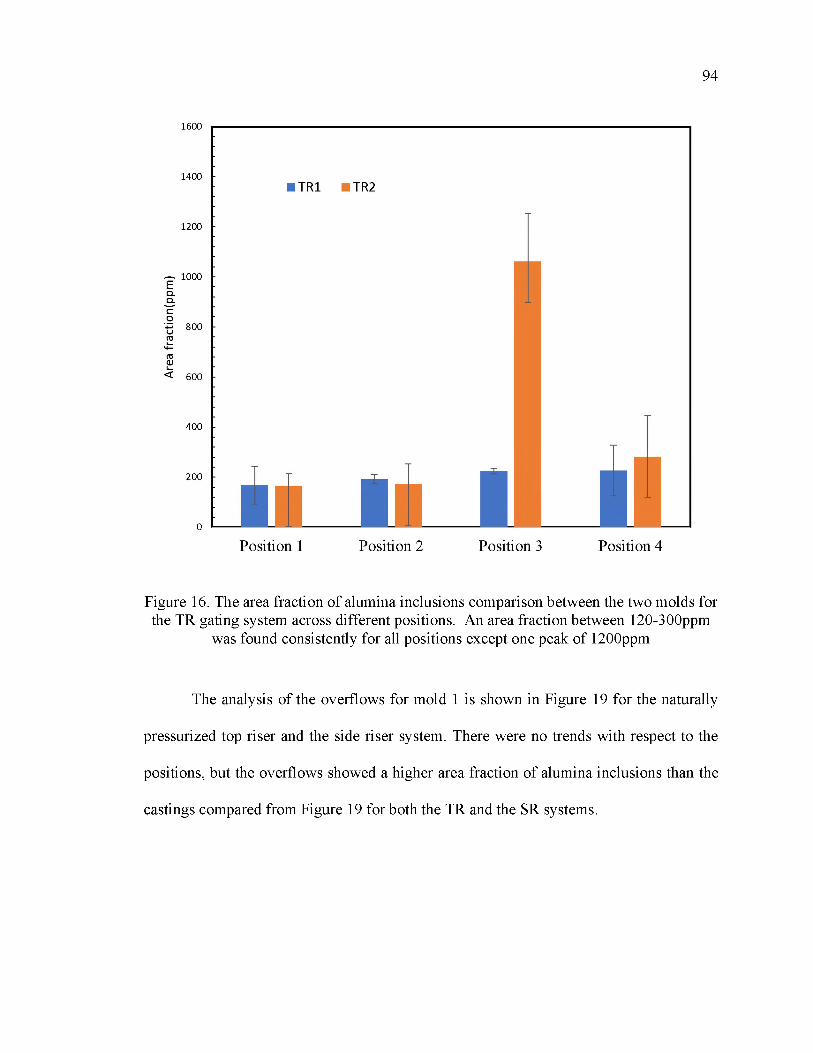
94
Figure 16. The area fraction of alumina inclusions comparison between the two molds for the TR gating system across different positions. An area fraction between 120-300ppm
was found consistently for all positions except one peak of 1200ppm
The analysis of the overflows for mold 1 is shown in Figure 19 for the naturally
pressurized top riser and the side riser system. There were no trends with respect to the
positions, but the overflows showed a higher area fraction of alumina inclusions than the
castings compared from Figure 19 for both the TR and the SR systems.
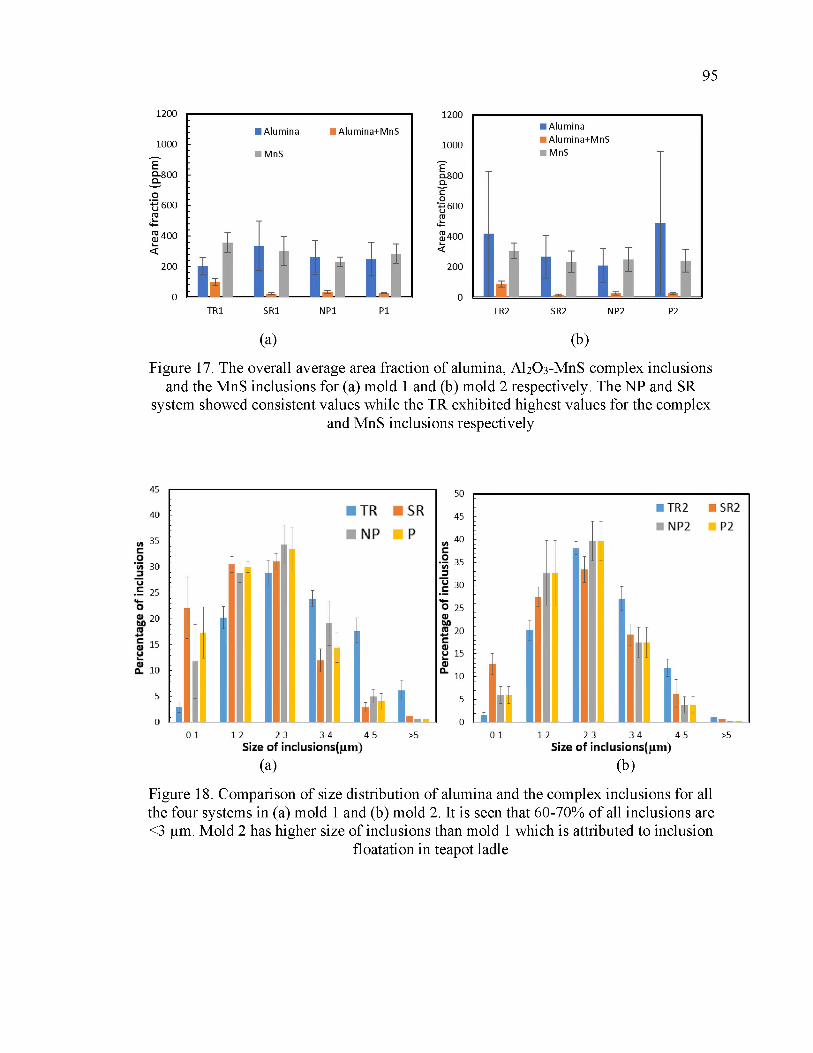
95
(a) (b)
Figure 17. The overall average area fraction of alumina, AhO 3-MnS complex inclusions and the MnS inclusions for (a) mold 1 and (b) mold 2 respectively. The NP and SR
system showed consistent values while the TR exhibited highest values for the complexand MnS inclusions respectively
Size of inclusions(pm )(a)
Size of inclusions(pm )
(b)
Figure 18. Comparison of size distribution of alumina and the complex inclusions for all the four systems in (a) mold 1 and (b) mold 2. It is seen that 60-70% of all inclusions are <3 pm. Mold 2 has higher size of inclusions than mold 1 which is attributed to inclusion
floatation in teapot ladle
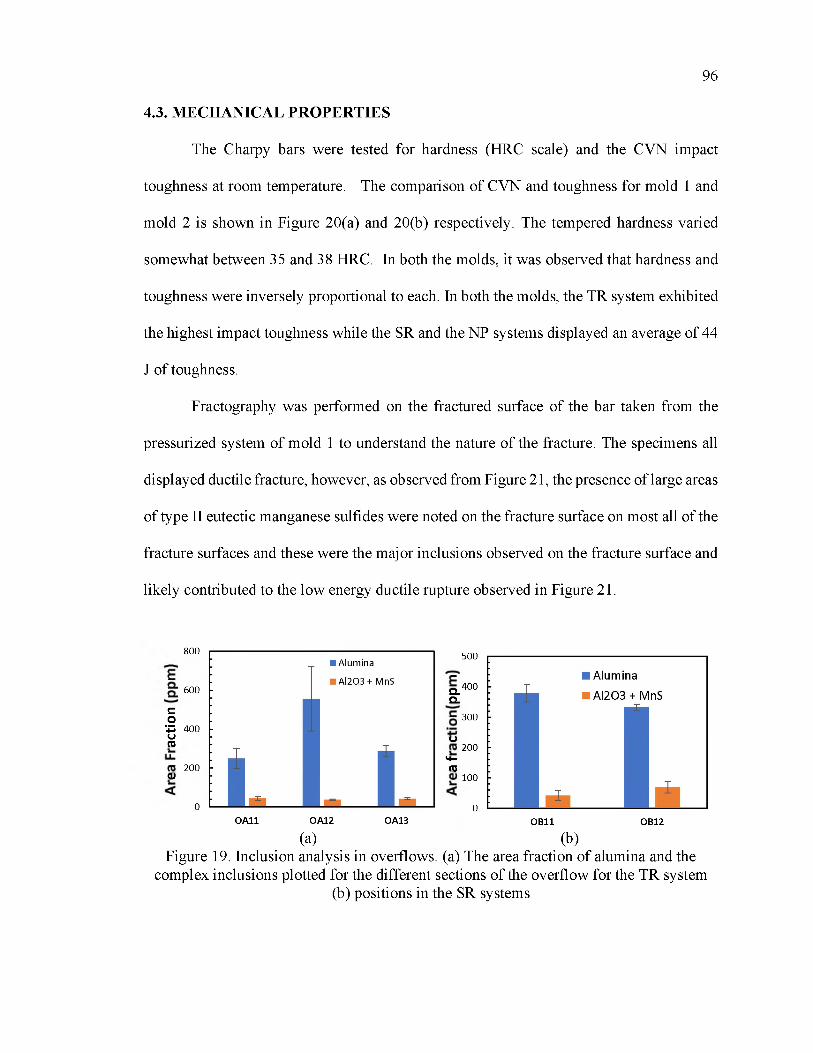
96
4.3. MECHANICAL PROPERTIES
The Charpy bars were tested for hardness (HRC scale) and the CVN impact
toughness at room temperature. The comparison of CVN and toughness for mold 1 and
mold 2 is shown in Figure 20(a) and 20(b) respectively. The tempered hardness varied
somewhat between 35 and 38 HRC. In both the molds, it was observed that hardness and
toughness were inversely proportional to each. In both the molds, the TR system exhibited
the highest impact toughness while the SR and the NP systems displayed an average of 44
J of toughness.
Fractography was performed on the fractured surface of the bar taken from the
pressurized system of mold 1 to understand the nature of the fracture. The specimens all
displayed ductile fracture, however, as observed from Figure 21, the presence of large areas
of type II eutectic manganese sulfides were noted on the fracture surface on most all of the
fracture surfaces and these were the major inclusions observed on the fracture surface and
likely contributed to the low energy ductile rupture observed in Figure 21.
8 0 0
6 0 0
CO5uns4 0 0
2 0 0O)
5 0 0
Q.Q.4 0 0
3 0 0
u2 0 0
M-ns
1 0 0
OA11 OA12 OA13 OB11 OB120 0
(a) (b)Figure 19. Inclusion analysis in overflows. (a) The area fraction of alumina and the
complex inclusions plotted for the different sections of the overflow for the TR system(b) positions in the SR systems
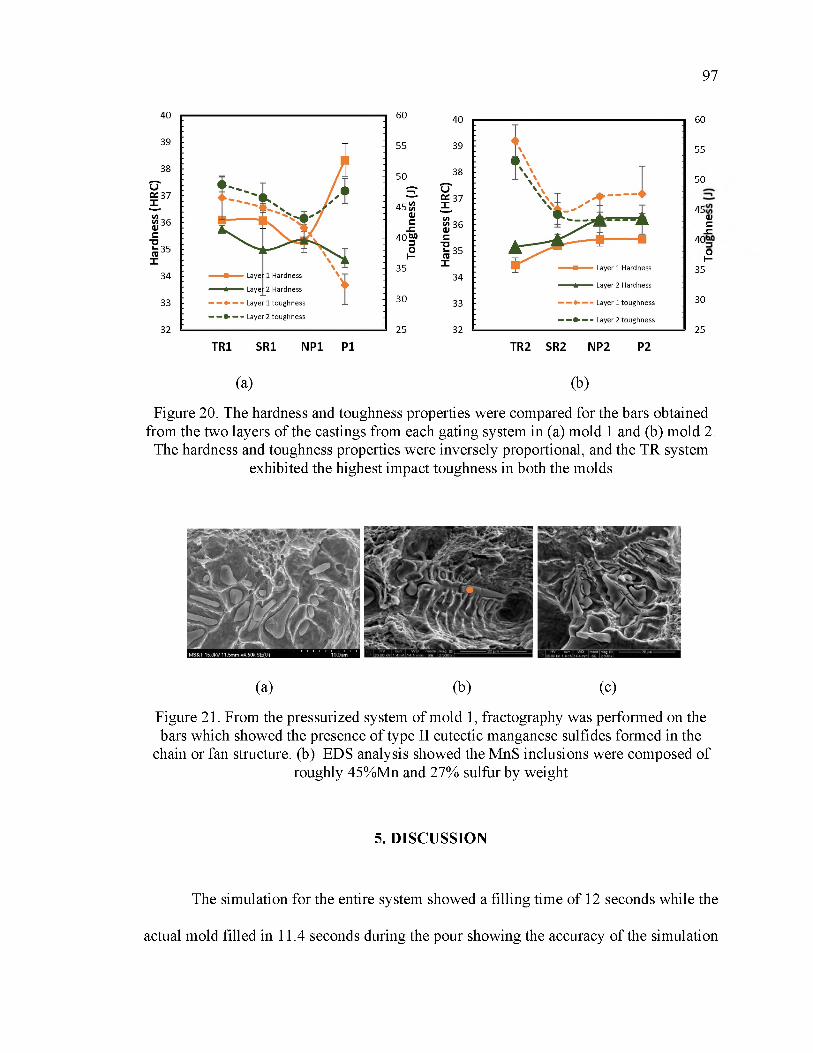
97
(a)
60
55
5 0
4501C.£
4 0OI-
35
30
25
Figure 20. The hardness and toughness properties were compared for the bars obtained from the two layers of the castings from each gating system in (a) mold 1 and (b) mold 2.
The hardness and toughness properties were inversely proportional, and the TR system exhibited the highest impact toughness in both the molds
(a) (b) (c)
Figure 21. From the pressurized system of mold 1, fractography was performed on the bars which showed the presence of type II eutectic manganese sulfides formed in the
chain or fan structure. (b) EDS analysis showed the MnS inclusions were composed of roughly 45%Mn and 27% sulfur by weight
5. DISCUSSION
The simulation for the entire system showed a filling time of 12 seconds while the
actual mold filled in 11.4 seconds during the pour showing the accuracy of the simulation
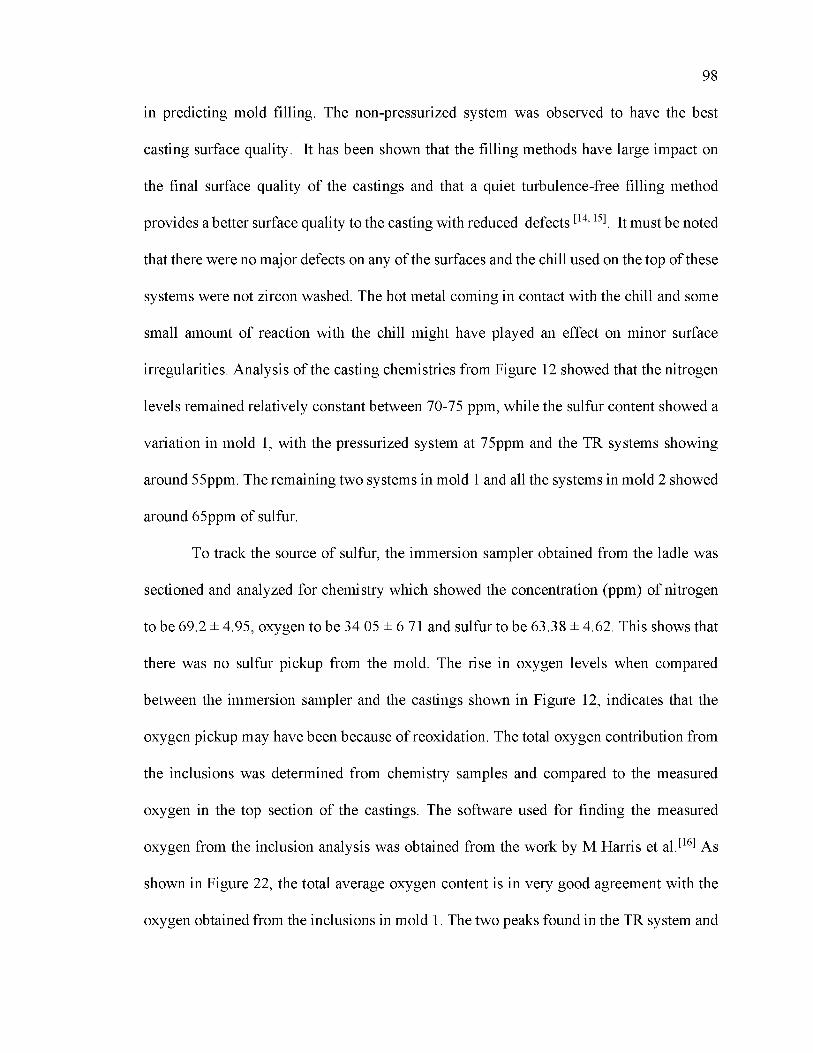
98
in predicting mold filling. The non-pressurized system was observed to have the best
casting surface quality. It has been shown that the filling methods have large impact on
the final surface quality of the castings and that a quiet turbulence-free filling method
provides a better surface quality to the casting with reduced defects [14, 15]. It must be noted
that there were no major defects on any of the surfaces and the chill used on the top of these
systems were not zircon washed. The hot metal coming in contact with the chill and some
small amount of reaction with the chill might have played an effect on minor surface
irregularities. Analysis of the casting chemistries from Figure 12 showed that the nitrogen
levels remained relatively constant between 70-75 ppm, while the sulfur content showed a
variation in mold 1, with the pressurized system at 75ppm and the TR systems showing
around 55ppm. The remaining two systems in mold 1 and all the systems in mold 2 showed
around 65ppm of sulfur.
To track the source of sulfur, the immersion sampler obtained from the ladle was
sectioned and analyzed for chemistry which showed the concentration (ppm) of nitrogen
to be 69.2 ± 4.95, oxygen to be 34.05 ± 6.71 and sulfur to be 63.38 ± 4.62. This shows that
there was no sulfur pickup from the mold. The rise in oxygen levels when compared
between the immersion sampler and the castings shown in Figure 12, indicates that the
oxygen pickup may have been because of reoxidation. The total oxygen contribution from
the inclusions was determined from chemistry samples and compared to the measured
oxygen in the top section of the castings. The software used for finding the measured
oxygen from the inclusion analysis was obtained from the work by M Harris et al.[16] As
shown in Figure 22, the total average oxygen content is in very good agreement with the
oxygen obtained from the inclusions in mold 1. The two peaks found in the TR system and

99
the P system in mold 2 was because of the high alumina content in the third position of TR
system and third and fourth position of P system respectively as observed in Figure 16 and
Figure 15(b).
The optical microstructural analysis as shown in Figure 13, indicated that the
alumina inclusions were found in clusters. In the work by Yin et al, it is seen that there
exists a strong long-range attraction force between alumina inclusions in low-carbon
aluminum-killed steels.[17]. T.B.Braun et al.[18], showed that, the clusters of alumina
inclusions are formed because of the collision and coalescence of individual alumina
inclusions as a result of convective currents in the melt. To understand the types of
inclusions and their formation, thermodynamic modelling for the 8630-steel composition
was performed using the JMatPro software. The steel was modelled with 0.006 wt%
oxygen, 0.0075 wt% nitrogen and 0.007wt% of sulfur to understand the formation and
stability of the inclusions. Figure 23 shows the phases that formed as a function of
equilibrium cooling. It is observed that the liquidus of the system was 1435°C. Stable
precipitation of alumina as observed at steelmaking temperatures. MnS formed below the
liquidus temperature during solidification.
The inclusion analysis shown in Figure 15, indicates that there was no definite
pattern of inclusions acquired with respect to positions. In mold 1 except position 2 of the
pressurized system and position 5 of the SR system, the rest of the positions for all the
systems exhibited an area fraction between 160-240ppm. In mold 2, the area fraction of
inclusions remained almost constant except two of the positions in the pressurized system
displaying huge deviations. Figure 18 shows that the third position in mold 2 showed an
area fraction of 1200 ppm of alumina.

100
(a) (b)Figure 22. Calculated total oxygen contribution of inclusions from specimens obtained from the top section of the castings as compared to the measured oxygen from LECO
analysis
Tem p erature (0C )
Figure 23. Thermodynamic modeling of the equilibrium solidification of 8630 steel with 0.0075% N, 0.006% O, and 0.007% S. AhO 3 is stable in the liquid well above the
liquidus. MnS forms after the liquidus during solidification
Using Magmasoft 5.4.1. alumina inclusion tracers with density 3g/cc were used to
simulate and predict the formation and accumulation of reoxidation inclusions. As
observed in Figure 24(a) (marked by a black circle), for the TR system, the accumulation

101
of inclusions takes place in the locations where the sample 3 was obtained as shown in
8(d). Similarly, in 24(b), a high concentration of inclusions is obtained from the same
location where sample 3 and 4 were acquired. Comparing the above data with Figure 15(b)
and 16, it is seen that the simulation results correlate well with the inclusion analysis
indicating high alumina concentration in the same locations for the TR and P systems. This
validates the presence and accumulation of inclusions in certain areas compared to the
others. In both the images, the white areas show the accumulation of alumina inclusions.
However, it must be remembered that, these areas may not be the final location of
inclusions. There are possibilities for movement of inclusions once solidification begins
and the presence of the white areas indicating area fraction of alumina are subject to
relocation.
Figure 18(a and b) shows the size distribution of the alumina and the complex
inclusions across the different gating systems for the two molds. Mold 2 was found to have
larger sized inclusion than mold 1. This indicates that the cleaner metal enters the first mold
from the bottom half of the teapot ladle while the second mold collects metal from the top
half of the teapot ladle. Due to inclusion floatation, mold 1 has cleaner metal than mold 2.
This leads to the accumulation of higher sized inclusions in mold 2. Moreover, the TR
system had a higher percentage of larger sized inclusions, than the other systems. Since the
TR systems was provided with a top riser while the remaining three systems had a side
riser, the movement of larger sized inclusions towards the top riser, leads to the
accumulation of larger sized inclusions near its evaluation area.
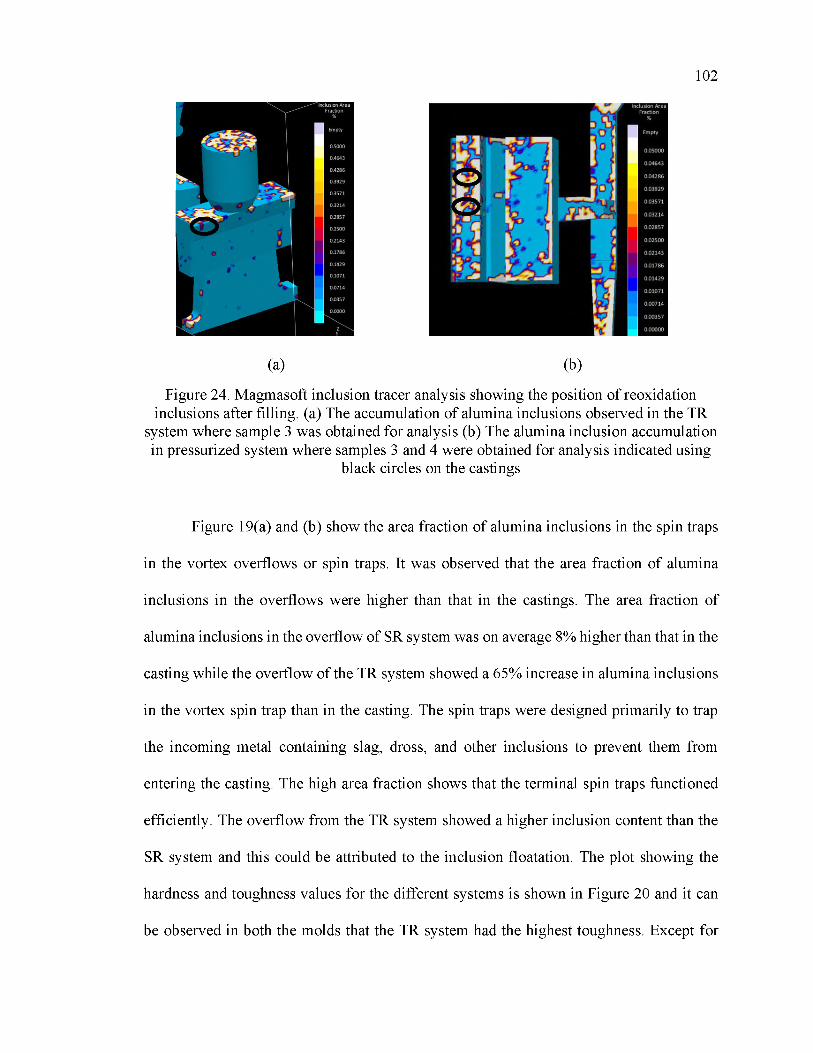
102
(a) (b)
Figure 24. Magmasoft inclusion tracer analysis showing the position of reoxidation inclusions after filling. (a) The accumulation of alumina inclusions observed in the TR
system where sample 3 was obtained for analysis (b) The alumina inclusion accumulation in pressurized system where samples 3 and 4 were obtained for analysis indicated using
black circles on the castings
Figure 19(a) and (b) show the area fraction of alumina inclusions in the spin traps
in the vortex overflows or spin traps. It was observed that the area fraction of alumina
inclusions in the overflows were higher than that in the castings. The area fraction of
alumina inclusions in the overflow of SR system was on average 8% higher than that in the
casting while the overflow of the TR system showed a 65% increase in alumina inclusions
in the vortex spin trap than in the casting. The spin traps were designed primarily to trap
the incoming metal containing slag, dross, and other inclusions to prevent them from
entering the casting. The high area fraction shows that the terminal spin traps functioned
efficiently. The overflow from the TR system showed a higher inclusion content than the
SR system and this could be attributed to the inclusion floatation. The plot showing the
hardness and toughness values for the different systems is shown in Figure 20 and it can
be observed in both the molds that the TR system had the highest toughness. Except for

103
the pressurized system of mold 1, in both the molds, layers 1 and 2 respectively, did not
show a statistically significant difference in the impact toughness. The TR system from
mold 2 showed a maximum toughness of 56±4 J while the pressurized system from mold
1 showed the least toughness of 43J. The difference in the variation in toughness of layer
1 and layer 2 of the P system, could be a function of hardness. In an earlier study performed
by Stephens (19), for 8630 steel, a hardness of 32.5HRC and a CVN toughness of 32 J was
obtained at 25°C. In the current experiment, a maximum toughness of 52 J is observed and
an average toughness of 45±6 J at an average hardness of 35HRC taken across all the
systems. As seen in Figure 21, the presence of the eutectic type II manganese sulfides was
the main factor leading to loss in fracture toughness. To understand the relationship
between the MnS inclusions and toughness, a polished section was obtained directly
beneath the fracture surface of the test bars. In Figure 25, the MnS inclusion density
obtained from the sections underneath the Charpy bars is plotted against the corresponding
toughness. An inverse relationship between the inclusion density of manganese sulfides
and toughness of the inclusions is observed as shown in Figure 25. The TR system shows
the least MnS inclusions across both the layers and hence the highest toughness among all
the systems. The consistency in the amount of MnS density across both the systems and
the associated toughness shows that the toughness was dependent on the MnS inclusions
in all the gating systems across both the molds. From literature (20-22), among the three types
of sulfides, the type II which are formed as a chains or fan like structures in interdendritic
regions during solidification and are the most detrimental to the mechanical properties of
steel. The toughness of notched bars was reduced as much as 50% with the presence of
these eutectic sulfides. Type II sulfide inclusions cover large areas of the surface which

104
leads to high stress concentration and easy crack initiation and propagation causing
premature ductile failure in steels and a corresponding loss in strength and toughness.
160
140
120E,£ 100 >
80£a>
60to£
40
20
0 — A - Toughness(J) m old 1
60
50
40
30
20
10
0
cuo£o
TR SR NP
Figure 25. Notch toughness plotted along with the density of manganese sulfide inclusions for (a) mold 1 and (b) mold 2. It was observed that the toughness and the
inclusion density display an inverse trend for both the molds
6. CONCLUSION
To understand the effect of filling on steel castings and quantify them, four gating
systems, namely, a non-pressurized system with a side riser, pressurized system with a side
riser, a naturally pressurized top riser and a naturally pressurized side riser system were
designed using MagmaSoft 5.3.1. The solidification parameters like macro and
microporosity, Niyama criterion and hotspots were simulated. The runners and gates were
designed to minimize ingate velocity to less than 0.8m/s and air entrapment less than 15%.
The two naturally pressurized systems were provided with vortex overflows to collect the
incoming new metal and to reduce the velocity of liquid metal for smoother filling. A
common pouring basin was designed to unite the system and the castings were chilled and

105
vented. Alumina and manganese sulfide were the major inclusions found. Alumina
inclusions were mainly found in clusters throughout the castings from all the four systems.
The overall comparison of inclusions from samples obtained from the top layer of the
castings showed that the top riser performed the best, followed by the non-pressurized
system. The pressurized system exhibited high area fraction of alumina inclusions.
Sectioning of overflows revealed that the area fraction of inclusions in overflows were
higher than in the castings proving that the overflows collected most of the damaged
incoming metal and slag effectively. The naturally pressurized system with a top riser was
shown to have the highest toughness among all the systems. The type II eutectic MnS were
the major reason for low energy ductile fracture. The naturally pressurized gating systems
with overflows provided castings with better surface quality and lower inclusions. The
naturally pressurized systems provide better quality metal and would be a good fit for
producing cleaner castings with good mechanical properties for 8630 steel.
ACKNOWLEDGEMENTS
The authors greatly acknowledge the contributions of the many undergraduate
research assistants that contributed to this research: Thomas Wall, Graham Stanley and
Ethan Klafehn. This proj ect was supported by American Foundry Society and we gratefully
thank the AFS technical committee for funding of this project. The authors would also like
to heartily thank Mr. Doug Imrie and Mr. Zach Henderson from Southern Cast Products
who were the industrial sponsors for the project. The authors also greatly acknowledge
MAGMA LLC for their support during the design phase and encouraging the metal casting
106
program at Missouri S&T as well as their contribution to the modeling work within this
manuscript.
REFERENCES
1. John Campbell “Castings” Butterworth-Heineman (2003)
2. Xue X, Hansen S.F, Hansen P.N, Water Analog Study of Effects Gating Designs on Inclusion Separation and mold filling control, AFS Transactions, vol. 101, pp.199-209, (1993)
3. Lin H.J, Hwang W. S., Three-Dimensional Fluid Flow Simulation for Mold Filling, AFS Transactions, vol. 97, pp 855-862, (1989)
4. Griffin, J. A., and Bates, C. E., “Ladle Treatment, Pouring and Gating for the Production of Clean Steel Castings,” SFSA Research Report, No. 104, 1991
5. M. Masoumi, H. Hu, J. Hedjazi, M. A. Boutorabi “Effect of Gating Design on Mold Filling”, AFS Transactions, pp 05-152, (2005)
6. John Campbell, “Mini Casting Handbook”, Revised and Enlarged Second Edition book, 2018.
7. J. Campbell, Complete Casting Handbook, 2ndEdition, Elsevier, Oxford, UK 2015.
8. J. Campbell, Complete Casting Handbook, Elsevier Ltd. (2011). p. 74.
9. https://commons.wikimedia.org/wiki/File:Casting_gating_system.svg
10. Seyyed Hojjat Majidi “Effect of Pouring Conditions and Gating System Design on Air Entrainment during Mold Filling” International Journal of Metalcasting. AFS Transactions (2018)
11. A.Dojka, J.Jesierski, “ Optimized gating system for steel castings”, J. o f Materi Eng and Perform 27, 5152-5163 (2018)
12. Jan Jezierski, Rafal Dojka, Krzystof Janerka “Optimizing the Gating System for SteelCastings”, Metals, 8(4), pp 266 (2018)
13. C Reilly, N.R Green,M.R. Jolly “ The Present State Of Modeling Entrainment Defects In The Shape Casting Process” Applied Mathematical Modelling, Volume 37, Issue 3, pp 611-628 (2013)
107
14. C.Jorden, J.L.Hilll, T.S.Piwonka,” Computer Designed Gating systems” Metal Casting Technology Centre, The University of Alabama
15. G.D.Chandley, M.C.Felmings, “Gating Premium Quality castings”
16. M. Harris et al., "Evolution of Non- Metallic Inclusions in Foundry Steel Casting Processes," Proceedings of the 69th Annual Technical and Operating Conference, Steel Founders Society of America (SFSA) (2015, Chicago Illinois), Steel Founders society of America (SFSA) (Dec 2015)
17. Sei Kimura, K. Nakajima, and S. Mizoguchi “Behavior of Alumina-Magnesia Complex Inclusions and Magnesia Inclusions on the Surface of Molten Low-Carbon Steels”, Metallurgical and Materials Transactions B 32(1):79-85, (2001
18. T.B.Braun, J.F.Elliott,, M.C.Flemings, “The Clustering of Alumina Inclusions”
19. Ralph.L.Stephens, “Fatigue and Fracture Toughness O f Five Carbon or Low Alloy Cast Steels at Room Or Low Climate Temperature”, Steel Founders' Society of America, Research Report No. 94A, October (1982)
20. Philips Charles Belding, “Control of non-metallic inclusions in steel”, Master of Science Theses, Oregon state Unversity, June (1971).
21. Lyman, Taylor (Ed). Metals Handbook. Cleveland, Ohio, American Society for Metals, 1332p, (1948)
22. Breznyak, G. Das, M. T. Groves and J. F. Wallace. The effect of sulfur and phosphorous on the dynamic properties of cast steel. Rocky River, Ohio, Steel Founders' Society of America, (1968).
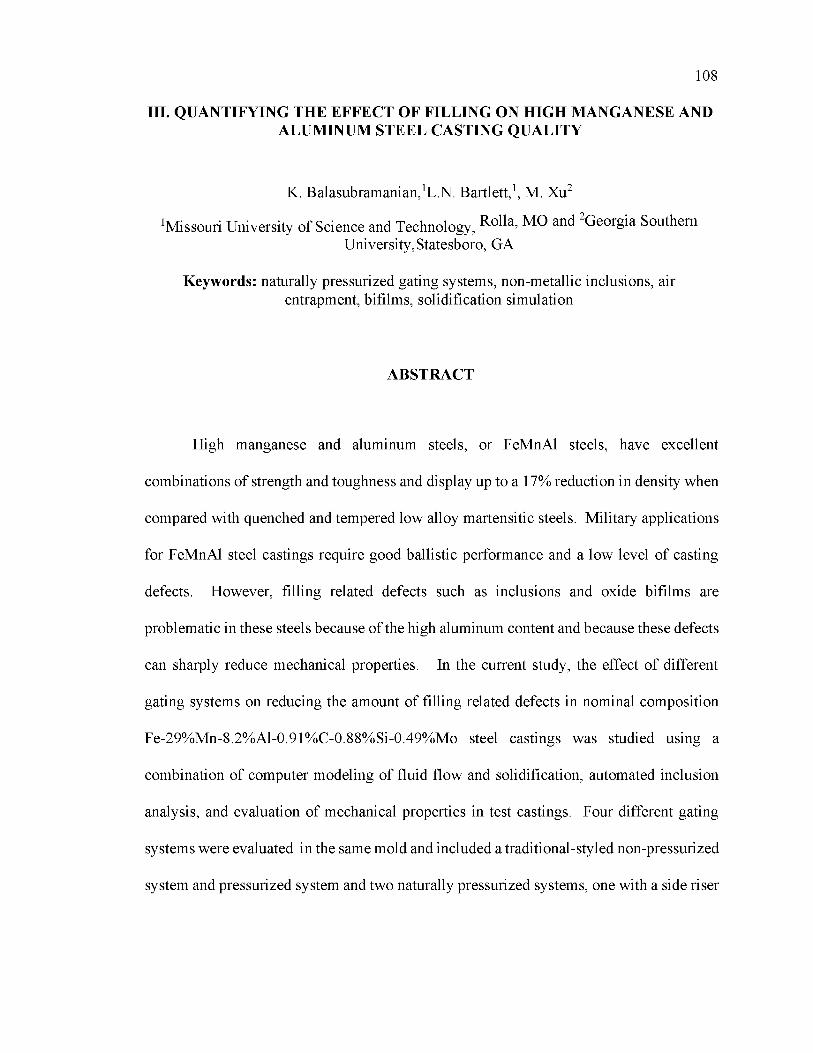
108
III. QUANTIFYING THE EFFECT OF FILLING ON HIGH MANGANESE AND ALUMINUM STEEL CASTING QUALITY
K. Balasubramanian,1L.N. Bartlett,1, M. Xu2
1Missouri University of Science and Technology, Rolla, MO and Georgia SouthernUniversity,Statesboro, GA
Keywords: naturally pressurized gating systems, non-metallic inclusions, air entrapment, bifilms, solidification simulation
ABSTRACT
High manganese and aluminum steels, or FeMnAl steels, have excellent
combinations of strength and toughness and display up to a 17% reduction in density when
compared with quenched and tempered low alloy martensitic steels. Military applications
for FeMnAl steel castings require good ballistic performance and a low level of casting
defects. However, filling related defects such as inclusions and oxide bifilms are
problematic in these steels because of the high aluminum content and because these defects
can sharply reduce mechanical properties. In the current study, the effect o f different
gating systems on reducing the amount of filling related defects in nominal composition
Fe-29%Mn-8.2%Al-0.91%C-0.88%Si-0.49%Mo steel castings was studied using a
combination of computer modeling of fluid flow and solidification, automated inclusion
analysis, and evaluation of mechanical properties in test castings. Four different gating
systems were evaluated in the same mold and included a traditional-styled non-pressurized
system and pressurized system and two naturally pressurized systems, one with a side riser

109
and one system with a top riser. Parameters such as critical velocity of metal flow, air
entrapment, microporosity and Niyama criterion were considered and a design was
developed with a common pouring basin using solidification software. Optical and electron
microscopy revealed the presence of alumina bifilms that were entrained into the castings
during filling in each of the gating systems. Notch toughness was evaluated using standard
sized Charpy V notch bars that were broke at room temperature and showed a decrease in
notch toughness and an increase in variability with an increase in the percentage of bifilms.
The results showed that a well-designed traditional-style nonpressurized gating system
with runner extensions, a runner well, and keeping the gate velocity less than 0.7 m/s
produced the cleanest castings with the highest average notch toughness of 160J and the
least mechanical property variance.
1. INTRODUCTION
FeMnAl steels, are high toughness steels that are based on high manganese
austenitic Hadfield steel and have additions of up to 12%Al.(1) These FeMnAl steels have
reduced densities because of the added aluminum content that usually ranges between 4
10% and dilation of the austenite crystal structure with the addition of manganese between
20-30%. Most studies of cast FeMnAl steels have centered around a composition of Fe-
30Mn-9Al-0.9C-1.0Si-0.5Mo. For this composition, a 15% reduction in density is
observed when compared to quenched and tempered SAE 4130 steel castings with similar
strength and dynamic fracture toughness.(2)
The presence of inclusions and oxide bifilms are one of the major reasons for the
loss of toughness in these steels. Brittle and faceted aluminum nitride, AlN, inclusions are

110
stable at steelmaking temperatures in these alloys and this can decrease the ductility and
toughness when these inclusions are present in significant amounts. The work done by
Schulte et al. on a Fe-30Mn-9Al-1Si-0.9C-0.5Mo steel casting showed that the presence
of AlN inclusions decreased the Charpy V-notch (CVN) breaking energy from 35J to 19J
as the concentration of AlN increased from 12 inclusions/mm2 to 210 inclusions/mm2(3)
The high aluminum content in these alloys is also problematic with regard to the formation
of solid oxide films that form as the surface of the melt reacts with oxygen in the
atmosphere. This leads to the formation of solid oxide bifilm defects, which can be
entrained in the steel during steelmaking and pouring, leading to a loss in strength, fatigue
life and ductility in castings. Bifilms are formed when the molten metal is exposed to the
atmosphere and forms a solid film which folds over itself and gets entrained in the melt,
often containing a layer of trapped gas. (4, 5) Surface turbulence is an important contributor
for bifilm formation because poorly designed molds provide the possibility for hydraulic
jumping and splashing of metal. This provides the opportunity for the liquid metal to divide
into droplets, exposing the melt and causing the formation of new bifilms by air
entrainment.(6) Bifilms have been known to an adverse effect on the mechanical properties
of aluminum castings and the work done on AA356 castings by Liu and Samuel,
established a linear relationship between the percentage elongation and log area percentage
of oxide films(7). These bifilms can also serve as nucleation sites for gas porosity such as
hydrogen during solidification and can act as sites of failure when stress is acted upon it.
(8)
Gating systems play an integral role in determining the final quality of the casting,
since the liquid metal enters the casting through the gate. A well-designed gating system

111
helps to decrease the turbulence in the flow of the liquid metal, reduces the slag, dross and
air entrapment and captures inclusions in the gating system instead of the casting (9). The
various defects like cold shuts, ripple marks etc. that are usually formed in castings can be
directly related to how the fluid metal behaves during mold filling (10). During pouring of
the liquid metal from the ladle into the mold, prevention of air entrainment is extremely
important. During mold filling, the formation of breaker waves, low pressure areas created
by liquid metal moving past sharp corners and the metal rebounding off obstacles leads to
air entrainment. These subsequently leads to the oxide formation which occurs either as
inclusions or bifilms in the steel castings. The pouring basin, the sprues, the runner and the
gates must be designed and optimized to reduce or eliminate air entrapment to reduce
reoxidation inclusion formation.(11) The work that has been done thus far on investigating
the pouring conditions, and their impact on formation of oxide inclusions have suggested
that, minimizing the velocity of the incoming metal has a sizeable impact on reduction of
air entrainment defects.(12) Pressurized and non-pressurized systems, in which the choke in
the system is present either at the gates or at the base of the sprue, respectively have
traditionally been used in foundries for more than 50 years. Despite the advent of fluid flow
and solidification modeling, their application is still largely based on ideal gating ratio
calculations and rules of thumb. Although computer aided fluid flow and modeling and
solidification software has come a long way in recent years, these software packages cannot
accurately predict the amount or location of reoxidation inclusions during filling and the
databases of different alloys and thermodynamic data is limited. Novel naturally
pressurized gating practices have been introduced in the recent years to reduce filling
related defects and improve mechanical properties, however, their application often
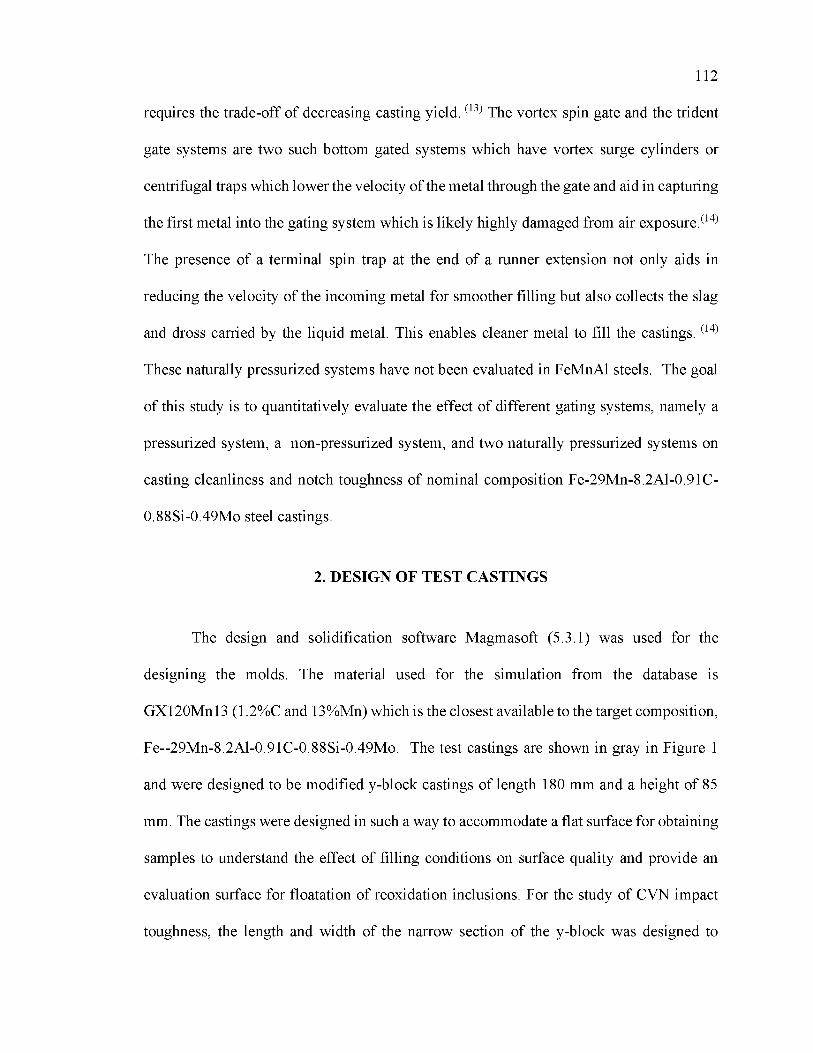
112
requires the trade-off of decreasing casting yield. (13) The vortex spin gate and the trident
gate systems are two such bottom gated systems which have vortex surge cylinders or
centrifugal traps which lower the velocity of the metal through the gate and aid in capturing
the first metal into the gating system which is likely highly damaged from air exposure.(14)
The presence of a terminal spin trap at the end of a runner extension not only aids in
reducing the velocity of the incoming metal for smoother filling but also collects the slag
and dross carried by the liquid metal. This enables cleaner metal to fill the castings. (14)
These naturally pressurized systems have not been evaluated in FeMnAl steels. The goal
of this study is to quantitatively evaluate the effect of different gating systems, namely a
pressurized system, a non-pressurized system, and two naturally pressurized systems on
casting cleanliness and notch toughness of nominal composition Fe-29Mn-8.2Al-0.91C-
0.88Si-0.49Mo steel castings.
2. DESIGN OF TEST CASTINGS
The design and solidification software Magmasoft (5.3.1) was used for the
designing the molds. The material used for the simulation from the database is
GX120Mn13 (1.2%C and 13%Mn) which is the closest available to the target composition,
Fe--29Mn-8.2Al-0.91C-0.88Si-0.49Mo. The test castings are shown in gray in Figure 1
and were designed to be modified y-block castings of length 180 mm and a height of 85
mm. The castings were designed in such a way to accommodate a flat surface for obtaining
samples to understand the effect of filling conditions on surface quality and provide an
evaluation surface for floatation of reoxidation inclusions. For the study of CVN impact
toughness, the length and width of the narrow section of the y-block was designed to
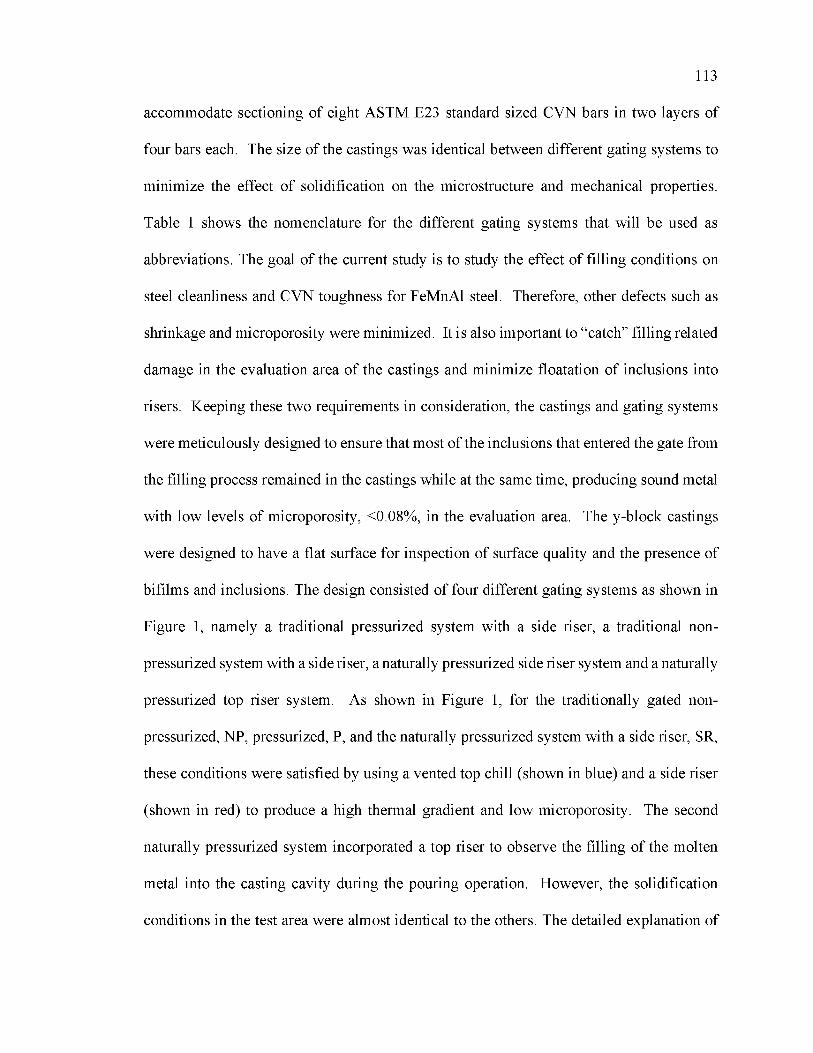
113
accommodate sectioning of eight ASTM E23 standard sized CVN bars in two layers of
four bars each. The size of the castings was identical between different gating systems to
minimize the effect of solidification on the microstructure and mechanical properties.
Table 1 shows the nomenclature for the different gating systems that will be used as
abbreviations. The goal of the current study is to study the effect of filling conditions on
steel cleanliness and CVN toughness for FeMnAl steel. Therefore, other defects such as
shrinkage and microporosity were minimized. It is also important to “catch” filling related
damage in the evaluation area of the castings and minimize floatation of inclusions into
risers. Keeping these two requirements in consideration, the castings and gating systems
were meticulously designed to ensure that most of the inclusions that entered the gate from
the filling process remained in the castings while at the same time, producing sound metal
with low levels of microporosity, <0.08%, in the evaluation area. The y-block castings
were designed to have a flat surface for inspection of surface quality and the presence of
bifilms and inclusions. The design consisted of four different gating systems as shown in
Figure 1, namely a traditional pressurized system with a side riser, a traditional non-
pressurized system with a side riser, a naturally pressurized side riser system and a naturally
pressurized top riser system. As shown in Figure 1, for the traditionally gated non-
pressurized, NP, pressurized, P, and the naturally pressurized system with a side riser, SR,
these conditions were satisfied by using a vented top chill (shown in blue) and a side riser
(shown in red) to produce a high thermal gradient and low microporosity. The second
naturally pressurized system incorporated a top riser to observe the filling of the molten
metal into the casting cavity during the pouring operation. However, the solidification
conditions in the test area were almost identical to the others. The detailed explanation of
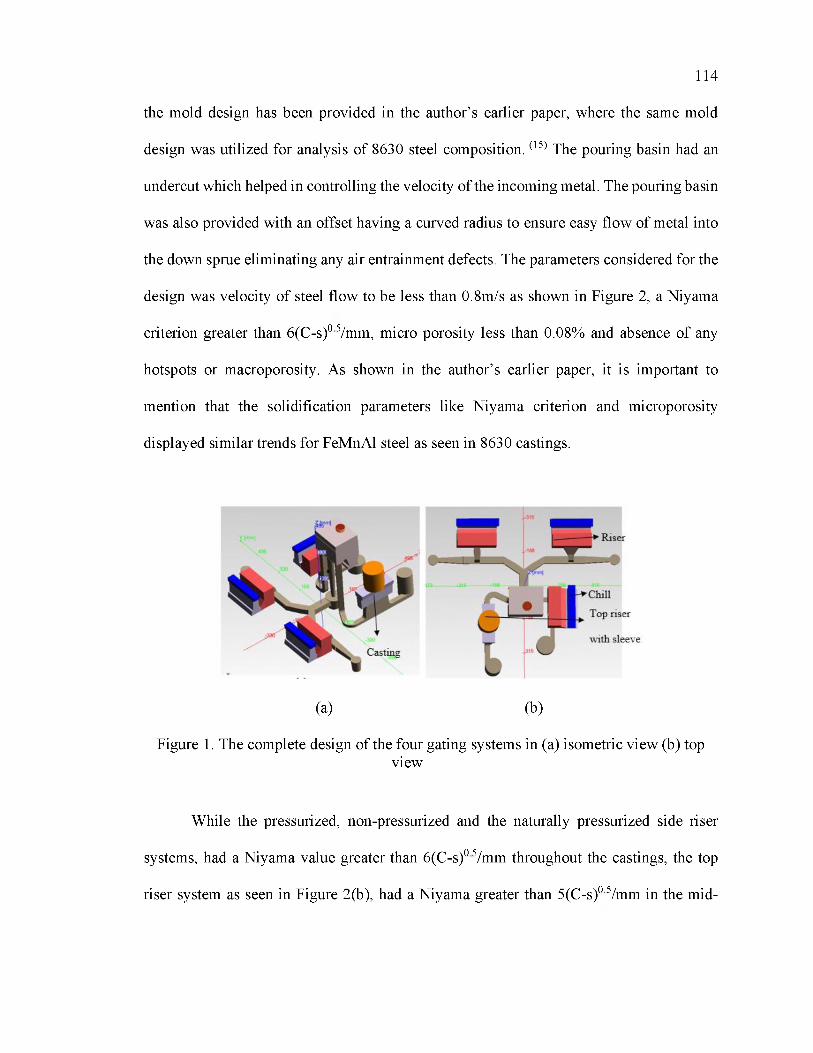
114
the mold design has been provided in the author’s earlier paper, where the same mold
design was utilized for analysis of 8630 steel composition. (15) The pouring basin had an
undercut which helped in controlling the velocity of the incoming metal. The pouring basin
was also provided with an offset having a curved radius to ensure easy flow of metal into
the down sprue eliminating any air entrainment defects. The parameters considered for the
design was velocity of steel flow to be less than 0.8m/s as shown in Figure 2, a Niyama
criterion greater than 6(C-s)05/mm, micro porosity less than 0.08% and absence of any
hotspots or macroporosity. As shown in the author’s earlier paper, it is important to
mention that the solidification parameters like Niyama criterion and microporosity
displayed similar trends for FeMnAl steel as seen in 8630 castings.
(a) (b)
Figure 1. The complete design of the four gating systems in (a) isometric view (b) topview
While the pressurized, non-pressurized and the naturally pressurized side riser
systems, had a Niyama value greater than 6(C-s)05/mm throughout the castings, the top
riser system as seen in Figure 2(b), had a Niyama greater than 5(C-s)05/mm in the mid
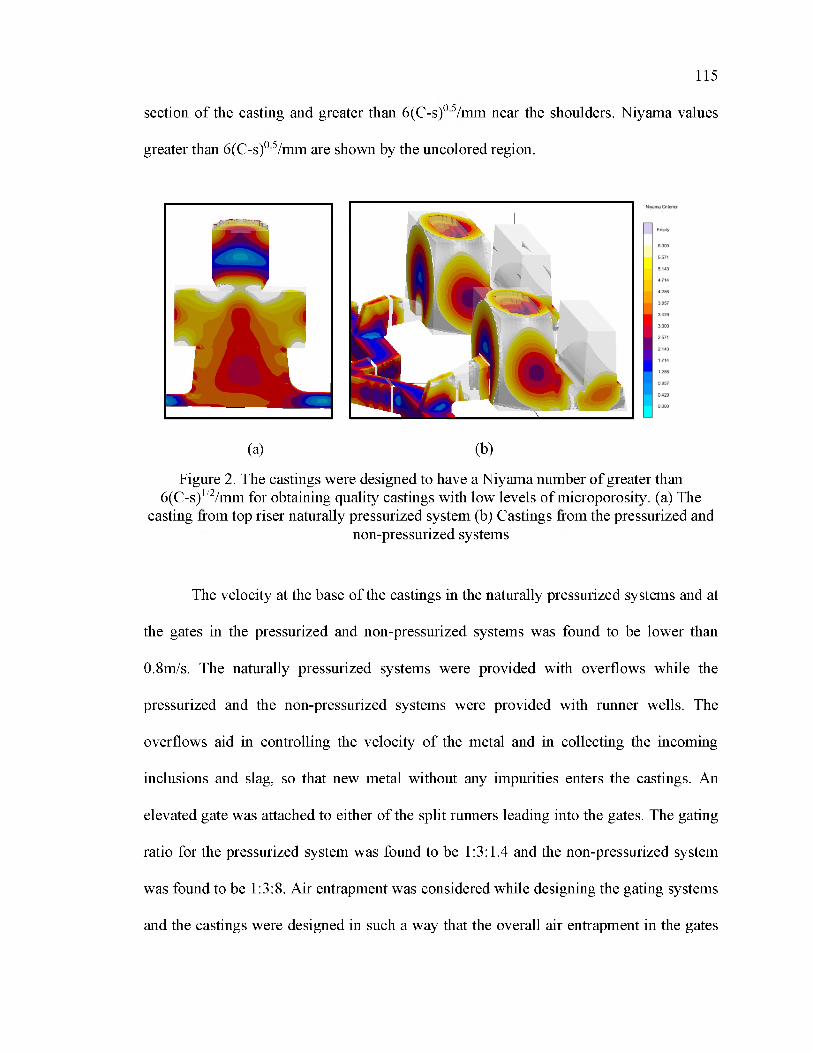
115
section o f the casting and greater than 6(C-s)05/mm near the shoulders. Niyama values
greater than 6(C-s)05/mm are shown by the uncolored region.
(a) (b)
Figure 2. The castings were designed to have a Niyama number o f greater than 6(C-s)1/2/mm for obtaining quality castings with low levels o f microporosity. (a) The
casting from top riser naturally pressurized system (b) Castings from the pressurized andnon-pressurized systems
The velocity at the base of the castings in the naturally pressurized systems and at
the gates in the pressurized and non-pressurized systems was found to be lower than
0.8m/s. The naturally pressurized systems were provided with overflows while the
pressurized and the non-pressurized systems were provided with runner wells. The
overflows aid in controlling the velocity of the metal and in collecting the incoming
inclusions and slag, so that new metal without any impurities enters the castings. An
elevated gate was attached to either of the split runners leading into the gates. The gating
ratio for the pressurized system was found to be 1:3:1.4 and the non-pressurized system
was found to be 1:3:8. Air entrapment was considered while designing the gating systems
and the castings were designed in such a way that the overall air entrapment in the gates
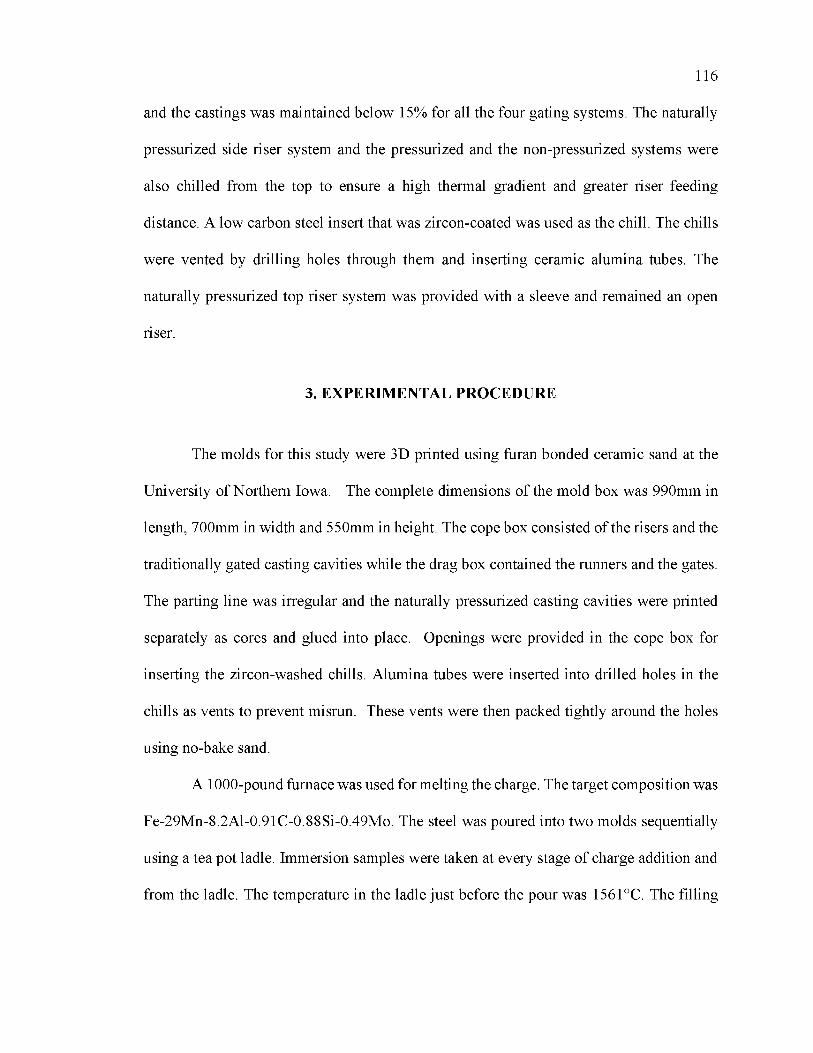
116
and the castings was maintained below 15% for all the four gating systems. The naturally
pressurized side riser system and the pressurized and the non-pressurized systems were
also chilled from the top to ensure a high thermal gradient and greater riser feeding
distance. A low carbon steel insert that was zircon-coated was used as the chill. The chills
were vented by drilling holes through them and inserting ceramic alumina tubes. The
naturally pressurized top riser system was provided with a sleeve and remained an open
riser.
3. EXPERIM ENTAL PROCEDURE
The molds for this study were 3D printed using furan bonded ceramic sand at the
University of Northern Iowa. The complete dimensions of the mold box was 990mm in
length, 700mm in width and 550mm in height. The cope box consisted of the risers and the
traditionally gated casting cavities while the drag box contained the runners and the gates.
The parting line was irregular and the naturally pressurized casting cavities were printed
separately as cores and glued into place. Openings were provided in the cope box for
inserting the zircon-washed chills. Alumina tubes were inserted into drilled holes in the
chills as vents to prevent misrun. These vents were then packed tightly around the holes
using no-bake sand.
A 1000-pound furnace was used for melting the charge. The target composition was
Fe-29Mn-8.2Al-0.91C-0.88Si-0.49Mo. The steel was poured into two molds sequentially
using a tea pot ladle. Immersion samples were taken at every stage of charge addition and
from the ladle. The temperature in the ladle just before the pour was 1561°C. The filling
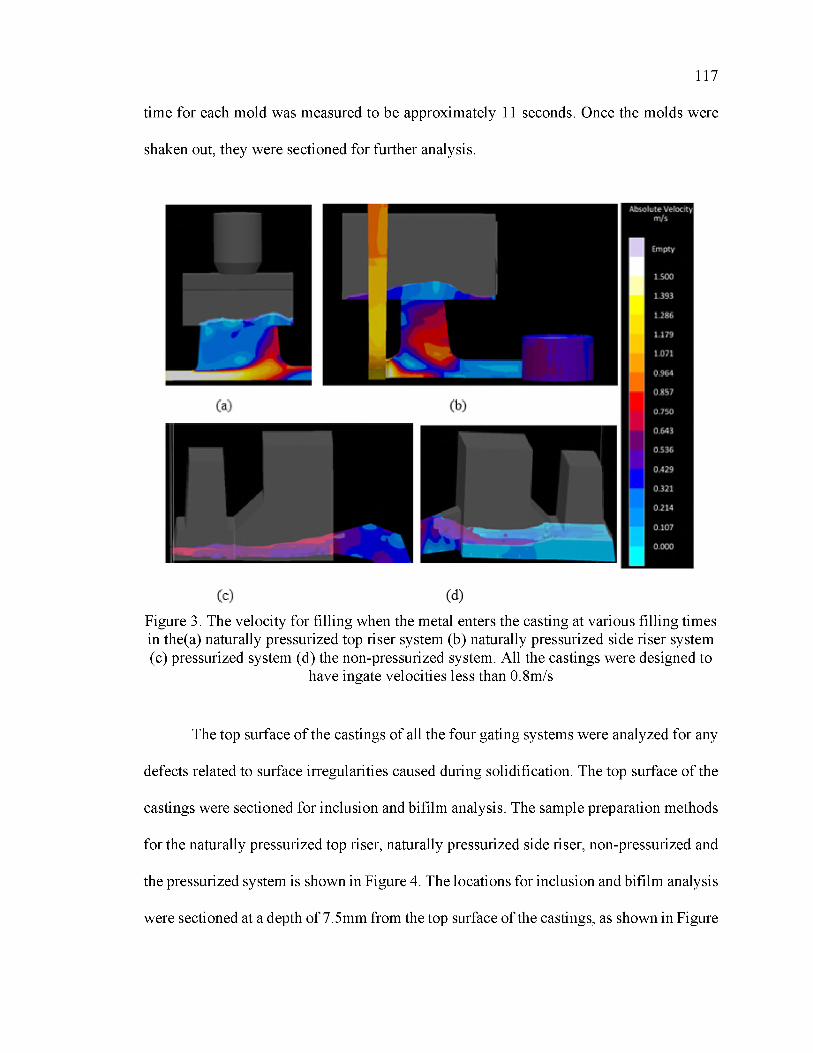
117
time for each mold was measured to be approximately 11 seconds. Once the molds were
shaken out, they were sectioned for further analysis.
Figure 3. The velocity for filling when the metal enters the casting at various filling times in the(a) naturally pressurized top riser system (b) naturally pressurized side riser system (c) pressurized system (d) the non-pressurized system. All the castings were designed to
have ingate velocities less than 0.8m/s
The top surface of the castings of all the four gating systems were analyzed for any
defects related to surface irregularities caused during solidification. The top surface of the
castings were sectioned for inclusion and bifilm analysis. The sample preparation methods
for the naturally pressurized top riser, naturally pressurized side riser, non-pressurized and
the pressurized system is shown in Figure 4. The locations for inclusion and bifilm analysis
were sectioned at a depth of 7.5mm from the top surface of the castings, as shown in Figure
118
4(a), where the yellow section shows the sectioned region. Five samples, numbered 1, 2,
3, 4 and 5 according to their positions as shown in Figure 4(b) were obtained from the top
section. For representative purposes, the positions are marked in Figure 4(b). The authors
would like to remind the readers that the five samples for inclusion analysis were obtained
from the bottom side of the sectioned 7.5mm layer. Since the inclusions have a tendency
to float to the top, it was decided that the analysis of this top surface would be the ideal
location for inclusion analysis. From one end of the remaining casting, a block was
sectioned for obtaining samples for chemistry analysis. The position of the 5 samples from
the top skin and location of chemistry samples was kept constant throughout the castings
for an even comparison of inclusion distribution and chemistry across the gating systems.
LECO TC500 was used for oxygen and nitrogen analysis while a LECO CS600 was used
for carbon and sulfur analysis. In the top riser system, because of a lower Niyama criterion
in the mid-section as observed in Figure 4(c), samples were sectioned from either of the
shoulders beside the top riser. Four samples were obtained for the analysis as seen in Figure
4(c), where the yellow region shows the sectioned part. These samples were polished using
standard metallographic procedures and analyzed for inclusions and bifilms.
Due to the high volume of bifilms found on the top surface of the castings, the
percentage area coverage of bifilms was used as a measure to determine cleanliness. To
understand the effect of casting cleanliness on the impact toughness of the castings
obtained from the different gating systems, standard Charpy tests were performed at room
temperature as per ASTM E23 standards. As shown in Figure 4(d), for the pressurized,
non-pressurized and naturally pressurized side riser systems, two layers of bars were
obtained from the mid-sections of the castings. From the first layer, 4 bars were obtained,
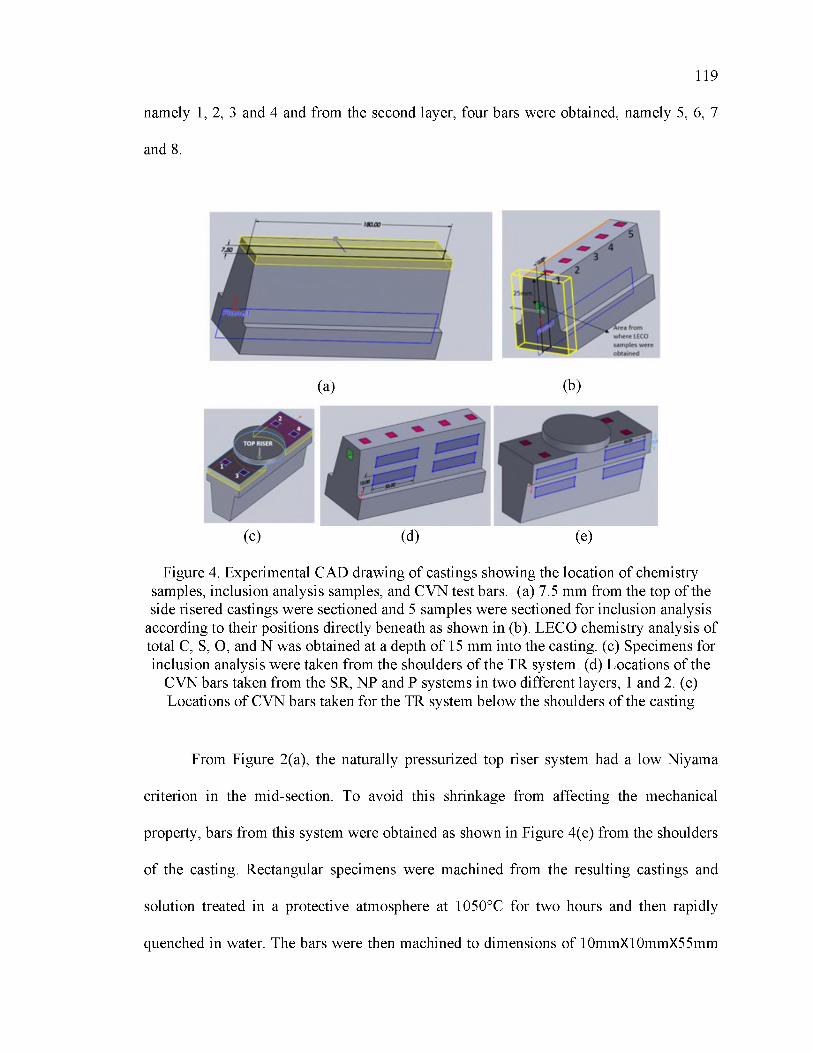
119
namely 1, 2, 3 and 4 and from the second layer, four bars were obtained, namely 5, 6, 7
and 8.
(c) (d) (e)
Figure 4. Experimental CAD drawing of castings showing the location of chemistry samples, inclusion analysis samples, and CVN test bars. (a) 7.5 mm from the top of the side risered castings were sectioned and 5 samples were sectioned for inclusion analysis
according to their positions directly beneath as shown in (b). LECO chemistry analysis of total C, S, O, and N was obtained at a depth of 15 mm into the casting. (c) Specimens for inclusion analysis were taken from the shoulders of the TR system. (d) Locations of the
CVN bars taken from the SR, NP and P systems in two different layers, 1 and 2. (e) Locations of CVN bars taken for the TR system below the shoulders of the casting
From Figure 2(a), the naturally pressurized top riser system had a low Niyama
criterion in the mid-section. To avoid this shrinkage from affecting the mechanical
property, bars from this system were obtained as shown in Figure 4(e) from the shoulders
of the casting. Rectangular specimens were machined from the resulting castings and
solution treated in a protective atmosphere at 1050°C for two hours and then rapidly
quenched in water. The bars were then machined to dimensions of 10mmX10mmX55mm
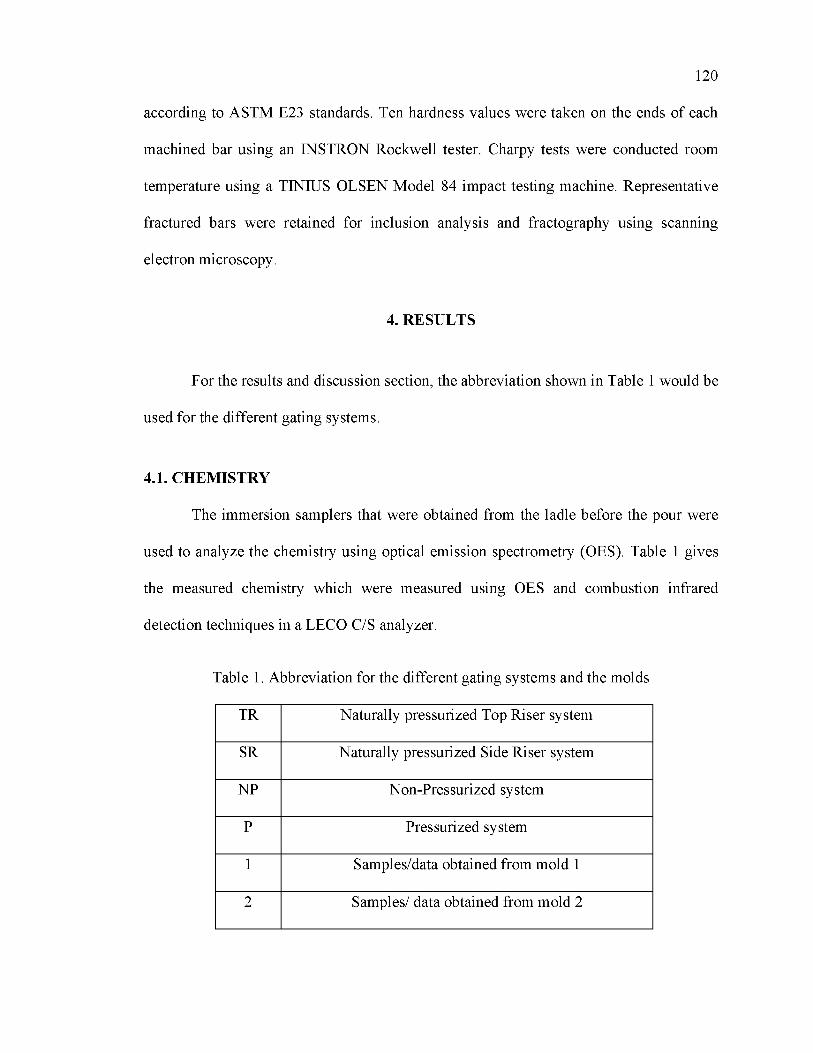
120
according to ASTM E23 standards. Ten hardness values were taken on the ends of each
machined bar using an INSTRON Rockwell tester. Charpy tests were conducted room
temperature using a TINIUS OLSEN Model 84 impact testing machine. Representative
fractured bars were retained for inclusion analysis and fractography using scanning
electron microscopy.
4. RESULTS
For the results and discussion section, the abbreviation shown in Table 1 would be
used for the different gating systems.
4.1. CHEM ISTRY
The immersion samplers that were obtained from the ladle before the pour were
used to analyze the chemistry using optical emission spectrometry (OES). Table 1 gives
the measured chemistry which were measured using OES and combustion infrared
detection techniques in a LECO C/S analyzer.
Table 1. Abbreviation for the different gating systems and the molds
TR Naturally pressurized Top Riser system
SR Naturally pressurized Side Riser system
NP Non-Pressurized system
P Pressurized system
1 Samples/data obtained from mold 1
2 Samples/ data obtained from mold 2
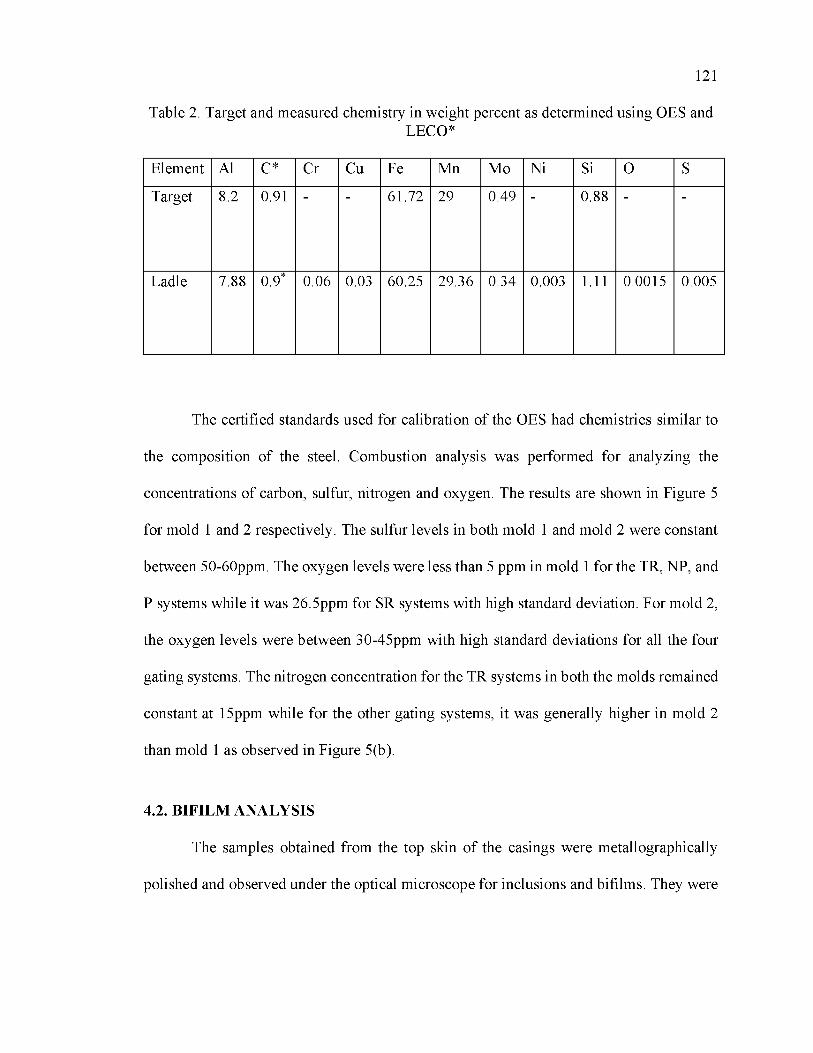
121
Table 2. Target and measured chemistry in weight percent as determined using OES andLECO*
Element Al C* Cr Cu Fe Mn Mo Ni Si O S
Target 8.2 0.91 61.72 29 0.49 0.88
Ladle 7.88 0.9* 0.06 0.03 60.25 29.36 0.34 0.003 1.11 0.0015 0.005
The certified standards used for calibration of the OES had chemistries similar to
the composition of the steel. Combustion analysis was performed for analyzing the
concentrations of carbon, sulfur, nitrogen and oxygen. The results are shown in Figure 5
for mold 1 and 2 respectively. The sulfur levels in both mold 1 and mold 2 were constant
between 50-60ppm. The oxygen levels were less than 5 ppm in mold 1 for the TR, NP, and
P systems while it was 26.5ppm for SR systems with high standard deviation. For mold 2,
the oxygen levels were between 30-45ppm with high standard deviations for all the four
gating systems. The nitrogen concentration for the TR systems in both the molds remained
constant at 15ppm while for the other gating systems, it was generally higher in mold 2
than mold 1 as observed in Figure 5(b).
4.2. BIFILM ANALYSIS
The samples obtained from the top skin of the casings were metallographically
polished and observed under the optical microscope for inclusions and bifilms. They were
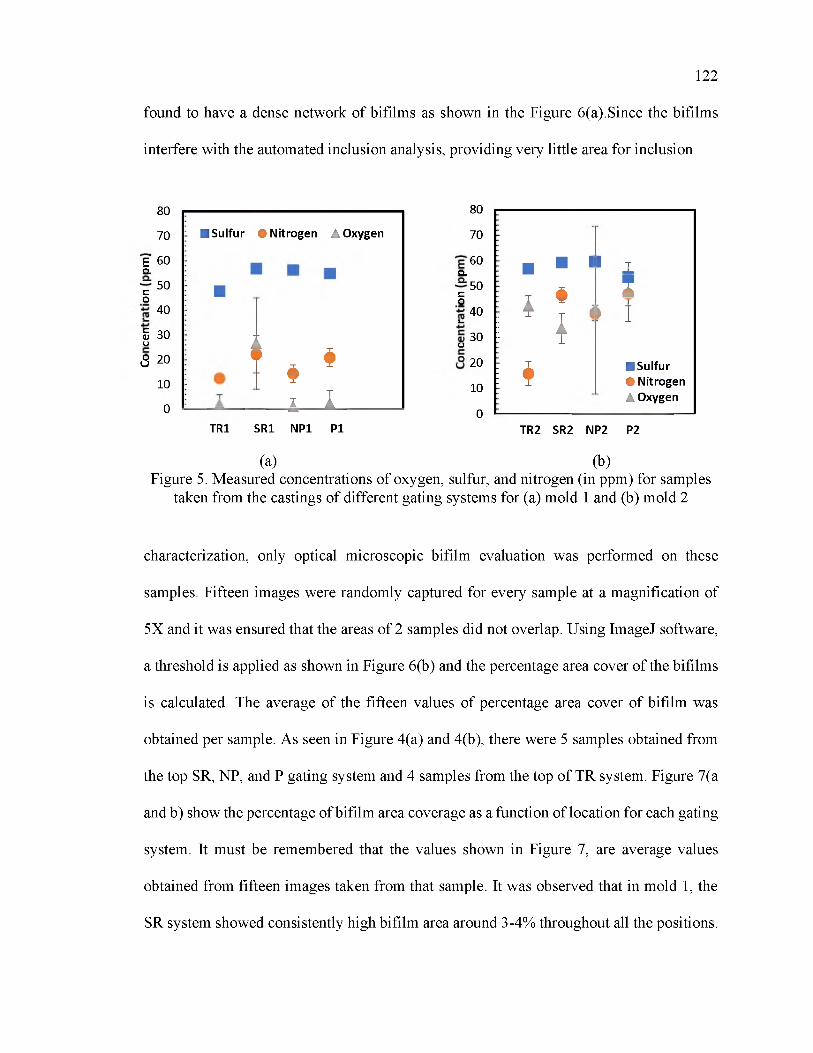
122
found to have a dense network of bifilms as shown in the Figure 6(a).Since the bifilms
interfere with the automated inclusion analysis, providing very little area for inclusion
80
70
E" 60Q .
50CO40
£ 30UQ 20
10
0
■ Sulfur • N itro g e n A Oxygen
* * *I I
TR1 SR1 NP1 P1
80
70
60Q .
50Co40
i-30U20
10
0
■ ■ 1 1 T
I # z
; * * ■
i I
; a ■ Sulfur: T • Nitrogen
A Oxygen
TR2 SR2 NP2 P2
(a) (b)Figure 5. Measured concentrations of oxygen, sulfur, and nitrogen (in ppm) for samples
taken from the castings of different gating systems for (a) mold 1 and (b) mold 2
characterization, only optical microscopic bifilm evaluation was performed on these
samples. Fifteen images were randomly captured for every sample at a magnification of
5X and it was ensured that the areas of 2 samples did not overlap. Using ImageJ software,
a threshold is applied as shown in Figure 6(b) and the percentage area cover of the bifilms
is calculated. The average of the fifteen values of percentage area cover of bifilm was
obtained per sample. As seen in Figure 4(a) and 4(b), there were 5 samples obtained from
the top SR, NP, and P gating system and 4 samples from the top of TR system. Figure 7(a
and b) show the percentage of bifilm area coverage as a function of location for each gating
system. It must be remembered that the values shown in Figure 7, are average values
obtained from fifteen images taken from that sample. It was observed that in mold 1, the
SR system showed consistently high bifilm area around 3-4% throughout all the positions.
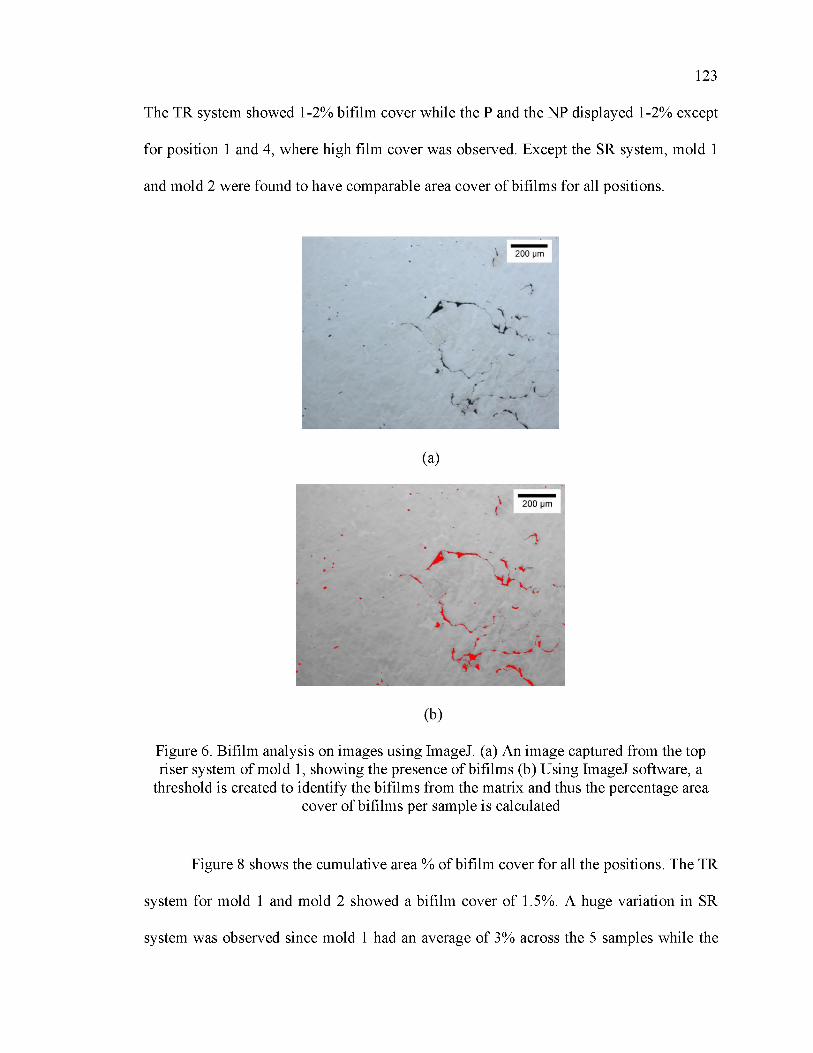
123
The TR system showed 1-2% bifilm cover while the P and the NP displayed 1-2% except
for position 1 and 4, where high film cover was observed. Except the SR system, mold 1
and mold 2 were found to have comparable area cover of bifilms for all positions.
Figure 6. Bifilm analysis on images using ImageJ. (a) An image captured from the top riser system of mold 1, showing the presence of bifilms (b) Using ImageJ software, a
threshold is created to identify the bifilms from the matrix and thus the percentage areacover of bifilms per sample is calculated
Figure 8 shows the cumulative area % of bifilm cover for all the positions. The TR
system for mold 1 and mold 2 showed a bifilm cover of 1.5%. A huge variation in SR
system was observed since mold 1 had an average of 3% across the 5 samples while the

124
mold 2 SR system showed around 1.4%. The NP system of mold 1 and mold 2 showed a
variation of 0.3% in their bifilm areas and a high standard deviation was observed for the
NP system of mold 1. The pressurized system in mold 2 had a bifilm cover of 1.8% while
the mold 1 had an average of 1% bifilm cover.
(a) (b)
Figure 7. The percentage area of bifilm cover obtained as a function of position in the casting as referenced in Figure 4 for (a) mold 1 and (b) mold 2
<U>ou|Id4 —o<uW)(U4—'c<DuL_aia.
<
Figure 8. The percentage area of bifilm cover obtained as an average of all the samples obtained from the different positions of top layer of the castings as referenced in Figure 4
of various gating systems for mold 1 and mold 2
125
4.3. M ECHANICAL PRO PERTIES
From the bars, machined to ASTM standards, ten values of hardness were obtained
from every bar using the Rockwell B scale and Hardness measurements are shown in
Figure 9 (a and b) for mold 1 and mold 2, respectively.
It can be observed from Figure 9(a), that the hardness of the castings from mold 1
was between 93-97 HRB. For mold 2, the hardness of the castings was slightly higher and
ranged from 97-100HRB. It was observed that the standard deviation of the hardness values
was very low indicating the consistency in values. It must be remembered here that the
values represent the average of four bars taken per layer of the casting with 10
measurements of hardness taken on every bar.
A comparison of toughness between layer 1 and layer 2 of the castings in mold 1
and mold 2 showed that, the castings obtained from layer 2 had higher toughness than layer
1 for the TR and SR systems. In the pressurized system of mold 1, layer 1 had a toughness
of 171±9.31J and layer 2 had a toughness of 150±3.5J. In mold 2, the first and second
layers of the P and NP systems had comparable values. Overall, for both the molds, the P
and NP systems had an impact toughness either comparable or greater than that of the
naturally pressurized systems. The fractography performed on the surfaces of the Charpy
bars that were broken showed the presence of dense network of bifilms. Figure 10(a, b, c,
and d) show SEM images of a fractured surface of a broken Charpy bar, taken from the SR
system, mold 2. Figure 10(a and c) shows the matrix chemistry of the fractured surface
obtained using EDS, shown by the red dot, which is similar to the measured chemistry of
the specimen. Figures 10(b and d) show the chemistry of the bifilms which were rich in
aluminum oxide on the fractured surface.
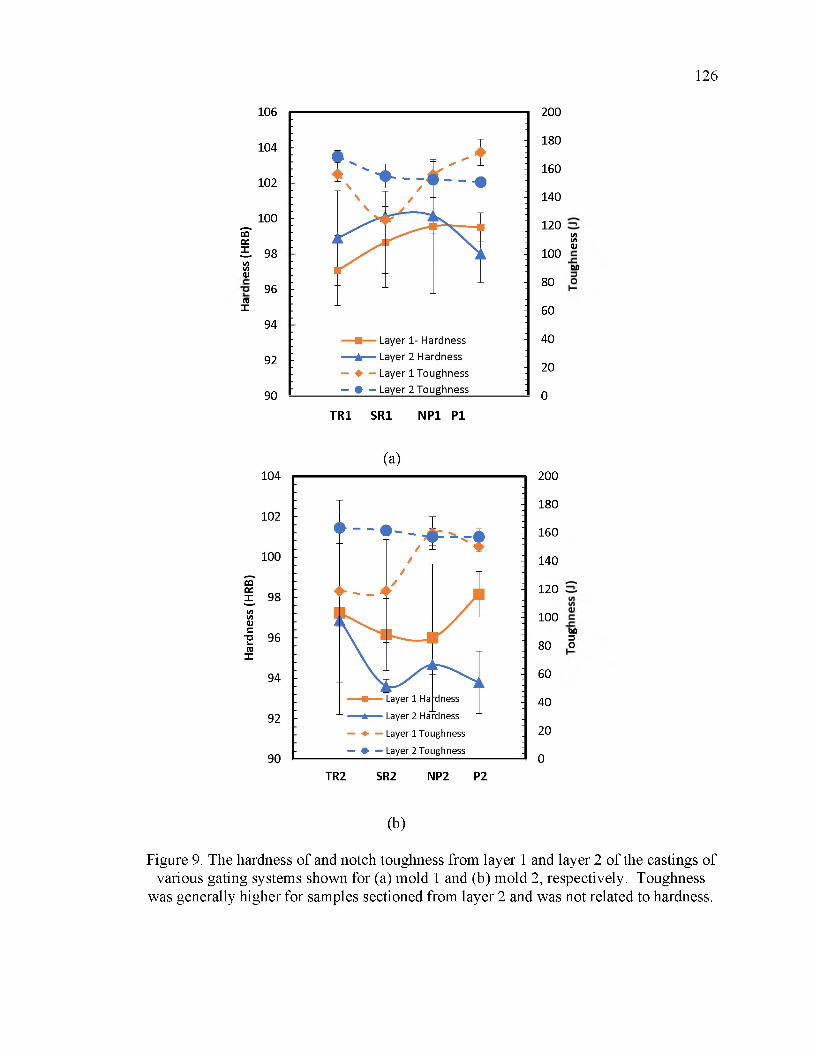
126
106
104
102
100S' cc5 . 98(/)(/) ai
96 ro X
94
92
90
180
160
140
120 (/)(/)ai100
cuo80
60
40
20
0
200
TR 1 SR1 NP1 P1
200
180
160
140
120
100
80
60
40
20
0
c u o3o
TR2 SR2 NP2 P2
(b)
Figure 9. The hardness of and notch toughness from layer 1 and layer 2 of the castings of various gating systems shown for (a) mold 1 and (b) mold 2, respectively. Toughness
was generally higher for samples sectioned from layer 2 and was not related to hardness.
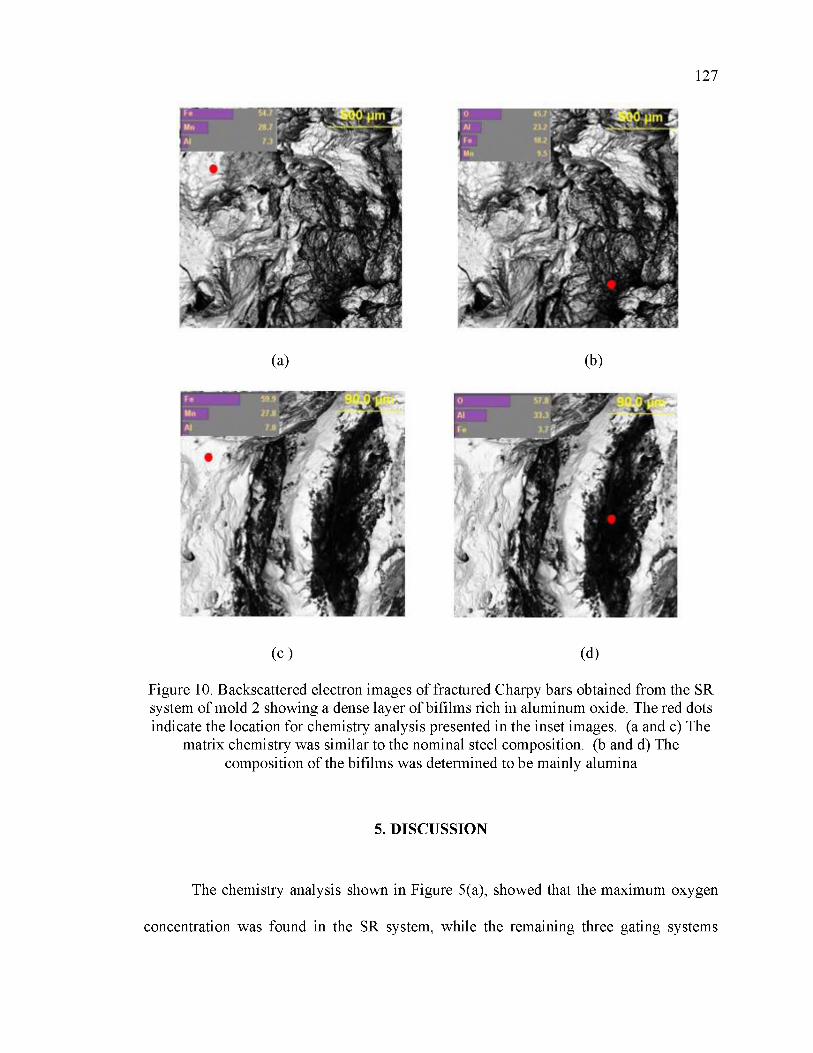
127
(a) (b)
(c ) (d)
Figure 10. Backscattered electron images of fractured Charpy bars obtained from the SR system of mold 2 showing a dense layer of bifilms rich in aluminum oxide. The red dots indicate the location for chemistry analysis presented in the inset images. (a and c) The
matrix chemistry was similar to the nominal steel composition. (b and d) The composition of the bifilms was determined to be mainly alumina
5. DISCUSSION
The chemistry analysis shown in Figure 5(a), showed that the maximum oxygen
concentration was found in the SR system, while the remaining three gating systems
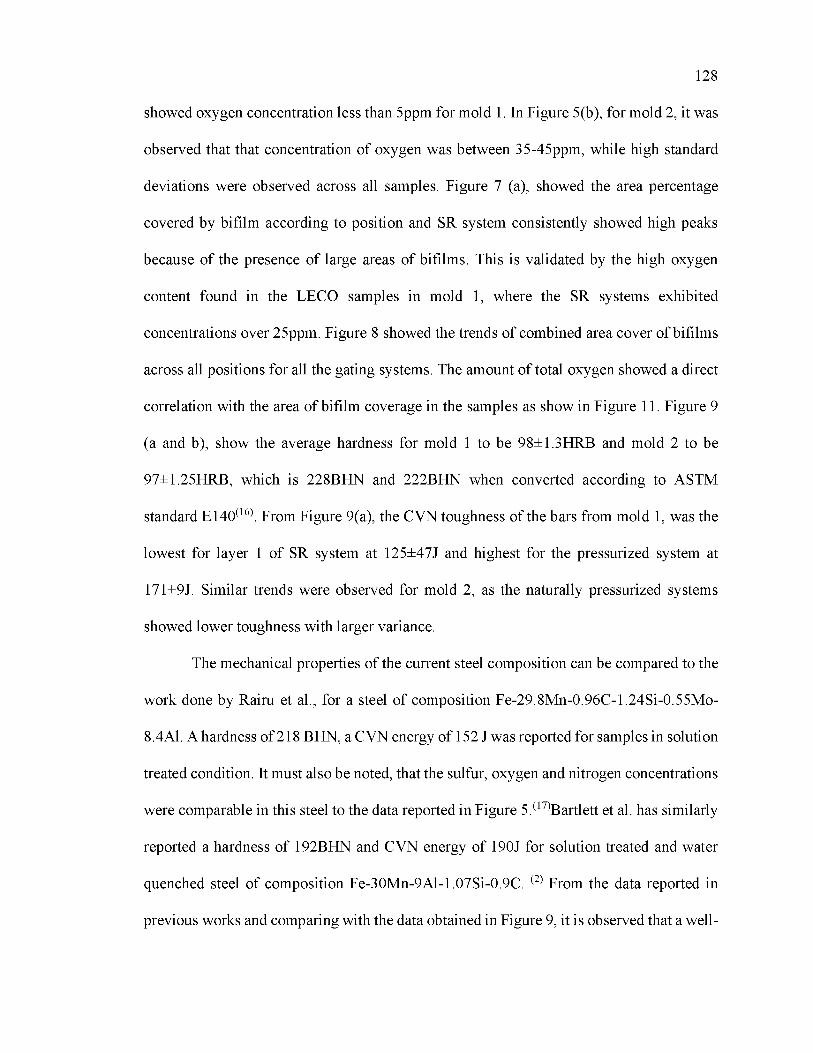
128
showed oxygen concentration less than 5ppm for mold 1. In Figure 5(b), for mold 2, it was
observed that that concentration of oxygen was between 35-45ppm, while high standard
deviations were observed across all samples. Figure 7 (a), showed the area percentage
covered by bifilm according to position and SR system consistently showed high peaks
because of the presence of large areas of bifilms. This is validated by the high oxygen
content found in the LECO samples in mold 1, where the SR systems exhibited
concentrations over 25ppm. Figure 8 showed the trends of combined area cover of bifilms
across all positions for all the gating systems. The amount of total oxygen showed a direct
correlation with the area of bifilm coverage in the samples as show in Figure 11. Figure 9
(a and b), show the average hardness for mold 1 to be 98±1.3HRB and mold 2 to be
97±1.25HRB, which is 228BHN and 222BHN when converted according to ASTM
standard E140(16). From Figure 9(a), the CVN toughness of the bars from mold 1, was the
lowest for layer 1 of SR system at 125±47J and highest for the pressurized system at
171±9J. Similar trends were observed for mold 2, as the naturally pressurized systems
showed lower toughness with larger variance.
The mechanical properties of the current steel composition can be compared to the
work done by Rairu et al., for a steel of composition Fe-29.8Mn-0.96C-1.24Si-0.55Mo-
8.4Al. A hardness of 218 BHN, a CVN energy of 152 J was reported for samples in solution
treated condition. It must also be noted, that the sulfur, oxygen and nitrogen concentrations
were comparable in this steel to the data reported in Figure 5.(17)Bartlett et al. has similarly
reported a hardness of 192BHN and CVN energy of 190J for solution treated and water
quenched steel of composition Fe-30Mn-9Al-1.07Si-0.9C. (2) From the data reported in
previous works and comparing with the data obtained in Figure 9, it is observed that a well-

129
designed gating system offers improved hardness and toughness values for similar
compositions of FeMnAl steel.
TR SR NP P
Figure 11. A comparison shown between the total oxygen concentration (ppm) and area % of bifilm cover in the castings obtained from different gating systems for mold 1 and mold 2. The amount of total oxygen was found to correlate to the total amount of bifilm
coverage
To understand the contributing factor for failure and loss of toughness, a
comparison between bifilm area % and toughness was studied. Figure 12(a) showed the
average of the toughness of the eight Charpy bars taken from each gating system and the
average of the bifilms obtained from the top section of the castings for mold 1 and Figure
12(b) for mold 2 respectively.
From Figure 12, it is seen that the toughness and area of bifilm cover share an
inverse relationship with each other. For all the gating systems, a reduction in toughness is
caused by an increase in area of bifilms present in the castings. The work by Dispinar et
al., on A356 castings establishes a similar relationship. They found that the bifilm index,
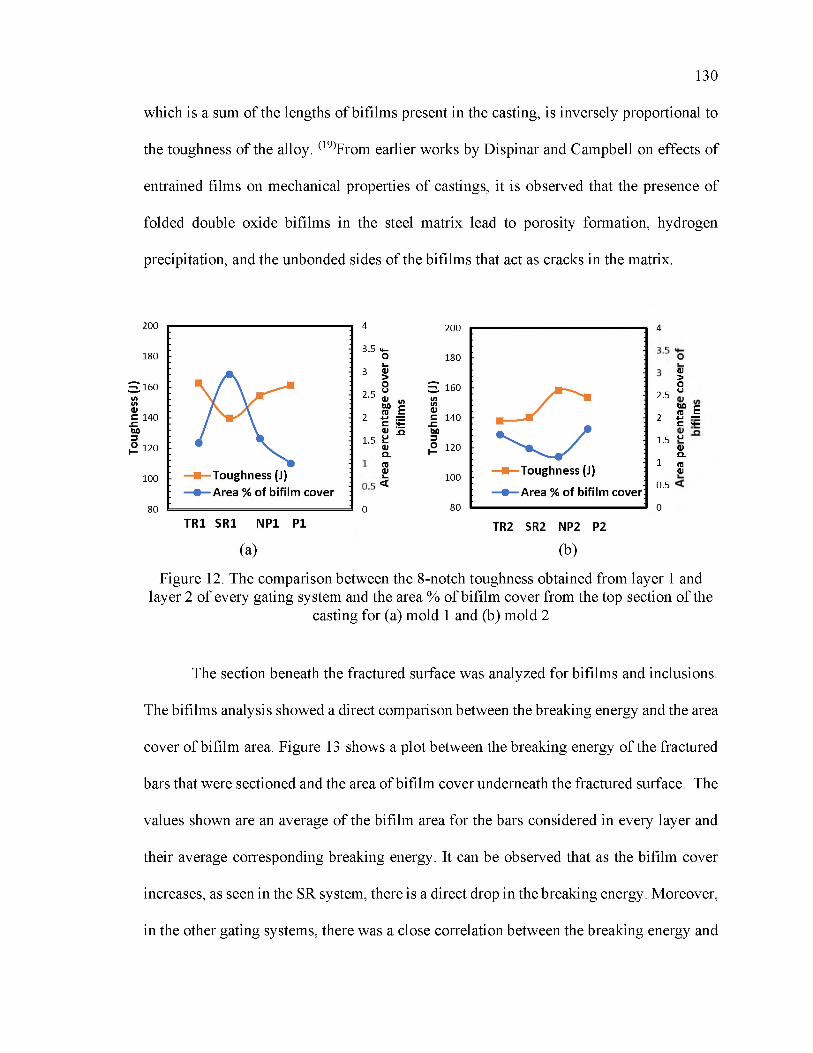
130
which is a sum of the lengths of bifilms present in the casting, is inversely proportional to
the toughness of the alloy. (19)From earlier works by Dispinar and Campbell on effects of
entrained films on mechanical properties of castings, it is observed that the presence of
folded double oxide bifilms in the steel matrix lead to porosity formation, hydrogen
precipitation, and the unbonded sides of the bifilms that act as cracks in the matrix.
4
3 .5
3
2 .5
2
1.5
2 .5
2
1.5
1
0 .5
0
<D>Ou
tXQ r - (D C ■M “ C M—u
Q)Q .(D<D
(b)
Figure 12. The comparison between the 8-notch toughness obtained from layer 1 and layer 2 of every gating system and the area % of bifilm cover from the top section of the
casting for (a) mold 1 and (b) mold 2
4
0
The section beneath the fractured surface was analyzed for bifilms and inclusions.
The bifilms analysis showed a direct comparison between the breaking energy and the area
cover of bifilm area. Figure 13 shows a plot between the breaking energy of the fractured
bars that were sectioned and the area of bifilm cover underneath the fractured surface. The
values shown are an average of the bifilm area for the bars considered in every layer and
their average corresponding breaking energy. It can be observed that as the bifilm cover
increases, as seen in the SR system, there is a direct drop in the breaking energy. Moreover,
in the other gating systems, there was a close correlation between the breaking energy and
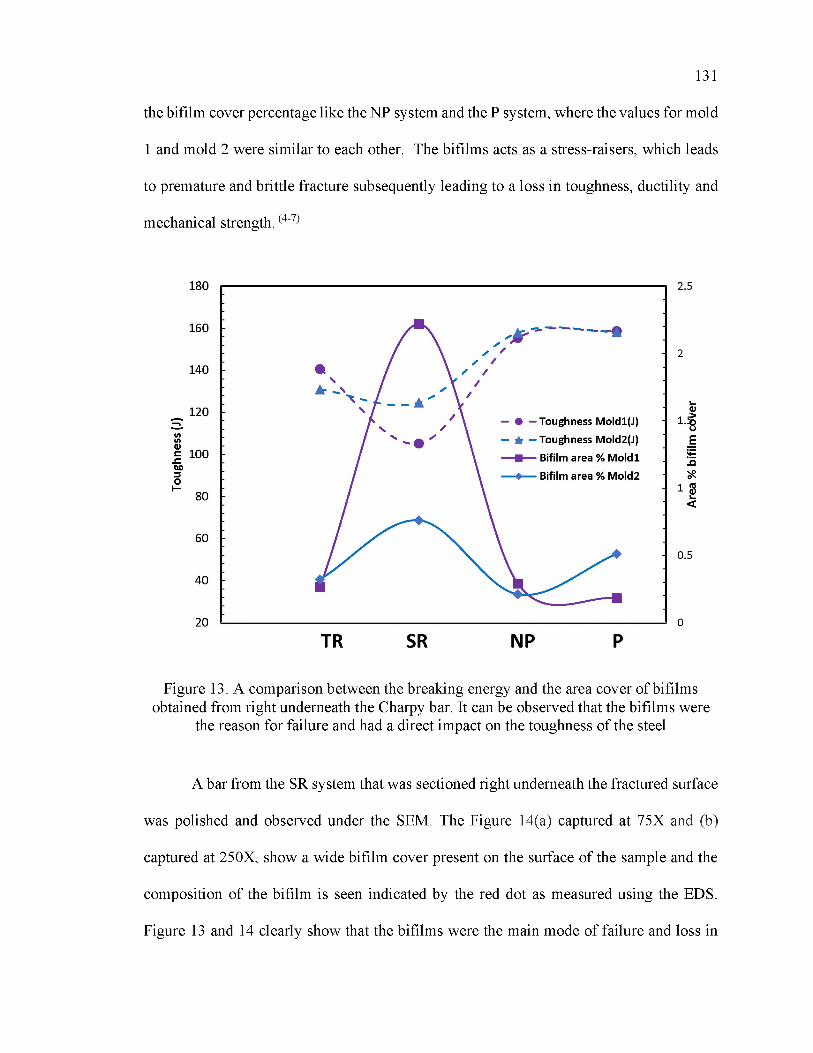
131
the bifilm cover percentage like the NP system and the P system, where the values for mold
1 and mold 2 were similar to each other. The bifilms acts as a stress-raisers, which leads
to premature and brittle fracture subsequently leading to a loss in toughness, ductility and
mechanical strength. (4-7)
Figure 13. A comparison between the breaking energy and the area cover of bifilms obtained from right underneath the Charpy bar. It can be observed that the bifilms were
the reason for failure and had a direct impact on the toughness of the steel
A bar from the SR system that was sectioned right underneath the fractured surface
was polished and observed under the SEM. The Figure 14(a) captured at 75X and (b)
captured at 250X, show a wide bifilm cover present on the surface of the sample and the
composition of the bifilm is seen indicated by the red dot as measured using the EDS.
Figure 13 and 14 clearly show that the bifilms were the main mode of failure and loss in
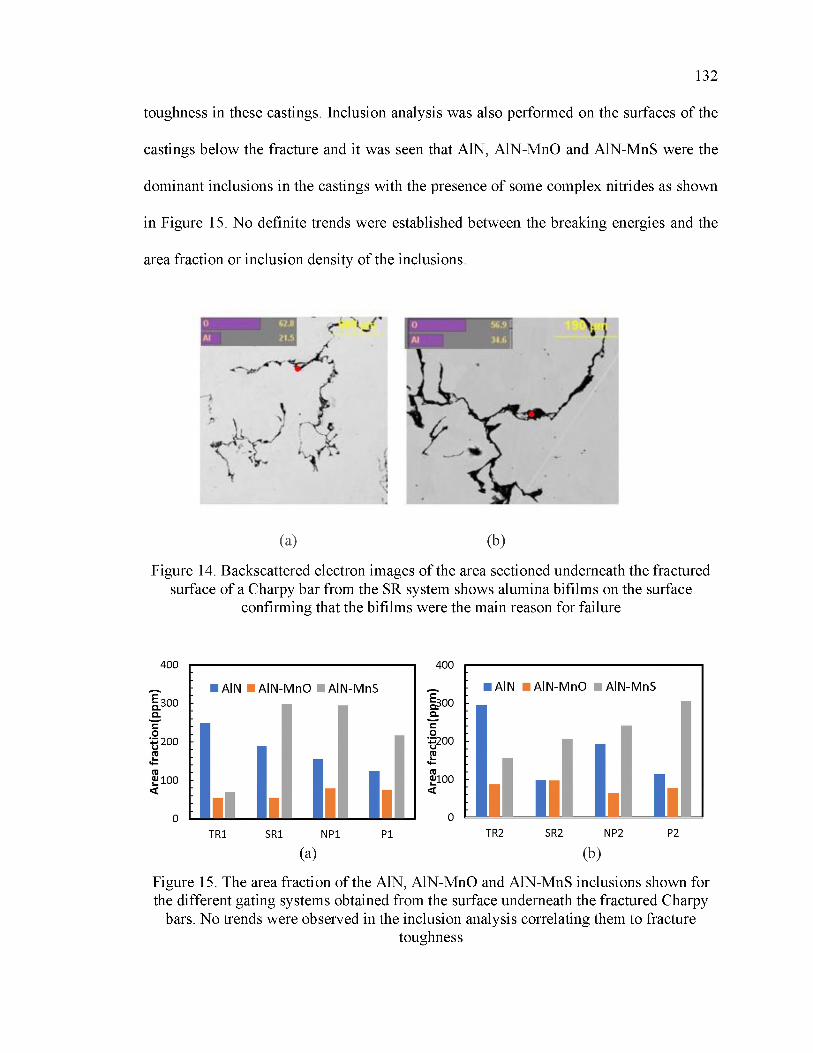
132
toughness in these castings. Inclusion analysis was also performed on the surfaces of the
castings below the fracture and it was seen that AlN, AlN-MnO and AlN-MnS were the
dominant inclusions in the castings with the presence of some complex nitrides as shown
in Figure 15. No definite trends were established between the breaking energies and the
area fraction or inclusion density of the inclusions.
(a) (b)
Figure 14. Backscattered electron images of the area sectioned underneath the fractured surface of a Charpy bar from the SR system shows alumina bifilms on the surface
confirming that the bifilms were the main reason for failure
TR1 SR1 NP1 P1
(a) (b)
Figure 15. The area fraction of the AlN, AlN-MnO and AlN-MnS inclusions shown for the different gating systems obtained from the surface underneath the fractured Charpy
bars. No trends were observed in the inclusion analysis correlating them to fracturetoughness
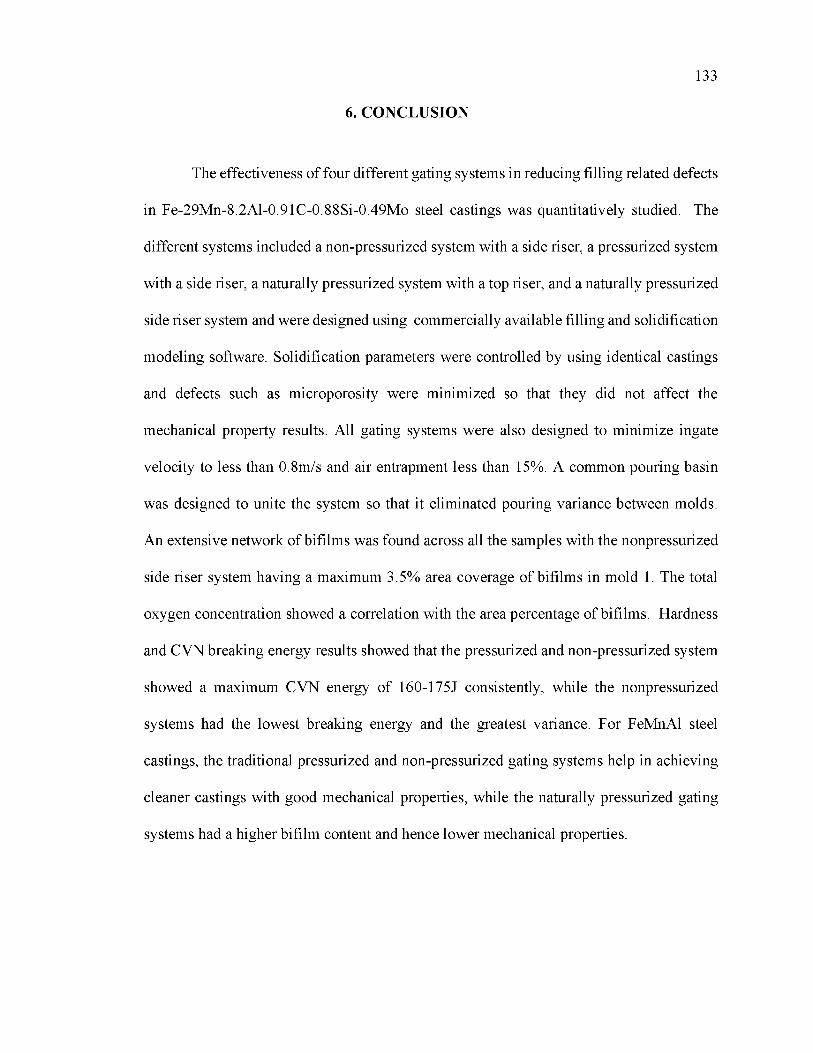
133
6. CONCLUSION
The effectiveness of four different gating systems in reducing filling related defects
in Fe-29Mn-8.2Al-0.91C-0.88Si-0.49Mo steel castings was quantitatively studied. The
different systems included a non-pressurized system with a side riser, a pressurized system
with a side riser, a naturally pressurized system with a top riser, and a naturally pressurized
side riser system and were designed using commercially available filling and solidification
modeling software. Solidification parameters were controlled by using identical castings
and defects such as microporosity were minimized so that they did not affect the
mechanical property results. All gating systems were also designed to minimize ingate
velocity to less than 0.8m/s and air entrapment less than 15%. A common pouring basin
was designed to unite the system so that it eliminated pouring variance between molds.
An extensive network of bifilms was found across all the samples with the nonpressurized
side riser system having a maximum 3.5% area coverage of bifilms in mold 1. The total
oxygen concentration showed a correlation with the area percentage of bifilms. Hardness
and CVN breaking energy results showed that the pressurized and non-pressurized system
showed a maximum CVN energy of 160-175J consistently, while the nonpressurized
systems had the lowest breaking energy and the greatest variance. For FeMnAl steel
castings, the traditional pressurized and non-pressurized gating systems help in achieving
cleaner castings with good mechanical properties, while the naturally pressurized gating
systems had a higher bifilm content and hence lower mechanical properties.
134
ACKNOW LEDGEM ENTS
The authors greatly acknowledge the contributions of the many undergraduate
research assistants that contributed to this research: Thomas Wall, Graham Stanley and
Ethan Klafehn. This proj ect was supported by American Foundry Society and we gratefully
thank the AFS technical committee for funding this project. The authors would like to
heartily thank Mr.Doug Imrie and Mr.Zach Henderson from SouthernCast Products who
were the industrial sponsors for the project. The authors also greatly acknowledge
MAGMA LLC for their support during the design phase and encouraging the metal casting
program at Missouri S&T as well as their contribution to the modeling work within this
manuscript.
REFERENCES
1. Hadfield, R., Burnham, T. H., “Special Steels”, 2nd ed., p.100, The Pitman Press, New York (1933).
2. Laura Bartlett, David Van Aken “High Manganese and Aluminum Steels for the Military and Transportation Industry”, Journal of Materials, Vol 66, No 1, (2014)
3. A.M.Schulte, S.N.Lekakh, D.C.Van Aken, V.L.Richards “ Phosphorus mitigation in cast lightweight Fe-Mn-Al-C steel’” 114th MetalCasting Congress, Orlando, Florida, March (2013)
4. R.Gopalan and Narayan. K. Prabhu “Oxide Bifilms in aluminum alloy castings: A review”, Materials Science and Technology,Vol 27, Issue 12, Pages 1757-1769, (2011)
5. M.A. El-Sayed; M. Ghazy, “Entrained defects in light metal cast alloys”, Journal of South African Institute of mining and metallurgy”, Volume 117, issue 7, (2017)
6. John Campbell, “ Melting, Remelting, and Casting for Clean Steel”, steel research int. 88 (2017) No. 1, (1-13)
7. L. Liu and F. H. Samuel: J. Mater. Sci., 1998, 33, 2269-2281.

135
8. J. Campbell, Complete Casting Handbook, 2nd Edition, Elsevier, Oxford, UK 2015.
9. Xue X, Hansen S.F, Hansen P.N, Water Analog Study of Effects Gating Designs on Inclusion Separation and mold filling control, AFS Transactions, vol. 101, pp.199-209, (1993)
10. . Lin H.J, Hwang W. S., Three-Dimensional Fluid Flow Simulation for Mold Filling, AFS Transactions, vol. 97, pp 855-862, (1989)
11. M. Masoumi, H. Hu, J. Hedjazi, M. A. Boutorabi “Effect of Gating Design on Mold Filling”, AFS Transactions, pp 05-152, (2005)
12. Seyyed Hojjat Majidi “Effect of Pouring Conditions and Gating System Design on Air Entrainment during Mold Filling” International Journal of Metalcasting. AFS Transactions (2018)
13. John Campbell “Mini Castings Handbook”, 2nd edition (2018)
14. Jan Jezierski, Rafal Dojka, Krzystof Janerka “Optimizing the Gating System for Steel Castings”, Metals, 8(4), pp 266 (2018)
15. Koushik.K.B, L.Bartlett, M.Xu, D.Imrie, “Design of novel gating systems for steel castings”, International Journal of Metalcasting, 2020 ( To be published)
16. ASTM International, ASTM E140-12be1 Standard Hardness Conversion Tables for Metals Relationship Among Brinell Hardness, Vickers Hardness, Rockwell Hardness, Superficial Hardness, Knoop Hardness, Scleroscope Hardness, and Leeb Hardness, 2012.
17. R. Vaz Penna, L. N. Bartlett , and T. Constance, “ Understanding the role of inclusions on the dynamic fracture toughness of high strength lightweight FeMnAl steels”, International Journal of Metalcasting/Volume 13, Issue 2, 2019
136
SECTION
2. CONCLUSION
Two methods for increasing steel casting cleanliness were quantitatively studied,
filtration and use of novel gating designs. Filtration utilizing ceramic foam filters was
studied for removal of inclusions in high manganese and aluminum, or FeMnAl, steels.
The bifilms in the FeMnAl steel were also effectively filtered by the foam filters. The Fe-
30Mn-9Al-0.9C-1Si-0.5Mo steel studied had primarily AlN inclusions and the filters
showed a maximum of 61% effectivity in reducing the AlN population in the last mold
poured and an increase of 39% in effectivity from the first mold in the sequence to be
poured. The last mold, which was poured from the top portion of a teapot ladle had the
highest proportion of large sized inclusions (>5gm) and the highest filtration rate. This
showed that the efficiency of ceramic foam filters is greater for larger inclusions in FeMnAl
steel.
The second part of this study quantitatively evaluated the ability of different gating
systems to reduce the filling related defects and increase the mechanical properties of two
different steel alloys, a SAE 8630 steel and a Fe-29Mn-8.2Al-0.91C-0.88Si-0.49Mo steel.
The following gating systems were studied, a naturally pressurized system with a side riser,
a naturally pressurized system with a top riser, a pressurized and a non-pressurized system.
For 8630 steel castings, the naturally pressurized top riser system showed the lowest
inclusion area fraction among the four gating systems and the highest breaking energy of
55J. Alumina and alumina-manganese sulfide complex were the primary inclusions.
Fractography showed that the presence of eutectic type II MnS inclusions were the reason

137
for failure in these castings. The overflows showed a higher inclusion area fraction than
the castings. The location of the inclusions obtained in the castings were similar to the
predictions made by the flow simulation software used to design the gating systems. For
FeMnAl castings of composition Fe-29Mn-8.2Al-0.91C-0.88Si-0.49Mo, extensive layers
of bifilms were found in the castings. The naturally pressurized side riser system had the
highest area cover of bifilms and the lowest breaking energy of 140J. The pressurized and
non-pressurized systems showed consistently 165J of breaking energy. The bifilms had a
direct impact on the mechanical strength of the castings and were found to be the reason
for lower energy ductile failure in some specimens. The breaking energy shared an inverse
relationship with the area coverage of bifilms. It was observed that the naturally pressurized
top riser and side riser system performed well for the 8630 steel, while the traditional
pressurized and nonpressurized gating systems performed better for FeMnAl steel castings.
From the filtration project, it was observed that the Charpy samples obtained from filtered
castings showed better toughness properties than unfiltered castings. The overflows
collected the incoming new metal with the slag, dross and inclusion defects and aided in
controlling the velocity of the liquid metal. Therefore, a well-designed nonpressurized
gating system with the presence of a filter is ideal to reduce reoxidation inclusion defects
and improve the quality and notch toughness of FeMnAl castings. Further work should be
done to ascertain the effects of these gating systems on the notch toughness of low alloy
steels like 8630 using Mn-Si as a deoxidant to prevent the occurrence of type II eutectic
MnS that may obscure the influence of reoxidation inclusions.

138
BIBLIOGRAPHY
1. Andre Costa E Silva,” Non-metallic inclusions in steel- origin and control”, Journal for Material Research Technology, 7(3) - 283-299 (2018).
2. Lifeng Zhang, Brian.G.Thomas “ Inclusions in continuous casting of steel”, XXIV National Steelmaking Symposium, Morelia, Mich, Mexico, 26-28, Nov.2003, pp. 138183.
3. T.H.Courtney,” Mechanical Behaviour of Materials,second edition”, Waveland Press, pp-459-461(2005).
4. L.Bartlett, Van Aken, “ Dynamic fracture toughness of high strength cast steels”, International Journal ofMetalcasting, Volume 7, Issue 4, 2013.
5. Griffin, J. A., and Bates, C. E., “Ladle Treatment, Pouring and Gating for the Production of Clean Steel Castings,” SFSA Research Report, No. 104, 1991.
6. R.Raiszadeh, W.D.Griffiths, “ A method to study the history of a double oxide film defect in liquid aluminum alloys”, Metallurgical and Materials Transactions B, volume 37, pages 865-871(2006).
7. Fu-Yuan Hsu, Kuo-Nien Wang & Cheng-Lung Li, “Bifilm defects in ductile-iron support bracket castings”, International Journal of Cast Metals Research, 2017,VOL . 30, NO . 3, 148-158.
8. R.Gopalan, Narayan.K.Prabhu, “Oxide bifilms in aluminium alloy castings - a review”, Materials science and Technology, 27:12, 1757-1769 , (2013).
9. John Campbell, “Mini Casting Handbook”, Revised and Enlarged Second Edition book, 2018.
10. John Campbell,” Castings”, Butterworth Heinemann Limited, 1991.
11. S. Chakraborty, L. Bartlett, R. O’Malley, M. Xu, “Efficiency of solid inclusion removal from the steel melt by foam ceramic filter: Design and Experimental Validation”,122nd AFS MetalCasting Congress, American Foundry Society, ( 2018)
12. MAJ Ryan Andrew Howell “ Microstructural Influence on Dynamic Properties of Age Hardenable FeMnAl Alloys”, Theses, Missouri University of Science and Technology.
13. Frommeyer, G., Brux, U., “Microstructures and Mechanical Properties of High- Strength Fe-Mn-Al-C Light-Weight TRIPLEX Steels,” Steel Research Int., Vol. 77, pp. 627-633 (2006).
139
14. A.M.Schulte, S.N.Lekakh, D.C.Van Aken, V.L.Richards “ Phosphorus mitigation in cast lightweight Fe-Mn-Al-C steel’” 114th MetalCasting Congress, Orlando, Florida, March (2013)
15. Ramesh Singh, “Applied Welding Engineering (Second Edition), 2016.
16. Van Ende, Marie-Aline, "Formation and morphology of non-metallic inclusions in aluminium killed steels", Doctoral Theses,Belgium, January 2010.
17. T.B.Braun, J.F.Elliott,, M.C.Flemings, “The Clustering of Alumina Inclusions”.
18. R. Dekkers, B. Blanpain and P. Wollants, Crystal growth in liquid steel during secondary metallurgy. Metallurgical and Materials Transactions B 34 (2) (2003) 161171.
19. E. Steinmetz and H. U. Lindenberg: Oxide morphology at manganese and manganese- silicon deoxidation. Archiv Fur Das Eisenhuttenwesen 47 (2) (1976) 71-76.
20. Meng-long Li, Fu-ming Wang, “Effect of cooling rate and Al on MnS formation in medium carbon non quenched and tempered steel, International Journal of Minerals, Metallurgy and Materials Volume 22, Number 6, June 2015, Page 589
21. Yoichi ITO, Noriyuki MASUMITSU, Kaichi MA TSUBARA, “Formation of Manganese Sulfide in Steel” , Tetsu-to-Hagane, 66 (1980), 647
22. Sims,C.Dahle,” Effect of aluminum on properties of medium carbon cast steel”, Trans American Foundry society,46, 65-132, 1938.
23. Feng Wang and Zhongyun Fan,” Characterization of AlN Inclusion Particles Formed in Commercial Purity Aluminum”, Metallurgical and Materials transactions A VOLUME 50A, MAY 2019
24. Philips Charles Belding, “Control of non-metallic inclusions in steel”, Master of Science Theses, Oregon state University, June (1971).
25. G. Gigacher, W. Krieger, P. R. Scheller and C. Thomser: Mater. Technol., 76 (2005), 644.
26. Min-Kyu PAEK, Jung-Mock JANG, Min JIANG and Jong-Jin PAK,” Thermodynamics of AlN Formation in High Manganese-AluminumAlloyed Liquid Steels”, ISIJ International, Vol. 53 (2013), No. 6, pp. 973-978
27. Lauri Holappa, Olle Wijk, “ Treatise in Process metallurgy”, Industrial Processes, 2014
28. Roney Eduardo” Influence of the chemical composition on steel casting performance”, Journal for Material Research Technology 2017;6(1):50-56

140
29. Chris.P,” Magnesium: Origin and role in calcium treated incllusions’,Sohn International Symposium; Advanced Processing of Metals and Amterials , volume2, Iron and Steel Making, 2.pp 373-378,2006
30. Wang and C. Beckermann: Prediction of reoxidation inclusion composition in casting of steel. Metallurgical and Materials Transactions B 37 (4) (2006) 571-588.
31. Seyyed Hojjat Majidi “Effect of Pouring Conditions and Gating System Design on Air Entrainment During Mold Filling” International Journal of Metalcasting. AFS Transactions (2018)
32. Seyyed Hojjat Majidi and Christoph Beckermann “Modelling of air entrainment during pouring of metal castings” International Journal of Cast Metals Research, vol 30, pp 301-315, (2017)
33. A.J. Melendez, K.D. Carlson and C. Beckermann, “Modelling of Reoxidation Inclusion Formation in Steel Casting”, International Journal of Cast Metal Research, Vol. 32, pp. 624-638, 2009.
34. R. Kiessling: Metal Science, (1980), 15(5), 161.
35. D. C. HILL AND D. E. PASSOJA,” Understanding the Role of Inclusions and Microstructure in Ductile Fracture
36. G.Y.Hahn, M. F. Kanninen, A.R.Rosenfield, “ Fracture toughness of materials”,
37. Chao Gu , Junhe Lian , Yanping bao , Wei Xiao, “ Numerical Study of the Effect of Inclusions on the Residual Stress Distribution in High-Strength Martensitic Steels During Cooling” , Applied. Sciences, 9(3), 455, 2019
38. C. Ruggieri , “ Numerical investigation of constraint effects on ductile fracture in tensile specimens, March 2004, Journal of the Brazilian Society of Mechanical Sciences and Engineering 26(2)
39. Tweed JH, Knott JF. Met Sci 1983;17:44-7.
40. G.R. Speich, W.A. Spitzig, Metall. Trans. A 13A (1982) 2239.
41. J. R. Rice and M. A. Johnson: Inelastic Behavior of Solids, M. F. Kanninen, et al., eds., p. 641, MNpraw-Hill, New York, 1970.
42. G. T. Hahn and A. R. Rosenfield: Paper PL-III-21 l, Third Int. Conf. Fracture,Munich, 1973.
43. M.A. El-Sayed; M. Ghazy, “ Entrained defects in light metal cast alloys”, Journal of South African Institute of mining and metallurgy”, Volume 117, issue 7, ( 2017)
141
44. J.Campbell,” The consolidation of metals: the origin of bifilms”, J Mater Sci (2016) 51:96-106
45. John Campbell, “ Melting, Remelting, and Casting for Clean Steel”, steel research int. 88 (2017) No. 1, (1-13)
46. L. Pavlak: Metalurgija, 2008, 14, 31-39.
47. D. Dispinar, J. Campbell,” Porosity, hydrogen and bifilm content in Al alloy castings”, Materials Science and Engineering A 528 (2011) 3860-3865
48. M. A. El-Sayed & W. D. Griffiths (2014) Hydrogen, bifilms and mechanical properties of Al castings, International Journal of Cast Metals Research, 27:5, 282-287
49. L. Liu and F. H. Samuel: J. Mater. Sci., 1998, 33, 2269-2281.
50. J. Xu, F. Huang, X. Wang, Metall. Mater. Trans. B2016, 47B, 1217.
51. J. M. Svoboda, R. W. Monroe, C. E. Bates, J. Griffin,Trans. Am. Found. Soc. 1, 95, 187.
52. J. Campbell, Complete Casting Handbook, 2ndEdition, Elsevier, Oxford, UK 2015.
53. Hadfield, R. (1935). Special Steels. Nature, 135(3418), 741-745.
54. Kalashnikov, I., Acselrad, O., Shalkevich, A., Pereira, L.C., “Chemical Composition Optimization for Austenitic Steels of the Fe-Mn-Al-C System,” Journal of Materials Engineering and Performance, Vol. 9, No. 6, pp. 597-602 (2000).
55. Schmatz, D. J., “Formation of Beta Manganese-Type Structure in Iron-Aluminum- Manganese Alloys,” Trans. of Met. Soc. of AIME, Vol. 215, pp. 112-114 (1959).
56. Kayak, G. L., “Fe-Mn-Al Precipitation-Hardening Austenitic Alloys,” Met. Sc. And Heat Tr., Vol. 11, pp. 95-97 (1969).
57. Tjong, S. C., Zhu, S. M., “Tensile Deformation Behavior and Work Hardening Mechanism of Fe-28Mn-9Al-0.4C and Fe-28Mn-9Al-1C Alloys,” Mat. Trans., Vol. 38, pp. 112-118 (1997).
58. Prodhan, A., Charkrabarti, A. K., “A Study on Age Hardening in Cast Fe-Mn-Al-Si-C Alloys,” J. Mat. Sci., Vol. 25, No. 3, pp. 1856-1862 (1990).
59. Howell, R. A., Weerasooriya, T., Van Aken, D. C., “Tensile, High Strain Rate Compression and Microstructural Evaluation of Lightweight Age Hardenable Cast Fe- 30Mn-9Al-XSi-0.9C-0.5Mo Steel,” AFS Transactions - awaiting publication.
142
60. James, P. J., “Precipitation of the carbide (Fe,Mn)3AlC in an Fe-Al Alloy,” J. Iron and Steel Inst., Jan, pp. 54-57 (1969).
61. Kayak, G. L., “Fe-Mn-Al Precipitation-Hardening Austenitic Alloys,” Met. Sc. And Heat Tr., Vol. 11, pp. 95-97 (1969).
62. Goretskii, G. P., Gorev, K. V., “Phase Equilibria in Fe-Mn-Al-C Alloys,” Russian Met., Vol. 2, pp. 217-221 (1990).
63. Krivonogov, G.S., Alekseyenko, M. F., Solov’yeva, G. G., “Phase Transformation Kinetics in Steel 9G28Yu9MVB,” Fiz. Metal. Metalloved, Vol. 39, No. 4, pp. 775-781 (1975).
64. Storchak, N. A., Drachinskaya, A. G., “Strengthening of Fe-Mn-Al-C Alloys During Aging,” Fiz. Metal. Metalloved., Vol. 44., No. 2, pp. 373-380 (1977).
65. Rairu Vaz Penna, “Inclusion Engineering in FeMnAl steels”, Masters Theses, Missouri University of Science and Technology,2019
66. Han, K. H., Choo, W. K., Choi, D. Y., Hong, S. P., “Age Hardening in Fe-Mn-Al-C Austenitic Alloys,” TMS-AIME, pp. 91-106 (1987).
67. Acselrad, O., Pereira, L. C., Amaral, M. R., “Processing Condition, Microstructure and Strength of an Austenitic Fe-Mn-Al-C Alloy,” Proceedings of Proc. and Prop. of Mats., pp. 829-834 (1992).
68. Van Aken, D.C, Howell, R.A., Bartlett, L.N., Schulte, A.M., Lekakh, S.N., Medvedeva, J., Richards, V.L., Peaslee, K.D., "Casting P900 Armor with Lightweight Steel," 63"' Technical & Operating Conference of the Steel Eounders' Society of America, paper 3-2 (2009).
69. Bartlett, L., & Van Aken, D. (2014). High Manganese and Aluminum Steels for the Military and Transportation Industry. JOM, 66(9), 1770-1784. doi:10.1007/s11837- 014-1068
70. Park, J. H., Kim, D., & Min, D. J. (2012). Characterization of Non-metallic Inclusions in High-Manganese and Aluminum-Alloyed Austenitic Steels. Metallurgical and Materials Transactions A, 43(7), 2316-2324.
71. D. Apelian, R. Mutharasan*, S. Ali, “ Removal of inclusions from steel melts by filtration”, Journal of Materials Science, volume 20, pp 3501-3514, (1985)
72. L. J. Gauckler, M. M. Waeber, C. Conti, M. Jacob-Duliere “ Ceramic Foam for molten metal Filtration”, Journal of Materials, volume 37, Issue 9, pp 47-50 (1985)

143
73. Kexu Zhang, “ Liquid permeability of ceramic foam filters”, Norwegian University of Science and Technology, Department of materials Science and Technology, (2012)
74. P. Sandford and S.R. Sibley: Optimization of Al Casting Productivity Using Foam Filter Technology and Application, AFS Transact, 1996, 1063-1068.
75. G.S. Armatas: “Determination of the Effects of the Pore Size Distribution and Pore Connectivity Distribution on the Pore Tortuosity and Diffusive Transport in Mode Porous Networks”, Chemical Engineering Science, vol. 61, 4662-4675.
76. P. Habisreuther, N. Djordjevic and N. Zaralis “Statistical Distribution of Residence Time and Tortuosity of Flow through Open-cell Foams”, Chemical Engineering Science, vol. 64, 2009, 4943-4954.
77. Sarina, BAO, Martin Syvertsen, Anne Kvithyld, Thorvald ENGH,” Wetting behavior of aluminium and filtration with Al2O3 and SiC ceramic foam filters”, Transactions of Nonferrous Metals Society of China, Volume 24, pp 3922-3928, (2014)
78. Bajrang, “Types of Gating system in castings”, Bajrang Engineering
79. Xue X, Hansen S.F, Hansen P.N, Water Analog Study of Effects Gating Designs on Inclusion Separation and mold filling control, AFS Transactions, vol. 101, pp.199-209, (1993)
80. Lin H.J, Hwang W. S., Three-Dimensional Fluid Flow Simulation for Mold Filling, AFS Transactions, vol. 97, pp 855-862, (1989)
81. Seyyed Hojjat Majidi “Effect of Pouring Conditions and Gating System Design on Air Entrainment During Mold Filling” International Journal of Metalcasting. AFS Transactions (2018).
82. R. Dojka, J. Jezierski, and J. Campbell “Optimized Gating System for Steel ”, Journalof Materials Engineering and Performance, Volume 27, pp 5152-5163, (2018)

144
VITA
Koushik Karthikeyan Balasubramanian was born in Nagercoil, Tamil Nadu, India.
As an undergraduate student, he had an internship at Tractor and Farm Equipment Limited
and was a project intern at Indian Institute of Science, Bangalore. He worked on a research
project involving tribology of stainless steel and polymer for medical applications. He
graduated with a Bachelor of Science in Mechanical Engineering from Sir M Visvesvaraya
Institute of Technology (Visvesvaraya Technological University) in 2017.
After graduating, Koushik joined the master’s program in Materials Science and
Engineering at Missouri University of Science and Technology in August 2017. He started
as a graduate research assistant under the guidance of Dr. Laura Bartlett, Dr. Ronal
O’Malley, and Dr. Simon Lekakh starting in January 2018. His research topic was on the
control of inclusion population in steels. During his program, he worked on understanding
the effect of filtration in steels and developed novel gating systems for obtaining steels
with better cleanliness and mechanical strength. He also authored a publication in
conference proceedings and three journal articles. Koushik received his Master of Science
in Materials Science and Engineering from Missouri University of Science and Technology
in December 2020.