Embed Size (px)
DESCRIPTION
Incineration & landfilling. Håkan Jönsson Professor [email protected] Swedish University of Agricultural Sciences. Waste incineration. Renewable fuel : 80-90% of Swedish household waste is renewable (incineration tax assumed 87.4%) Heating value: 2,5- 3,2 -4 kWh/kg, 9- 11,5 -14 MJ/kg - PowerPoint PPT Presentation
Citation preview
Håkan Jönsson Department of Energy and Technology
Incineration & landfilling
Håkan JönssonProfessor
[email protected] University of Agricultural
Sciences
Håkan Jönsson Department of Energy and Technology
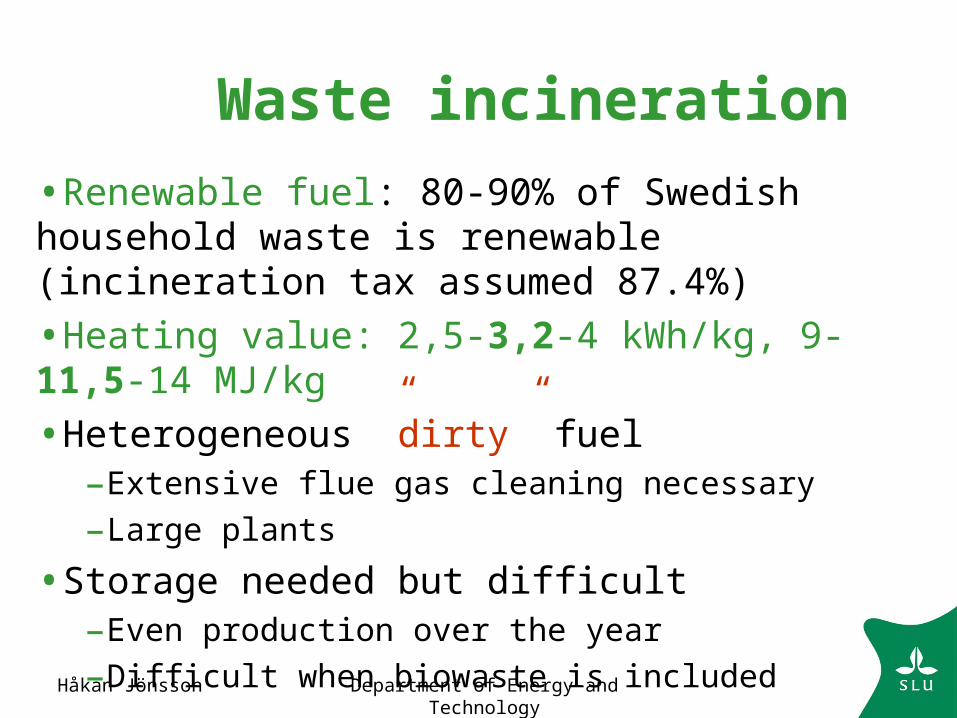
Waste incineration
•Renewable fuel: 80-90% of Swedish household waste is renewable (incineration tax assumed 87.4%)
•Heating value: 2,5-3,2-4 kWh/kg, 9-11,5-14 MJ/kg
•Heterogeneous ”dirty” fuel–Extensive flue gas cleaning necessary
–Large plants
•Storage needed but difficult–Even production over the year
–Difficult when biowaste is included
Håkan Jönsson Department of Energy and Technology
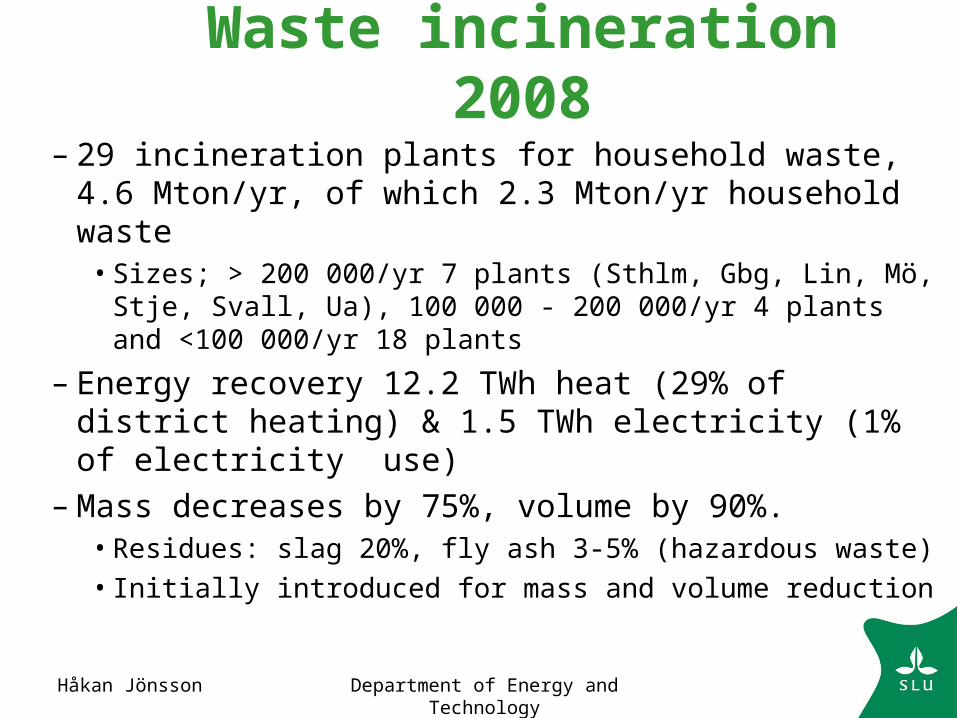
Waste incineration 2008
– 29 incineration plants for household waste, 4.6 Mton/yr, of which 2.3 Mton/yr household waste
• Sizes; > 200 000/yr 7 plants (Sthlm, Gbg, Lin, Mö, Stje, Svall, Ua), 100 000 - 200 000/yr 4 plants and <100 000/yr 18 plants
– Energy recovery 12.2 TWh heat (29% of district heating) & 1.5 TWh electricity (1% of electricity use)
– Mass decreases by 75%, volume by 90%.• Residues: slag 20%, fly ash 3-5% (hazardous waste)• Initially introduced for mass and volume reduction
Håkan Jönsson Department of Energy and Technology
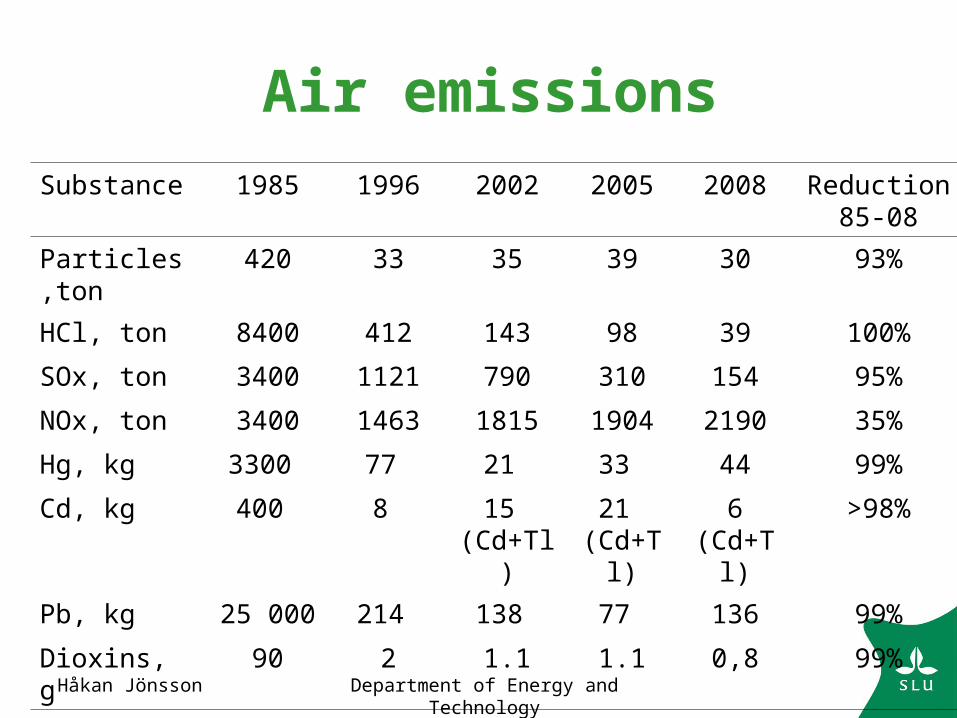
Air emissions
Substance 1985 1996 2002 2005 2008 Reduction85-08
Particles,ton 420 33 35 39 30 93%
HCl, ton 8400 412 143 98 39 100%
SOx, ton 3400 1121 790 310 154 95%
NOx, ton 3400 1463 1815 1904 2190 35%
Hg, kg 3300 77 21 33 44 99%
Cd, kg 400 8 15 (Cd+Tl)
21 (Cd+Tl)
6 (Cd+Tl)
>98%
Pb, kg 25 000 214 138 77 136 99%
Dioxins, g 90 2 1.1 1.1 0,8 99%
Håkan Jönsson Department of Energy and Technology
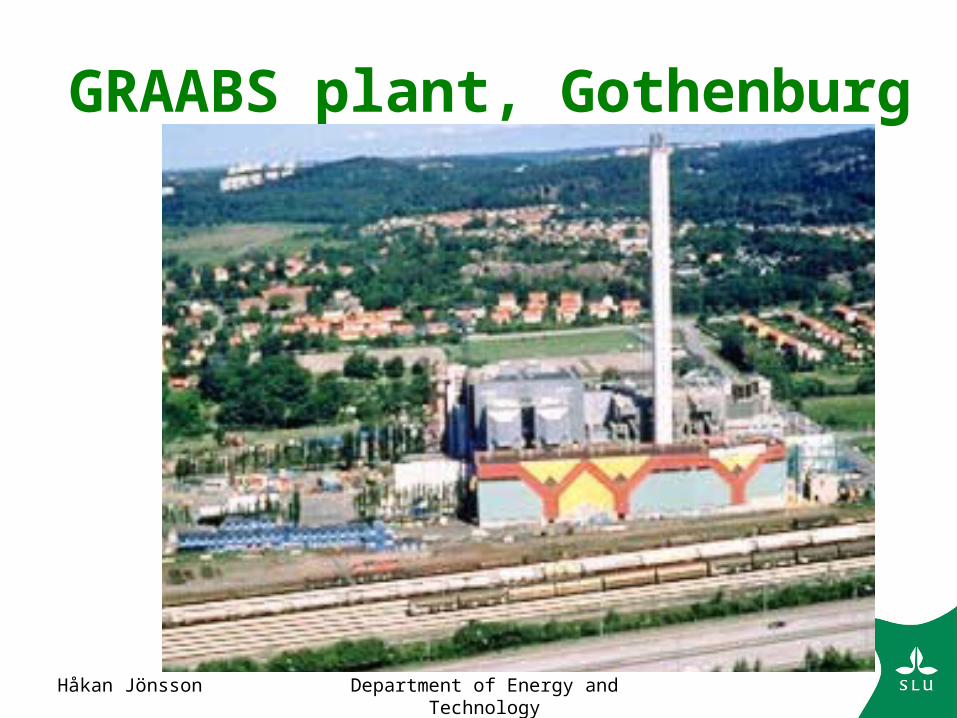
GRAABS plant, Gothenburg
Håkan Jönsson Department of Energy and Technology
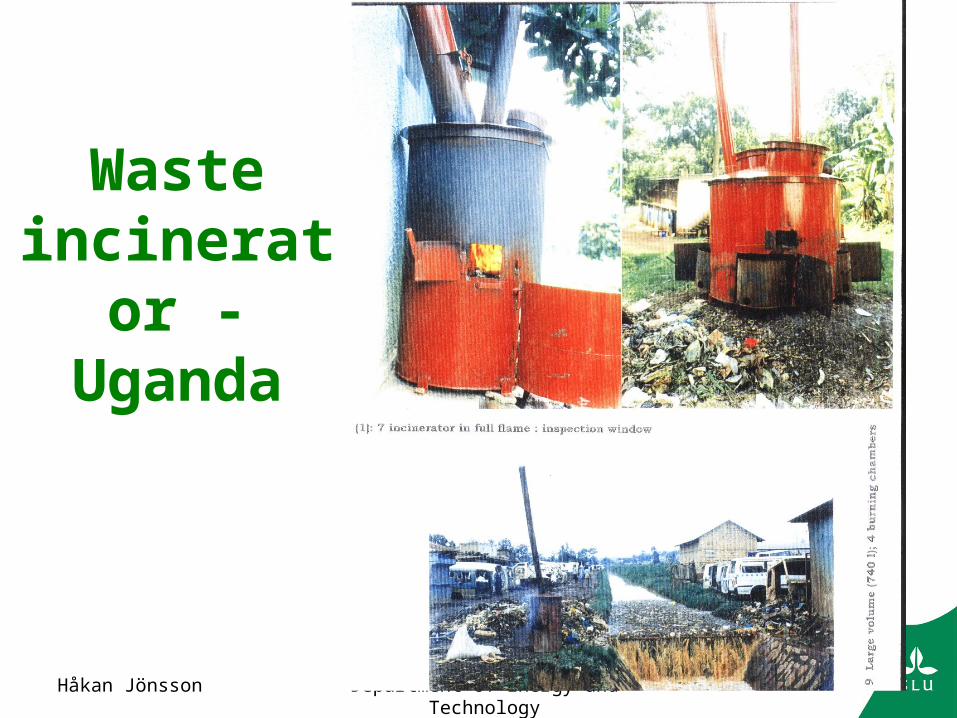
Waste incinerator - Uganda
Håkan Jönsson Department of Energy and Technology
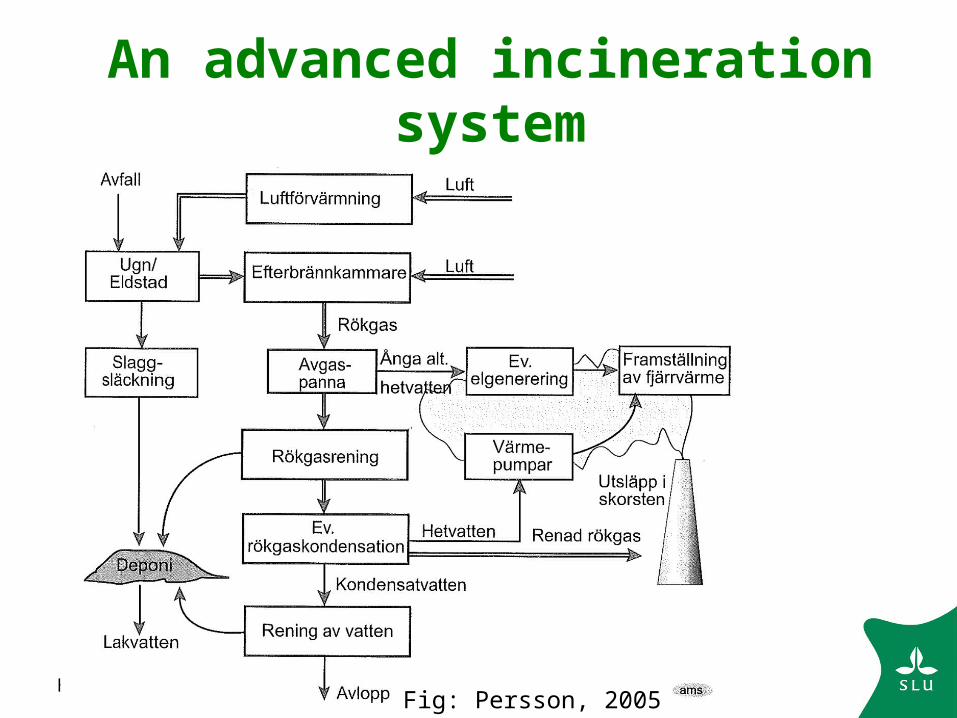
An advanced incineration system
Fig: Persson, 2005
Håkan Jönsson Department of Energy and Technology
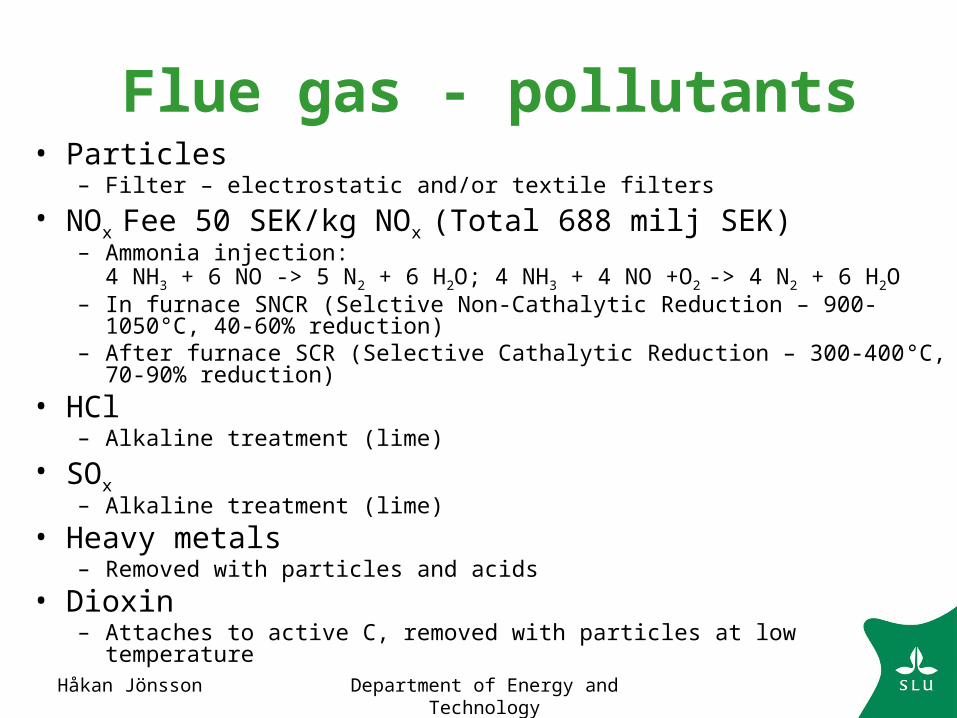
Flue gas - pollutants• Particles
– Filter – electrostatic and/or textile filters
• NOx Fee 50 SEK/kg NOx (Total 688 milj SEK)– Ammonia injection:
4 NH3 + 6 NO -> 5 N2 + 6 H2O; 4 NH3 + 4 NO +O2 -> 4 N2 + 6 H2O – In furnace SNCR (Selctive Non-Cathalytic Reduction – 900-1050°C, 40-60%
reduction)– After furnace SCR (Selective Cathalytic Reduction – 300-400°C, 70-90%
reduction)
• HCl– Alkaline treatment (lime)
• SOx– Alkaline treatment (lime)
• Heavy metals– Removed with particles and acids
• Dioxin– Attaches to active C, removed with particles at low temperature
Håkan Jönsson Department of Energy and Technology
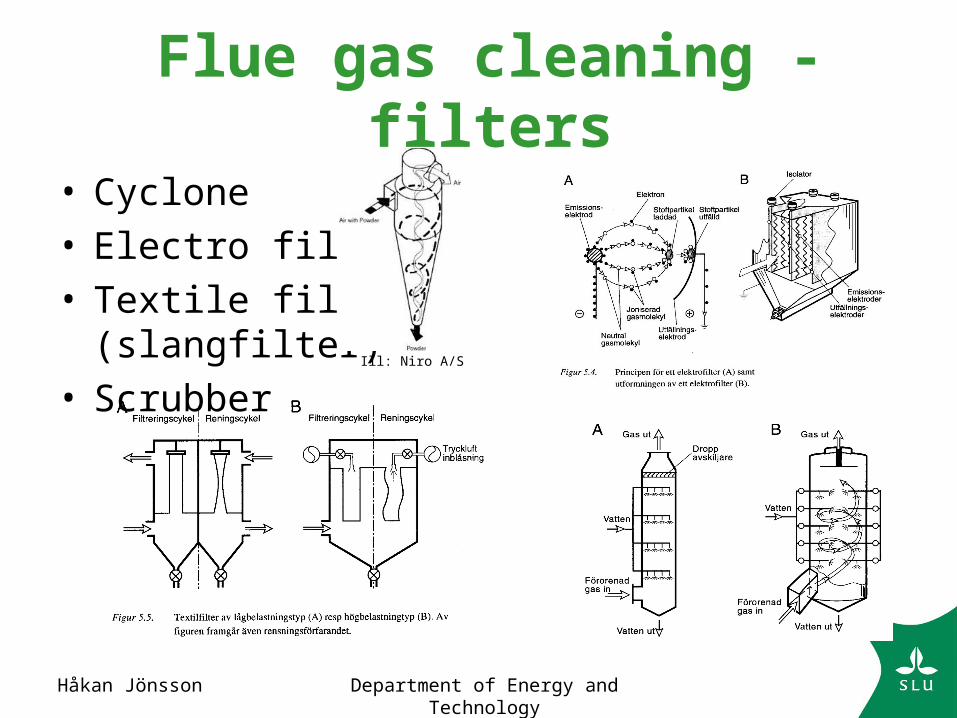
Flue gas cleaning - filters
• Cyclone• Electro filter• Textile filter
(slangfilter)• Scrubber
Ill: Niro A/S
Håkan Jönsson Department of Energy and Technology
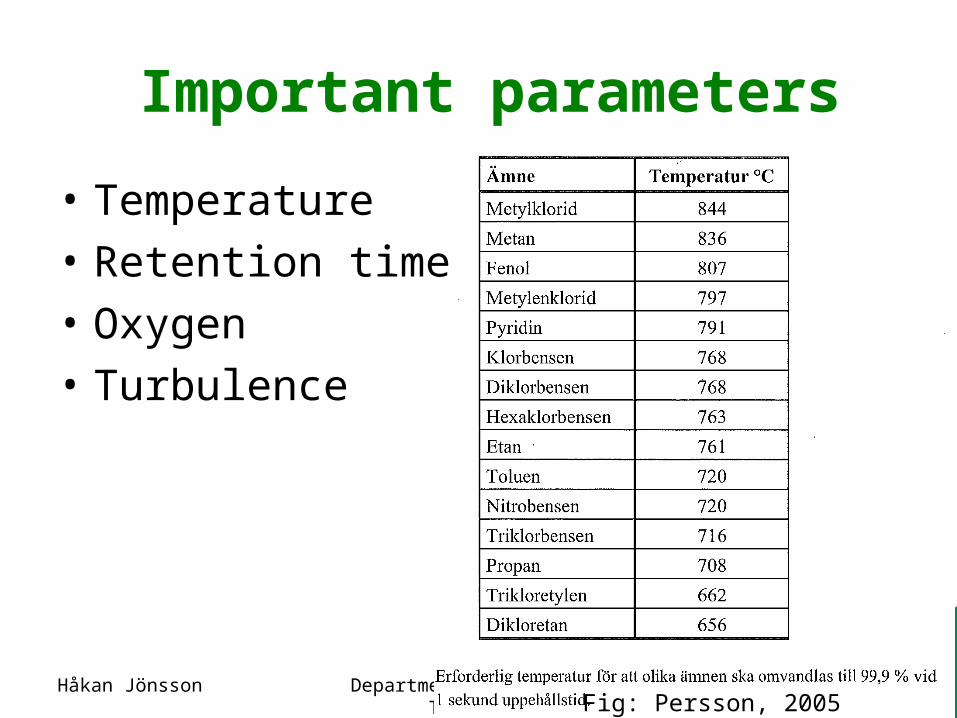
Important parameters
• Temperature
• Retention time
• Oxygen
• Turbulence
Fig: Persson, 2005
Håkan Jönsson Department of Energy and Technology
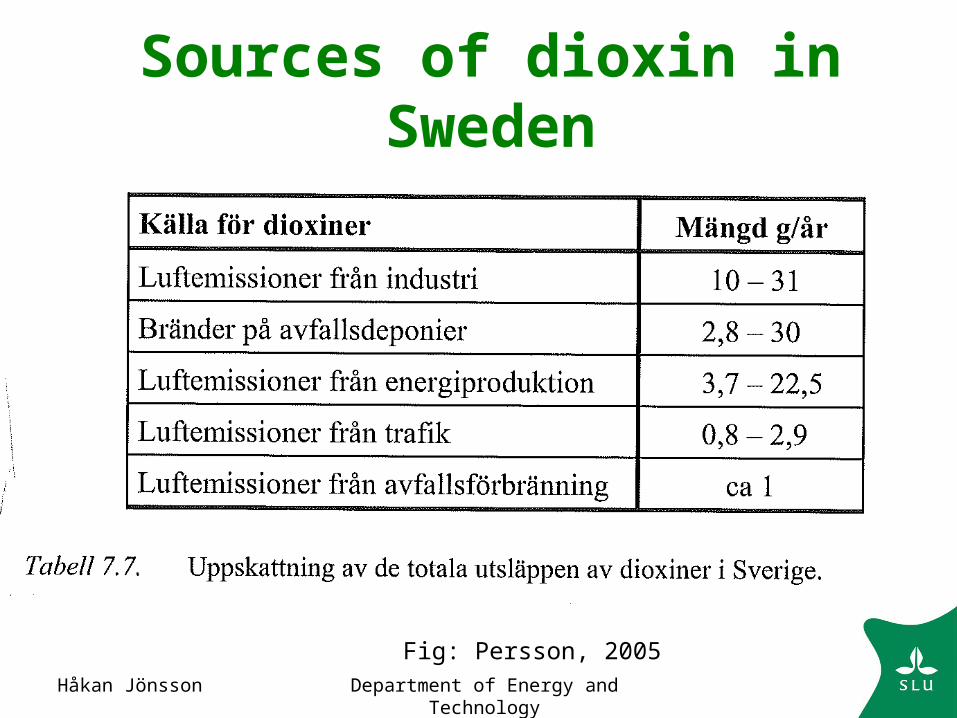
Sources of dioxin in Sweden
Fig: Persson, 2005
Håkan Jönsson Department of Energy and Technology
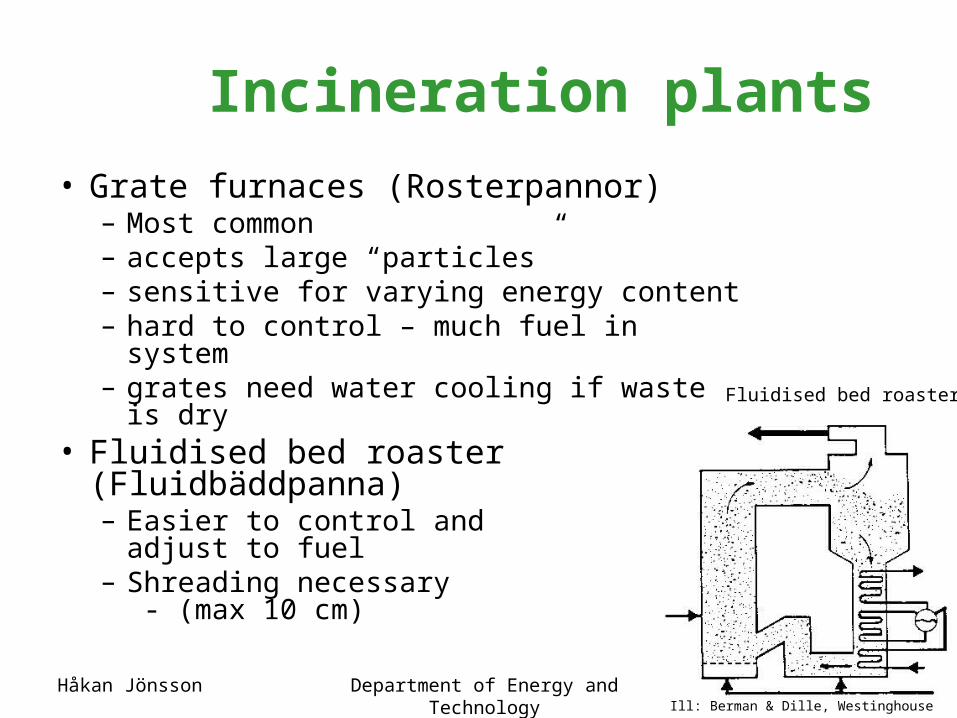
Incineration plants
• Grate furnaces (Rosterpannor)– Most common– accepts large “particles” – sensitive for varying energy content – hard to control – much fuel in system– grates need water cooling if waste is dry
• Fluidised bed roaster (Fluidbäddpanna)– Easier to control and
adjust to fuel– Shreading necessary
- (max 10 cm)
Ill: Berman & Dille, Westinghouse
Fluidised bed roaster
Håkan Jönsson Department of Energy and Technology
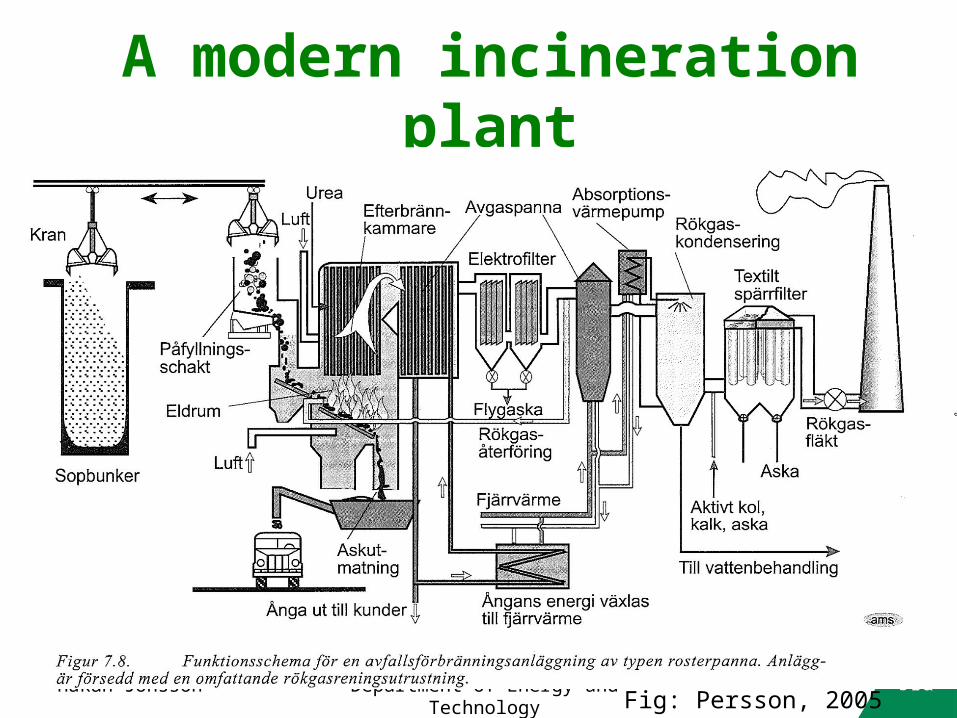
A modern incineration plant
Fig: Persson, 2005
Håkan Jönsson Department of Energy and Technology
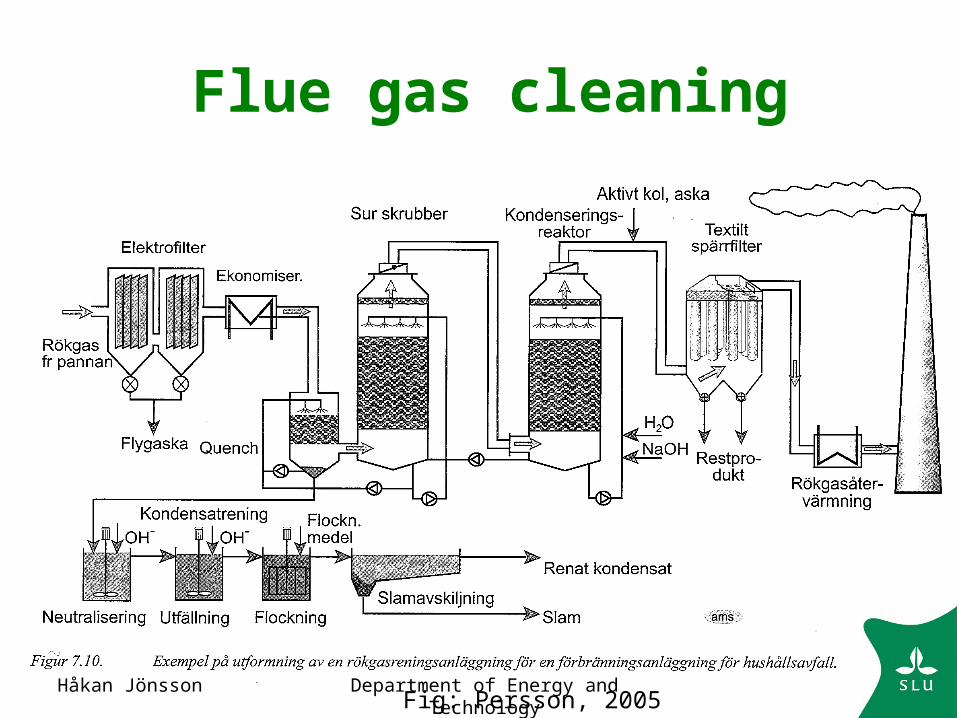
Flue gas cleaning
Fig: Persson, 2005
Håkan Jönsson Department of Energy and Technology
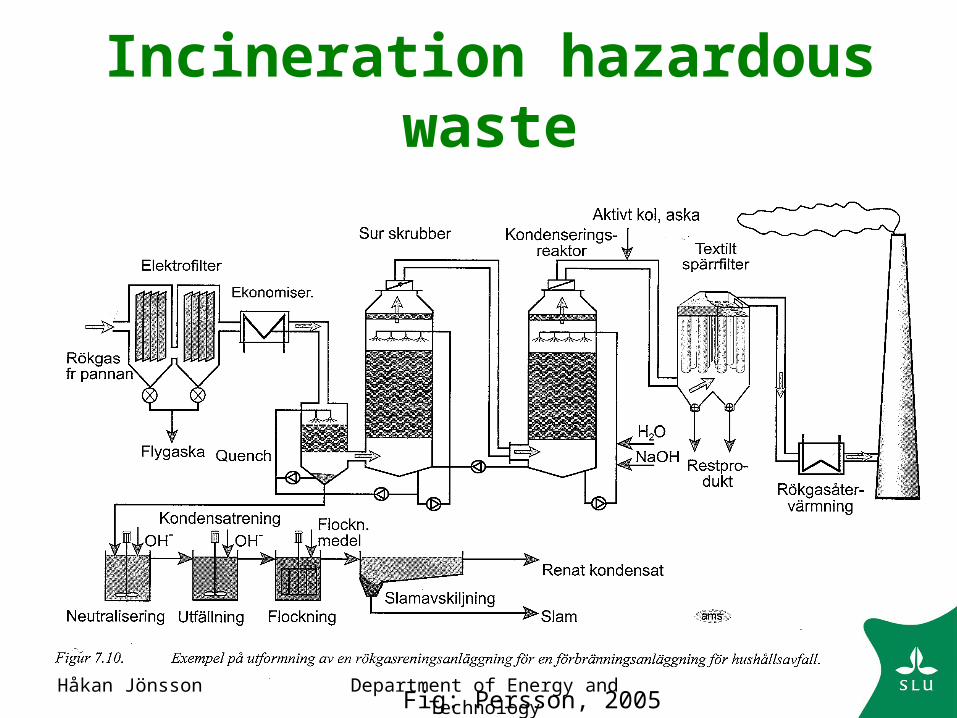
Incineration hazardous waste
Fig: Persson, 2005
Håkan Jönsson Department of Energy and Technology
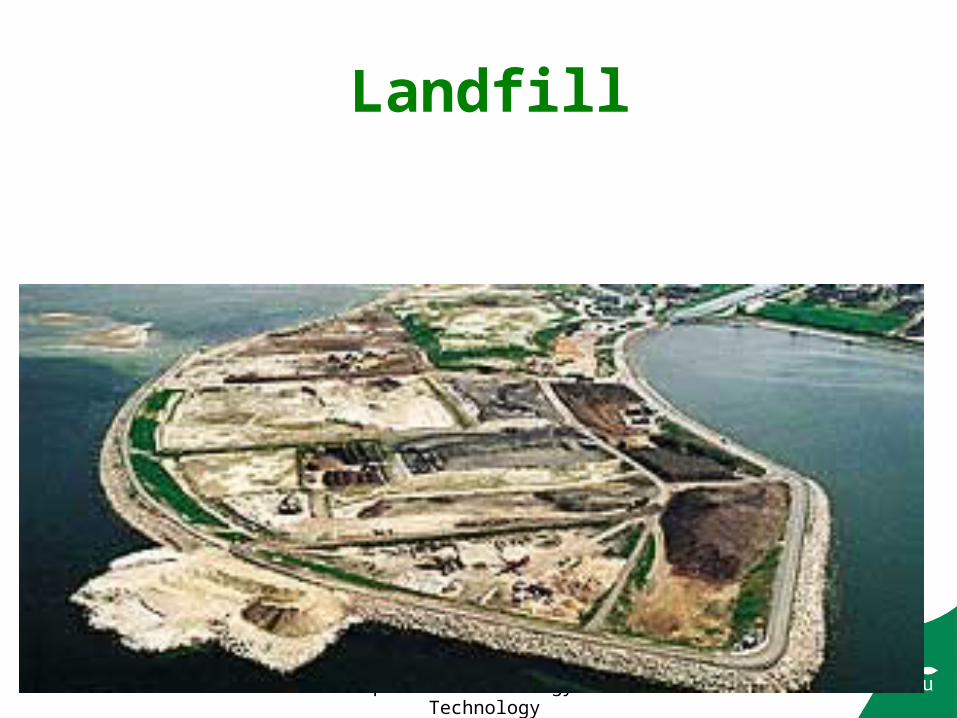
Landfill
Håkan Jönsson Department of Energy and Technology
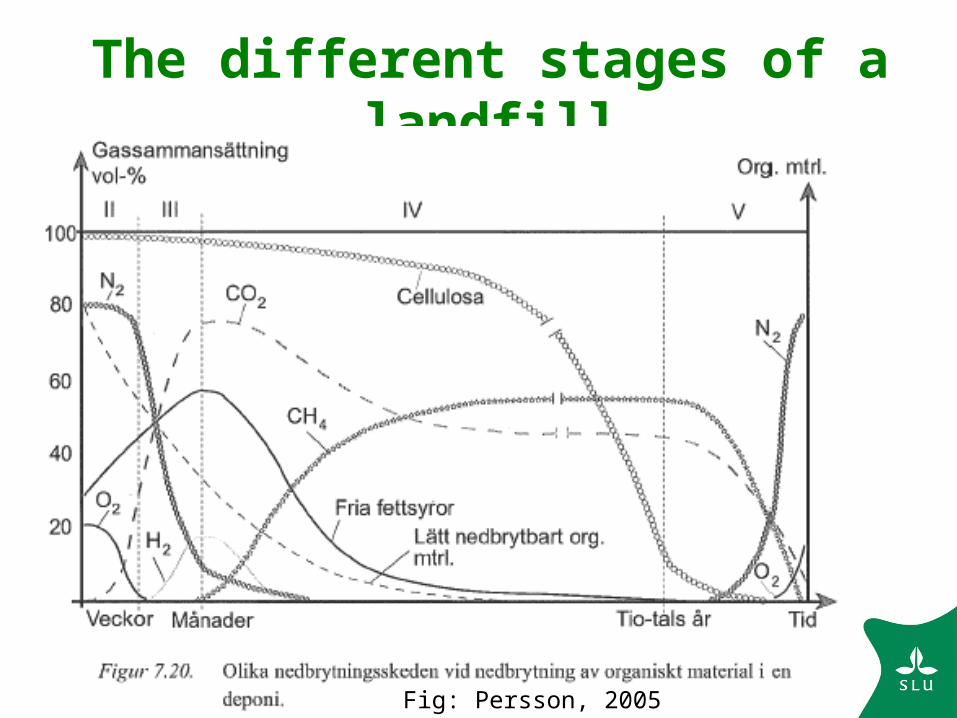
The different stages of a landfill
Fig: Persson, 2005
Håkan Jönsson Department of Energy and Technology
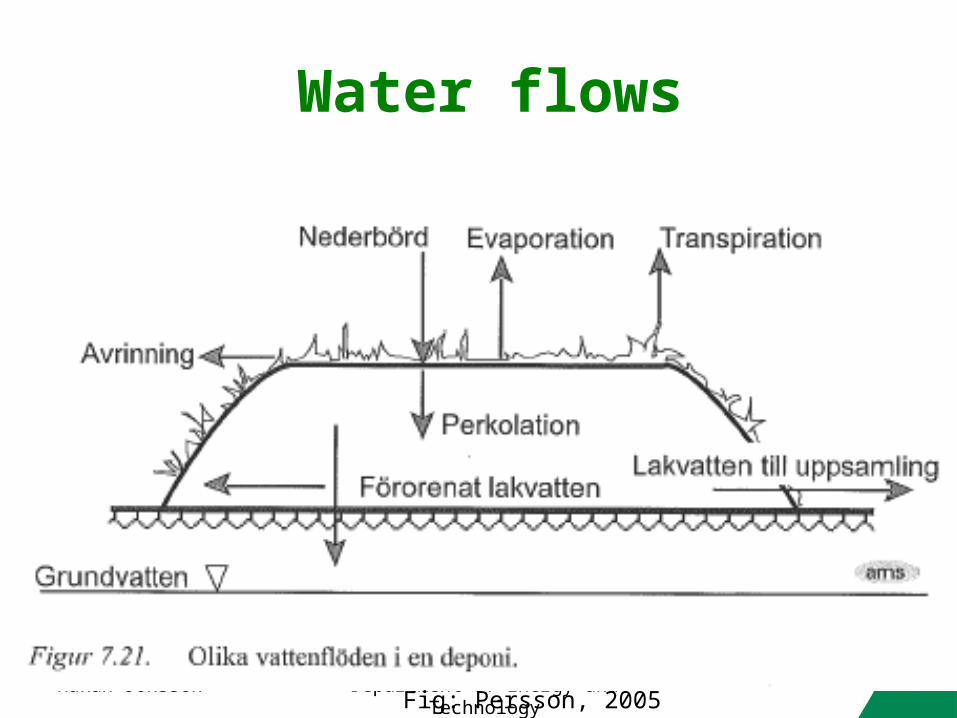
Water flows
Fig: Persson, 2005
Håkan Jönsson Department of Energy and Technology
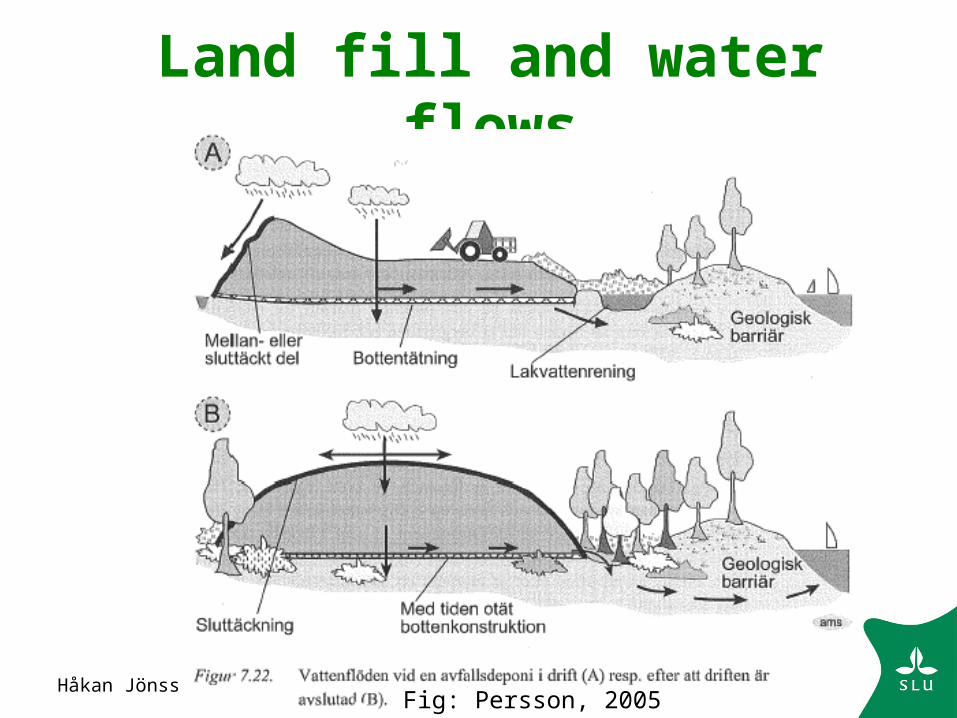
Land fill and water flows
Fig: Persson, 2005
Håkan Jönsson Department of Energy and Technology
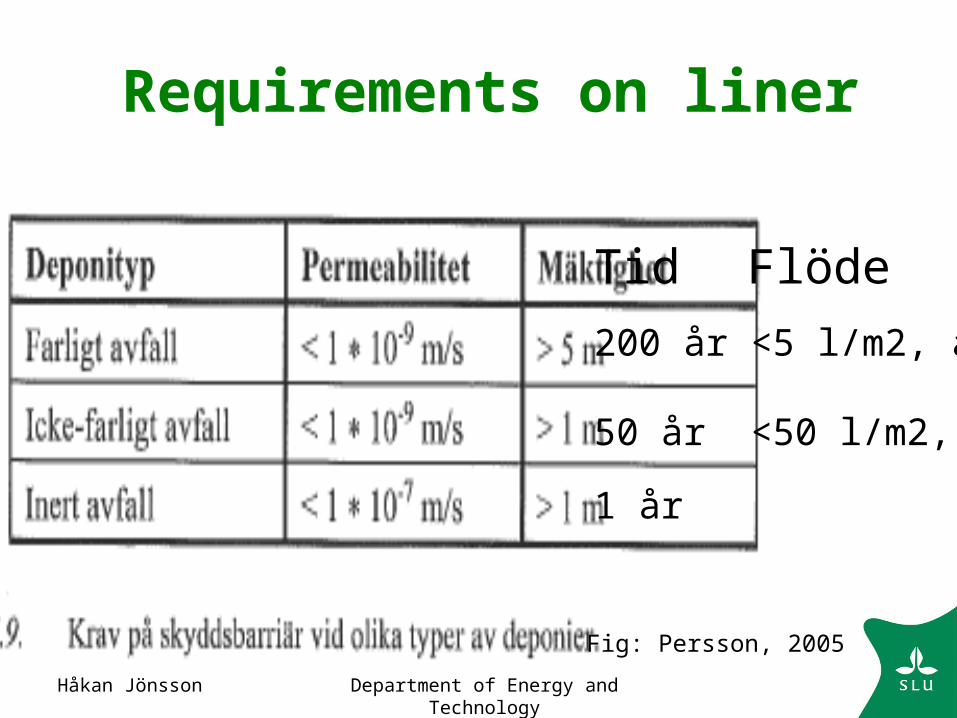
Requirements on liner
Tid Flöde
200 år <5 l/m2, år
50 år <50 l/m2, år
1 år
Fig: Persson, 2005
Håkan Jönsson Department of Energy and Technology
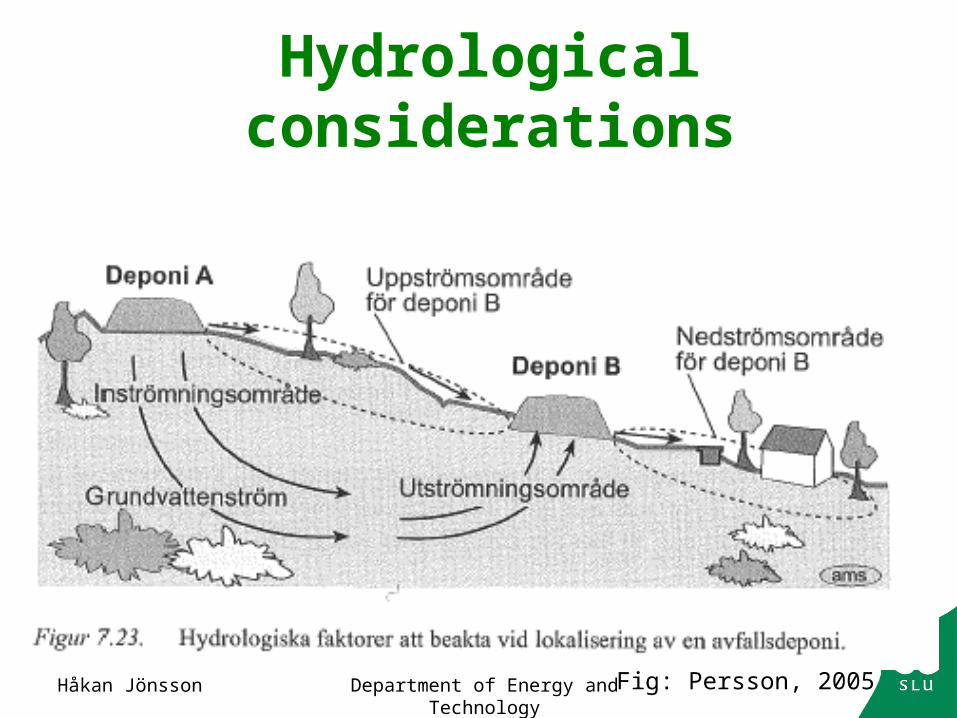
Hydrological considerations
Fig: Persson, 2005
Håkan Jönsson Department of Energy and Technology
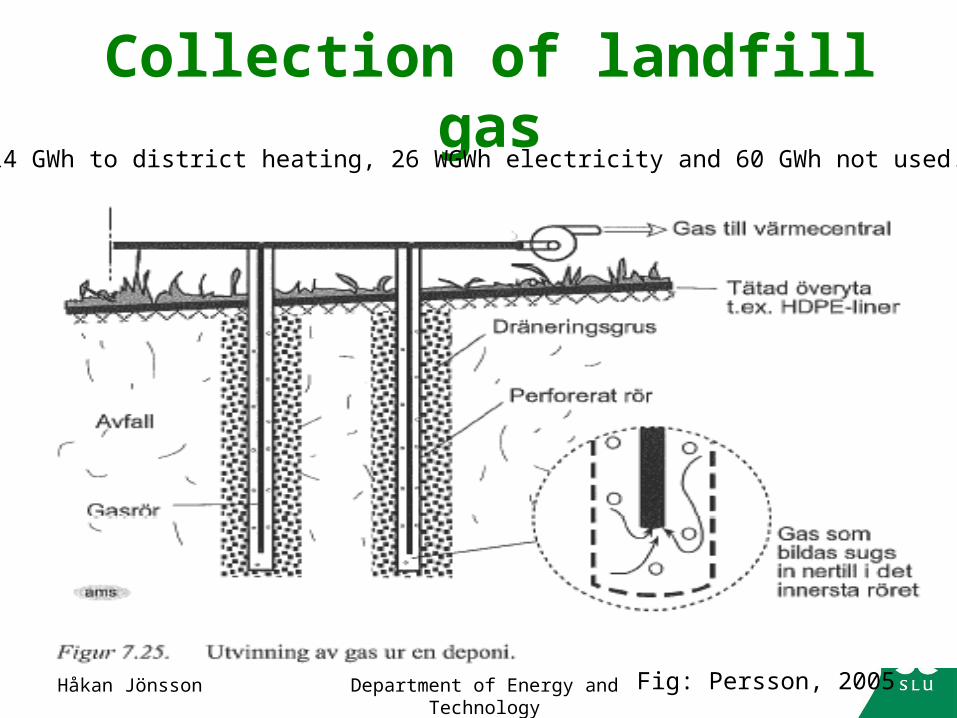
Collection of landfill gas2003: 414 GWh to district heating, 26 WGWh electricity and 60 GWh not used.
Fig: Persson, 2005
Håkan Jönsson Department of Energy and Technology
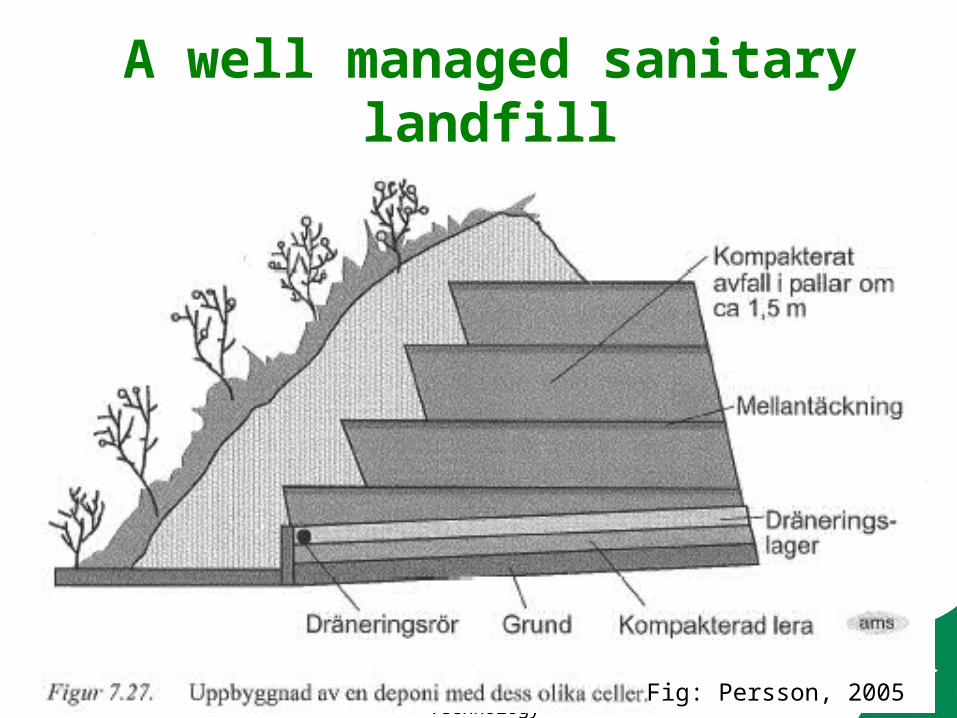
A well managed sanitary landfill
Fig: Persson, 2005
Håkan Jönsson Department of Energy and Technology
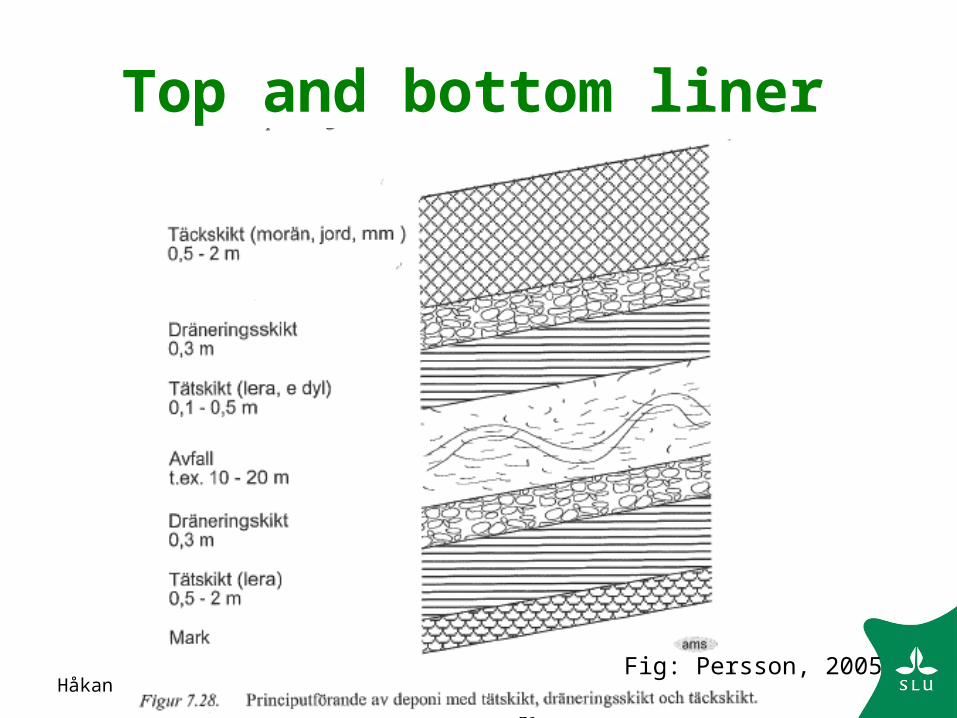
Top and bottom liner
Fig: Persson, 2005
Håkan Jönsson Department of Energy and Technology
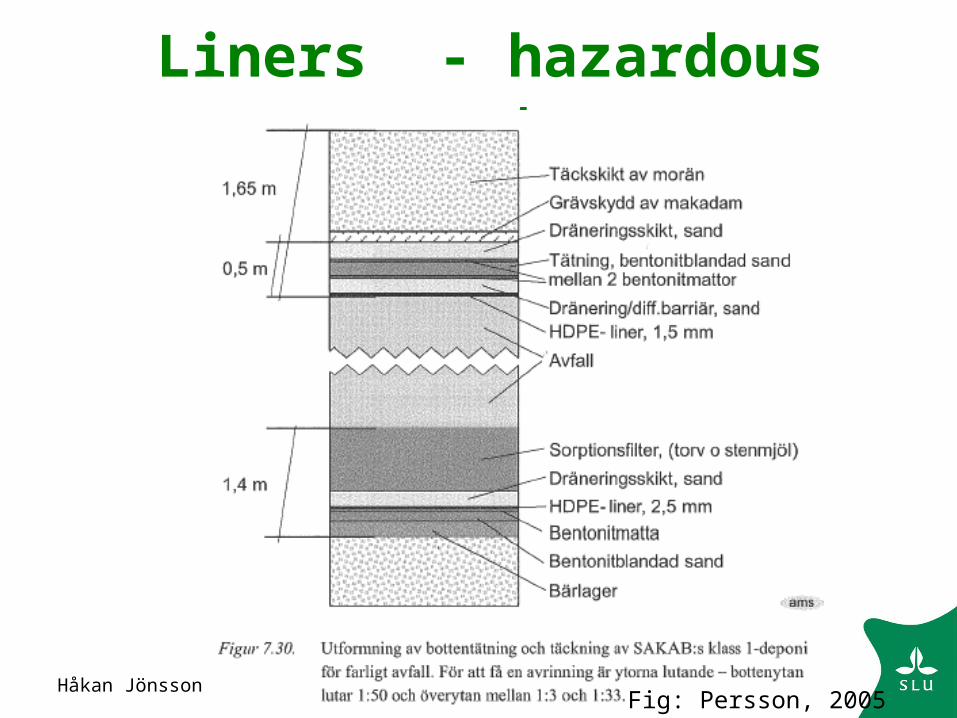
Liners - hazardous waste
Fig: Persson, 2005
Håkan Jönsson Department of Energy and Technology
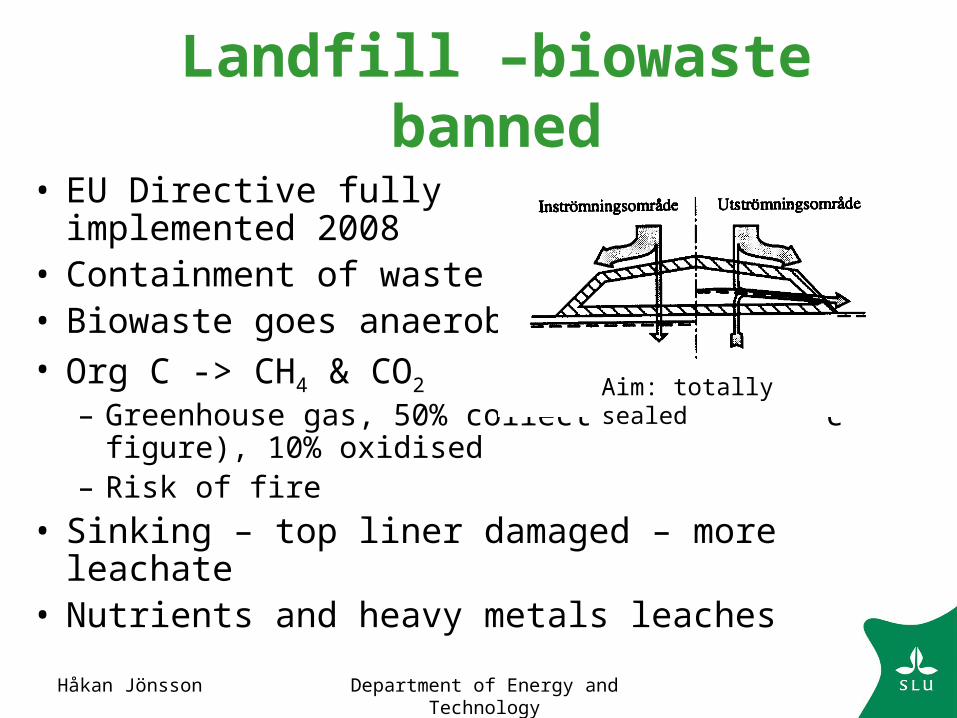
Landfill –biowaste banned
• EU Directive fully implemented 2008
• Containment of waste• Biowaste goes anaerobic• Org C -> CH4 & CO2
– Greenhouse gas, 50% collected (optimistic figure), 10% oxidised
– Risk of fire
• Sinking – top liner damaged – more leachate• Nutrients and heavy metals leaches
Aim: totally sealed