Embed Size (px)
Citation preview

Incertitude in Biostatistical Analysis in Clinical trials
Constantin Mircioiu

Inference Statistics in Clinical Trials • Inference Statistics in Clinical Trials ≈
testing statistical hypothesis about safety and effectivness in entire target patient population based on results obtained from evaluation of two or more treatments in selected samples.
• Inference – is drawing conclusions of making deductions from incomplete and imperfect data.

Fundamental believes • One “fundamental belief of scientific community”:
statistical proof implies correctness or appropriateness of hypothesis.
• One “fundamental belief of biostatisticians” ( that
which understand in depth both phenomenological aspects of biology and phenomenological aspects of mathematics): both biological and mathematical uncertainties are not removed by proof of hypothesis but are further embedded in the apparently more reliable results.

Clinical Uncertainties

Confounding
• In clinical trials, there are many sources of variation some of its not identified and properly controlled. Consequently they can become mixed in with the treatment effect. Then the treatment effect is said to be confounded by effects due to these variations.
• In a titration study, the major problem is that the dose-response relationship is often confounded with time course and the unavoidable carryover effects from the previous dose levels which cannot be estimated and eliminated.
Period I Period II
Sequence 1 T1 T2
Sequence 2 T2 T1

Incertitudes in Clinical Trial. Interactions
• The objective of investigation of “statistical
interaction” is to conclude whether the join contribution of two or more factors is the same as the sum of contributions from each factor when considered alone.
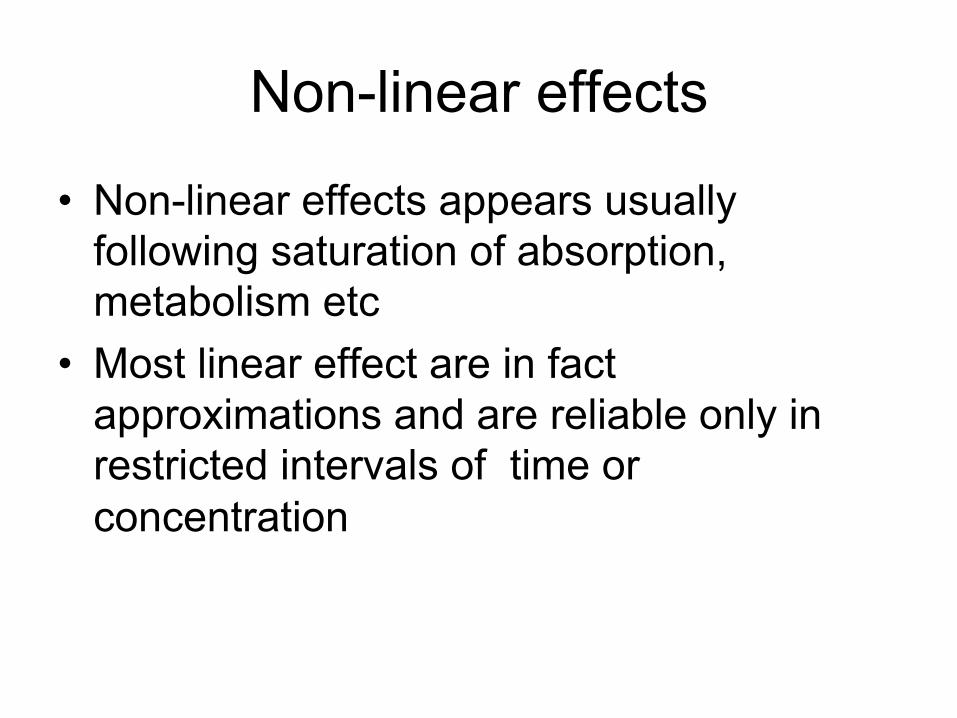
Non-linear effects
• Non-linear effects appears usually following saturation of absorption, metabolism etc
• Most linear effect are in fact approximations and are reliable only in restricted intervals of time or concentration

Dropouts There are several possible reasons for
dropouts. For example, a subject with severe
disease did not improve and hence dropped out from the study. The estimate of treatment effect will be biased in favor of a false positive efficacy, if the subjects with mild disease remain and improve.

Noncompliance
Noncompliance and subject dropouts are only two of the many confounding factors that can occur in many aspects of clinical trials. If there is an unequal proportion of the subjects who withdraw from the study or comply to the dosing regimen among different treatment groups, it is very important to perform an analysis on these two groups of subjects to determine whether confounded factors exist and the direction of possible bias.

INCERTITUDES IN STATISTICAL ANALYSIS • illegal analysis. An example of a deceptive (“fraud” ) practice
is the statistical testing of post hoc hypotheses, but renouncement to such hypothesis kills science
• Unstructured review of data for unknown dependences is a critical part of science. Such review can be an immensely fruitful source of ideas for new, before-the-fact hypotheses that can be tested in the correct way with other new or existing data.
• “Negative” conclusions of low statistical power – that is, reporting that no effect was found when there was little chance of detecting the effect – can also distort inference, Such an analysis, rarely accompanies “negative” findings, and readers may be left with an unjustified sense that an effect not demonstrated is an effect not present. Reports with low power may be better than no report (and no power), or - meta-analysis of several low-power reports may come to stronger conclusions than any one of them alone.

Missing data Missing data introduce ambiguity into the analysis beyond conventional sampling imprecision and the assumptions behind any such analyses form a crucial part of the argument behind any conclusions drawn. The statistician should guard against predictable misinterpretation or misuse. Steps should be taken to inform sponsors, authorities and potential users. Findings should be communicated for the benefit of the widest possible community, yet attempt to ensure no harm to any population group. (DECLARATION ON PROFESSIONAL ETHICS ADOPTED BY ISI COUNCIL 22 & 23 JULY 2010 REYKJAVIK, ICELAND) When data are missing any attempt to draw conclusions from a statistical analysis rests on untestable assumptions concerning the relationship between the unobserved data and - the reasons for them being missing (the missing value mechanism).
APPLICATION: THERAPEUTIC EQUIVALENCE METRICS IN ANALYSIS OF PAIN CURVES IN THE ALGOPIRIN® VERSUS EXCEDRIN® CLINICAL
TRIAL

Objectives of the clinical studies • Design and perfom a clinical comparing the a new analgesic formulation
ALGOPIRIN (Brevet RO nr. 128018) and EXCEDRIN (NOVARTIS)
Problem to solve ALGOPIRIN has less than half amounts of Aspirin ,
Acetaminophen and Coffeine in comparison with Excedrin. Together with a reducement of adverse effects appear also a clinical significant reducement of the effect ?
Study treatments Drugs Dose and active ingredients Algopirin® Algopirin® (LaborMed Pharma) tablets (125 mg aspirin + 75 mg
acetaminophen + 15 mg caffeine + 2 mg clorpheniramin) Excedrin® Excedrin® (Novartis) tablets (250 mg aspirine + 250 mg acetaminophen + 65
mg caffeine)

Statistical design • NON-INFERIORITY STUDY H0: effect of 1 tablet Algopirin = effect of 1 tablet Excedrin versus HA: effect of 1 tablet Algopirin < effect of 1 tablet Excedrin versus Study was designed as a two-sequences, two periods
cross-over randomized, double-blind, uni-center study. Two independent headache episodes were treated by every patient. Patients were randomly allocated to one of the two sequences of treatment: TR or RT
Since results were at the border between non-inferiority and inferiority , a third period was added..
• SUPERIORITY STUDY. H0: effect of 2 tablets Algopirin = effect of 1 tablet Excedrin versus HA: effect of 2 tablets Algopirin >effect of 1 tablet Excedrin All patients from first study received 2 Algopirin tablets

METHODS

Efficacy measurement • All patients were asked to record in their diary
cards headache pain: date and time of headache, the time of drug administration.
• Pain severity was measured on 100 mm visual analogue scale (VAS)
• Evaluation was made immediately before administration of treatment and 30 min, 1h, 2h, 3h and 4 h after drug intake,

endpoints • Current IHS guidelines for migraine clinical trials
recommend assessment of pain relief at 2 hours as a primary endpoint [1] but the expectation of complete headache release within 2 hours might be unrealistic.
• Usual parameters in literature: Time to reduction of pain to 50% , Time to reduction of pain to 10%, time to “pain free” marker
we lose almost all patients and automatically a great part of information and statistically significance.
[1] Tfelt-Hansen P, Block G, Dahlöf C, Diener HC, Ferrari MD, Goadsby PJ, Guidetti V, Jones B, Lipton RB, Massiou H, Meinert C, Sandrini G, Steiner T, Winter PB; International Headache Society Clinical Trials Subcommittee. Guidelines for controlled trials of drugs in migraine: second edition. Cephalalgia. 2000 Nov;20(9):765-86.

• RESULTS

Individual pain curves. DIRECT correlation of sets of curves is mathematically very difficult. The sets of initial pain values were heterogenous.
Curbele de durere (scor VAS) pentru Algopirin 1cpr
0
10
20
30
40
50
60
70
80
90
100
0 30 60 90 120 150 180 210 240
timp (min)
Scoru
l V
AS
vol 1vol 2vol 3vol 4vol 5
vol 7vol 8vol 9vol 10vol 11vol 12vol 13vol 14
vol 16vol 17
vol 19vol 20vol 21
Curbele individuale de durere (scor VAS) pentru Excedrin
01020
3040506070
8090
100
0 30 60 90 120 150 180 210 240
timp (min)S
coru
l V
AS

NORMALIZED PAIN CURVES and replacement of actual values with % of pain comparative with value before the
treatment
Replacement of differences in pain in ratios of pain values
Curbele de durere normalizate fata de durerea inainte de tratamentul cu Algopirin 1 cpr
0102030405060708090
100
0 30 60 90 120 150 180 210 240
timp (min)
pro
cent
din
dure
rea initia
la
Curbele durerii normalizate fata de durerea inainte de tratamentul cu Excedrin
010
20304050
607080
90100
0 30 60 90 120 150 180 210 240
timp (min)
pro
cent
din
dure
rea initia
la

• Which of the two alternative methods is more correct: – normalization of individual methods and then caluclation of mean curve, – calculation of mean curve followed by its normaization
• Tho two operation does not commute.
Algopirin 1cpr
0102030405060708090
100
0 30 60 90 120 150 180 210 240
Calculul mediei si normalizareNormalizare si calculul mediei
Excedrin
0102030405060708090
100
0 30 60 90 120 150 180 210 240
Calculul mediei si normalizareNormalizare si calculul mediei
Curbele medii normalizate dupa calculul mediei (A)
Curbe medii de durere obtinute din curbele individuale normalizate (B)
Timp (min)
Algopirin 1 cpr Excedrin Algopirin 1 cpr Excedrin 0 100 100 100 100
30 79 64 78 61 60 52 40 52 37
120 30 27 29 25 180 16 20 15 19 240 9 15 9 15
Curbele medii normalizate dupa calculul mediei
0
20
40
60
80
100
0 30 60 90 120 150 180 210 240
timp (min)
Excedrin Algopirin 1 cpr
Curbe medii de durere obtinut e din curbele individuale normalizate
0
20
40
60
80
100
0 30 60 90 120 150 180 210 240
timp (m in)
%
Algopir in 1 Excedrin

“COMPENDIAL” EVALUATIONS

Usual approach: Comparison of time to reduction of pain to half (T50% ) and T10 % parameters of mean curves:
0102030405060708090
100
0 30 60 90 120 150 180 210 240
Algopirin 1 Excedrin
0102030405060708090
100
0 30 60 90 120 150 180 210 240
Algopirin 1 Excedrin

Evaluation of T50 & T10 parameters for each individual curve ?
Fig. 9. Individual VAS for patient 19
0
50
100
0 30 60 90 120 150 180 210 240
VAS
Patient 29
Algopirin 1 Excedrin

Comparison of T50 and T10 parameter sets corresponding to compared drugs ?
11.a. t 1/2
0
30
60
90
120
150
180
210
240
0 20 40 60
algopirin
11.b. t 1/2
0
30
60
90
120
150
180
210
240
0 20 40 60
timp
(min)
exc edrin
Fig. 11. Distribution of T50% for each individual curve for Algopirin (11a) and for
Excedrin (11b)

Time course of the percent of patients with more than 50% pain relief .
After 30 minutes 22 % patients presented a reducement to pain in case of Excedrin and 7 % after treatment with Algopirin. After one hour the percents
were apporximately equal, with a small advantage of Algopirin t 1/2
0
5
10
15
20
25
30
35
40
45
0 30 60 90 120 150 180 210 240
timp (min)
nr s
ubje
cts
algopirin excedrin

NEW ALTERNATIVE/COMPLEMENTARY
METHODS

Comparison of curves as sets of points. Estimation of statistical significance.
• Mean curves as two sets of five points using t-Student pair test (=1.17) considering a normal distribution of data.
• For our number of data and assuming a 10 % risk, theoretical t is 1.53 .
Conclusion: hypothesis of the equality of effects of one tablet Algopirin and one tablet Excedrin cannot be rejected.

Area Under Pain Curves (AUC)
• Area under curves is proposed as a global parameter useful first of all in comparison of curves. Area under plasma levels curves of active substances is the most significant parameter in defining bioavailability of a drug. Statistical methods applied in comparison of populations of areas under curves achieved by two drugs evaluate the bioequivalence drugs containing the same active substances. A natural method for calculation of this area is the trapezoid rule:
•
• If we calculate the area under Pain Intensity Difference (PID) curve, we obtain a parameter somewhat similar with the Sum of PID differences (SPID). In fact SPID is the sum of PID scores multiplied by the interval between ratings:
• For slow decreasing curves the areas are approximately equal but for time intervals with rapid change of pain, the differences can no more be neglected.
11
1
( ( ) *( )2
ni i
i ii
f t f t t t−−
=
+−∑
( )11
( )n
i i ii
SPID PID t t t −=
= −∑

Comparisons of mean AUCs
The areas under mean curves at 2 h and 4 h. Areas for Excedrin® are somewhat greater than areas for Algopirin ® but differences seem not to be significant. In fact difference is 11 % at 2h and 4 % at 4h.
AUC
0
10
20
30
40
50
60
70
1 2 3 4
timp (h)
AUC
Algopirin 1 Excedrin
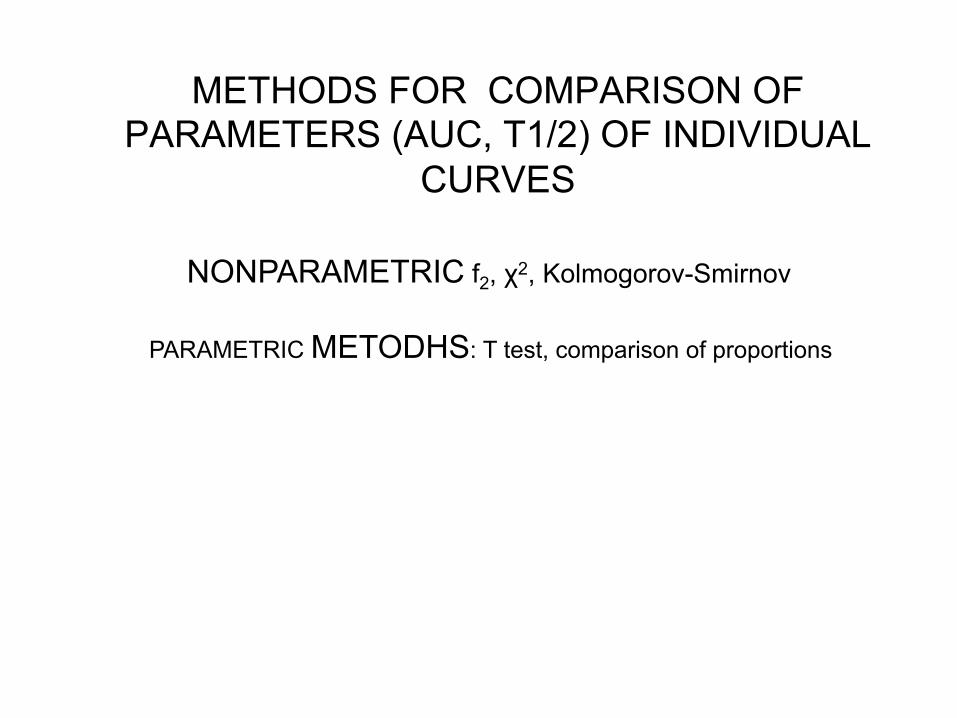
METHODS FOR COMPARISON OF PARAMETERS (AUC, T1/2) OF INDIVIDUAL
CURVES
NONPARAMETRIC f2, χ2, Kolmogorov-Smirnov
PARAMETRIC METODHS: T test, comparison of proportions

Comparison between “survival functions of pain”
One commonly used method for comparing two survival (curves) functions is the log rank test.
i.e. logarithms of survival curves are proportional. + Kolmogorov Smirnov test
( ) ( )0 1 2:H S y S y= ( ) ( )1 2:aH S y S y
λ= ⎡ ⎤⎣ ⎦

Application of Log-rank test for comparison of Kaplan Meyer estimators for the pain survival curves. di percents of “pain dying at the moment t”. ei – expected values and vi dispersion, in the hypothesis of equality of curves estimated from all data.
( )
( )
2
21 11 1 1 1
log1
11
k k
i ii i
rank LR k
ii
d ed e
X XD d ν
= =
=
⎛ ⎞−⎜ ⎟ −⎝ ⎠= = =
∑ ∑
∑
( )( )
1 21 2 1
k k k k kk
k k
n n d n dn n
ν−
=−
( )( )
1 21 2 1
k k k k kk
k k
n n d n dn n
ν−
=−
11
k kk
k
n den
=
Comparison of “pain survival curves”

Comparison of “pain survival curves” • Application of Log-rank test for comparison of Kaplan Meyer estimators for the
pain survival curves Algopirin vs Excedrin t 1kd 2kd kd 1kn 2kn kn 1ke 1 1k kd e− 1kν
0 0 0 0 100 100 200.00 0.00 0.00 0.00 30 22 39 60 78 61 139.55 33.82 -11.90 8.51 60 26 24 51 52 37 88.97 29.35 -2.89 5.38
120 22 13 35 29 25 54.08 19.00 3.16 3.13 180 14 6 20 15 19 34.15 8.89 5.32 2.11 240 6 4 11 9 15 23.53 4.04 2.24 1.43
Sum 91 85 176 95.11 -4.07 20.56 LRX = 0,81 $λ = 0.82 CI 90%: (0.45 ;1.49)
2xAlgopirin vs Excedrin t 1kd 2kd kd 1kn 2kn kn 1ke 1 1k kd e− 1kν
0 0 0 0 100 100 200.00 0.00 0.00 0.00 30 49 39 87 51 61 112.60 39.69 9.18 4.89 60 25 24 49 26 37 63.36 20.22 4.90 2.70
120 14 13 27 12 25 36.20 8.69 5.75 1.52 180 4 6 10 8 19 26.53 2.78 1.18 1.31 240 3 4 7 5 15 19.70 1.78 0.72 0.90
Sum 94.88 85.42 180.30 73.14 21.74 11.32 LRX = 41,74 $λ = 6,82 CI 90%: (3,05 ;15,25)
Curbe medii de durere obtinute din curbele individuale normalizate
0
20
40
60
80
100
0 30 60 90 120 150 180 210 240
timp (min)
%
Algopirin 1 Excedrin Algopirin 2
Deoarece ( ) ( )2 2,1 0,90 ; 1 2,71χ α χ= =
Conclusion: Effectul of Algopirin tb is not inferior to the effect of Excedrinului 1 tb and , effectul of Algopirinului 2 tb is superior to the effect of Excedrinului 1 tb .

Calculation of of the “clinical equivalence “ by application of “bioequivalence methods ” in case of
cross-over experiments
• As “metrics” i.e. measures of rate and absorption. Guidance’s (EMEA, FDA) consider and also by law two drugs are BE if
• From this point the problem of establishing BE becomes problem of building a CI for the ratio of means of main pharmacokinetic parameters. Statistical model for the random variable (or ) is:
• It were applied both parametric ( method of confidence intervals and Scuirmann method) and non-parametric methods ( Wilcoxon, Steinijans Diletti tests) . It was obtained that the products are “bioequivalent”.
0,8 1,25 0,9TAUCRAUC
P µµ
⎛ ⎞〈 〈 ≥⎜ ⎟
⎝ ⎠
( ) ( ), 1,ijk ik j ijkj k j kY S P F C eµ −= + + + + +
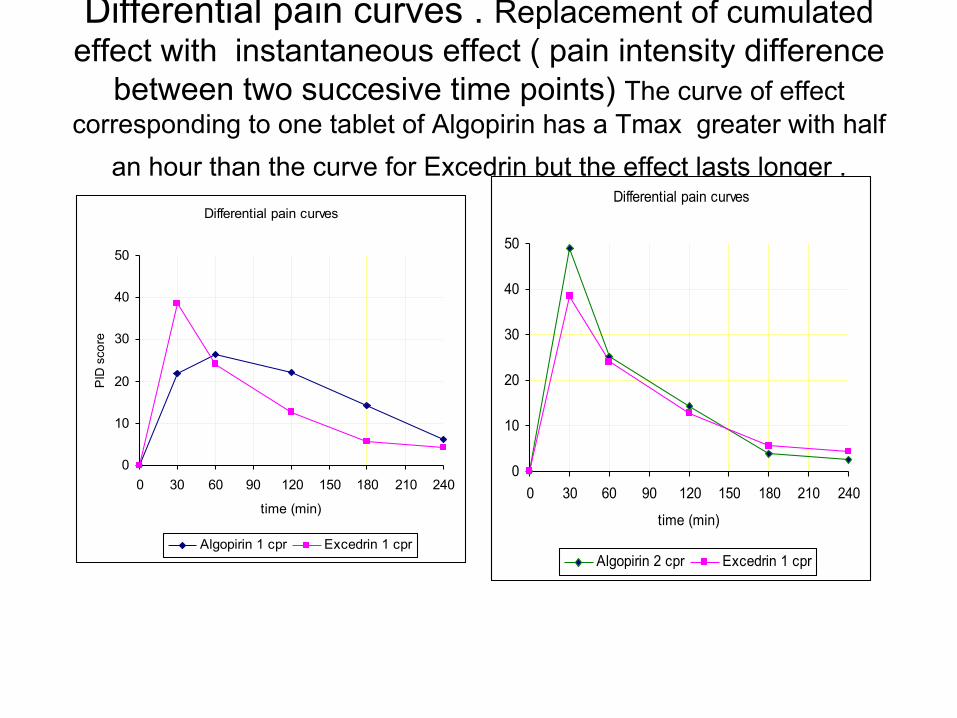
Differential pain curves . Replacement of cumulated effect with instantaneous effect ( pain intensity difference
between two succesive time points) The curve of effect corresponding to one tablet of Algopirin has a Tmax greater with half
an hour than the curve for Excedrin but the effect lasts longer . Differential pain curves
0
10
20
30
40
50
0 30 60 90 120 150 180 210 240
time (min)
PID
sco
re
Algopirin 1 cpr Excedrin 1 cpr
Differential pain curves
0
10
20
30
40
50
0 30 60 90 120 150 180 210 240
time (min)
Algopirin 2 cpr Excedrin 1 cpr

Conclusions • Time to 50 % pain relief (T50) in mean curves was 60 min for
Algopirin and 45 min for Excedrin. The 15 minutes difference can be considered clinically significant ?
• Comparisons of the two set of five points of the normalized mean pain intensity curves using Student test led to conclusion that equivalence hypothesis cannot be rejected . There are data normally distributed ?
• In agreement with statistics based on mean curves, the population approach suggested a difference not enough significant between the effects of formulations to reject the equivalence hypothesis.
• There is no one perfect parameter to characterize the evolution of pain.
• Comparison of different parameters of mean curves ( t50, t10, AUC ) is most spread utilized method but the results have to be compared with mean parameters of all individual curves after elimination of outliers.
• Comparison of differential pain curve offers a chance of correlation of effect with pharmacokinetics of active components ?
• Interpretation of pain curve as “survival of pain curve” allows transfer of advanced statistical methods from cancer research in comparison of analgesic compounds effects ?

Conclusions • There is no one perfect parameter to characterize the
evolution of pain. • Comparison of different parameters of mean curves
( t50, t10, AUC ) is most spread utilized method but the results have to be compared with mean parameters of all individual curves after elimination of outliers.
• Comparison of differential pain curve offer a chance of correlation of effect with pharmacokinetics of active components
• Interpretation of pain curve as “survival of pain curve” allow transfer of advanced statistical methods from cancer research in comparison of analgesic compounds effects.

META CONCLUSION TRANSFER OF BIOLOGICAL INCERTITUDE
AND DOUBT TOWARD BIOSTATISTICS MEANS ONLY TO HIDE THE REALITY
Foul deeds will rise / Though all the earth
o'erwhelm them, to men’s eyes (Hamlet, Act I, Scene 2)

THANK YOU !


![Apprehender Incertitude[1]](https://img.dokumen.tips/doc/110x75/55cf8603550346484b937790/apprehender-incertitude1.jpg)