Embed Size (px)
Citation preview

Incarceration and Invisible Inequality
Bruce Western1
Princeton University
May, 2004
1This research was supported by grants from the Russell Sage Foundation andthe National Science Foundation.

Abstract
Standard measures of economic disadvantage among young men became in-creasingly optimistic through the 1980s and 1990s due to the increase in theU.S. incarceration rate. I quantify the concealed inequality due to incarcera-tion by (1) constructing employment to population ratios that include prisonand jail inmates among those out of work, and (2) calculating black-whitewage ratios that adjust for attrition from the labor market due to jobless-ness and incarceration. By 2000, among non-college black men, aged 22 to30, the jobless rate (one minus the employment ratio) based on the CurrentPopulation Survey stood at 29.9 percent, in comparion to the adjusted rateof 42.1 percent that includes the prison and jail population. If we accountfor the large numbers of low-education men without work or incarcerated,racial inequality in hourly wages in 1999 would have been about twice ashigh as its observed level. Adjusting for racial disparities in joblessness andincarceration suggests that young black men have experienced virtually noreal economic gains on young whites in the 15 years from 1999.
Although numerous, the poor are invisible in America’s affluent society.
The everyday hardships of low-income families are unfamiliar to those who
are economically comfortable. Poor people are seldom depicted in the pop-
ular culture, in movies or on television. The poor are especially invisible
during periods of economic prosperity. At the end of the 1990s, unemploy-
ment rates dropped to historically low levels but large numbers of workers
remained poor while working in minimum-wage jobs. In the context of a
booming stock market and rising incomes among the rich, growth in the
numbers of low-income workers fell outside our understanding of the ma-
jor economic trends. The working poor, wrote Katherine Newman (1999,
xiii–xiv), “have attracted very little attention. They do not impinge on the
national conscience.” David Shipler (2003, 11) sounds a similar theme, ob-
serving that low-wage workers “blend into familiar landscapes and are there-
fore overlooked. They make up the invisible silent America that analysts
casually ignore.” Cyclical affluence, it seems, erases the poor from public
consciousness.
A strong economy also concealed the poor from public view in the early
1960s. The unemployment rate was again extremely low, and the United
States was enjoying a period of sustained economic growth in which the wages
of even low-skill workers grew strongly. The mood of economic optimism was
sobered when Michael Harrington pulled back the cutain on U.S. poverty
with the publication in 1962 of The Other America. During that earlier
economic expansion, Harrington also found that the poor had disappeared
from the outlook of policymakers and the middle class. In the affluent society
of the early 1960s, “the millions who are poor in the United States tend to
become increasingly invisible. Here is a great mass of people, yet it takes
an effort of the intellect and will even to see” (Harrington 1962, 10). Why
1

are the poor invisible? Harrington (1962, 13) observes “poverty is often off
the beaten track.” The Other America thus spanned rural Appalachia, the
rented rooms and boarding houses of the elderly, and the urban ghettos of
the big cities to document the lives of millions of Americans without steady
work or subsistence.
In part because The Other America invigorated anti-poverty policy in
the 1960s, the demography of the poor has significantly changed. Between
1959 and 1998, the poverty rate among the elderly declined from 35 percent
to 10 percent in response in a response to a dramatic increase in the provi-
sion of social security benefits. Structural changes in the economy reduced
the numbers of the rural poor, as farm employment declined significantly
over the last four decades. As in the early 1960s, however, the invisibility
of today’s poor remains rooted in the physical and social distance between
whites and African Americans. Residential segregation dividing black neigh-
borhoods from white withstood legally-mandated integration and black eco-
nomic progress throughout the postwar period (Massey and Denton 1994).
Poor urban blacks are the most isolated. The most recent data from the
2000 census showed that blacks were most segregated in cities where racial
inequality in incomes was highest (Wilkes and Iceland 2004). The under-
class, the master concept for a generation of poverty researchers, pinpoints
the profound separation of poor blacks from the American mainstream. The
underclass being chronically jobless, is outside the class structure. Not just
poor, the underclass appears behaviorally deviant, mired in crime and fam-
ily disruption. The underclass is thus defined by its social remoteness—its
invisibility—as much as its deprivation. This remoteness has a physical real-
ity (the poor live separately from the middle class), and a social reality (the
everyday routines and experiences of the poor are unlike those of the middle
2

class).
The invisibility of the poor thus results not from immiseration, but in-
equality. The poor are invisible not because they are in desperate straits,
but because they are beyond the horizon of middle class social experience.
If poverty and unemployment were commonplace, as they were during the
Great Depression, middle class families would also know the anxieties and
deprivations of job loss and the dole queue. Under mass unemployment, eco-
nomic misfortune is palpable and more commonly attributed by the middle
class to the failures of society, rather than individual deficiency. Orwell, for
example, on the road to Wigan Pier in 1937 was struck not by the social
isolation and hypersegregation that marks today’s urban poverty, but by the
vast ubiquity of idleness in northern England. “Even the middle classes,”
he writes, “are beginning to realize that there is a such a thing as unem-
ployment” (Orwell 1958, 87). Sociologists of the life course see the Great
Depression as forging an entire birth cohort. Poverty in this case was forma-
tive, imprinted on the collective biography of a generation reaching midlife
after the Second World War. The generation of the Great Depression in
some ways experienced a more disorderly path through the life course. The
pressure of economic circumstances often delayed marriage but adolescence
was cut short by the necessity of finding a job (Elder 1974; Hogan 1981).
Contemporary poverty, however, is a by-product of inequality, that diverts
economic losers from the beaten track of the social mainstream.
The prison boom makes a new contribution to the invisibility of the poor
in a very profound sense. Imprisonment conceals criminal offenders by re-
moving them from the poor communities that feed the penal system. These
inmates with a shadowy status that affects a variety of official statistics that
record the economic well-being of the population. In many cases, prison and
3

jail inmates simply do not count in the government measures of economic
activity, joblessness or poverty. The invisibility of the penal population in
our official accounts underlines the depth of inequality generated by incar-
ceration. The paper aims to bring the penal population back into to our
assessment of economic trends and inequalities over the last twenty years.
As we’ll see, much of our optimism about declines in racial inequality and
the power of the U.S. model of economic growth, are misplaced once we
account for the disappearing poor, concealed behind the walls of America’s
prison and jails.
Incarceration and Official Statistics
Imprisonment renders the disadvantaged literally invisible because the penal
population is omitted from the data sources used to track economic trends.
Government statistics like poverty rates, unemployment rates, and wage lev-
els are compiled from large surveys run regularly by the Census Bureau. The
surveys draw from a large list of American households. People who live in
some kind of institution like an old age home or army barracks are excluded
from the survey. Among young men, the most common institutionalization is
incarceration in prison or jail. These prison and jail inmates, as we know, are
overwhelmingly minority men with low levels of schooling. When we count
the poor or the jobless, vast numbers of young disadvantaged men are simply
ignored because of their incarceration. While the poor are invisible in the
lives of the middle class, the penal population suffers a more fundamental
exclusion, from official accounts of the economic well-being of the population.
At one level, this is unremarkable. Employment rates, for example, are
defined only for the noninstitutional population. Prison and jail inmates fall
outside the definition, and outside the official statistics of the labor market.
4

However, statistics on employment and wages are useful because they tell us
something in general about the economic status of the population, not just
the government-defined population. The demographer Clifford Clogg (1974)
makes this observation in relation to the unemployment rate. Although offi-
cial unemployment refers just to the nonworking labor force actively seeking
work, the unemployment rate is also an important but imperfect indicator
of labor utilization—the degree to which the population is productively en-
gaged. It is relatively straightforward to measure the unemployment rate, but
a more complete measure of labor utilization would provide a more accurate
of the economic self-sufficiency and well-being of the whole population.
The penal system dramatically influences the utilization of labor. Prison
and jail inmates, mostly young able-bodied men, are not in paid employ-
ment. Beyond the reach of household surveys, prison and jail inmates have
no economic status, either productive or unproductive. How should we clas-
sify the economic status of the penal population? Some might say that prison
work programs are a type of employment. Inmates in work programs should
therefore be counted as employed. Work in prison industries, however, con-
fers none of the rights or economic independence that we associate with paid
employment. Work programs are not covered by minimum wage or indus-
trial relations laws, an inmate’s standard of living is not improved by work
in prison industries, and inmates of course are not free to quit their jobs and
search elsewhere. Thus, the Census Bureau rightly regards the incarcerated
population as not working, reserving the employment classification for those
in paid jobs on the open labor market.
If the economic status of the penal population is jobless, the penal system
produces a large reallocation of economic resources that also renders prison
and jail inmates invisible in official statistics. We can more accurately gauge
5

the economic status of the population and measure the labor allocative ef-
fect of the penal system by calculating alternative figures that include the
incarcerated population.
How much difference does it make to simply count these incarcerated men
when we assess the economic status of the population? One simple approach
to this question compares a common measure of employment—the nonin-
stitutional employment to population ratio—to an alternative figure that
includes the prison and jail inmates in the population. Following our anlay-
sis of hidden joblessnes in the penal systemt, we study how racial inequality
in wages might be influenced by incarceration through the 1980s and 1990s.
Incarceration and Hidden Joblessness
Employment in the population is usually measured by an unemployment
rate or an employment-to-population ratio. The unemployment rate is too
restrictive for studying socially marginal groups because it does not count the
long-term jobless who are discouraged from seeking work. The employment-
to-population ratio is a simpler measure counting just those with jobs as a
fraction of the population. Because my interest centers on those out of work,
I will report a jobless to population ratio—one minus the typical employ-
ment ratio. If we rely on the usual labor force surveys, the jobless consist of
the unemployed and those who are not in the labor force, including invalids,
students, and others who are not seeking work. I make two adjustments to
standard statistics based on household survey data to provide a more com-
plete account of the population. First, to measure the share of the population
who are gainfully employed, I include the military in the count of the em-
ployed population. Second, prison and jail inmates are added to the count
of those who are not employed.
6

The share of the penal population among the jobless increased with the
incarceration rate between 1980 and 2000. Figure 4.1 shows jobless rates for
white, Hispanic, and black men aged 22 to 30 at these two points in time. The
shaded portion of each bar in the figure represents the incarcerated fraction
of the jobless population. In 1980, 90,000 prison and jail inmates accounted
for only about 1 in 20 jobless young white men. By 2000, the number of
young white males behind bars had climbed to 185,000 and 1 out every 8 of
those out of work were incarcerated. In 2000, the conventional jobless rate
for young white men was 10.6 percent; it rises to but 12.0 percent once the
penal population is counted.
The contribution of incarceration to joblessness is larger for Hispanics
and blacks. In the twenty years from 1980, the number of young incarcerated
Hispanic men grew from 25,000 to 130,000. By 2000 the penal population ac-
counted for 30 percent of all joblessness among Hispanic males aged 22 to 30.
This level of incarceration adds 4 percentage points, lifting the conventional
jobless rate from 10.3 to 14.3 percent in 2000. Overall rates of employment
are lowest for African Americans, regardless of whether prison and jail in-
mates are counted among those not working. In 1980, in the noninstitutional
population alone, 22.9 percent of young black men were out of work, roughly
double the jobless rate for whites at that time. Joblessness among young
blacks rises to 26.7 percent in 1980 once prison and jail inmates are added to
the population. Betwen 1980 and 2000, the incarcerated population of young
black men increased from 110,000 to 285,000. One out of every three young
black men out of work in 2000 was in prison or jail. Household survey data
indicated that joblessness stood at 23.7 percent of young black men in 2000,
but adjusting for incarceration added nearly 10 points, lifting the true jobless
rate to 32.4 percent. Young black men were the only group to experience a
7

1980 2000 1980 2000 1980 2000
05
1015
2025
30
Jobl
ess
Rat
e (%
)
White Hispanic Black
Figure 4.1. Percent jobless among men aged 22–30 in 1980 and 2000, by race and
ethnicity. The shaded portion of each bar indicates the fraction of the incarcerated
population among the jobless.
steep increase in jobless between 1980 and 2000, and this was largely due to
the increase in the penal population.
Educational Inequality in Hidden Joblessness
The contribution of the penal system to low rates of employment among
young black men is larger if we focus just on men who have never been to
college—the dropouts and high school graduates. Figure 4.2 compares con-
ventional jobless rates based on the household survey to adjusted rates that
8
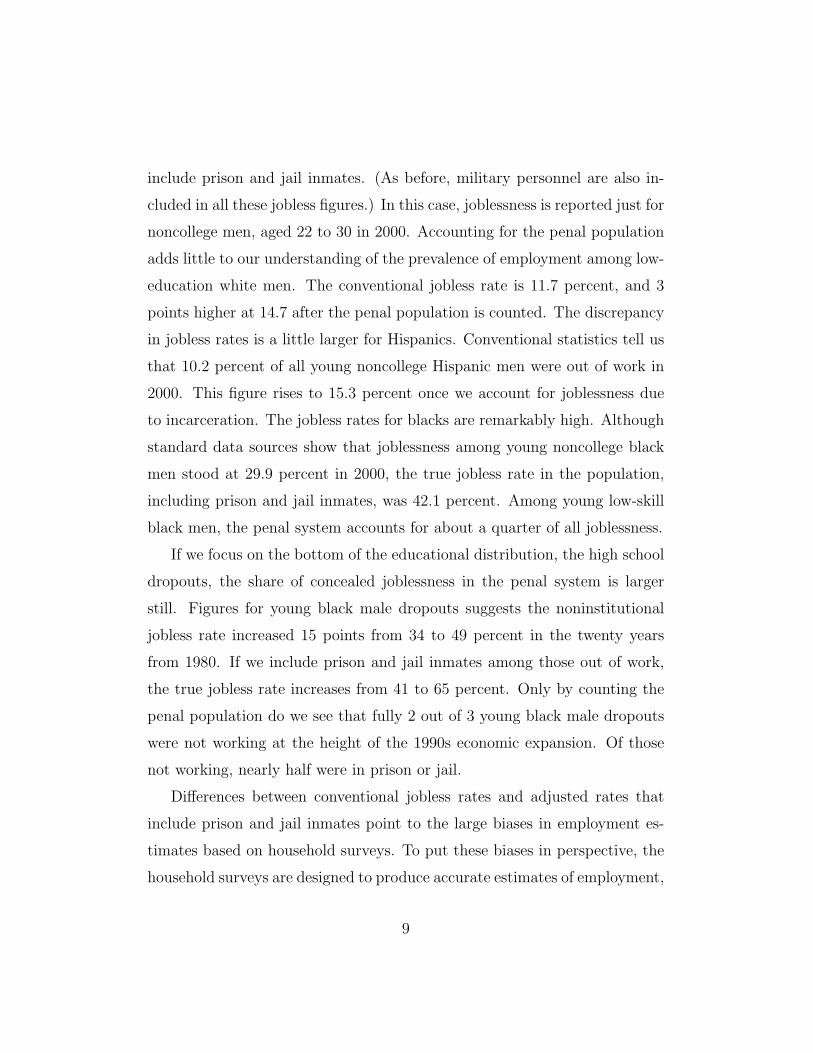
include prison and jail inmates. (As before, military personnel are also in-
cluded in all these jobless figures.) In this case, joblessness is reported just for
noncollege men, aged 22 to 30 in 2000. Accounting for the penal population
adds little to our understanding of the prevalence of employment among low-
education white men. The conventional jobless rate is 11.7 percent, and 3
points higher at 14.7 after the penal population is counted. The discrepancy
in jobless rates is a little larger for Hispanics. Conventional statistics tell us
that 10.2 percent of all young noncollege Hispanic men were out of work in
2000. This figure rises to 15.3 percent once we account for joblessness due
to incarceration. The jobless rates for blacks are remarkably high. Although
standard data sources show that joblessness among young noncollege black
men stood at 29.9 percent in 2000, the true jobless rate in the population,
including prison and jail inmates, was 42.1 percent. Among young low-skill
black men, the penal system accounts for about a quarter of all joblessness.
If we focus on the bottom of the educational distribution, the high school
dropouts, the share of concealed joblessness in the penal system is larger
still. Figures for young black male dropouts suggests the noninstitutional
jobless rate increased 15 points from 34 to 49 percent in the twenty years
from 1980. If we include prison and jail inmates among those out of work,
the true jobless rate increases from 41 to 65 percent. Only by counting the
penal population do we see that fully 2 out of 3 young black male dropouts
were not working at the height of the 1990s economic expansion. Of those
not working, nearly half were in prison or jail.
Differences between conventional jobless rates and adjusted rates that
include prison and jail inmates point to the large biases in employment es-
timates based on household surveys. To put these biases in perspective, the
household surveys are designed to produce accurate estimates of employment,
9

No Yes No Yes No Yes
010
2030
4050
Jobl
ess
Rat
e (%
)
White Hispanic BlackIncludes Prison/Jail?
Figure 4.2. Jobless rates for non-college men aged 22 to 30 by race and ethnicity,
in 2000. The unshaded bars show jobless rates based on the noninstitutional
population. The shaded bars add prison and jail inmates to the jobless count.
10

to within fractions of a percentage point. By omitting the penal population,
standard estimates underestimate the true jobless rate by as much as 25
percentage points.
These statistics tell us several things. First, standard labor force data
significantly over-estimate the prevalence of employment among young black
men, particularly those without higher education. Rates of joblessness among
young black men, already high in official statistics, are really one-fifth to
one-quarter higher given so many men in prison and jail. Second, because of
the large racial disparity in incarceration, racial inequality in employment is
significantly, understated by standard data sources.
Racial Inequality in Joblessness
Inequality can be measured with the ratio of black to white jobless rates. To
study how racial inequality coceals inequality, we focus just on the employ-
ment situation of noncollege men aged 22 to 30. Figure 4.3 shows the trend
in the black-white ratio in jobless rates for the noninstitutional population
and for the corrected rate that includes prison and jail inmates. The trend
lines slope upwards indicating that racial inequality in employment increased
significantly, both in the noninstitutional population and in the general pop-
ulation as a whole. Standard statistics suggest that the black-white ratio had
increased to around 2.5 by 2000; young black noncollege men are 2.5 times
more likely to be out of a job than their white counterparts. Including prison
and jail inmates raises the ratio to 2.9, indicating that standard data sources
understate racial inequality by about one-fifth among young men with just
a high school education.
11

Year
Bla
ck-W
hite
Job
less
Rat
io
1980 1985 1990 1995 2000
1.8
2.0
2.2
2.4
2.6
2.8
3.0
●
●
●●
●●
●●
● ●
●
●
●●
●
●
●
● ●
● ●
●
●
●
●
●●
●
●
●
●
●
●
●
●
●
●
●●
●
●
●
With Inmates
Without Inmates
Figure 4.3. Trends in the black-white ratio in jobless rates, non-college men, aged
22-30, 1980–2000. The solid line shows the ratios for jobless rates in the nonin-
stitutional population. The dashed line shows the ratio in jobless rates including
prison and jail inmates.
12

The 1990s Expansion, Revisited
Including the penal population in our estimate of the jobless rate also pro-
vides a more accurate understanding of the link between the economic status
of socially marginal men and trends in the economy as a whole. In a re-
mark that became a hypothesis for countless poverty researchers, President
Kennedy famously observed that a “rising tide lifts all boats.” A strong
economy, he suggested, would provide economic benefits to even the most
disadvantaged. For most of the postwar period until the early 1970s, this
appeared to be true. Strong economic growth was associated with increased
wages for low-skill workers with little education. The rising-tides hypothesis
appeared to break down following the recession of 1973. For the next twenty
years, through the ups and downs of the business cycle, income inequality
increased steadily and workers in the bottom wage of the income distribution
increasingly lost ground.
The rising tides hypothesis was reprised during the 1990s economic ex-
pansion. From 1992 to 2000, the United States enjoyed its longest and largest
peacetime economic expansion. The official unemployment rate dropped
from 7.5 percent in 1992 to 4.0 percent in 2000, while the economy added
about 18 million new jobs. The strong labor market was celebrated partly
because of the gains it was thought to bring to workers with the least market
power. In February of 1999, the Washington Post (February 6, A Section,
p. A1) sounded a familiar theme: “Unemployment rates among blacks and
Hispanics fell last month to the lowest levels since the federal government
began tracking them in the early 1970s, as the nation’s booming economy
created more jobs than expected, lifting many of the unemployed who have
been left behind during other good times.” The New York Times (December
13, 1998, Section 3, p. 4) similarly reported that “after nearly eight years
13

of growth, the tightest labor market in decades is having a noticeable effect
on [young black men’s] participation in the work force and on employers’
willingness to hire them.” In an otherwise buoyant assessment of the labor
market, the Times added cautiously, “The employment figures do not reflect
the growth in the percentage of young black men who are in jail or prison,
so it is unclear whether things have improved quite as much as the jobs data
show.” Indeed, the penal population was invisible in the government jobs
data, and no figures counting inmates among the jobless were published in
official statistics or by the media.
Did the surging labor market of the 1990s improve employment among
young and low-skill men? The most common barometer for the performance
of the labor market as a whole is the unemployment rate. We can study
whether the boats of young minority men were lifted by the rising tide of job
growth by comparing the overall unemployment rate of the labor force to job-
less rates for young noncollege men. Figure 4.4 plots national unemployment
rates against the noninstitutional and incarceration-adjusted jobless rates for
white, Hispanic and young black when who have not been to college. Among
young white noncollege men, the top left hand panel shows the jobless rate
among noninstitutional men. There is a clear positive relationship bteween
overall unemployment and joblessness among young low-skill whites. The
regression line indicates that a 1 point fall in overall unemployment is associ-
ated with a 1 point fall in the jobless rate for white male youth in the nonin-
stitutional population. Counting prison and jail inmates among those out of
work slightly weakens the relationship, so that a 1 point fall in unemployment
accompanies .7 percentage point fall in the jobless rate for young noncollege
whites. Employment rates among young Hispanics are more tightly linked
to overall unemployment. The strong positive relationship betwen overall
14

unemployment and joblessness among young Hispanic men. Regardless of
how joblessness is measured among, falling unemployment rates in the late
1990s is associated with increasing employment noncollege Hispanics in their
twenties.
The connection between overall unemployment rates and jobless rates for
young black low-skill men is very weak, however (Figure 4.4). If we look just
at noninstitutional men, the trend line slopes upwards indicating that a 1
point fall in unemployment has been associated with .8 percentage point fall
in the jobles rate among young black men without college education. If prison
and jail inmates are counted in our assessment of the jobless rate, the trend
line slopes downwads indicating that the economic prospects of young black
men largely became detached from the path of the labor market as a whole.
Joblessness significiantly increased among young noncollege black men at the
end of the 1990s when economic conditions were generally improving for the
rest of the population.
In sum, prison and jail inmates are invisible in the official labor statis-
tics that describe the economic well-being of the population. Once we add
the penal population to our count of the jobless, the prevalence of employ-
ment can be seen to be dramtically overestimated among young low-skill
black men. More than this, ignoring the penal population also causes us to
undersestimate the rise in racial inequality in employment. By 2000 young
whites were with just a high school education were about three times as likely
to be holding a job as their black counterparts. Finally, linking trends in
incarceration-adjusted joblessness to the national unemployment rate shows
that the economic fortunes of men whose incarceration risks were highest
became completely detached from trends in the labor market as a whole. As
the unemployment rate sank to historically low postwar levels in the late
15

0
0
Whites
Hispanics
Blacks
● ●
●●
●●●
●●
● ●
●●●
●●
●●●●●
Total Unemployment (%)
Jobl
ess
(%)
4 5 6 7 8 9
510
1520
25 J= 6 + 1.0 U
● ●
●●
●●●
●●● ●
●●●
●●
●●●●●
Total Unemployment (%)
Adj
uste
d Jo
bles
s (%
)
4 5 6 7 8 9
510
1520
25 J= 10.2 + 0.6 U
●
●
●●
●●●
●
●●
●
●
●●
●●
●●●
●
●
Total Unemployment (%)
Jobl
ess
(%)
4 5 6 7 8 9
510
1520
25 J= 5.1 + 1.6 U
●
●
●●
●●●
●●●●
●
●●
●●
●●●
●
●
Total Unemployment (%)
Adj
uste
d Jo
bles
s (%
)
4 5 6 7 8 9
510
1520
25 J= 11.6 + 1.2 U
●
●
●●
●
●●
●●
●
● ●
●●●
●●
●●
●
●
Total Unemployment (%)
Jobl
ess
(%)
4 5 6 7 8 9
2025
3035
40
J= 22.7 + 0.6 U
●
●
●●
●
●●
●●●
●●
●●
●●
●●●●
●
Total Unemployment (%)
Adj
uste
d Jo
bles
s (%
)
4 5 6 7 8 9
2025
3035
40
J= 40.3 -.6 U
Figure 4.4. Total unemployment rates by noninstitutional (left hand panels) and
incarceration-adjusted (right-hand panels) jobless rates for non-college men aged
22 to 30, 1980–2000. Regression lines indicate the trend. (All jobless rates count
military personnel as employed.) 16

1990s, jobless rates among noncollege black men in their twenties rose to
the their highest levels ever. This increase in joblessness was propelled by
historically high incarceration rates.
Incarceration and the Racial Gap in Wages
Although the penal system has concealed significant joblessness among young
low-education black men, employment figures provide just one indicator of
economic status. We can also consider how income and wage trends are
affected by the hidden disadvantage produced by high incarceration rates. All
things being equal, wage and employment rates should move together. When
the economy is expanding, demand for labor will be strong and employers
will compete for workers, driving up wages and the level of employment.
However, the risk of joblessness is not distributed evenly across the labor
market. Employment among low-skill men lagged behind the rest of the
labor force. If low-skill men, who are likely to earn low wages, drop out of
the workforce, the average level of wages may actually increase. Low-wage
workers who drop out no longer form part of the wage distribution, and
the average wage rises because the bottom end of the wage distribution is
erased through joblessness. In this case, the rise in average wages is not
due to any real improvement in the economic situation of wages earners; it
is just an artifact of declining employment at the bottom. Labor market
researchers call this a “selection effect.” If those selected for employment are
a nonrandom sample of all workers, the average wage will no longer reflect
the typical economic status of all workers.
The selection analysis helps us understand the puzzle of declining em-
ployment among black men through the 1960s, a period when wages were
growing strongly. Many researchers attributed the rapid growth in wages of
17

black men relative to whites to the passage of the Civil Rights Act and other
measures that reduced racial discrimination in the labor market. Butler and
Heckman (1977) observed that income-transfer benefits increased at the same
time as passage of the Civil Rights Act. Increased welfare benefits, they ar-
gued, drew low-wage men out of the labor force. Increased average earnings
of blacks relative to whites was due to declining employment among low-pay
black workers rather than an upward shift in the income distribution.
Other have researchers wondered if earnings is a good measure of black
economic progress given low employment rates among black workers. Welch
(1990, S42) asks if the “improvement in black/white wage ratios is an illu-
sion.” Jaynes (1990) observes that “the most important problem” for re-
search on race relations “is to explain why, if the market’s relative valuation
of black labor has increased, black employment has been declining.” These
comments reflect a suspicion that increased wages is an artifact of declining
employment. If low earners are discouraged from seeking work or if they
are in prison, average incomes will increase, not because pay is going up but
because those at the bottom have dropped out of the workforce (Heckman
1989). Under these conditions, deepening economic disadvantage may be
misinterpreted as economic progress.
The sample selection analysis has contemporary relevance in the context
of the prison boom. Just as mass incarceration removes prison and jail
inmates from official employment statistics, it also removes them from the
wage distribution. This selection analysis puts wage trends of the 1980s and
1990s in a new light. From the mid-1980s to the late 1990s, the black-white
gap in wages was shrinking among young men (Figure 4.6). In 1985, average
hourly wage of white men in their twenties exceeded for young black men by
about 26 percent. By the end of the 1990s, racial inequality in hourly wages
18

05
1015
Ave
rage
Hou
rly W
age
1980 1985 1990 1995 1999
Whi
te-B
lack
Rat
io
1.18
1.22
1.26
1.30
WhiteBlack
Figure 4.5. Average hourly wages of black and white male workers, aged 22 to 30,
1980–1999. (Wages are in 2003 dollars.)
had declined to 21 percent. We know, however, that joblessness among black
men is steadily increasing during this period, in large part because of the
steep increase in the incarceration rate. Is the decline in wage inequality the
product of a real improvement in the labor market situation of young black
workers, or is it simply an artifact of escalating rates of imprisonment and
other joblessness?
To assess the effect of sample selection on racial inequality in wages, we
predict wages for nonworkers and reconstruct the wage distribution including
these predicted wages. These predicted wages can be interpreted as the wage
offers that nonworkers would have received had they been in the labor force.
19

More generally, we can understand this exercise as an effort to monetize the
economic status of marginal segments population who are typically ignored
in studies of economic inequality.
Earlier research focused on trends from the 1960s through the 1980s. To
study wage inequality through the 1990s, we analyze data from the Current
Population Survey and correctional surveys of inmates. Our estimates of
inequality are based on hourly wages, although we found similar results for
weekly earnings. The analysis is restricted to non-Hispanic, nonfarm, civilian
men aged 22 to 30. Like previous research, we predict the wages of the jobless
given age and education (Blau and Beller 1992; Chandra 2003) that capture
the main human capital differences in wages.
The jobless in our data fall into two categories. First, there are the
nonworkers. These are men who are unemployed and looking for work, and
those not in the labor force who are not actively seeking employment. To
impute the wages of these men, we simply match them to the wages of workers
according to age and education. The wages offers that nonworkers are likely
to receive will be lower than the wages we observe among workers. A more
realistic estimate of the hypothetical wage level of nonworkers takes just a
fraction of the observed wage among workers. Other research suggests that
nonworkers will earn about 60 percent as much as full-time full-year workers,
so we multiply wages by .6 (Blau and Beller 1992, Juhn 1997, and Chandra
2003 make similar adjustments).
Second, there are prison and jail inmates. The hypothetical wage offers
of incarcerated men are likely to be much lower than those for nonworkers.
Fortunately, data are available that provides the wage level of prison and
jail inmates prior to incarceration. Correctional surveys of inmates, fielded
periodically by the Bureau of Justice Statistics, ask respondents about their
20
05
1015
Hou
rly W
age
EmployedIncarcerated
HS Dropout High School Some College HS Dropout High School Some CollegeHS Dropout High School Some College
Whites Blacks
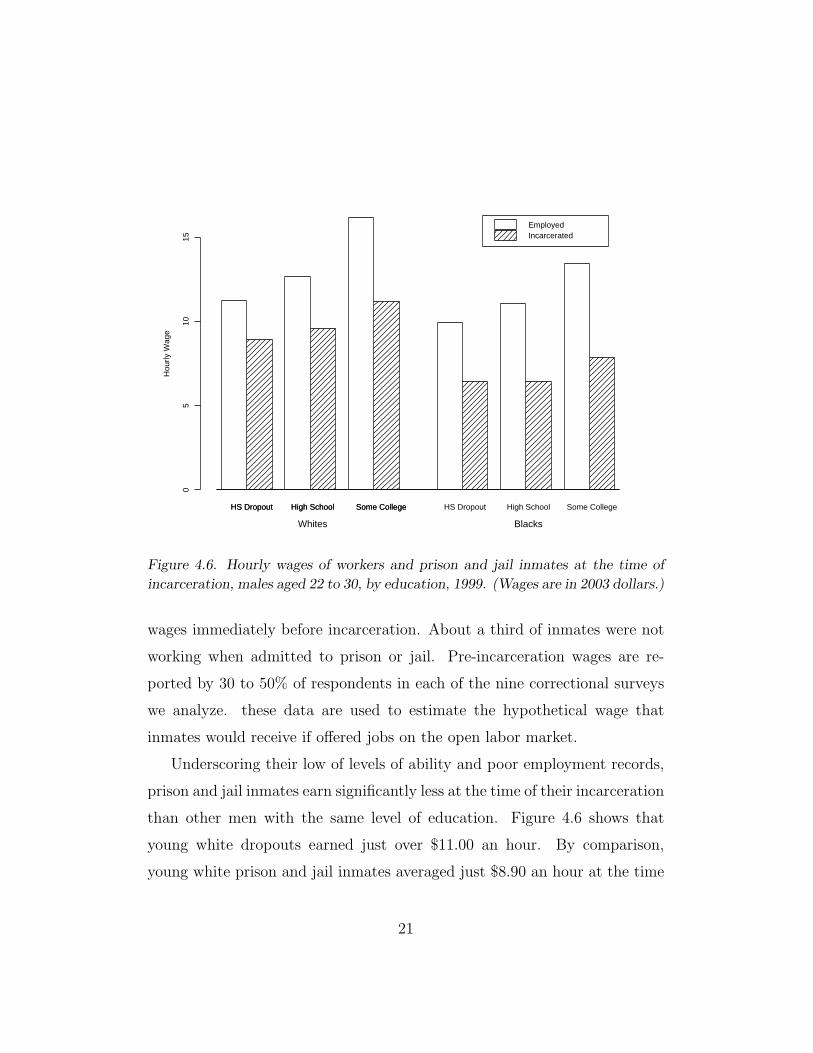
Figure 4.6. Hourly wages of workers and prison and jail inmates at the time of
incarceration, males aged 22 to 30, by education, 1999. (Wages are in 2003 dollars.)
wages immediately before incarceration. About a third of inmates were not
working when admitted to prison or jail. Pre-incarceration wages are re-
ported by 30 to 50% of respondents in each of the nine correctional surveys
we analyze. these data are used to estimate the hypothetical wage that
inmates would receive if offered jobs on the open labor market.
Underscoring their low of levels of ability and poor employment records,
prison and jail inmates earn significantly less at the time of their incarceration
than other men with the same level of education. Figure 4.6 shows that
young white dropouts earned just over $11.00 an hour. By comparison,
young white prison and jail inmates averaged just $8.90 an hour at the time
21

Whi
te-B
lack
Wag
e G
ap
1980 1985 1990 1995
0.15
0.20
0.25
0.30
0.35
0.40
●
●
●
●
Observed Wage Gap
Adjusted for Nonworkers
Adjusted for Incarceration
●
●
●
●●
●
●
●
Figure 4.7. The observed white-black hourly wage ratio and wage ratios adjusted
for nonworkers and incarceration, men aged 22 to 30, 1980–1999. (The wage ratio
is measured by the differences in mean log hourly wges.)
of their incarceration. the wage gap grows with education. Young whites
with some college eanred more than $16.00 an hourin 1999, while those in
prison or jail earned just $11.18. There is also a large wage gap between
workers and inmates, among African Americans. earnings gathe earnings
gap between prison and jail inmates and non-inmates is also large among
African Americans. Despite the relatively low earnings of black workers,
their wages exceed those of inmates by about 70 percent.
Figure 4.7 shows three different measures of racial inequality in young
men’s wages. The lower line shows shows just the observed level of wage
22

inequality calculated from the usual household survey. In 1980, the hourly
wage of young white men exceed that for black men by 17 percent. Racial
inequality in hourly wages increased through the early 1980s, and peaked in
1985. In this year, whites earned about 25 percent more than blacks. Over
the next 15 years, however, wage inequality steadily declined. By 1990, racial
inequality in wages had fallend to about 14 percent. At the the height of
the 1990s economic expansion, in 1999, the hourly wages of young white men
exceeded that for young black by just 16 percent. Between 1985 and 1999, the
white-black ratio in wages had declined by by 9 percentage points, or more
than a third of the observed wage ratio. Was this gain in gain in relative
wages among young black men a real relative improvement in the income of
young black men, or was it just an artifact of declining employment fueled
by the growth in imprisonment?
The upper time series in Figure 4.7 begins to answer this questions by
showing estimates of the level of wage inequality we would observe if first
nonworkers and then prison and jail inmates were fully employed. If we
take account just of the unemployed and those who are not in the labor
force, our estimates indicate that the young white men would earn about 26
percent more than young black, 9 percentage points higher than than the
observed difference in wages. Over the next five years, this adjusted level
of wage inequality grew even more sharply than the observed level of wage
inequality. In 1985, whites are estimated to enjoy hourly wages 35 percent
higher than those of blacks. Although the adjusted wage gap between blacks
and whites is estiamted to decline from the mid 1980s to the end of the
1990s, the equalization in adjusted wage is smaller than the equalization in
equalization in actual wages.
Finally, the top series in Figure 4.7 reports the level of white-black wage
23
inequality adjusting for nonworkers and prison and jail inmates. What would
trends in wage inequality look like if nonworkers were fully employed, and
those incarcerated also held jobs in the open labor market. Because of their
low levels of education and their very low level of earnings, prison and jail
inmates add further to the race gap in wages. Reflecting the very large
number of poor men incarcerated, wage inequality among young men would
have been about 50 percent higher (37 compared to 25 percent) if the entire
population were fully employed. What’s more, the decline in inequality since
1985 would have been very modest, if not for increasing joblessness due to
incarceration through the 1990s. After adjusting for nonworkers and prison
and jail inmates, racial inequality in wages is estimated to fall just 5 percent
(from 37 to 35 percent), instead of the observed decline of 36 percent. By
1999, the observed ratio of white to black hourly wages understated the
relative economic status of young black men by about 45 percent because
such a large number of low-skill black men were out of work or in prison
or jail. The decline in the adjusted wage ratio between 1985 and 1999 was
one-quarter as large as the decline in observed wages.
In sum, this analysis shows that racial gap in wages provides a poor in-
dicator of the relative economic status of young black men. Because of their
high rates of unemployment and incarceration the economic disadvantage of
black men is largely hidden from sstandard statistics on the wage gap. If
we account for the large numbers of low-education men out of work or in
jail, racial inequality in 1999 would have been about twice as high as its
observed level. Adjusting for racial disparities in joblessness and incarcera-
tion also suggests that young black men have experienced virtually no real
economic gains on young whites in the 15 years from 1999. Indeed, around
three-quarters of the apparent gains in relative wage is due not to a real
24

improvement in the economic situation of African Americans, but to the
escalating rates of imprisonment and idleness.
Economic Progress Among Black Youth in the 1990s
There is strong evidence for large inequalities in wages and employment
among young black men through the 1980s and 1990s. These statistics,
as bad as they are, overstate the economic status of young black men and
underestimate racial inequality. Standard labor force statistics provide an
optimistic picture of the status of young black men because so many poor
young black men are institutionalized, and thus outside the scope of labor
market accounts.
The effects of the prison boom on concealed inequality are especially
important as we interpret economic trends through the 1990s. From 1992 to
2000, the United States enjoyed its longest and largest peacetime economic
expansion. The unemployment rate dropped from 7.5 percent in 1992 to 4.0
percent in 2000, while the economy added about 18 million new jobs. These
effects were widely celebrated not least because of the beneficial effects at
the margins of the labor market, among low-skill workers. Strong economic
growth and low unemployment, it seemed, could significantly improve living
standards for the most disadvantaged in society.
Incorporating prison and jail inmates in assessments of economic trends
and estimates of racial inequality suggest that the 1990s expansion did little
to improve the situation of economically marginal black men. Jobless in-
creased through the late 1990s when job growth was strongest, and blacks
employment rates significantly fell behind those of whites. Racial inequality
in wages declined from the mid 1980s to the late 1990s, but we estimate that
two-thirds of this increase was due to attrition from the labor force largely
25

caused by rising incarceration rates.
The performance of the U.S. labor market at the end of the 1990s moved
to the center of economic policy debates both in the United States and West-
ern Europe. By standard accounts, the labor markets of Western Europe were
performing poorly compared to the American. France, Italy, and Germany
had all experienced very high levels of unemployment throughout the 1990s.
High rates of official unemployment accompanied a high level of long-term
unemployment, stagnant job growth, a high rate of disability, and signifi-
cant youth unemployment. The booming labor market in the United States,
by contrast, created large numbers of new jobs, drove unemployment to full
employment levels, and, it seemed, provided significant economic benefits to
economically vulnerable groups—minorities, and low-education workers.
Researchers pointed to institutional differences to explain why the United
States was doing so well, and why Europe was doing so poorly. Institutional
analysis of labor markets focused on the effects of social policy and indus-
trial relations (Crouch 1985; Colbjørnsen and Kalleberg 1988; Korpi 1990;
Kolberg and Esping-Andersen 1990; Hicks 1994; Janoski, McGill and Tinsley
1997). For this research, the United States provided a model of market dereg-
ulation. U.S. unions were weak and the welfare state affected only those at
the fringes of the job market. Contrast Europe where employment relations
are highly regulated. Unions set wages for entire economies, and welfare
states significantly influence the supply and demand for labor.
These trends suggest unregulated labor markets yield strong employment
performance. Of all the labor markets of the advanced economies, the United
States best approximates the competitive model of neoclassical theory. In
this model, job seeking is intensified by meager state support for the un-
employed and low unionization allows wages to adjust to market conditions.
26

In Europe institutions introduce inefficiency: large welfare states and strong
unions stifle labor demand and reduce work incentives (Olson 1982; Lindbeck
1985; Giersch 1993; OECD 1994a). In short, the unregulated labor market of
the United States produced low rates of jobless, while the expansive welfare
states and labor unions of Western Europe created large-scale idelness and
sluggish economic performance.
We challenged this analysis by arguing that labor markets are embedded
in a wide array of social arrangements that extend beyond the welfare state
or industrial relations. In the United States, criminal justice policy provides
a significant state intervention with profound effects on employment trends.
The magnitude of state intervention is reflected in budget and incarceration
figures. In the early 1990s, $91 billion was spent on courts, police, and
prisons, dwarfing the $41 billion spent on all unemployment benefits and
employment related services (Statistical Abstract of the United States 1995,
table 585). By 1996, 1.63 million people were being detained in American
prisons and jails—a threefold increase from 1980 (Gilliard and Beck 1997,
1). These figures suggest that incarceration generated a sizeable, nonmarket,
reallocation of labor overshadowing state intervention through social policy.
More generally, this analysis treats the penal system as a labor market in-
stitution and provides evidence that the prison boom has generated substan-
tial hidden inequality. By institutionalizing large numbers of low-education
and African American men through the 1990s, official employment and wage
statistics for those at the margins of the labor market were artifically opti-
mistic. It was widely claimed that the 1990s economic expansion produced
real economic gains for even the most disadvantaged. We can see that this
27

claim does not apply to young non-college black men, once we take account
of the economic disadvantage concealed in the America’s prison and jails. We
can think of the penal system’s conceled inequality as the short-run effect of
incarceration, the immediate consequence of institutionalizing large number
of working age men. Of course, nearly all those men are released from in-
carceration, and many negotiate the obstacles to job seeking as ex-offenders.
This long-run effect of incarceration on the economic opportunities of men
who have been released from incarceration, is the topic we turn to next.
28
Appendix. Data Sources
Labor force data Counts for employment and the noninstitutional pop-
ulation, and the earnings regressions used for the impuation of wages were
estimated using annual labor force data from the Merged Outgoing Rotation
Group files of the Current Population Survey (NBER 2001).
Survey correctional data Counts of the prison and jail population, and
pre-incarceration wages, and characteristics of the penal population were
estimated using data from the Survey of Inmates of Federal Correctional Fa-
cilities (1991), the Survey of Jail Inmates (1978), the Survey of Inmates of
Local Jails (1983, 1989, 1996), the Survey of Inmates of State Correctional
Facilities (1979, 1986, 1991), and the survey of State and Federal Correc-
tional Facilities (1997) (Bureau of Justice Statistics, October 1994, February
1997a, February 1997b, June 1997, May 1994, October 1993, February 1997c,
1999, 2000). Inter-survey years were interpolated.
Administrative correctional data Unpublished annual counts of prison
and jail populations for blacks and whites were supplied by the Bureau of
Justice Statistics. Jail figures are the estimated overnight count for June 30
each year. The prison population is the count at year’s end.
29

References
Blau, Francine D. and Andrea H. Beller. 1992. “Black-White Earnings
Over the 1970s and 1980s: Gender Differences in Trends.” Review of
Economics and Statistics 74:276–86.
Butler, Richard and James Heckman. 1979. “The Government’s Impact on
the Labor Market Status of Black Americans: A Critical Review.” Pp.
235–81 in Equal Rights and Industrial Relations, edited by Farrell E.
Bloch et al. Madison, MI: Industrial Relations Research Association.
Chandra, Amitabh. 2003. “Is the convergence in hte Racial Wage Gap Illu-
sory.” NBER Working paper 9476. Cambridge, MA: National Bureau
of Economic Research.
Clogg, Clifford C. 1974. Measuring Underemployment: Demographic Indica-
tors for the United States. New York: Academic Press.
Colbjørnsen, Tom and Arne L. Kalleberg. 1988. “Spillover, Standardization,
and Stratification: Earnings Determination in the United States and
Norway.” European Sociological Review 4:20–31.
Crouch, Colin. 1985. “Conditions for Trade Union Wage Restraint.” Pp. 105–
139 in The Politics of Inflation and Economic Stagnation: Theoretical
Approaches and International Case Studies, edited by Leon Lindberg
and Charles Maier. Washington, DC: Brookings.
Giersch, Herbert. 1993. Openness for Prosperity: Essays in World Eco-
nomics. Cambridge, MA: MIT.
30

Gilliard, Darrell K. and Allen J. Beck. 1997. “Prison and Jail Inmates at
Midyear 1996.” Bureau of Justice Statistics Bulletin.
Harrington, Michael. 1962. The Other America: Poverty in the United
States. New York: Macmillan.
Heckman, James. 1989. “The Impact of Government on the Economic Status
of African Americans.” Pp. 50–80 in The Question of Discrimination,
edited by Steven Shulman, William Darity, and Robert Higgs. Middle-
town, CT: Wesleyan University Press.
Hicks, Alexander M. 1994. “The Social Democratic Corporatist Model of
Economic Performance in the Short- and Medium-run Perspective.”
Pp. 189–217 in The Comparative Political Economy of the Welfare
State, edited by Thomas Janoski and Alexander Hicks. New York:
Cambridge University Press.
Janoski, Thomas, Christa McGill, and Vanessa Tinsley. 1997. “Making Insti-
tutions Dynamic in Cross-National Research: Time-Space Distancing
in Explaining Unemployment.” Comparative Social Research 16:227–
68.
Jaynes, Gerald D. 1990. “The Labor Market Status of Black Americans:
1939–1985.” Journal of Economic Perspectives 4:9–24.
Juhn, Chinhui. 1997. “Labor Market Dropouts, Selection Bias, and Trends
in Black and White Male Wages.” Paper presented at the annual meet-
ings of the American Economic Association, January 1997.
Kolberg, Jon Eivind and Gøsta Esping-Andersen. 1990. “Welfare States and
31

Employment Regimes.” International Journal of Sociology Fall:3–36.
Korpi, Walter. 1990. “Political and Economic Explanations for Unemploy-
ment: A Cross-National and Long-Term Analysis.” British Journal of
Political Science 21:315–248.
Lindbeck, Assar. 1985. “What is Wrong with the West European Economies?”
World Economy 8:153–170.
Massey, Douglas and Nancy Denton. 1994. American Apartheid. Chicago:
University of Chicago Press.
Newman, Katherine S. 1999. No Shame in My Game: The Working Poor in
the Inner City. New York: Knopf and the Russell Sage Foundation.
OECD. 1994a. The OECD Jobs Study: Part II – The Adjustment Potential
of the Labor Market. Paris: OECD.
Olson, Mancur. 1982. The Rise and Decline of Nations: Economic Growth,
Stagflation, and Social Rigidities. New Haven, CT: Yale University
Press.
Orwell, George. 1958. The Road to Wigan Pier. New York: Harcourt.
Shipler, David. 2004. The Working Poor: Invisible in America. New York:
Knopf.
Statistical Abstract of the United States. 1995. Washington, DC: G.P.O.
Welch, Finnis. 1990. “The Employment of Black Men.” Journal of Labor
Economics 8:S26–S74.
32

Wilkes, Rima and John Iceland. 2004. “Hypersegregation in the Twenty-
First Century.” Demography 41:23–26.
33