Embed Size (px)
Citation preview

HAL Id: hal-00304706https://hal.archives-ouvertes.fr/hal-00304706
Submitted on 1 Jan 2002
HAL is a multi-disciplinary open accessarchive for the deposit and dissemination of sci-entific research documents, whether they are pub-lished or not. The documents may come fromteaching and research institutions in France orabroad, or from public or private research centers.
L’archive ouverte pluridisciplinaire HAL, estdestinée au dépôt et à la diffusion de documentsscientifiques de niveau recherche, publiés ou non,émanant des établissements d’enseignement et derecherche français ou étrangers, des laboratoirespublics ou privés.
INCA Modelling of the Lee System: strategies for thereduction of nitrogen loads
N. J. Flynn, T. Paddison, P. G. Whitehead
To cite this version:N. J. Flynn, T. Paddison, P. G. Whitehead. INCA Modelling of the Lee System: strategies for thereduction of nitrogen loads. Hydrology and Earth System Sciences Discussions, European GeosciencesUnion, 2002, 6 (3), pp.467-484. �hal-00304706�

INCA Modelling of the Lee System: strategies for the reduction of nitrogen loads
467
Hydrology and Earth System Sciences, 6(3), 467–483 (2002) © EGS
INCA Modelling of the Lee System: strategies for the reduction ofnitrogen loadsN.J. Flynn, T. Paddison and P.G. Whitehead
Aquatic Environments Research Centre, Department of Geography, University of Reading, Reading, RG6 6AB, UK
Email for corresponding author. [email protected]
AbstractThe Integrated Nitrogen Catchment model (INCA) was applied successfully to simulate nitrogen concentrations in the River Lee, a northerntributary of the River Thames for 1995-1999. Leaching from urban and agricultural areas was found to control nitrogen dynamics in reachesunaffected by effluent discharges and abstractions; the occurrence of minimal flows resulted in an upward trend in nitrate concentration.Sewage treatment works (STW) discharging into the River Lee raised nitrate concentrations substantially, a problem which was compoundedby abstractions in the Lower Lee. The average concentration of nitrate (NO3) for the simulation period 1995-96 was 7.87 mg N l-1. Ammonium(NH4) concentrations were simulated less successfully. However, concentrations of ammonium rarely rose to levels which would be ofenvironmental concern. Scenarios were run through INCA to assess strategies for the reduction of nitrate concentrations in the catchment.The conversion of arable land to ungrazed vegetation or to woodland would reduce nitrate concentrations substantially, whilst inclusion ofriparian buffer strips would be unsuccessful in reducing nitrate loading. A 50% reduction in nitrate loading from Luton STW would result ina fall of up to 5 mg N l-1 in the reach directly affected (concentrations fell from maxima of 13 to 8 mg N l-1, nearly a 40 % reduction), whilsta 20% reduction in abstractions would reduce maximum peaks in concentration in the lower Lee by up to 4 mg l-1 (from 17 to 13 mg N l-1,nearly a 25 % reduction),.
Keywords: modelling, water quality, nitrogen, nitrate, ammonium, INCA, River Lee, River Thames, land-use.
IntroductionRising concentrations of nitrogen (N) in UK aquaticenvironments is due primarily to human activities from threemajor inputs, namely atmospheric pollution, urban pollutionand agricultural sources. In terms of atmospheric pollution,the average deposition of N in the UK is approximately 17kg ha–1yr–1. Regional differences in the spatial distributionof N deposition in the UK are clear and generally uplandareas with high rainfall are associated with the highestdeposition of N (NEGTAP, 2001). However, N depositionin parts of south-east England has been estimated to be asmuch as 30 kg ha–1yr–1 and, if the average runoff in this partof the country is 300 mm yr–1 and nitrogen inputs from theatmosphere are balanced by leaching, drainage waters mayhave a resultant nitrate-N concentration of 10 mg N l–1 dueto atmospheric inputs alone. Clearly, atmospheric inputs ofnitrogen are significant, and this mobility implies that theproblem is regional. Skeffington (2002) reviews N controlstrategies for atmospheric pollution in some detail.
Urban areas are associated with effluent discharges fromindustry and sewage treatment works (STWs), and arecategorised as point source pollution. Of the 70 000consented discharges into UK freshwaters, upwards of 80%are for STWs (EA, 2001c). Sewage is high in N content,and, untreated, can contain approximately 50 mg N l–1.However, with secondary treatment this may be reduced toapproximately 20 mg N l–1. Consented effluent dischargesfrom industry are generally low in N content (Heathwaite,1993). Although urban areas are associated mostly withpoint source pollution, they may also contribute N in diffusepollution through surface runoff, the quantity of which variesaccording to the annual precipitation and the proportion ofimpermeable surfaces in the urban catchment (Heathwaite,1993).
Agricultural land is the major source of diffuse N loadinginto freshwater systems (Whitehead, 1990) (Fig. 1). Diffusepollution has become a major issue only in the last 50–60years due to intensification of agricultural practices. The

N.J. Flynn, T. Paddison and P.G. Whitehead
468
second half of the twentieth century saw heavy subsidiesfor farming and the extensive use of inorganic fertiliserswhich, while vastly increasing food production, put anunsustainable strain on the environment (Johnes et al., 1996).For economic reasons, it is often the case that the bestfarming practices (in environmental terms) are not used. Inaddition to the increased use of fertilisers for cropproduction, artificial feeds allowed large increases inlivestock numbers. Numbers of sheep and poultry doubledand pig numbers trebled during 1950–1980 (Heathwaite,1993) which has increased the quantity of urea and manuredeposited and thus N loads on the land. Some significantagricultural point sources also exist, such as manure andsilage heaps and intensive animal rearing units.
In a pristine river, the average concentration of nitrogen(N) will be minimal (nitrate ~0.1 mg N l–1; ammonium~0.015 mg N l–1). However, Global EnvironmentalMonitoring System’s (GEMS) stations show that Europeanrivers have been polluted to such an extent that a nitrateconcentration of 4.5 mg N l–1 is the norm, while 10% ofrivers lie within a range of 9–25 mg N l–1. This comparesunfavourably with the maximum acceptable concentration(MAC) of 11.3 mg nitrate-N l–1 allowed for waterabstractions by the European Community (Heathwaite etal., 1993). Furthermore, although N is essential for plantgrowth, additions of N into aquatic systems can createsignificant environmental problems.
The modelling of N in freshwater systems and theircatchments is particularly worthwhile in catchments whereproblems exist or may arise. Of the many models designedto simulate various aspects of N dynamics in theenvironment, few meet a need to track N inputs through the
catchment to the river or to address the spatial heterogeneityof the catchment (Whitehead et al., 1998; Wade et al., 2002).The development of INCA – Integrated Nitrogen Catchmentmodel, has gone some way to satisfying such a need, andhas been applied here to the River Lee, a northern tributaryof the River Thames.
The River Lee supplies one sixth of London’s drinkingwater requirements, and provides a treasured recreationalresource for the capital in the form of the Lee ValleyRegional Park. The River Lee safeguards important aquatichabitats, including several Sites of Special Scientific Interest(SSSI) (Reid, 1995; EA, 2001a, b), but has a history of poorwater quality. Local Environment Agency Plans (LEAP)for both the Upper and Lower Lee express concern over Nloading (the River Lee was designated as a EutrophicSensitive Area in 1998). Diffuse pollutions from both urbanrunoff and agricultural land are identified as significantsources, while effluent discharges from STWs at times oflow flow in summer are also a problem (EA, 2001a, b).
In this paper, the INCA model has been used to examinethe N dynamics in the River Lee to improve understandingof the sources of N in the Lee catchment, and of the spatialand temporal variations in nitrate and ammonium along itslength. In addition, INCA has investigated strategies of landuse and management practices for managing N in thiscatchment.
The River Lee catchmentThe River Lee, 85.2 km from its source in Luton to itsconfluence with the Thames in London, drains a catchmentarea of 1420 km2 (Fig. 2) (EA, 1997), has been used as a
Fig. 1. Sources and transport pathways of diffuse N pollution in agricutlural catchments (adapted from Prior, 1998)

INCA Modelling of the Lee System: strategies for the reduction of nitrogen loads
469
Fig. 2. River Lee atachment area (source Environment Agency, 1997)
navigable river for over 900 years and has undergone manyengineering works in that time (RUST, 1995). The LowerLee is now a complicated system which consists of the LeeNavigation, a Flood Relief Channel, several small tributaries,wetlands and reservoirs. Underlying the Cretaceouscatchment area is a Chalk aquifer which outcrops in theChiltern Hills in the north-western extremity of thecatchment. The Chalk in the south of the catchment isoverlain by Tertiary sands and London clay and is up to70 m deep in places; it has been a significant source ofLondon’s water supply for many centuries (Flavin andJoseph, 1983; Halcrow Water, 1995; O’Shea and Sage,1999).
Industrial and residential developments along the RiverLee’s course are abundant, and over 2 million people livein the catchment area (EA, 1997, 2001b). Those areas ofthe catchment that are not urbanised are generally utilisedfor intensive agriculture. Consequently, the River Lee sufferspollution from both point sources (i.e. effluent discharges),and diffuse sources (i.e. agricultural land and urban runoff)(Halcrow Water, 1999; EA, 2001a, b). The sizeablepopulace and the catchment’s proximity to London meansthat the River Lee is a valuable water resource; however,demand can be such that water abstraction from surface andgroundwater sources can cause variable flows resulting inadditional environmental problems (EA, 2001a). Sections

N.J. Flynn, T. Paddison and P.G. Whitehead
470
of the River Lee are valuable conservation areas, withseveral sites having the status of Site of Special ScientificInterest (SSSI).
The INCA modelModelling N in the environment is essential to assess howchanges in atmospheric deposition, land use, landmanagement and climate will affect N dynamics. Manymodels consider various aspects of N in the environment.Physically based models such as QUASAR (Whitehead etal., 1997; Whitehead and Williams, 1984) representphysical, chemical and biological transformations of N andare generally applied to river systems. On the other hand,empirical models (e.g. export coefficient model; Johnes,1996) use statistical correspondence or simple coefficientsto simulate N loading into aquatic systems. However, whilethe empirical approaches may be successful in estimatingannual and seasonal N loads, they are not process-basedand are therefore unable to predict daily variations in riverN concentrations.
INCA, a processed based model, integrates catchment andriver processes by tracking N inputs through the catchmentsoils to the river; it is semi-distributed and, thus, takes someaccount of spatial variations in land use, vegetation andhydrology. INCA is also dynamic and so allows dailyvariations in flow, N fluxes and N concentrations to beexamined (Whitehead et al., 1998; Collins et al., 1999; Wadeet al., 2002).
The INCA model incorporates several different modelcomponents to simulate the N dynamics of catchment andriver:
Nitrogen Input Model: Calculates the total N inputs fromall sources (e.g. atmosphere and fertilisers) to each sub-catchment; these are then scaled according to the landuse. The separation of N forms and sources allows theeffects of changing inputs to be assessed.
Hydrological Model:uses hydrologically effective rainfall (HER) to drivethe water transfers and N fluxes through the catchmentsystem;simulates the effect of changes in land use on flow usinga simple two box reservoir approach - the reactive soilzone and groundwater zone (see page 303);calculates the mass balance of flow through multiplereaches by which the river system is divided.
Catchment Nitrogen Process Model: Simulates thetransformations of N in soil and groundwater by
modelling plant uptake, nitrification, denitrification,mineralisation and immobilisation in sub-catchmentsusing parameter sets which are derived for each landclass. This part of the model is driven by the outputfrom the Nitrogen Input Model.
River Nitrogen Process Model: Simulates dilution, in-river transformations, and losses such as nitrificationand denitrification of the ammonium-N and nitrate-Ninputs derived from the Catchment Nitrogen ProcessModel, as well as sewage effluent discharges (Fig. 3).
A more detailed explanation of the model componentsand the equations used to drive the simulation can be foundin Whitehead et al. (1998) and Wade et al. (2002).
Application of INCA to the River LeesystemREACH STRUCTURE AND LAND CLASSPERCENTAGES
The River Lee was divided into 11 reaches chosen on thebasis of factors such as the location of water quality samplingsites, discharge gauging stations, effluent inputs, confluencepoints and changes in land use. A schematic diagram of thereach boundary structure is shown in Fig. 4. Only thoseEnvironment Agency (EA) sites that sample for bothammonium and nitrate have been included; several othersexist which sample only for ammonium. The lowestcatchment boundary is approximately 8 km short of theconfluence with the River Thames; beyond this point, theRiver Lee is tidal and so beyond the scope of modellingaccurately with INCA. Each reach drains a sub-catchment,delimited by the Centre of Ecology and Hydrology usingalgorithms of Digital Terrain Mapping (DTM).
The proportion of land use in each catchment is derivedusing Geographical Information Systems (GIS) from the
Fig. 3. Instream inputs and processes incorporated within INCA(source: Wade et al, 2001)

INCA Modelling of the Lee System: strategies for the reduction of nitrogen loads
471
ITE Land Cover Map of Great Britain. INCA uses six landclasses which have been derived from a simplification ofthe original 18 land classes for the ITE land cover map.These are forest, short vegetation fertilised and grazed(SVgFG), short vegetation grazed but not fertilised(SVgGNF), short vegetation fertilised (SVgF), arable andurban. Table 1 shows the length of each reach and thecorresponding area of the sub-catchment with land useproportions. The sub-catchments at the beginning and endof the River Lee are clearly dominated by urbanisation;however, arable and SVgGNF land classes are moreprevalent elsewhere in the catchment.
NITROGEN DEPOSITION, RIVER DATA, BASE FLOWINDEX AND TIME SERIES DATA
Atmospheric deposition of wet and dry nitrate andammonium is derived from the MATADOR-N model. GISis then used to calculate the amount of deposition in eachsub-catchment (Table 2). Dry nitrate deposition accountsfor the greatest quantity of total N deposition in the RiverLee catchment area.
INCA requires a and b parameters determined from thevelocity–flow relationship (V = aQb). To estimate theresidence time within each reach (Wade et al., 2001). The
relationship may be determined from tracer experiments ontables of velocity – flow information available from the EA.The velocity-flow relationship used for the entire riversystem was V = 0.06 Q 0.64. INCA can include effluentdischarges and water abstractions within each reach. Datapertaining to STW effluent discharges, obtained from theEA, are shown in Table 3. Surface water abstractions fromthe Lee are over 200 million m3 yr–1 (approx. 6.3 m3 s–1).They include abstractions near Ware to supply the NewRiver, and abstractions from Enfield and Chingford forpublic water supply.
The base flow index (BFI) governs the transfer of waterfrom the soil reactive zone to the groundwater zone(Whitehead et al., 1998). BFI data for the River Lee wereobtained from the Institute of Hydrology Register andStatistics Yearbook (1991-95) for each gauging station(Table 4).
The time series data of hydrologically effective rainfall(HER), actual precipitation, soil moisture deficit (SMD) andtemperature are used to drive the water transfers and N fluxesthrough the catchment system and provide essentialinformation for the modelling of N transformations. Thedata were obtained from ADAS and use the MORECS soilmoisture and evaporation accounting model to convert actualprecipitation into HER and produce a daily time series of
Fig. 4. Schematic diagram of the River Lee boundary structure. CEH – Centre for Ecology and Hydrology; EA – Environment Agency.

N.J. Flynn, T. Paddison and P.G. Whitehead
472
SMD. However, MORECS has a tendency to over-estimateSMD and consequently under-estimate HER, which cancreate generalised flows in which many significant peaksin flow are not simulated (Limbrick et al., 2000; Limbrick,2002). These peaks in flow have a dilution effect whichalters the N concentrations in the simulation. This was foundwith the data produced for the River Lee catchment, as HERfor the years 1996–97 was exceptionally low. However, othermeans of determining a HER time series are availablewhereby the ratio between average annual runoff in thecatchment and actual yearly precipitation is multiplied bythe actual precipitation to calculate an approximation toHER. One of the drawbacks of this method is that seasonalvariations in evapotranspiration are not taken into account,possibly resulting in over-estimations of HER in summerand under-estimations in winter. Initial observations alsoshowed that simulated flows between peaks in thehydrograph were significantly above those actuallyobserved. Consequently although MORECS HER data wereused, values of HER produced by the ratio method wereincluded where significant peaks in flow were missed.
Model calibration and validationProcess based models such as INCA need to be calibratedagainst observations if they are to be used as scientific andmanagement tools. This was undertaken in a ‘trial and error’fitting procedure whereby the various parameters in themodel have to be adjusted within viable limits until the bestpossible simulation was produced (Wade and Whitehead,2001). For the Lee catchment, the INCA model wascalibrated against daily discharge data from EA gaugingstations and against nitrate and ammonium concentration
Table 3. Effluent discharges into the River Lee
Name Reach no. Discharge Dischargem3 day-1 m3 s-1
Luton (East Hyde) 3 130,000 1.50 STWHarpenden STW 3 24,000 0.28Mill Green STW 5 12,000 0.14Rye Meads STW 9 330,000 3.80
Table 2. Wet and dry deposition rates of nitrate andammonium (kg N ha–1 y–1)
Reach no. NO3 dry NO3 wet NH4 dry NH4 wet
1 11.4 2.58 1.46 4.432 10.6 2.75 1.39 4.603 9.49 2.88 1.04 4.714 10.8 2.62 0.79 4.515 15.0 2.42 1.07 4.356 10.2 2.52 0.76 4.427 9.08 2.33 0.60 4.368 9.87 2.49 0.53 4.039 10.3 2.51 0.61 3.9010 13.9 2.42 1.01 4.2211 23.6 2.33 1.67 4.42
Table 1. Reach, length, sub-catchment area and land class percentage
Reach no. Reach Length Sub-catchment Forest SVgFG SVgGNF SVgF Arable Urban (m) Area (km2) (%) (%) (%) (%) (%) (%)
1 8000 61 0 0 2 3 30 662 3500 12 8 0 25 0 33 333 6750 14 0 0 29 0 57 144 6000 18 6 0 22 0 67 65 5000 21 14 0 29 0 29 296 10250 192 5 0 23 0 65 87 3500 329 1 0 9 0 82 88 6750 109 0 0 8 0 87 59 1000 284 1 0 9 0 81 810 16500 176 13 0 35 1 34 1811 13500 173 5 0 8 1 2 85
data from the routine water quality monitoring programmeof the EA. Two years’ continuous data (1995–96) were usedto give a clearer picture of the trends of N concentrations.

INCA Modelling of the Lee System: strategies for the reduction of nitrogen loads
473
Although ammonium concentrations were recorded in themajority of reaches, nitrate data were restricted to reachesin the lower half of the Lee.
In the lower reaches of the Lee, difficulties were incurredin simulating the volume of flow. At times, simulated flowwas higher than that observed, perhaps because of waterabstractions. Initially, abstractions were based on the meanabstraction calculated from the consented annualabstractions. However, zero flow was obtained at one pointduring the simulation; therefore the abstraction rate wasreduced so that flow was always maintained in thesimulation. Furthermore, the abstraction rate may rise abovethe mean during peak flows so that not enough water isremoved at times of substantial peak flows. However, therising and falling limbs were matched closely to observedflows. Land and river phase process parameters werecalibrated successfully for the simulation of nitrate
concentrations. The initial conditions and the upward anddownward trends in nitrate concentrations were simulatedand fell within the absolute limits of the field data (Fig. 5).Ammonium concentrations were simulated less successfullybut generally remained within the absolute limits of theobservations.
To ensure the success of the simulation in representingthe modelled river, its reliability must be examined againstits ability to simulate water quality from data for a timeperiod different from that used in the calibration procedure(i.e. validation). The same process parameters were used inconjunction with time series data from 1998–99, andcompared for reliability against observations for those years.Although the fit was not quite so good, the changes inconcentration dynamics still followed the trends of the fielddata. Discrepancies occurred within the flow simulation(whereby too much flow was generally simulated) and theseare probably related to changes in abstraction rates, or resultfrom the MORECS calculation of HER.
SPATIAL VARIATIONS ALONG THE RIVER LEE
The changing concentrations in nitrate and ammonium alongthe River Lee are shown in Fig. 6. Although this representsjust one day in the simulation period, no significantvariations in this pattern occur over the two-year period. Asummary of nitrate concentrations produced in each reachis provided in Table 5.
Table 4. Base Flow Index (BFI) for the River Lee
Gauging Station (no.) Reach no. BFI
Luton Hoo (38013) 1 0.62Water Hall (38018) 6 0.81Rye Bridge (38031) 8 -Fieldes Weir (38001) 9 0.57Lee Bridge (38032) 11 0.46
Fig. 5. Reach 7: simulated and observed data (1995–96)

N.J. Flynn, T. Paddison and P.G. Whitehead
474
Table 5. A reach summary of nitrate concentrations(mg N l–1) in the River Lee
Reach no. Mean Max. Min. Range
1 7.40 10.6 5.04 5.552 4.87 9.26 2.30 6.963 12.1 13.9 10.0 3.874 9.58 11.8 7.03 4.755 8.46 10.7 5.79 4.916 7.78 9.73 5.63 4.107 7.97 11.1 5.22 5.848 4.40 8.76 1.60 7.169 6.98 9.41 5.11 4.3010 7.05 10.8 4.79 5.9811 9.99 16.8 7.50 9.31
Fig. 6. Changes in discharge, and concentrations of nitrate-N and ammonium-N along the length of the River Lee (Day 257)
Urbanisation clearly affects the nitrate concentrations inthe Lee. Reach 1 and reach 11 demonstrate higherconcentrations of nitrate-N than adjacent reaches (Fig. 6).Nitrate concentrations in reach 1 are, on average, 2.5 mgN l–1 greater than those simulated in reach 2; similarly, inreach 11, nitrate concentrations are 3 mg N l–1 higher thanthose in reach 10 (Table 5); these differences are attributableto the urbanisation of the relevant sub-catchments (Table 1).The source of the Lee is in Luton and the first reach is entirely
confined within metropolitan Luton, while the whole ofreach 11 runs through North London boroughs towards theconfluence with the River Thames. INCA modelling of thetypical annual nitrogen loads by land class in the River Leecatchment area show the urban land class to have the highestnitrate-N leaching of any other land class (approximately29 kg ha–1 yr–1: Fig. 7). Modelling also indicates that nodenitrification of nitrate takes place in urban areas as itmoves from the land phase to the river (Fig. 7); the loadingof nitrate to these reaches is proportionally much greaterthan that in other reaches, to the detriment of the waterquality. In reach 11, water abstractions may be a contributingfactor.
The highest mean concentration of nitrate is found inreach 3 (12.1 mg N l–1), substantially higher than in reach2. This is clearly attributable to effluent discharges fromthe STWs at Luton and Harpenden. Luton (East Hyde) STWis a particularly large operation dealing with most of thedomestic waste from Luton. The STW at Rye Meadsdischarges a large flow into reach 9, so that nitrateconcentrations rise between reach 8 and reach 9. However,the greater volume of water in the Lee at this point ensuresthat the effect on water quality is less marked than furtherupstream. Ammonium concentrations follow a similarpattern, although the Hatfield STW, which dischargeseffluent into reach 5, increases ammonium but not nitrateconcentrations.

INCA Modelling of the Lee System: strategies for the reduction of nitrogen loads
475
Water abstractions reduce the dilution of pollutants. Thiswas apparent from the difference between the simulatedconcentrations of reach 7 and reach 8, where a suddendecrease in nitrate was inconsistent with the rate at whichconcentrations had been declining previously. This is mostprobably due to the abstraction from reach 7 to the NewRiver (to supply London) as there are no significantdifferences in land use between the two sub-catchments. Asimilar effect occurs in reach 10 and reach 11, whensubstantial abstractions reduce river discharge and soamplify nitrate concentrations Ammonium concentrationsare less susceptible to this effect and any rise in concentrationis minimal.
Figure 8 displays the simulation generated for reach 2,and is a typical representation of the temporal pattern formedby changing N concentrations along the Lee in the absenceof effluent discharges. The low flow conditions at the startof the simulation time period are characterised by some ofthe highest concentrations of the simulated period. In allreaches, concentrations of nitrate were initially > 8 mgN l–1. The concentrations of nitrate remain high and falland rise to mirror the flow pattern. This is because HERresults in the flux of water through the catchment soils whichultimately affects river discharge, whilst N in catchment soilsis transported to the river concurrently. Thus, the pattern ofnitrate leaching matches the pattern of flow throughout thesimulation. When HER ceases, the gradual decline indischarge and leaching results in a fall in nitrate
concentrations as denitrification removes it from the system.Minimum concentrations in all reaches occur around day211. The nitrate concentrations then increase again althoughthere is no increase in discharge and leaching to mirror thechange. This is attributed to the large reduction in the watervolume in the Lee resulting in minimal dilution of nitrate.The next HER event then coincides with a rapid increase innitrate concentration as hydrological responses causeincreased leaching and discharge. Thus, as noted previously,the concentration of nitrate begins to mirror the changes inflow. A peak in concentration on day 356 of the simulationmatches the magnitude of the peak earlier in the year. Asimilar pattern is established through 1996 as concentrationsfall through the year before rising when drought conditionsresult in minimal flows, and then increase rapidly withautumnal and winter HER.
The simulation of the ammonium concentrations followsthe same hydrological responses. However, higher rates ofnitrification in both land and river phases result in morerapid reductions of ammonium. Hence, concentrations aremore consistent between peaks and low flows do not resultin rising ammonium concentrations (Fig. 8).
N dynamics were affected in those reaches wheresignificant discharges of sewage effluent occur. In reach 3,where large effluent discharges from Luton (East Hyde)STW and from Harpenden STW enter the river, theconcentration of nitrate is considerably higher than that inmost other reaches as the discharge from the STWs accounts
Fig. 7. Typical annual nitrogen loads by land class in the River Lee catchment area

N.J. Flynn, T. Paddison and P.G. Whitehead
476
for a significant proportion of river flow. However, thenitrate concentration falls rapidly when flow in the riverincreases, which contrasts with other reaches. The waterentering the reach from upstream, and the water draininginto the reach from the sub-catchment, have a significantlylower nitrate concentration; this dilutes the effluent dischargeat peak flows. Similarly, concentrations rapidly fall at thepeaks in river discharge in the latter parts of 1995 and 1996.A similar effect is observed in reach 9 due to the dischargeof the Rye Meads STW, however, the impact is less dramaticsince a larger proportion of river flow is derived naturally.
The temporal dynamics in nitrate concentrations of reach11 are affected by the large abstractions from this and thepreceding reach. The minimal flows in this reach result inthe highest nitrate concentration simulated in the Lee(17 mg N l–1). Hence, as in reaches affected by sewageeffluent, an increase in river discharge results in a suddenfall in nitrate concentrations. The concentration of nitrate isthen maintained until the river flow reaches criticalconditions again. However, this increase appears to havebeen over-stated, probably due to the observed flowconditions being slightly higher than simulated.
OVERALL WATER QUALITY OF THE RIVER LEE
The water quality of the River Lee is assessed here in terms
of the water abstraction MAC for nitrate. The majority ofreaches in the Lee have a range of nitrate concentrationbetween 6–10 mg N l–1 and rarely transgress the 11.3 mgN l–1 limit. Although this may be adequate in economicterms, in terms of the environment, these concentrations aresuggestive of the problems of eutrophication that have beenreported in the Local Environment Agency Plans for theRiver Lee catchment area (EA, 2001a, b). Using a crudeestimate of the average concentration of nitrate from themean concentration for each reach provides a figure of7.87 mg N l–1 which suggests that the water quality in theRiver Lee is worse than the European average, and is in thelowest 10%. Two particular reaches of the Lee appear tobreak the MAC limit consistently. For most of 1995–96 theRiver Lee in reach 3 has nitrate concentrations which surpassthe MAC (71%) as a result of effluent discharges. In reach11, the situation is less severe so that concentrations surpassthe MAC limit in only 18% of the simulations.
Controlling nitrogen loading to riversystemsSeveral schemes exist in the UK whereby nitrogen loadingto river systems, particularly from agricultural land, isreduced through voluntary implementation of various
Fig. 8. Temporal nitrogen dynamics in the River Lee (reach 2: 1995–96)

INCA Modelling of the Lee System: strategies for the reduction of nitrogen loads
477
governmental or European schemes. Agricultural land is thesingle main contributor of diffuse N pollution due to itshighly intensive nature. The late 1980s and early 1990sbegan to see a policy change from intensification and surplusproduction (Burt and Haycock, 1993) where the Ministryfor Agriculture and Fisheries (MAFF) compensated farmerswho adopted practices which could result in a loss of income,but were beneficial to the environment. These schemesreduced fertiliser applications and took land out of cropproduction.
Set-aside was designed as a voluntary scheme to reducethe surplus in arable crops, whereby farmers arecompensated for taking at least 20% of their arable land outof production. In addition, the Nitrate Sensitive Areas (NSA)scheme was introduced by MAFF in 1989 for those areaswhere water resources were in danger of exceeding the MACof 11.3 mg N l–1. Basic and premium rate payment schemeswere introduced, the rate of payment linked to the extent ofthe measures taken. Measures under the basic rate involvereducing fertiliser applications below the economicoptimum; planting winter crops earlier in the autumn;limiting application rates of organic manure; and controllingthe time of fertiliser application. Assessment of some aspectsof the NSA and similar management schemes have beencarried out in model simulations (Johnes, 1996: exportcoefficient model, and Wade et al., 2001: the INCA model).
The use of riparian buffer strips to reduce nitrogen loadingto river systems has also been investigated, the preceptbehind these being that their natural location allows themto regulate the movement of materials in surface runoff andgroundwater flowing between terrestrial and aquaticsystems, while their function enables nutrient fluxes(including N) to be retained and/or transformed particularlyby denitrification and plant uptake. However, theexperimentation and implementation of riparian buffer stripshas met with mixed results. Riparian buffer strips can behighly efficient in their removal of nitrate, particularly fromsubsurface flow, but site selection and management needscareful consideration. Agricultural drainage mechanisms canreduce the effectiveness of buffer strips by either bypassingthem or by lowering the groundwater table, so removingwaterlogged areas near to streams (Haycock and Burt, 1993;Vought et al., 1994; Woltermade, 2000). Thus, it is vitalthat natural drainage mechanisms predominate, andagricultural drainage water may be required to be re-routed.It is also suggested that buffer strips are usually bestemployed on smaller streams because 60–70% of waterreaching large streams enters via streams of order 1–-3(Vought et al., 1994).
In addition to agricultural land, urban and atmosphericsources of N can also be substantial. Effluent discharges
from STWs can make up significant amounts of flow inrivers, especially during times of drought. The processingof sewage treatment in UK works has undergone extensiveinvestment since the privatisation of the UK water industry;as a result, ammonium concentrations have decreaseddramatically. However, few STWs in the UK have facilitiesfor the tertiary treatment of sewage to enable the removalof large quantities of nitrate from sewage effluent.
A reduction in atmospheric emissions relating to nitrogencompounds could be beneficial for aquatic systems. Johnes(1996) simulated the impact of reducing the nitrogen loadingfrom atmospheric sources by 20% using the exportcoefficient model on three separate catchments. Thereduction had limited success, although a fall ofapproximately 6% in N loading was found in the River Eskcatchment in Cumbria. It is likely that reducing emissionsof nitrogen compounds into the atmosphere would be morebeneficial to upland areas sensitive to acidification than tolowland areas, which are more susceptible to eutrophication.
Scenario analysisOne of the valuable functions of INCA is its ability to beused as a management tool, allowing an analysis of strategieswhich might be adopted to improve water quality. Scenariosto reduce nitrate concentrations in the River Lee weresimulated through INCA from 1995. Scenario 1 was the100% implementation of a NSA premium pay rate schemeacross the catchment; it converts all arable land tounfertilised and ungrazed vegetation. Scenario 2 takes amore realistic approach and converts 20% of arable land toforestry.
The LEAP for the Upper Lee suggests that theimplementation of riparian buffer strips along the maintributaries of the River Lee could be beneficial to waterquality (EA, 2001a). Furthermore, an ‘environmentalassessment’ of the Lower Lee advises that the constructionof a wetland treatment system in the derelict TottenhamMarshes could be used to intercept storm flows from thePymmes Brook catchment (Rust Environmental, 1995).Scenario 3 attempted to simulate this management strategy.However, INCA is semi-distributed, and consequently theprecept of riparian buffer strips cannot strictly be simulated.A method was therefore established to provide an averageof the removal/retention of nitrate over the catchment. Ratesof denitrification and plant uptake in riparian buffer strips(the principle mechanisms of nitrate removal) wereestablished from the literature. A ratio describing the areaof the riparian buffer strips to the area of the Lee catchment(1:50) was used to calculate the average loss of nitrate perhectare. The parameters defining rates of denitrification and

N.J. Flynn, T. Paddison and P.G. Whitehead
478
plant uptake were then adjusted to account for this additionalloss.
Effluent discharges from STWs can add substantial Npollution to rivers. Luton (East Hyde) STW and Rye MeadsSTW produce large discharges which are relatively high innitrate content, thus affecting water quality in the Lee (seeTable 3). Scenario 4 reduces the nitrate concentration ofsewage effluent from these two STWs by 50%. Waterabstractions have also been identified as altering N dynamicsin the Lee and scenario 5 examined the effect of reducingabstraction licensing conditions by 20%.
The simulation of scenario 1 demonstrated the extent towhich agricultural land is a controlling factor on waterquality. Substantial reductions of nitrate were observed inreaches 3 and 11 during peak flows (2 mg N l–1 and 4 mgN l–1 respectively). However, as flow decreased after winterrainfall, the difference was reduced until, at minimal flows,the original simulation and scenario are indistinguishable.This is further evidence that during low flows the effluentdischarge into reach 3, and the abstractions from reach 10and reach 11 are major contributors to water pollution inthose parts of the river. The greatest improvements wereattained in the reaches whose associated sub-catchmentswere predominately arable. Reach 7 attained the greatestdrop in nitrate-N concentration of 7 mg l–1 at peak flows,whilst even during the minimal flow of summer and autumnthe nitrate-N concentrations were improved by 3 mg l–1
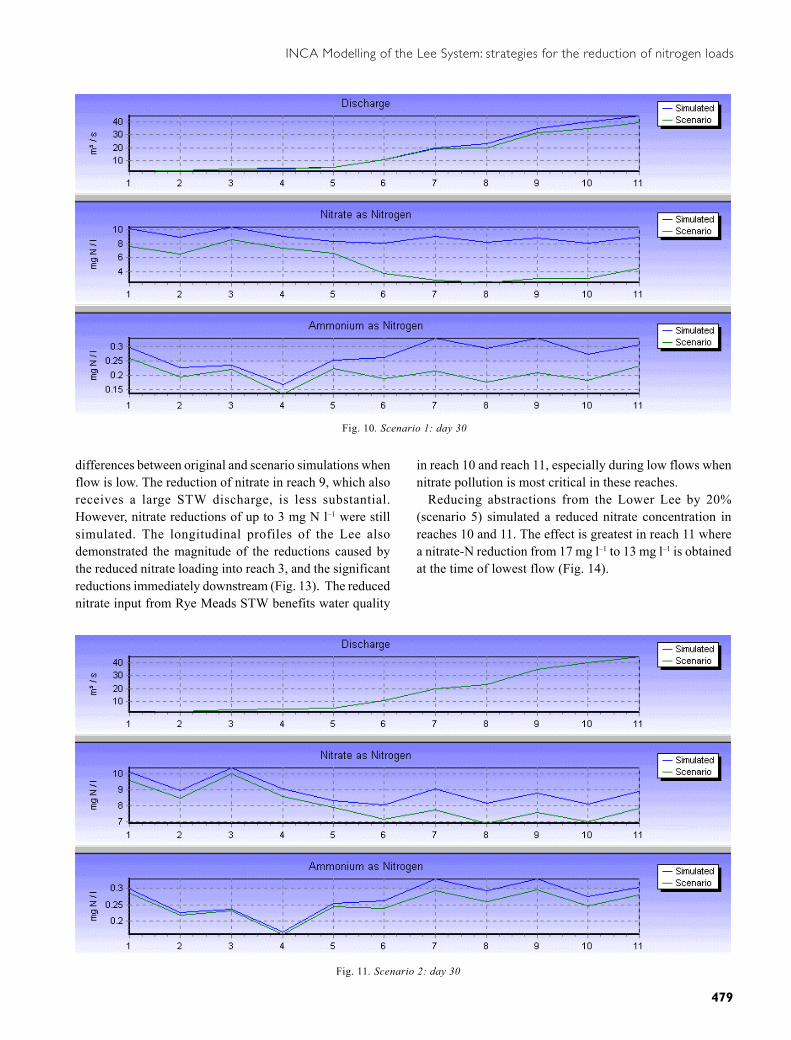
(Fig. 9). This is further demonstrated by longitudinal profilesof the Lee (Fig. 10). The profile of the Lee on day 30 (peak
flow) displays a substantial reduction in nitrate in all reachesbut, by day 270 (low flow) of the simulation, significantimprovements are found only between reach 6 and reach 9,and these have largely agricultural sub-catchments (65–87%arable land use).
The simulation of scenario 2, in which only a limitedamount of arable land is converted, met with limited success.In reach 3, minimal reductions were observed, even atmaximum flows. However, in reach 7, a reduction in nitrateof between 1–2 mg N l–-1 occurred throughout thesimulation. Figure 11 demonstrates that this improvementin water quality starts at reach 6 and is maintained along therest of the Lee at peak flow. However, these improvementsare negligible in most reaches when flow is reduced.
The simulation of riparian buffer strips in scenario 3provided little indication that their implementation wouldresult in significant reductions of nitrate. Minimal reductionswere made by representing nitrate removal in buffer stripsusing plant uptake rates of 1000 kg ha–1 yr–1; anddenitrification rates of 400 kg ha-1 yr-1 (values at the upperend of the range found in the literature: Vyzamal, 2001;Leeds-Harrison et al., 1999). Even at low flows, where mostsignificant improvements have previously been established,the reduction of nitrate concentrations to the Lee wasminimal (Fig. 12).
In scenario 4, the 50% reduction of nitrate-Nconcentrations of selected effluent discharges into the Leehas greatest effect in reach 3. The reduction in instreamnitrate-N ranges between 2 and 5 mg l–1, with the greatest
Fig. 9. Scenario 1: reach 7
INCA Modelling of the Lee System: strategies for the reduction of nitrogen loads
479
differences between original and scenario simulations whenflow is low. The reduction of nitrate in reach 9, which alsoreceives a large STW discharge, is less substantial.However, nitrate reductions of up to 3 mg N l–1 were stillsimulated. The longitudinal profiles of the Lee alsodemonstrated the magnitude of the reductions caused bythe reduced nitrate loading into reach 3, and the significantreductions immediately downstream (Fig. 13). The reducednitrate input from Rye Meads STW benefits water quality
in reach 10 and reach 11, especially during low flows whennitrate pollution is most critical in these reaches.
Reducing abstractions from the Lower Lee by 20%(scenario 5) simulated a reduced nitrate concentration inreaches 10 and 11. The effect is greatest in reach 11 wherea nitrate-N reduction from 17 mg l–1 to 13 mg l–1 is obtainedat the time of lowest flow (Fig. 14).
Fig. 10. Scenario 1: day 30
Fig. 11. Scenario 2: day 30

N.J. Flynn, T. Paddison and P.G. Whitehead
480
Fig. 12. Scenario 3: day 30
Fig. 13. Scenario 4: day 30
DiscussionIn reaches unaffected by effluent discharges and waterabstractions, the periods of peak N concentration occurredat peak flows, while minimal flows resulted in an upwardtrend of nitrate. However, STW effluent discharges addedconsiderably to the concentration of nitrate found in reaches,
and the problem was compounded during the summer whenflow was lowest. Furthermore, the abstractions from theLower Lee amplify the problems by marked reductions inthe volume of water in these reaches. This may raise nitratelevels above the MAC, which then incurs water resourceproblems, as well as environmental damage. This suggeststhat management strategies on the Lee will necessitate

INCA Modelling of the Lee System: strategies for the reduction of nitrogen loads
481
reductions in the loading of nitrate from STWs, while seriousconsideration must be given to reducing abstractions fromthe Lee.
Although agricultural and urbanised areas have beenidentified as significant sources of diffuse nitrate loading,it is uncertain that any viable land management plan alonewould reduce nitrate enough to improve the environmentalstatus of the Lee. However, changes in land use and landmanagement practices would be beneficial to the Lee, sincenitrate loading can be reduced by taking arable land out ofproduction. The apparent benefits of this reduction wouldbecome greater if loadings from STWs were reduced.
Using the INCA model, riparian buffer strips were notpredicted to offer any significant benefit to the reduction ofnitrate loading. However, their use cannot be disregarded.Further investigation is needed to establish whether INCAcan be used to simulate the function of riparian buffer strips.These strips can have additional benefits by reducingsediment and phosphorus loads to rivers and floodingproblems further downstream through the restoration of thenatural flood plain (Haycock and Burt, 1993).
Improvements could be made to the current simulation,because simulation of flow using MORECS HER overlygeneralised flows and consequently missed many significantpeaks. Although adjustments were made to these data, adifferent model, such as IHACRES, to determine thedynamics of the two separate hydrological zones as well as
simulating runoff could be used (Whitehead et al., 1998).A better understanding of the somewhat artificial hydrologyof the Lower Lee would also be beneficial, since theinteractions of the Lee itself with various navigationchannels appears complex. Furthermore, inclusion of timeseries of water abstractions from the Lee could beincorporated into the model using the ‘Effluent Time Series’function, which is available in the current INCA version(v1.6) (Wade and Butterfield, 2001).
Lack of nitrate data for the upper reaches of the Lee ledto difficulties in adjusting instream denitrification rates.Monthly sampling of N concentrations can result in peaksbeing missed, which was particularly true of ammoniumbecause the concentrations change much more rapidly thanfor nitrate, for which general and longer-term trends arenormally established. More frequent sampling for a periodof time could be beneficial, especially downstream of theLuton (East Hyde) STW.
Since low flows have been established as a cause of raisednitrate concentrations, simulation of the effect of climatechange on the Lee would be a viable and useful study. Globalwarming might reduce river flows with importantimplications for the management of water resources and forthe ecological status of the river. Climate models could beused to predict the changes in hydrological variables, whichcould then be superimposed onto current data, as carriedout by Limbrick et al. (2000) for the River Kennet.
Fig. 14. Scenario 15: reach 11

N.J. Flynn, T. Paddison and P.G. Whitehead
482
ConclusionFor most of the Lee catchment, the leaching of N from urbanand arable areas controls the changing dynamics of N inriver reaches. However, when flows became minimal duringsummer and early autumn, nitrate increased because of lackof dilution. However, these N dynamics were upset bysignificant effluent discharges, or where flow was reducedsubstantially by abstractions. In these reaches, an increasein flow resulted in lowered concentrations of nitrate as theload was diluted. Ammonium concentrations were lesssusceptible to these influences.
The average simulated concentration of nitrate over thecourse of the River Lee for 1995–96 was 7.9 mg N l–1.Compared to the European average of 4 mg N l–1 nitrate,the River Lee suffers from high nitrate concentrations andit has been designated a ‘Eutrophic Sensitive Area’.Furthermore, in reach 11, the MAC of 11.3 mg N l–1 wassurpassed approximately 18% of the time during the twoyear simulation period; this could have serious implicationsfor water resource management to supply London. Themajor sources of nitrate loading were identified initially asLuton (East Hyde) and Rye Meads STWs. The concentrationof nitrate was highest when the effluent discharge accountedfor a significant proportion of the river flow (i.e. when riverflow was minimal). A 50% reduction in the nitrateconcentration from Luton (East Hyde) STW should resultin a fall of up to 5 mg N l–1 in reach 3; improvement wouldoccur in reaches immediately downstream. Largeabstractions from reach 10 and reach 11 compoundedpollution problems in summer, and a maximum nitrateconcentration of 17 mg N l–1 was simulated in reach 11.However, a 20% reduction in abstraction would result in adrop of up to 4 mg N l–1 in this reach. Concentrations ofammonium fell largely within the ‘fair-good’ EnvironmentAgency general water quality assessment, for all reaches.
High nitrate concentrations were found to be connectedwith land use; a simulation of the conversion of all arableland to ungrazed vegetation would result in substantialreductions in nitrate. The conversion of a smaller proportion(20%) of the arable land, this time to woodland, wouldreduce nitrate concentration by 1–2 mg N l–1 loading wheresub-catchments were dominated by agriculture. Therepresentation of riparian buffer strips in an INCA simulationgave little reduction of nitrate loading. Whether INCA isunsuitable for such an assessment, or whether theestablishment of buffer strips would be successful in thisinstance is inconclusive.
The River Lee is heavily polluted with nitrate, both fromagricultural diffuse pollution and STW point sources. Theproblems of nitrate pollution are then further exacerbated
by the substantial abstractions from the Lower Lee to supplyLondon. For any improvement in water quality, nitrateloading must be reduced and careful consideration given tofuture water resources management. Any changes to landmanagement will have limited success in reducing pollutionuntil a reduction of nitrate loading from the largest STWs isachieved.
AcknowledgementsThis research is supported by the European Commission(Project EVK1-1999-00011). The authors would like tothank Heather Browning for help with the diagrams andCEH, ADAS and the Environment Agency for providinginformation on the River Lee catchment.
ReferencesBurt, T.P. and Haycock, N.E., 1993. Controlling Losses of Nitrate
by Changing Land Use. In: Nitrate: Processes, Patterns andManagement,T.P. Burt, A.L. Heathwaite and S.T. Trudgill(Eds.). Wiley, Chichester, UK. 341–368.
Collins R., Whitehead, P.G. and Butterfield, D., 1999. Nitrogenleaching from catchments in the Middle Hills of Nepal; anapplication of the INCA model. Sci. Total Envir., 228, 259–274.
EA, 1997. The Lee Fact File. Environment Agency, Bristol.EA, 2001a. Local Environment Agency Plan - Upper Lee.
Environment Agency, Bristol.EA, 2001b. Local Environment Agency Plan - North London.
Environment Agency, Bristol.EA, 2001c. Pollutants from sewage treatment works in England
and Wales. Environment Agency, Bristol.Flavin, R.J. and Joseph, J.B., 1983. The hydrogeology of the Lee
Valley and some effects of artificial recharge. Quart. J. Eng.Geol., 16, 65–82.
Halcrow Water, 1999. Water and Environment Water QualityStrategy for the Lower River Lee.
Haycock, N.E. and Burt, T.P., 1993. The Sensitivity of Rivers toNitrate Leaching: The Effectiveness of Near-stream Land as aNutrient Retention Zone. p.260-272 In: Landscape Sensitivity,D.S.G. Thomas and R.J. Allison (Eds.). Wiley, Chichester, UK.
Heathwaite, A.L., 1993. Nitrogen cycling in surface waters andlakes. In: Nitrate: Processes, Patterns and Management,T.P.Burt, A.L. Heathwaite and S.T. Trudgill (Eds.). Wiley,Chichester, UK. 99–140.
Heathwaite, A.L., Burt, T.P. and Trudgill, S.T., 1993. Overview –the Nitrate Issue. In: Nitrate: Processes, Patterns andManagement,T.P. Burt, A.L. Heathwaite and S.T. Trudgill(Eds.). Wiley, Chichester, UK. 3–22.
Johnes, P.J., 1996. Evaluation and management of the impact ofland use change on the nitrogen and phosphorus load deliveredto surface waters: the export coefficient model approach. J.Hydrol., 183, 323–349.
Johnes, P.J., Moss B. and Phillips, G., 1996. The determinationof total nitrogen and total phosphorus concentrations infreshwaters from land use, stock headage and population data:testing of a model for use in conservation and water qualitymanagement. Freshwater Biol., 36, 451–473.

INCA Modelling of the Lee System: strategies for the reduction of nitrogen loads
483
Leeds-Harrison, P.B., Quinton, J.N., Walker, M.J., Sanders, C.L.and Harrod, T., 1999. Grassed buffer strips for the control ofnitrate leaching to surface waters in headwater catchments. Ecol.Eng., 12, 299–313.
Limbrick, K. J., 2002. Estimating daily recharge to the chalkaquifer of Southern England. Hydrol. Earth Syst. Sci., 6, 485–495.
Limbrick, K.J., Whitehead, P.G., Butterfield, D. and Reynard, N.,2000. Assessing the potential impacts of various climate changescenarios on the hydrological regime of the River Kennet atTheale, Berkshire, south-central England, UK: an applicationand evaluation of the new semi-distributed model, INCA. Sci.Total Environ., 251/252, 539–555.
NEGTAP, 2001, National Expert Group on Transboundary AirPollution. NEGTAP Draft Report.
O’Shea, M.J. and Sage, R., 1999. Aquifer recharge: an operationaldrought-management strategy in north London. J. Chart. Inst.Water Envir. Manage., 13, 400–405.
Prior, H., 1998. Total nitrogen and total phosphorus cycling inriparian ecosystems. Unpublished PhD thesis, University ofReading.
Reid, K., 1995. River revival. Surveyor, 182, 20–21.Rust Environmental, 1995. NRA (Thames Region) Lower Lee
Improvements – downstream of Tottenham. Rust Environmental.Skeffington, R., 2002. European nitrogen policies and nitrate in
rivers. Hydrol. Earth Syst. Sci., 6, 315–324.Vought, L.B., Dahl, J., Lauge, C., Pedersen, L. and Lacoursiere,
J.O., 1994. Nutrient retention in riparian ecotones. Ambio, 23,342–348.
Vymazal, J., 2001. Types of constructed wetlands for wastewatertreatment. In: Transformations of nutrients in natural andconstructed wetlands. J.Vymazal (Ed.). Backhuys, USA. 1–93.
Wade, A.J. and Butterfield, D., 2001. INCA v1.6 Release Notes.Aquatic Environments Research Centre, Department ofGeography, Whiteknights, P O Box 227, Reading, RG6 6AB,UK.
Wade, A.J. and Whitehead, P.G., 2001. INCA v1.6 CalibrationGuidelines. Aquatic Environments Research Centre, Departmentof Geography, Whiteknights, P O Box 227, Reading, RG6 6AB,UK.
Wade, A.J., Whitehead, P.G., Edwards, A.C., Butterfield, D.,Smart, R.P., Cook, Y., Owen, R.P., Soulsby, C. and Langan,S.J., 2001. Modelling instream nitrogen variability in the Deecatchment, NE Scotland. Sci. Total Envir. 265, 229–252.
Wade, A.J., Durand, P., Beaujouan, V., Wessel, W.W., Raat, K. J.,Whitehead, P.G., Butterfield, D., Rankinen, K. and Lepisto, A.,2002. A nitrogen model for European catchments: INCA, newmodel structure and equations. Hydrol. Earth Syst. Sci., 6, 559–582.
Whitehead, P.G., 1990. Modelling nitrate from agriculture to publicwater supplies. Phil. Trans. Roy. Soc. London, Series B, 329,403–410.
Whitehead, P.G. and Williams, R., 1984. Modelling nitrate andalgal behaviour in the River Thames. Water Sci. Tech., 16, 621–633.
Whitehead, P.G., Williams, R. and Lewis, D., 1997. The QUASARWater Quality Model. Sci. Total Environ., 194/195, 399–418.
Whitehead, P.G., Wilson, E.J. and Butterfield, D., 1998. A semi-distributed Integrated Nitrogen model for multiple sourceassessment in Catchments (INCA): Part I – model structure andprocess equations. Sci. Total Envir., 210/211,: 547–558.
Woltermade, C.J., 2000. Ability of restored wetlands to reducenitrogen and phosphorus concentrations in agricultural drainagewater. J. Soil Water Conserv., 55, 303–309.

N.J. Flynn, T. Paddison and P.G. Whitehead
484