Embed Size (px)
Citation preview

In vivo regulation of electron and proton transport under different environmental conditions
Wageningen University
Horticulture and Product Physiology Group
MSc Thesis (HPC-80436)
In vivo regulation of electron and proton transport under different environmental conditions
By:
Miguel A. Gómez Cabezas (Reg. No. 810627268100)
Supervisors:
Dr. Jeremy Harbinson PhD. Student Graham Taylor
Wageningen, 2015

ACKNOWLEDGEMENTS
I would like to express my deepest gratitude to SENESCYT, my sponsor in Ecuador, for all the economical support given during all my study program.

iii
ABSTRACT
Nowadays, it is considered that improvements in the photosynthetic rates of individual leaves within the
canopy may be the solution to increase crop yields for the growing population in the coming decades. In that
logic, it is of great importance to understand the operation, regulation, and limitations of photosynthesis under
different environments. To contribute with this objective, the regulation of electron and proton fluxes
produced in the thylakoid discs under increasing irradiance, decreasing CO2 concentrations and decreasing
temperatures was studied in the Solanacea species Juanulloa aurantiaca through the use of non-invasive
biophysical techniques (chlorophyll fluorescence and absorbance changes at 520 and 820 nm) in vivo. The
results showed that the mechanisms that regulate the flux of electrons and protons when the metabolism in
the stroma is reduced by decreasing CO2 concentrations or decreasing temperatures works in the same way.
The flux of electrons generated a proton motive force (pmf) that decreased the pH in the lumen, thereby
decreasing the rate of oxidation of plastoquinol (ke) and increasing the non-photochemical quenching (NPQ). A
decrease of ke was accompanied by a decrease of the conductivity of ATP synthase to protons (gH+). Leaves
exposed to increasing irradiance showed lower pmf values and a relatively non-altered ke and gH+.
Keywords. Photosynthesis, decreasing temperature, decreasing CO2 concentrations, metabolism, flux of
protons, flux of electrons.

iv
CONTENTS
ACKNOWLEDGEMENTS II
ABSTRACT III
SUMMARY V
1. INTRODUCTION 1
1.1 THEORETICAL BACKGROUND 1
Components involved in electron and proton fluxes in leaves 1
PSII photosystem 2
PSI photosystem 3
Cyt-b6/f and ATP synthase complexes 3
1.2 PROBLEM DEFINITION 4
1.3 AIM AND RESEARCH QUESTIONS 5
1.4 HYPOTHESIS 6
2. MATERIALS AND METHODS 7
2.1 PLANT MATERIAL AND GROW CONDITIONS 7
2.2 MEASURING PHOTOSYNTHETIC PERFORMANCE 7
Chlorophyll fluorescence 8
Absorbance changes at 820 nm 8
Electrochromic shift (ECS) measurements. 10
3. RESULTS 12
3.1 PHOTOSYNTHESIS REGULATION UNDER LIGHT INTENSITY CHANGES 12
3.2 PHOTOSYNTHESIS REGULATION UNDER CO2 CONCENTRATION CHANGES 14
3.3 PHOTOSYNTHESIS REGULATION UNDER TEMPERATURE CHANGES 16
4. DISCUSSION 18
5. REFERENCES 23
6. APPENDIXES 25

v
SUMMARY
Nowadays, it is considered that improvements in the photosynthetic rates of individual leaves within
the canopy may be the solution to increase crop yields for the growing population in the coming decades. In
that logic, it is of great importance to understand the operation, regulation, and limitations of photosynthesis
under different environments. In this context, few studies have been realized in leaves of the tropical plant
species Juanulloa aurantiaca. By the use of biophysical techniques (i.e., leaf gas exchange, chlorophyll
fluorescence and absorbance changes at 820 nm), such studies showed the responses of the thylakoid electron
transport of this C3 plant under different environmental conditions in which the photosynthetic photon flux
densities (PPFD), CO2 and O2 concentrations were modulated (Harbinson, 1994; Genty and Harbinson, 1996).
With these antecedents, the scope of this research is to generate more information regarding to the regulation
of the photosynthetic apparatus of this tropical plant species under different environmental conditions through
the use of a broad combination of non-invasive techniques.
Cuttings of the tropical C3 plant species Juanulloa auriantiaca were planted and placed in a climate
chamber with relative humidity of 70%, a day/night temperature of 25/23 °C, ambient CO2 concentration and
12hours of photoperiod with 600 μmolm-2
s-1
of fluorescent light. The photosynthetic performance of each
plant was evaluated in a customised equipment designed by Wageningen University. This equipment offered
the opportunity to measure in vivo the following photosynthesis parameters: leaf CO2exchange, chlorophyll
fluorescence and absorbance changes at 520 and 820 nm in leaves exposed to different light intensities,
temperatures and CO2 concentrations. Photorespiration was avoided in this study fixing the O2 concentration in
the gas inflow at 2%.
The results showed that a reduction of the metabolism in the stroma by decreasing CO2
concentrations or temperatures lessened the rate constant supply of reductant to the reaction centre P700+
(ke). The values for ke when the CO2 concentrations were decreased ranged from 15 to 68.37 s-1
while for
decreasing temperatures ke ranged from 22.15 to 67.68 s-1
.This control of electron transport was caused by a
decrease of the intra-thylakoid pH that could be identified by a relative increase of the proton motive force
(pmf) with respect to the pmf generated when the light intensities were increased. The pmf for leaves under
decreasing CO2 concentrations and decreasing temperatures ranged from 0.019 to 0.0543 and from 0.019 -
0.0589 respectively. The pmf generated during the increase of light intensities (0.0069 - 0.0376) did not altered
the ke.

vi
The efficiency of photosystem II (ᶲPSII) decreased during all environmental scenarios. Nevertheless,
under decreasing CO2 concentrations and decreasing temperatures the inefficiency of PSII was caused mainly
by losses of photochemical quenching (qp) than a reduction of the maximum quantum efficiency of PSII
photochemistry (Fv'/Fm'). On the other hand, the inefficiency of PSII under increasing light intensities was due
to a simultaneous loss of qp and Fv'/Fm'. The effect of pmf over the non-photochemical quenching (NPQ) was
observed when plotting these parameters together. Both parameters increased when subjecting the leaves to
increasing light intensities and decreasing CO2 concentrations. There was not a clear trend for the relationship
of NPQ and pmf under decreasing temperatures.
The ratio H+/e
-, represented by a linear relationship between ETR through PSII and the flux of protons
across the thylakoid membrane (vH+), was kept relatively constant when leaves were exposed to increasing light
intensities. In the same way, ke and the conductivity of the thylakoid membrane to protons (gH+) were also
maintained unaltered when increasing light intensity. In contrast, the relationship between ETR through PSII
and vH+ for leaves exposed to decreasing CO2 concentrations was found to have an exponential or linear trend
(it changed among the different studied leaves). It means that the stoichiometries of ATP and NADPH were
altered by decreasing CO2 concentrations. Contrarily to the effect of light intensities over gH+, decreasing CO2
concentrations lowered gH+ in a range between 4.6 to 6.6 fold. Finally, the relationship between ETR through
PSII and vH+ for leaves exposed to decreasing temperatures did not followed the expected pattern as observed
for CO2 concentrations. However, the relationship between ke and gH+ was comparable to the one observed
when the leaves were subjected to decreasing CO2 concentrations. Although, in this case the values for gH+
decreased in less proportion (from 1.9 to 3.8 fold) when the temperatures were diminished.
The results suggests that the mechanisms by which the electron fluxes are regulated, when the
metabolism in the stroma is reduced by decreasing CO2 concentrations or temperatures, work identically.
Similarly, when taking in consideration the relationships between ke Vs. gH+ for both environments, it seems
that the mechanisms regulating the proton fluxes across the thylakoid membrane work in the same manner
too. However, the later cannot be stated with certainty due to possible inaccuracy in the data as described
below. On the other hand, the regulation of proton fluxes across the thylakoid membrane under increasing
light conditions differed from the observed at decreasing CO2 concentrations by having an non-altered gH+ and
lower pmf
The relationships between NPQ Vs. pmf and ETR through PSII Vs. vH+ under decreasing temperatures
were very peculiar and totally out of the expectations. It may be that the plants were totally stressed, taking
into account that each leaf was subjected to extreme environments during three consecutive days, thereby
affecting the expected results. On the other hand, it is very possible that the equipment to measure
absorbance changes at 520 nm still needs to be fine-tuned to reduce noisy data.

1
1. INTRODUCTION
1.1 THEORETICAL BACKGROUND
Components involved in electron and proton fluxes in leaves
The major role of the photosynthetic apparatus of higher plant thylakoids is to transduce light energy
into ATP and reductants (NADPH) to meet the metabolic requirements for carbon assimilation and other
energy requiring processes (Baker et al. 2007; Raines 2011; Yamori et al. 2011; Foyer et al. 2012). Light-
harvesting complexes capture and absorb light to transfer excitation energy to the reaction centres of
photosystem II (PSII) and photosystem I (PSI) to drive the primary photochemical reactions and create a
separation of electrical charge (Figure. 1). These light-driven charge separations at PSI and PSII drive electron
flux from water to terminal electron acceptors (Baker et al. 2007). The linear electron flux (LEF) from water
through the PSII and PSI reaction centres is coupled with the release of protons inside the lumen. The
accumulation of protons produce an electrochemical potential difference, or proton motive force (pmf), across
the thylakoid membrane (Takizawa et al. 2007; Baker et al. 2007). A cyclic electron flux around PSI (CEF1) can
increase the accumulation of protons in the lumen and contribute to the pmf. The activation of CEF1 has been
considered to be a mechanism to trigger non-photochemical quenching (NPQ) to protect plant from
photodamage (Foyer, et al. 2012) or correct imbalances in the ratio ATP/NADPH (Avenson et al. 2005). The pmf
drives ATP synthesis by the transport of protons through the ATP synthase back into the stroma ((Takizawa et
al. 2007; Baker et al. 2007). The pmf is comprised by two components: the electric field (Δψ) and the (ΔpH)
gradient. The ΔpH specifically modulates non-photochemical quenching (NPQ) by activating the enzime
violaxanthing de-epoxidase and protonation of the antenna PsbS protein. Besides, ΔpH controls the oxidation
of QH2 at the cytochrome b6f , thereby, regulating the electron transport rate (Bakker, et al. 2007; Foyer, et al.
2012).
The overall rate of leaf photosynthesis can fluctuate according to environmental factors such as variations
in irradiance and temperature. In conditions where irradiance is limiting, energy transfer to the reaction
centres needs to be maximized. If irradiance is not limiting, it is possible to have an over-excitation of the
reaction centres due to an increased production of ATP and NADPH caused by higher LEF. The later could lead
to photodamage. On the other hand, plants use ATP and reductants not only for carbon assimilation but also
for other metabolic process with different stoichiometric requirements. Thus, besides having to regulate the
rate of excitation of the reaction centres when CO2 assimilation is restricted (light limitation/surplus), leaves
also have to regulate the ratio of ATP to NADPH being produced by the thylakoid photosynthetic apparatus.
(Baker et al. 2007).

2
Figure 1. Schematic representation of the electron (orange arrows) and proton transfers (blue arrows), and associated processes
that can occur as a result of light absorption by the thylakoid photosystems. Plastoquinone (PQ), plastiquinol (PQH2), ferredoxin
(Fd), plastocyanin (Pc), violaxanthin de-epoxidase (VDE), violaxanthin (V), antheraxanthin (A) and zeaxanthin (Z). The brown arrow
represents loss of heat regulated by energy-dependent quenching (qE) (Baker et al. 2007).
PSII photosystem
Photochemistry of PSII competes with the processes of fluorescence and heat loss for excitation energy in
the pigment antenna of PSII. PSII fluorescence emission is used to monitor changes in photochemistry,
provided that the rate constants for fluorescence and heat loss do not change. The PSII operating efficiency,
measured through Chlorophyll a fluorescence, is related linearly to linear electron flux. It allows estimating the
Linear Electron Flux (LEF) through PSII (Baker et al. 2007; Baker 2008). In addition, a linear relationship is
observed between PSII operating efficiency and CO2 assimilation when photorespiration is inhibited. In this
case, the CO2 assimilation is the only major sink for ATP and NADPH. Hence, PSII operating efficiency can be
used to monitor LEF and ᶲCO2 changes (Baker 2008).
When the quantum yield of PSI photochemistry and PSII operating efficiency are measured
simultaneously at different light intensities, linear relationships between them can be observed (Harbinson et
al. 1989; Baker 2008). The operation of linear electron flux (LEF) from water through PSII and PSI to electron
acceptors requires similar electron fluxes through the reaction centres of both PSII and PSI. (Baker 2008).
3
In many circumstances, the rate at which NADPH and ATP are consumed determines ᶲPSII. The rate of
carbohydrate transport out of the cell, CO2 supply from the atmosphere through the stomata, rates of
regeneration of ribulose 1,5-bisphosphate are the main factors that controls affect NADPH and ATP
consumption (Baker 2008).
PSI photosystem
Measurements of PSI electron transport are often focused on analysing limitations of PSI electron
transport on its donor and acceptor side; and, to measure relative contributions of linear and cyclic fluxes to
the regeneration of P700 from P700+
(Baker et al. 2007).
In order to have a continuous electron flux through PSI, the following requirements must be met: (1)
there must be molecules of P700 which can be photochemically oxidized; (2) an electron transport chain that is
capable of transferring the electron from P700 to ferredoxin; (3) an electron donor system receiving electrons
via either the linear or cyclic pathways that can re-reduce P700+; and (4) metabolism (or a non-metabolic
electron acceptor activity, such as O2 reduction) that will reoxidize reduced ferredoxin. A limitation of any of
these requirements will decrease the light-use efficiency of PSI (Baker et al. 2007).
Cyt-b6/f and ATP synthase complexes
The Cyt b6/f complex acts in both linear electron transport (production of ATP and NADPH) and cyclic
electron transport (ATP generation only). In the linear electron transport system, Cyt b6/f mediates the electron
transfer between PSII and PSI by oxidizing QH2 and reducing Pc. The oxidation of QH2 occurs in the Cyt b6/f. The
rate of oxidation of QH2 is the limiting step in the electron transport chain between PSII and PSI. On the other
hand, the APT synthase is a macromolecule which couples the energy-donating processes of proton transfer
from the lumen to stroma to form ATP. It is activated by the pmf induced by the light (Tikhonov, 2013).
There is a strong linear relationship between chloroplast electron transport rate (ETR) and cytochrome
b6/f and ATP synthase complexes content (Yamori et al. 2011) when leaves are exposed to high irradiance. At
low irradiance, the ETR (on an absorbed light basis) is similar for all non-stressed C3 leaves (von Caemmerer et
al. 2010). However, the manner in which each complex does this and their relative contributions are distinctly
different. The Cyt b6/f complex exhibits much tighter control of electron transport capacity and photosynthesis
than that of the ATP synthase complex content (Yamori et al. 2011). Moreover, the electron transport capacity
is strongly related to the cytochrome f content per unit of leaf area across a diverse range of C3 species (von
Caemmerer et al. 2010).
4
1.2 PROBLEM DEFINITION
To support the forecasted growth in the human population of 10 billion before reaching a plateau in the
later part of this century, large increases in crop yields will be required (Zhu et al. 2008; Evans 2013). Increasing
the yield potential is viewed as an important strategy for achieving this required increase in yield. Nevertheless,
retrospective comparisons of cultivars released over time, but grown concurrently under favourable conditions
with weed, pest, and disease control and physical support to prevent lodging, reveal that while modern
cultivars yield more grain, they have similar total aboveground biomass (Evans 2013).
Rice and wheat yields have more than doubled over the past half century since modern semi-dwarf
varieties with high harvest indices were released in the mid-1960s. However, as harvest indices are close to the
theoretical maximum and further large increases in harvest index are unlikely, comparatively little of this
increase can be attributed to increased biomass (Parry et al. 2011). Moreover, massive increases in biomass
production as a result of improvements in canopy architecture are questionable because canopy architecture is
now also close to optimal (von Caemmerer et al. 2010). In addition, an increase in leaf area index may not
result in a higher crop biomass since this is already high in most crops (Horton 2000). Improvements in
agronomic practices are also largely responsible for the increased yield. However, improvements in agronomic
practice alone probably would not satisfy the increasing food demand in the coming decades(Parry et al. 2011).
In the absence of any constraints, an increase of photosynthesis will increase crop yields as shown by the
effects of CO2 enrichment experiments. Due to the fact that carbon is accumulated during all the growing
season by crops, a small increase in the rate of net leaf photosynthesis will represent an increase of biomass
and therefore yield. In addition, several factors contributing to an increase in total photosynthesis such as
canopy architecture, light interception, and photosynthetic duration have already been optimized, as
mentioned before. Hence, an increase in photosynthesis will only be achieved by an increase in the
photosynthetic rate per unit leaf area (Parry et al. 2011). Moreover, the theoretical photosynthetic energy
conversion efficiency of C3 plants is about 4.6% taking into account 1000 kJ of incident solar radiation at 30 °C
with a CO2 atmosphere concentration of 380 ppm, while the recorded energy conversion efficiency in the field
is usually less than one-third of this value. It means that there is possibility to improve photosynthetic energy
conversion efficiency (Zhu et al. 2008). Thus, improvements in rates of photosynthesis of individual leaves
within the canopy have become the focus of current efforts to increase crop yields (von Caemmerer et al. 2010;
Adachi et al. 2013; Evans 2013). In that logic, it is of great importance to understand the operation, regulation,
and limitations of photosynthesis (Harbinson, 2012).

5
According to Bakker et al., (2007), knowledge regarding to the structure, composition and function of the
components of photosynthetic apparatus is nowadays well understood; nevertheless, few is known about the
interaction of this components at different environmental conditions in vivo. The application of biophysical
techniques such as gas exchange, chlorophyll fluorescence and absorbance changes at 820 and 520 nm permits
to understand the regulation and limitations of the photosynthetic apparatus in a non-destructive way. In this
context, few studies have been realized in leaves of the Solanaceae species Juanulloa aurantiaca. By the use of
some of the biophysical techniques mentioned above (gas exchange, chlorophyll fluorescence and absorbance
changes at 820 nm), such studies showed the responses of the thylakoid electron transport of this C3 plant
under different environmental conditions in which the photosynthetic photon flux densities (PPFD), CO2 and O2
concentrations were modulated (Harbinson, 1994; Genty and Harbinson, 1996). Nevertheless, the regulation of
the proton circuit in the thylakoid discs of this plant species is still unknown due to the fact that spectroscopic
tools, able to measure absorbance changes at 520 nm, were not used in these experiments.
In addition, the majority of the research, in which a broad combination of non-invasive techniques has
been applied, has only considered variations in light intensity and CO2 and O2 concentrations. Not much
information has been reported about the regulation of the photosynthetic apparatus in vivo under
environmental conditions different than the mentioned above (i.e., temperature changes). With these
antecedents, the scope of this research is to generate more information regarding to the regulation of the
photosynthetic apparatus of this Solanaceae species (J. aurantiaca) through the use of a broad combination of
non-invasive techniques. Knowledge related to the photosynthetic physiology of this plant family might be
used by breeding programs in order to improve the biomass production of some crop species that have
horticultural and economical potential such as potato, egg plant, tomato, tobacco, among others.
1.3 AIM AND RESEARCH QUESTIONS
The aim of this research is to examine the regulation of the electron and proton fluxes produced in the
thylakoid discs on leaves of the Solanaceae species J. aurantiaca under different environmental conditions (i.e.,
increasing irradiance, decreasing CO2 concentration and decreasing temperature) through the use of non-
invasive biophysical techniques in vivo.
Do the mechanisms involved in the regulation of electron flux work in the same manner when leaves of J.
aurantiaca are exposed to decreasing CO2 concentrations or decreasing temperatures?
Do the mechanisms involved in the regulation of proton flux work in the same manner when leaves of J.
aurantiaca are exposed to increasing light intensity, decreasing CO2 concentrations or decreasing
temperatures?

6
1.4 HYPOTHESIS
The mechanisms involved in the regulation of electron fluxes when the metabolism in the stroma is
reduced by decreasing CO2 concentrations or decreasing temperatures will work in a similar way. A decrease of
the metabolism in the stroma will reduce the consumption of ATP and NADPH, producing acidification in the
lumen, thereby stimulating NPQ and also reducing the rate of oxidation of QH2.
The mechanisms involved in the regulation of proton fluxes when the metabolism in the stroma is
reduced by decreasing CO2 concentrations or decreasing temperatures will work in a similar way. A decrease of
the metabolism in the stroma will reduce the consumption of ATP, thereby producing acidification in the lumen
(high pmf). Nevertheless, the conductance to protons of the ATP synthase will be reduced to satisfy a low
demand of ATP in the stroma. This will increase the NPQ.
The mechanisms involved in the regulation of proton fluxes will work differently under circumstances in
which the metabolism in the stroma is not suppressed. The conductance to protons of the ATP synthase will be
maintained relatively non-altered to satisfy the demand of ATP by the metabolism in the stroma. The pmf will
be lower when compared to the abovementioned situation.

7
2. MATERIALS AND METHODS
2.1 Plant material and grow conditions
Four cuttings of J. aurantiaca were planted in pots (2.85 litres capacity) containing potting soil and
fertilized with 13.47g of Osmocote Pro (17-11-10). The plants were placed in a climate chamber with relative
humidity of 70%, a day/night temperature of 25/23 °C, ambient CO2 concentration and 12hours of photoperiod
with 600 μmolm-2
s-1
of fluorescent light. All plants were watered to conserve the potting soil at field capacity
throughout experimentation.
2.2 Measuring photosynthetic performance
To evaluate the photosynthetic performance of each plant, a customised equipment designed by
Wageningen University was used. This equipment offered the opportunity to measure in vivo the following
photosynthesis parameters, described below: leaf CO2 exchange, chlorophyll fluorescence with red and green
beams, and absorbance changes at 520 and 820 nm in leaves exposed to different light intensities,
temperatures and CO2 concentrations. The use of a 560 nm excitation beam to measure chlorophyll
fluorescence is more suitable to establish relationships between chlorophyll fluorescence parameters and the
parameters obtained by measuring absorbance changes produced with 820 and 520 nm beams, as these
wavelengths (520, 560, and 820 nm) are less absorbed by the leaf, which is not the case for red. On the other
hand, the red excitation beam for chlorophyll fluorescence was used to establish relationships between the
quantum efficiency of CO2 and ᶲPSII in the different environments (Annexes 6-8) because the actinic light had
the same wavelength as the red excitation beam (660 nm), making the data more suitable to relate. All the
measurements were realized when the gross assimilation of CO2 reached a steady state. Photorespiration was
avoided in this study fixing the O2 concentration in the gas inflow at 2% to evaluate only the effect of the Calvin
Cycle as ATP and NADPH sink.
To evaluate the photosynthetic performance under different light intensities, the leaves were exposed to
the following increasing photosynthetic photon flux densities (PPFD): 25, 50, 100, 200, 300, 500, 600, 800, 900,
1200 and 1300 mol m-2
s-1
. This values were chosen to generate a more accurate resolution, especially at lower
PPFD’s. The saturating light intensity was different for almost all the four replicates used, i.e. the saturating
light intensity for two replicates was 800 μmol m-2
s-1
;meanwhile, for the other two replicates, the saturating
light intensities were 600 and 1200 μmol m-2
s-1
(Appendix 6).

8
To evaluate the photosynthetic performance under different CO2 concentrations and temperatures, the
saturating light intensity for each leaf was used. To assess the photosynthetic performance in leaves exposed to
decreasing CO2 concentrations, the next decreasing scale was used:500, 400, 350, 300, 250, 200, 150, 100, 50
and 35 ppm. In the same way, leaves were exposed to a decreasing temperatures to evaluate the
photosynthetic performance:25, 21, 19, 17, 15, 13, 11, 9 and 6 °C.
CO2 exchange
Infrared gas analysers “ADC” were used to measure leaf CO2 exchange by difference in concentration of
ingoing and outgoing flows in the leaf chamber system. This allowed to assess the net assimilation rate of
leaves at different light intensities, temperatures and CO2concentrations. Measurements of CO2 exchange were
recorder with the help of chart recorders and software developed in Wageningen University.
Chlorophyll fluorescence
Red and green modulated beams were used to measure the next chlorophyll fluorescence parameters
described in Table 1. The electron transport rate (ETR) through PSII was calculated using the following
equation:
𝐸𝑇𝑅𝑃𝑆𝐼𝐼 = 𝐼 × 𝐴𝑙𝑒𝑎𝑓 × 𝑓𝑟𝑎𝑐𝑡𝑖𝑜𝑛𝑃𝑆𝐼𝐼 × 𝐹𝑞 ′
𝐹𝑚 ′
Where,
I: incident PPFD on the leaf
A leaf: spectral absorbance of the leaf
fractionPSII: fraction of incident photons that are absorbed by PSII
Fq’/Fm’: operating efficiency of PSII
The absorptivity of the leaf was obtained with a spectro radiometer enclosure with a light covering a wave
length spectrum from 400 to 700 nm, all developed in Wageningen University.
Absorbance changes at 820 nm
To measure the relative efficiency of PSI and the rate constant for electron transport between PQH2 and
P-700+
(ke) absorbance changes at 820 nm were measured in the leaf. To know the relative efficiency of PSI, it is
necessary to know the size of the P700 pools, non-oxidized [P7000] and oxidized [P700
+]. Later, the following
equation was applied:
9
ᶲ𝑃𝑆𝐼 = 𝑃7000
𝑃7000 + 𝑃700+
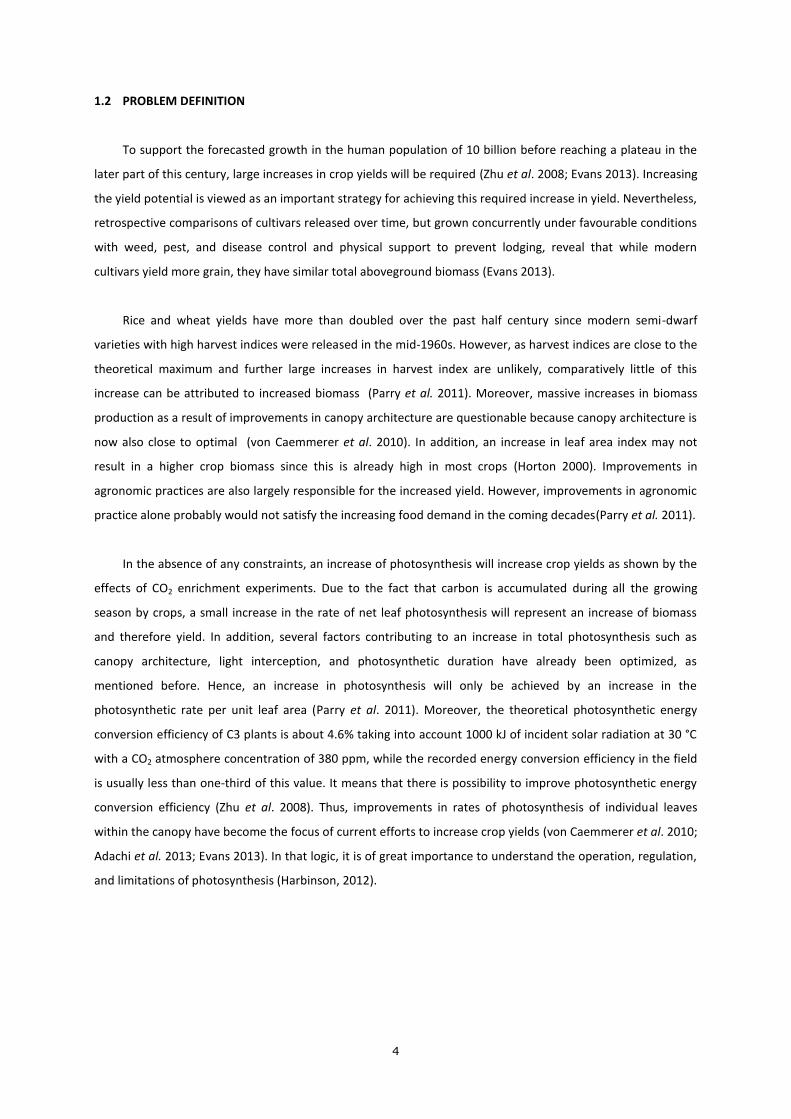
For this, it was necessary to know the absorbance at 820 nm during the following steps described in
chronological order (Figure 2):
1) actinic light turned on (P700 partially oxidized),
2) actinic light turned off (P700 reduced)
3) far-red light turned on (P700 almost fully oxidized)
4) fast flash of broad band irradiance (P700 fully oxidized)
5) total darkness after a quick flash of far red light (P700 fully reduced)
The rate constant for electron transport between PQH2 and P-700+
(ke) was measured during the change in
absorbance from step 1) to 2).
Figure 2. Raw data of absorbance changes at 820 nm. Y axis indicates the amplitude of the signal measured in voltage. X
axis indicates the time in ms.

10
Table 1. Chlorophyll fluorescence parameters evaluated in this study. Table modified from Baker et al. (2007).
Fluorescence
parameter Definition Physiological relevance
F, F’
Fluorescence emission from
dark or light adapted leaf
respectively.
Provides little information on the photosynthetic performance as
they are influenced by many factors.
Fo, Fo’
Minimal fluorescence from
dark and light adapted leaf
respectively.
Level of fluorescence when PSII primary quinone electron
acceptors are maximally oxidized (PSII centres ‘open’)
Fm, Fm’
Maximal fluorescence from
dark and light adapted leaf,
respectively.
Level of fluorescence when QA is maximally reduced (PSII centres
‘closed’).
Fv, Fv’
Variable fluorescence from
dark and light adapted leaf,
respectively.
Demonstrates ability of PSII to perform primary photochemistry
(QA reduction).
Fq’ Difference in fluorescence
between Fm’ and F’.
Photochemical quenching of fluorescence caused by (PSII centres
‘open’)
Fv/Fm
Maximum quantum
efficiency of PSII
photochemistry
Maximum efficiency at which light absorbed by PSII is converted to
chemical energy (QA reduction).
Fq’/Fm’ PSII operating efficiency
Estimates the efficiency at which light absorbed by PSII is used for
photochemistry (QA reduction); at a given light intensity, it
provides an estimate of the quantum efficiency of linear 4electron
transport through PSII; has previously been termed ΔF/Fm’ and ᶲPSII
in the literature.
Fq’/Fv’ PSII efficiency factor
Relates the PSII maximum efficiency to the PSII operating
efficiency. Nonlinearly related to the proportion of PSII centres
that are ‘open’ (QA oxidized). Mathematically identical to the
coefficient of photochemical quenching, qp
NPQ Non – photochemical
quenching
Estimates the non-photochemical quenching from Fm to Fm’;
monitors the apparent rate constant for non-radiative decay (heat
loss) from PSII and its antennae.
Electrochromic shift (ECS) measurements.
To assess ECS parameters (Table 2), absorbance changes at 520 nm were produced with an
spectrophotometer incorporated in the leaf chamber.

11
Table 2.Electrochromic shift parameters evaluated in this study. Table modified from Baker et al. (2007).
Electrochromic
shift parameter Definition Physiological relevance
ECSt
The total rapid (<1 s) change in ECS
signal upon rapidly switching off
actinic light from steady state.
Proportional to the total light-dark difference in
transthylakoid pmf.
gH+
The inverse of the lifetime of the rapid
decay of ECS, upon rapidly switching
off the actinic light from steady state
Proportional to the aggregate conductivity (or
permeability) of the thylakoid membrane to
protons, predominantly determined by ATP
synthase activity.
VH+
The initial rate of decay of the ECS
signal to a quasi-stable state, tens to
hundreds of ms after rapidly switching
off actinic light from steady state
Proportional to the proton flux through the
photosynthetic apparatus and thus ATP synthesis;
can be used to estimate changes in proton
translocation by circular electron flux (CEF1).

12
3. RESULTS
3.1 Photosynthesis regulation under light intensity changes
It can be observed in Figure 3-A, that ke had the trend to be non-altered while the ᶲPSII decreased in
leaves exposed to an increasing irradiance. The relationship between Fv’/Fm’ and qp (Figure 3-B), shows that
decreasing values of Fv’/Fm’ were accompanied by reductions in qp when increasing gradually the light
intensity. The relationship between NPQ and Fv’/Fm’ (Figure 3-C) shows that both parameters were inversely
related. While NPQ increased, Fv’/Fm’ decreased with an increasing light intensity. It can be observed in Figure
3-D that the ᶲPSI decreased while ke was maintained constant with an increasing light intensity.
Figure 3.Relationships between: (A)ᶲPSII Vs. Ke, (B) Fv’/Fm’ Vs. qp, (C) NPQ Vs. Fv’/Fm’, and (D) ᶲPSIVs. Ke when increasing gradually the light intensity in Juanulloa aurantiaca grown under 600 μmol m-2 s-1 of irradiance. Different symbols represent individual leaves measured from different plants.
0.0
0.2
0.4
0.6
0.8
1.0
0 20 40 60 80 100
ᶲPSI
I
ke
R1 R2 R3 R4A
0.0
0.2
0.4
0.6
0.8
1.0
0.0 0.2 0.4 0.6 0.8 1.0
Fv'/
Fm'
qp
R1 R2 R3 R4B
0.0
0.5
1.0
1.5
2.0
2.5
3.0
0.0 0.2 0.4 0.6 0.8 1.0
NP
Q
Fv'/Fm'
R1 R2 R3 R4C
0.0
0.2
0.4
0.6
0.8
1.0
0 20 40 60 80 100
ᶲPSI
ke
R1 R2 R3 R4D

13
In Figure 4-A, it can be observed that the pmf had the trend to increase while ke was maintained almost
constant when increasing gradually the light intensity. Figure 4-B shows that an increase of the ETR through
PSII was tightly coupled to an increase of VH+. when the light intensity was increased gradually. The relationship
between ke and gH+, shows that both parameters were not to altered when increasing gradually the light
intensity (Figure 4-C).In Figure 4-D it can be observed that NPQ and pmf increased when the light intensity was
increased. Measurements for R2 were too noisy; thereby, they were excluded.
Figure 4. Relationships between: (A) ke Vs. pmf, (B) ETR of PSII Vs. vH+,(C) ke Vs. gH+ and (D) NPQ Vs. pmf when increasing gradually the light intensity in Juanulloa aurantiaca grown under 600 μmol m-2 s-1 of irradiance. Different symbols represent individual leaves measured from different plants.
0
20
40
60
80
0 0.02 0.04 0.06 0.08
k e
ECSt
R1 R3 R4A
0
50
100
150
200
250
300
350
400
450
500
0.0 0.5 1.0 1.5 2.0
ETR
PSI
I
vH+
R1 R3 R4B
0
20
40
60
80
100
120
0 10 20 30 40 50 60
k e
gH+
R1 R3 R4C
0.0
0.5
1.0
1.5
2.0
2.5
3.0
3.5
4.0
0 0.01 0.02 0.03 0.04 0.05 0.06
NP
Q
ECSt
R1 R3 R4D

14
3.2 Photosynthesis regulation under CO2 concentration changes
It can be observed in Figure 5-A, that ke and ᶲPSII decreased when the leaves were exposed to a
decreasing CO2 concentration. The relationship between Fv’/Fm’ and qp (Figure 5-B), shows that decreasing
values of Fv’/Fm’ were accompanied by a reduction of qp especially during the first decreasing steps of CO2
concentration, i.e. from 500 to approximately 200 ppm. At lower CO2 concentrations, it can be observed that qp
diminished in greater proportions than Fv'/Fm'. The relationship between NPQ and Fv’/Fm’ (Figure 5-C) shows
that both parameters were inversely related. While NPQ increased, Fv’/Fm’ decreased with a decreasing CO2
concentration. It can be observed in Figure 5-D that ᶲPSI and ke declined simultaneously when the CO2
concentration was reduced. However, this relationship was not observed when the CO2 concentration reached
35 ppm. At this CO2 concentration, ᶲPSI increased while ke decreased.
Figure 5. Relationships between: (A)ᶲPSII Vs. Ke, (B) Fv’/Fm’ Vs. qp, (C) NPQ Vs. Fv’/Fm’, and (D) ᶲPSI Vs. Ke when decreasing gradually the air CO2 concentration from 500 to 35ppm in Juanulloa aurantiaca grown under 600 μmol m-2 s-1 of irradiance. Different symbols represent individual leaves measured from different plants.
0.0
0.2
0.4
0.6
0.8
1.0
0 20 40 60 80 100
ᶲP
SII
ke
R1 R2 R3 R4A
0.0
0.2
0.4
0.6
0.8
1.0
0.0 0.2 0.4 0.6 0.8 1.0
Fv'/
Fm'
qp
R1 R2 R3 R4B
0.0
0.5
1.0
1.5
2.0
2.5
3.0
3.5
0.0 0.2 0.4 0.6 0.8 1.0
NP
Q
Fv'/Fm'
R1 R2 R3 R4C
0.0
0.2
0.4
0.6
0.8
1.0
0 20 40 60 80 100
ᶲPSI
ke
R1 R2 R3 R4D

15
The relationship between ke and pmf, shows that both parameters were inversely related if excluding the
measurements at 35 ppm CO2 concentration (Figure 6-A). When decreasing the CO2 concentration ke decreased
while pmf increased. Observations for R3 did not follow this trend during the first decreasing CO2 steps. Figure
6-B shows that ETR through PSII and VH+ decreased with a decreasing CO2 concentration. The relationship
between ke and gH+ (Figure 6-C), shows that both parameters decreased when leaves were exposed to
decreasing CO2 concentrations. Figure 6-D shows the relationship between NPQ and pmf. Both parameters
increased when the CO2 concentration was decreased.
Figure 6. Relationships between: (A) ke Vs. pmf, (B) ETR of PSII Vs. vH+,(C) ke Vs. gH+ and (D) NPQ Vs. pmf when decreasing gradually the air CO2 concentration from 500 to 35ppmin Juanulloa aurantiaca grown under 600 μmol m-2 s-1 of irradiance. Different symbols represent individual leaves measured from different plants.
0
20
40
60
80
0.00 0.02 0.04 0.06 0.08
k e
ECSt
R1 R2 R3 R4A
0
50
100
150
200
250
300
350
400
450
500
0.0 0.5 1.0 1.5 2.0
ETR
PSI
I
νH+
R1 R2 R3 R4B
0
20
40
60
80
100
120
0 10 20 30 40 50 60
k e
gH+
R1 R2 R3 R4C
0.0
0.5
1.0
1.5
2.0
2.5
3.0
3.5
4.0
0.00 0.01 0.02 0.03 0.04 0.05 0.06
NP
Q
ECSt
R1 R2 R3 R4D

16
3.3 Photosynthesis regulation under temperature changes
It can be observed in Figure 7-A, that ke and ᶲPSII decreased when the leaves were exposed to decreasing
temperatures. With an exemption for R2 which did not have the same trend at 25 and 21 °C. The relationship
between Fv’/Fm’ and qp (Figure 7-B), shows that both parameters decreased when temperature was decreased
gradually. Nonetheless, it can be seen that Fv’/Fm’ was relatively lowered in less proportion than qp. The
relationship between NPQ and Fv’/Fm’ (Figure 7-C) shows that both parameters were inversely related. While
NPQ increased, Fv’/Fm’ decreased with declining temperatures. It can be observed in Figure 7-D that ᶲPSI and
ke were reduced with declining temperatures. It can be observed that data from R2 continued being noisy as
can be observed in Figures 7-A and B.
Figure 7. Relationships between: (A)ᶲPSII Vs. Ke, (B) Fv’/Fm’ Vs. qp, (C) NPQ Vs. Fv’/Fm’, and (D) ᶲPSI Vs. Ke when decreasing gradually the temperature from 25 to 6 °C in Juanulloa aurantiaca grown under 600 μmol m-2 s-1 of irradiance. Different symbols represent individual leaves measured from different plants.
0.0
0.2
0.4
0.6
0.8
1.0
0 20 40 60 80 100
ᶲP
SII
ke
R1 R2 R3 R4A
0.0
0.2
0.4
0.6
0.8
1.0
0.0 0.2 0.4 0.6 0.8 1.0
Fv'/
Fm'
qp
R1 R2 R3 R4B
0.0
0.5
1.0
1.5
2.0
2.5
3.0
0.0 0.2 0.4 0.6 0.8 1.0
NP
Q
Fv'/Fm'
R1 R2 R3 R4C
0.0
0.2
0.4
0.6
0.8
1.0
0 20 40 60 80 100
ᶲP
SI
ke
R1 R2 R3 R4D

17
Figure 8-Ashows that the relationship between ke and pmf did not follow a determined pattern as
observed previously in the different environmental scenarios. Nevertheless, it can be seen that during the first
decreasing temperature steps both parameters were inversely related. While ke decreased, pmf increased. At
lower temperatures pmf had the trend to decrease in the cases of R3 and R4. For R1, it is not possible to
describe the trend because the data is scattered. Figure 8 (C) shows that decreases of ke were accompanied by
decreases of gH+ when the temperature was decreased. The data obtained for the relationships between ETR
through PSII Vs. VH+(Figures 8-B) and NPQ Vs. pmf (Figure 8-D)was very scattered, making impossible to
describe trends as previously, when the leaves were exposed to increasing light intensities or decreasing CO2
concentrations.
Figure 8. Relationships between: (A) ke Vs. pmf, (B) ETR of PSII Vs. vH+,(C) ke Vs. gH+ and (D) NPQ Vs. pmf when decreasing gradually the temperature from 25 to 6 °C in Juanulloa aurantiaca grown under 600 μmol m-2 s-1 of irradiance. Data for R2 was not taken into account due to electric interferences occurred during the measurement day.
0
10
20
30
40
50
60
70
80
0.00 0.02 0.04 0.06 0.08
k e
ECSt
R1 R3 R4A
0
50
100
150
200
250
300
350
400
450
500
0.0 0.5 1.0 1.5 2.0
ETR
PSI
I
vH+
R1 R3 R4B
0
20
40
60
80
100
120
0 10 20 30 40 50 60
k e
gH+
R1 R3 R4C
0.0
0.5
1.0
1.5
2.0
2.5
3.0
3.5
4.0
0.00 0.02 0.04 0.06 0.08
NP
Q
ECSt
R1 R3 R4D

18
4. DISCUSSION
As expected, when comparing ke behaviour at changing environments (i.e. increasing light intensities,
decreasing CO2 concentrations and decreasing temperatures) it could be seen that at different light intensities
ke had the trend to be unaltered while at declining the CO2 concentrations and temperatures, it had the trend
to decrease (Appendix 1). Genty and Harbinson (1996), found that ke was almost constant, with values around
55 s-1
, when leaves of J. aurantiaca were exposed to increasing light intensities, which corresponds to the
results obtained in this research (Appendix1-A). According to Harbinson (1994), a non-altered ke accompanied
with a decreasing ᶲPSII, ᶲPSI, and Fv’/Fm’ is commonly found with increasing light intensities, which
corresponds to the results shown in Figure 3. Laisk and Oja (1994), stated that an unaltered ke is due to an
absent or constant proton counter pressure at the site of plastoquinol oxidation. However, results obtained for
pmf, which according to Kanazawa and Kramer (2002) could be taken as an indicator of ΔpH, showed that there
was a reduction in the intra-thylakoid pH that did not altered ke(Figure 4-A). It is explained by a low phosphate
potential represented by the ratio [ATP]/([ADP][Pi] (Tikhonov, 2013), which implies that there was enough
amount of ADP and Pi caused by ATP metabolism in the Calvin cycle. In other words, the efflux of protons from
the lumen to the stroma to produce ATP was not limited (enough to maintain a constant H+/e
- ratio) so there
was not a high acidification in the lumen that could avoid the oxidation of QH2 and diminish ke. On the other
hand, a reduction of metabolism in the stroma by decreasing CO2 concentrations or temperatures reduces the
demand for NADPH and ATP by the Calvin Cycle, increasing the control of electron transport (drop of ke)
through a decrease of the intra-thyllakoid pH (Harbinson, 1994; and, Genty and Harbinson, 1996). According to
Tikhonov, A. (2013), this reduction in ATP consumption increases the phosphate potential, meaning with it less
amount of ADP and Pi for the formation of ATP, (i.e. less efflux of protons from the lumen to the stroma) which
causes a decrease of the intra-thyllakoid pH that avoids the oxidation of QH2 and diminishes the ke. In
agreement to these staments, the results shown in Figures 6-A and 8-A, for declining CO2 concentrations and
declining temperatures respectively, represent how a decrease in the intra-thyllakoid pH, identified through an
increase in pmf lessened the ke. When comparing the ranges for pmf changes obtained during increasing light
intensities (0.0069 - 0.0376) with the ranges for pmf changes obtained when decreasing CO2 concentrations
(0.019 - 0.0543) and decreasing temperatures (0.019 - 0.0589), it could be observed that even when the
differences between the highest and lowest values of the ranges were similar for all the environmental
scenarios, the pmf changes when increasing light intensities were produced in a lower scale than for declining
CO2 concentrations and declining temperatures. Considering that pmf is an indicator of ΔpH (Kanazawa and
Kramer, 2002), it explains a non-altered ke when increasing light intensities and a diminishing ke when
decreasing the CO2 concentrations and the temperatures.

19
As expected, ᶲPSII decreased while exposing the leaves to increasing light intensities, decreasing CO2
concentrations and decreasing temperatures as can be observed in Figures 3-A, 5-A and 7-A respectively. A
linear relationship between ᶲPSII and ke can be observed when decreasing CO2 concentrations and decreasing
temperatures. This can be explained by the fact that a reduction of the intra-thyllakoid pH simultaneously
stimulated NPQ (Iliola et al 2011), thereby reducing ᶲPSII; and also controlled the oxidation of QH2, thereby
diminishing ke. On the other hand, a decrease of ᶲPSII is not only dependent of Fv’/Fm’, but also of qp. In that
way, a decrease of ᶲPSII due to increasing light intensities was caused by a simultaneous decrease of Fv’/Fm’
and qp (Figure 3-B). Both parameters decreased almost in the same proportion. While Fv’/Fm’ had a decrease
of 26.9%, qp had a decrease of 23.71%. This results does not correspond with the results obtained by Harbinson
(1994),in which the registered decreases for Fv’/Fm’ and qp were approximately 20% and 42% respectively,
when leaves from the same plant species were exposed to increasing light intensities in the range of: 0 to 450
µmol m-2
s-1
. It could be that the plants used by Harbinson (1994) were grown at a lower light intensity than the
used in this experiment (600 µmol m-2
s-1
). The plants used in this experiment were acclimated for a relative
high light intensity showing less accumulation of a reduced pool of QA, represented by less reduction of qp at
high light intensities. On the other hand, the decrease of ᶲPSII due to decreasing CO2 concentrations was
caused principally by a reduction of qp (accumulation of reduced QA) than by a diminishing Fv’/Fm’ as can be
observed in Figure 5-B. In this case, Fv’/Fm’ had a reduction of 40.9%, while qp suffered a reduction of 65.4%.
The same trend was observed by Harbinson (1994), although the decrease for Fv’/Fm’ and qp were
approximately 18.5 and 58% respectively. As mentioned above, it could be that the plants used by Harbinson
(1994) were grown under low light intensities. According to Genty and Harbinson (1996), plants that are
adapted to low light intensities have low capacity to dissipate excess of energy (low NPQ) and the inefficiency
of PSII is caused in greater proportions by accumulation of reduced QA pool. This phenomena can be noticed
when comparing the relative decrease of Fv'/Fm' and qp obtained by Harbinson (1994) with increasing light
intensities (20% Vs 42%) and decreasing CO2 concentrations (18.5% Vs 58%). The decline of ᶲPSII when the
leaves were exposed to decreasing temperatures was due to a relatively higher decline of qp than a decline of
Fv'/Fm', as observed in Figure 7-B. The values of Fv'/Fm' decreased 20.8% while the values of qp decreased
45.1%. It is in agreement with results found for barley and spinach leaves, in which the rate of QA reduction
overtook the rate of non-photochemical dissipation when lowering the temperature (Falks et al. 1996). The
high relative effect of decreasing CO2 concentrations and temperatures on qp was due to accumulation of
reduced QA, caused by a down-regulation of the electron transport through cytb6f (Genty and Harbinson 1996
and Foyer et al. 2012).
A decrease of ᶲPSI was observed while exposing the leaves to increasing light intensities, decreasing
CO2 concentrations and decreasing temperatures as can be observed in Figures 3-D, 5-D and 7-D respectively. A
decrease of ᶲPSI did not have a linear relationship with ke (Figures 3-D) due to the fact the later parameter was
non-altered when the light intensity were increased, as explained above. In contrast, a linear relationship
between ᶲPSI and ke can be observed when decreasing CO2 concentrations and decreasing temperatures.
According to Genty and Harbinson (1996), a decrease of ᶲPSI is caused by the accumulation of photo-oxidized
P700, i.e. during the light response curve. Nevertheless, when the metabolism in the stroma is reduced by

20
decreasing CO2 concentrations or temperatures, the oxidation of P700 can be limited by a lack of electron
acceptors (Genty and Harbinson, 1996), thereby, diminishing the light use efficiency of PSI (Bakker et al. 2007).
It is important to mention that at low CO2 concentrations the linearity between ᶲPSI and ke was broken and an
apparent increase in ᶲPSI was registered. According to Harbinson (1994), it is caused by an accumulation of
reducing equivalents at the donor side of PSI, creating a P700 pool unable to be oxidized (inactive pool of
reduced P700) which is not taken into account in the calculations that determine ᶲPSI. An inactive pool of
reduced P700 produces an overestimation of ᶲPSI while ke continues with a decreasing trend (Figure 5-D).
According to Genty and Harbinson (1996); the inflection point in which the ᶲPSI apparently improves,
determines the lower value of a range of CO2 concentrations at which an effective control of electron transport
can be exerted, i.e. in this experiment an effective control of electron transport was observed at CO2
concentrations above 50 ppm, limit that does not match with the value of 35 ppm obtained by Genty and
Harbinson (1996) in the same plant species. However, the values of ke obtained at a CO2 concentration of 35
ppm were in the range of 15.53 to 18.65 s-1
, values that are similar to the ke (16 s-1
) obtained by Genty and
Harbinson (1996), meaning that could be possible that the IRGA equipment that was measuring the absolute
CO2 concentration of air flowing into the chamber lost sensitivity at this low CO2 concentrations.
In agreement to Bakker (2008), an increasing NPQ was accompanied by a decreasing Fv'/Fm' showing an
inverse linear relationship with increasing light intensities as shown in Figure 3-C. The same phenomena was
observed when the CO2 concentrations and temperatures were decreased as shown in Figures 5-C and 7-C,
respectively. This can be explained by the fact that the mechanisms that activate NPQ are considered to be the
same in all the environmental sceneries. However, it can be observed that reducing the CO2 concentration from
500 to 35 ppm triggered more the formation of NPQ than reducing temperatures from 25 to 6 °C.
The relationship between NPQ and pmf was exponential when the leaves were exposed to increasing light
intensities and decreasing CO2 concentrations as can be observed in Figures 4-D and 6-D, respectively; and
Appendix 8. These results are in agreement with the results obtained by Avenson et al. (2004) in which the
same trend can be observed when leaves of wild-type Nicotiana tabacum xanthi (tobacco) were subjected to
increasing light intensities ranging from 32 to 820 µmol m-2
s-1
and different gas compositions (370 ppm
CO2/21% O2, 50 ppm CO2/21% O2 and 50 ppm CO2/1% O2). However, in previous research realized by Kanazawa
and Kramer (2002), another trend was found when leaves of the same plant species (tobacco) were exposed to
increasing light intensities (45 to 2000 µmol m-2
s-1
) with different gas compositions (2000, 350, 50 and 0 ppm
of CO2 with 21% O2). This difference can be observed even when comparing results obtained for tobacco plants
exposed to similar environments i.e., 370 ppm CO2/21% O2 and 350 ppm CO2/21% O2. In contrast, when leaves
were exposed to decreasing temperatures, there was not a clear trend for the relationship of NPQ and pmf as
can be observe in Figure 8-D. It is possible that the leaves suffered a lot of stress during the experimental
period, taking into account that each leaf was subjected to extreme environments during three consecutive
days, thereby affecting the expected results. On the other hand, it is very possible that the equipment to
measure absorbance changes at 520 nm still needs to be fine-tuned to reduce noisy data. Indeed, when
reviewing literature related to absorbance changes at 520 nm (Kramer, 1999; Sacksteder et al. 2000; Kanazawa

21
and Kramer, 2002; Avenson et al. 2004 and, Avenson et al. 2005) it can be noticed that there is a lot of
variation on the produced data, especially for pmf values.
The ratio H+/e
-, represented by a linear relationship between ETR through PSII and vH+, was kept
relatively constant when leaves were exposed to increasing light intensities (Figure 4-B). This results reconcile
with the results obtained by Sacksteder et al. (2000) and Avenson et al. (2005) in which the same relationship
was obtained for Nicotiana tabacum and Arabidopsis thaliana plants, respectively. In the same way as the ratio
between H+/e
-, it can be observed in Figure 4-C that ke and gH+ were also maintained unaltered when increasing
light intensity. Similar trend for gH+ was observed by Kanazawa and Kramer (2002) in Nicotiana tabacum plants,
concluding that pmf was always above the needed to activate the ATP synthase during light changes. In
contrast and within the noise, the relationship between ETR through PSII and vH+ for leaves exposed to
decreasing CO2 concentrations was found to have an exponential trend for R1, R2 and R4, while for R3 the
trend was more linear (Figure 6-B). It means that the stoichiometries of ATP and NADPH were altered by
decreasing CO2 concentrations.
The lack of electron acceptors in the stroma at low CO2 concentrations (Figure 5-D) was also reflected
in the relationship between ke and pmf (Figure 6-A). It can be seen that a decrease of ke was accompanied by
an increase of pmf until reaching CO2 concentration levels ranging from 100 to 50 ppm. Below these CO2
concentrations the pmf decreased too, showing that besides a down regulation of gH+ (explained below), there
was an attempt to control the ratio H+/e
- by decreasing the pmf. Contrarily to the effect of light intensities over
gH+, decreasing CO2 concentrations lowered gH+ in a range between 4.6 to 6.6 fold (Figure 6-C) which is
congruent with the results found by Kanazawa and Kramer (2002) for Nicotiana tabacum when CO2
concentrations were reduced from 2000 to 0 ppm. Although the relationship between ke and gH+ was not very
clear, being exponential for R1 and R2 and linear for R3 and R4, it can be observed (Figure 6-C) that both
parameters were lessened with decreasing CO2 concentrations. Interestingly, the relationship between ETR
through PSII and vH+ for leaves exposed to decreasing temperatures (Figure 8-B) did not followed the expected
pattern as observed for CO2 concentrations. As mentioned above, it may be possible that the leaves were
under high level of stress due to experimental conditions or it could be that measurements for pmf were too
noisy, thereby affecting the values calculated for vH+. On the other hand, the relationship between ke and gH+
was exponential (Figure 8-C), which is more comparable to the data obtained when leaves were subjected to
decreasing CO2 concentrations, although in this case the values for gH+ decreased in less proportion (from 1.9 to
3.8 fold) when the temperatures were diminished.
The results suggests that the mechanisms by which the electron fluxes are regulated, when the
metabolism in the stroma is reduced by decreasing CO2 concentrations or decreasing temperatures, work in
the same way. Similarly, when taking in consideration the relationships between ke Vs. gH+ for both
environments, it seems that the mechanisms regulating the proton fluxes across the thylakoid membrane work
in the same manner too. However, the later cannot be stated with certainty due to possible inaccuracy in the
data generated by ECS measurements. On the other hand, the regulation of proton fluxes across the thylakoid

22
membrane under increasing light conditions differed from the observed at decreasing CO2 concentrations and
decreasing temperatures by having an non-altered gH+ and lower pmf.

23
5. REFERENCES
Adachi, S., Nakae, T., Uchida, M., Soda, K., Takai, T., Oi, T., … Hirasawa, T. (2013). The mesophyll anatomy enhancing CO2 diffusion is a key trait for improving rice photosynthesis. Journal of Experimental Botany, 64(4), 1061–72. doi:10.1093/jxb/ers382
Avenson, T. (2004). Modulation of energy-dependent quenching of excitons in antennae of higher plants. 2004. Retrieved from http://www.pnas.org/content/101/15/5530.short
Avenson, T., & Cruz, J. (2005). Regulating the proton budget of higher plant photosynthesis. Proceedings of the National Academy of Sciences of the United States of America, 102(27), 9709–9713. Retrieved from http://www.pnas.org/content/102/27/9709.short
Baker, N. R. (2008). Chlorophyll fluorescence: a probe of photosynthesis in vivo. Annual Review of Plant Biology, 59, 89–113. doi:10.1146/annurev.arplant.59.032607.092759
Baker, N. R., Harbinson, J., & Kramer, D. M. (2007). Determining the limitations and regulation of photosynthetic energy transduction in leaves. Plant, Cell & Environment, 30(9), 1107–25. doi:10.1111/j.1365-3040.2007.01680.x
Evans, J. R. (2013). Improving photosynthesis. Plant Physiology, 162(4), 1780–93. doi:10.1104/pp.113.219006
Falk, S., Maxwell, D. P., Laudenbach, D. E., & Huner, N. P. A. (1996). Photosynthetic Adjustment to Temperature. In N. Baker (Ed.), Photosynthesis and the environment (pp. 367–385). Kluwer Academic Publishers.
Foyer, C. H., Neukermans, J., Queval, G., Noctor, G., & Harbinson, J. (2012). Photosynthetic control of electron transport and the regulation of gene expression. Journal of Experimental Botany, 63(4), 1637–61. doi:10.1093/jxb/ers013
Genty, B., & Harbinson, J. (1996). Regulation of Light Utilization for Photosynthetic Electron Transport. In N. Baker (Ed.), Photosynthesis and the environment (pp. 367–385). Kluwer Academic Publishers.
Harbinson, J. (1994). The responses of thylakoid electron transport and light utilization efficiency to singk limitation of photosynthesis. In: Bakker NR and Bowyer JR (eds) Photoinhibition of Photosynthesis from Molecular Mechanisms to the Field, pp 273-295. Bios Scientific Publishers, Oxford.
Harbinson, J. (2012). Modeling the protection of photosynthesis. Proceedings of the National Academy of Sciences of the United States of America, 109(39), 15533–4. doi:10.1073/pnas.1213195109
Harbinson, J., & Hedley, C. (1989). The kinetics of P‐700+ reduction in leaves: a novel in situ probe of thylakoid functioning. Plant, Cell & Environment, 357–369. Retrieved from http://onlinelibrary.wiley.com/doi/10.1111/j.1365-3040.1989.tb01952.x/abstract
Horton, P. (2000). Prospects for crop improvement through the genetic manipulation of photosynthesis: morphological and biochemical aspects of light capture. Journal of Experimental Botany, 51(February), 475–485. Retrieved from http://jxb.oxfordjournals.org/content/51/suppl_1/475.short
Ilioaia, C., Johnson, M. P., Duffy, C. D. P., Pascal, A. a, van Grondelle, R., Robert, B., & Ruban, A. V. (2011). Origin of absorption changes associated with photoprotective energy dissipation in the absence of zeaxanthin. The Journal of Biological Chemistry, 286(1), 91–8. doi:10.1074/jbc.M110.184887

24
Kanazawa, A., & Kramer, D. (2002). In vivo modulation of nonphotochemical exciton quenching (NPQ) by regulation of the chloroplast ATP synthase. Proceedings of the National …, 99(20), 12789–12794. Retrieved from http://www.pnas.org/content/99/20/12789.short
Kramer, D., Sacksteder, C., & Cruz, J. (1999). How acidic is the lumen? Photosynthesis Research, 151–163. Retrieved from http://link.springer.com/article/10.1023/A:1006212014787
Laisk, A., & Oja, V. (1994). Range of photosynthetic control of postillumination P700+ reduction rate in
sunflower leaves. Photosynthesis Research, 39–50. Retrieved from http://link.springer.com/article/10.1007/BF00027141
Li, X.-P., Muller-Moule, P., Gilmore, A. M., & Niyogi, K. K. (2002). PsbS-dependent enhancement of feedback de-excitation protects photosystem II from photoinhibition. Proceedings of the National Academy of Sciences of the United States of America, 99(23), 15222–15227.
Parry, M. A. J., Reynolds, M., Salvucci, M. E., Raines, C., Andralojc, P. J., Zhu, X. G., … Furbank, R. T. (2011). Raising yield potential of wheat. II. Increasing photosynthetic capacity and efficiency. Journal of Experimental Botany, 62(2), 453–467.
Raines, C. a. (2011). Increasing photosynthetic carbon assimilation in C3 plants to improve crop yield: current and future strategies. Plant Physiology, 155(1), 36–42. doi:10.1104/pp.110.168559
Sacksteder, C. (2000). The proton to electron stoichiometry of steady-state photosynthesis in living plants: a proton-pumping Q cycle is continuously engaged. Proceedings of the …, 97(26), 14283–14288. Retrieved from http://www.pnas.org/content/97/26/14283.short
Tikhonov, A. N. (2013). pH-dependent regulation of electron transport and ATP synthesis in chloroplasts. Photosynthesis Research, 116(2-3), 511–34. doi:10.1007/s11120-013-9845-y
Von Caemmerer, S., & Evans, J. R. (2010). Enhancing C3 photosynthesis. Plant Physiology, 154(2), 589–92. doi:10.1104/pp.110.160952
Yamori, W., Takahashi, S., Makino, A., Price, G. D., Badger, M. R., & von Caemmerer, S. (2011). The roles of ATP synthase and the cytochrome b6/f complexes in limiting chloroplast electron transport and determining photosynthetic capacity. Plant Physiology, 155(2), 956–62. doi:10.1104/pp.110.168435
Zhu, X.-G., Long, S. P., & Ort, D. R. (2008). What is the maximum efficiency with which photosynthesis can convert solar energy into biomass? Current Opinion in Biotechnology, 19(2), 153–9. doi:10.1016/j.copbio.2008.02.004

25
6. APPENDIXES
Appendix 1. Rate constant supply of reductant to P700+, ke, at different changing environments. (A) When
increasing gradually the light intensity, (B) when decreasing gradually the CO2 concentration and (C), when
decreasing gradually the temperature. Different symbols represent individual leaves measured from different
plants.
0
20
40
60
80
0 200 400 600 800 1000 1200 1400
k e
PPFD (µmol m-2 s-1)
R1 R2 R3 R4A
0
20
40
60
80
0 100 200 300 400 500 600
k e
CO2 (ppm)
R1 R2 R3 R4B
0
20
40
60
80
0 5 10 15 20 25 30
k e
Temperature (°C)
R1 R2 R3 R4C

26
Appendix 2. Parameters determined from electrochromic shift (ECS) signals when decreasing gradually the
light intensity from 100 to 1300 μmol m-2
s-1
in J. aurantiaca grown under 600 μmol m-2
s-1
of irradiance.
Different symbols represent individual leaves measured from different plants. (A) flux of protons, VH+, (B) total
rapid change in ECS signal, pmf, (C) conductivity of the ATP synthase to protons, gH+. Measurements for R2
were too noisy; thereby, they were excluded.
0.0
0.5
1.0
1.5
2.0
0 200 400 600 800 1000 1200 1400
v H+
PPFD (µmol m-2 s-1)
R1 R3 R4A
0.00
0.02
0.04
0.06
0.08
0 200 400 600 800 1000 1200 1400
ECS t
PPFD (µmol m-2 s-1)
R1 R3 R4B
0
10
20
30
40
50
60
0 200 400 600 800 1000
g H+
PPFD (µmol m-2 s-1)
R1 R3 R4C

27
Appendix 3. Parameters determined from electrochromic shift (ECS) signals when decreasing gradually CO2
concentration in Juanulloa aurantiaca grown under 600 μmol m-2
s-1
of irradiance. Different symbols represent
individual leaves measured from different plants. (A) flux of protons, VH+, (B) total rapid change in ECS signal,
pmf, (C) conductivity of the ATP synthase to protons, gH+.
0.0
0.5
1.0
1.5
2.0
0 100 200 300 400 500
ν H+
CO2 (ppm)
R1 R2 R3 R4A
0.00
0.02
0.04
0.06
0.08
0 100 200 300 400 500
ECS t
CO2 (ppm)
R1 R2 R3 R4B
0
10
20
30
40
50
60
0 100 200 300 400 500
g H+
CO2 (ppm)
R1 R2 R3 R4

28
Appendix 4. Parameters determined from electrochromic shift (ECS) signals when decreasing gradually
temperature in Juanulloa aurantiaca grown under 600 μmol m-2
s-1
of irradiance. Different symbols represent
individual leaves measured from different plants. (A) Flux of protons, VH+, (B) total rapid change in ECS signal,
pmf, (C) conductivity of the ATP synthase to protons, gH+.
0.0
0.5
1.0
1.5
2.0
0 5 10 15 20 25 30
v H+
Temperature (°C)
R1 R2 R3 R4A
0.00
0.02
0.04
0.06
0.08
0 5 10 15 20 25 30
ECS t
Temperature (°C)
R1 R2 R3 R4B
0
10
20
30
40
50
60
0 5 10 15 20 25 30
g H+
Temperature (°C)
R1 R2 R3 R4

29
Appendix 5. Relationship between NPQ and pmf when plotting the same parameters using the data obtained
during light and CO2 changes together. It can be seen that the relationship had the trend to be exponential.
Different symbols represent individual leaves measured from different plants.
Appendix 6. (A) Gross CO2 assimilation and (B) Relationship between quantum efficiency for CO2 assimilation
and ᶲPSII when increasing gradually light intensity.
0.0
0.5
1.0
1.5
2.0
2.5
3.0
3.5
4.0
0.00 0.01 0.02 0.03 0.04 0.05 0.06
NP
Q
ECSt
R1 R2 R3 R4
0.0
0.8
1.6
2.4
3.2
4.0
4.8
5.6
6.4
7.2
0 200 400 600 800 1000 1200 1400
Gro
ss C
O2
ass
imila
tio
n (
µm
ol m
-2s-1
)
PPFD (µmol m-2 s-1)
R1 R2 R3 R4A
0.000
0.005
0.010
0.015
0.020
0.025
0.0 0.2 0.4 0.6 0.8 1.0
Qu
antu
m e
ffic
ien
cy C
O2
ᶲPSII
R1 R2 R3 R4B

30
Appendix 7. (A) Gross CO2 assimilation and (B) Relationship between quantum efficiency for CO2 assimilation
and ᶲPSII when decreasing gradually the CO2 concentration. Measurements of gross CO2 assimilation for R4
were done in two consecutive days. In the first day, the first four measurements were taken (500 to 300 ppm).
Measurements for the remaining CO2 concentrations were done the next day.
Appendix 8. (A) Gross CO2 assimilation and (B) Relationship between quantum efficiency for CO2 assimilation
and ᶲPSII when decreasing gradually the temperature.
0.0
0.8
1.6
2.4
3.2
4.0
4.8
5.6
6.4
7.2
0 50 100 150 200 250 300 350 400 450 500
Gro
ss C
O2
assi
mila
tio
n (
µm
ol m
-2s-1
)
CO2 (ppm)
R1 R2 R3 R4A
0.000
0.005
0.010
0.015
0.020
0.025
0 0.2 0.4 0.6 0.8 1
Qu
antu
m e
ffic
ien
cy C
O2
ᶲPSII
R1 R2 R3 R4B
0.0
0.8
1.6
2.4
3.2
4.0
4.8
5.6
6.4
7.2
0 5 10 15 20 25
Gro
ss C
O2
assi
mila
tio
n (
µm
ol m
-2s-1
)
Temperature (°C)
R1 R2 R3 R4A
0.000
0.005
0.010
0.015
0.020
0.025
0 0.2 0.4 0.6 0.8 1
Qu
antu
m e
ffic
ien
cy C
O2
ᶲPSII
R1 R2 R3 R4B


![Hantarex MTC9000 (14-16-20in) [Service] [English]](https://img.dokumen.tips/doc/110x75/55176ca7497959a0308b48ea/hantarex-mtc9000-14-16-20in-service-english.jpg)


![Yr13%20 inside%20outside%20in%20between[1]](https://img.dokumen.tips/doc/110x75/54b80d574a79598d0a8b4733/yr1320-inside20outside20in20between1.jpg)