Embed Size (px)
Citation preview

In vivo fast variable focus photoacoustic microscopy using an electrically tunable lens
Bingbing Li,1 Huan Qin,1 Sihua Yang1,2 and Da Xing1,* 1MOE Key Laboratory of Laser Life Science and Institute of Laser Life Science, College of Biophotonics, South
China Normal University, Guangzhou 510631, China [email protected] *[email protected]
Abstract: Fast focusing scan over a large depth range is challenging in photoacoustic microscopic imaging. In this paper, a fast variable focus photoacoustic microscopy (VF-PAM) with a large range of imaging depth was presented by using an electrically tunable lens (ETL). The ETL controlled the divergence angle of the laser beam for fast and continuous focus-shifting in depth direction with the shifting time of 15 ms, and 2.82 mm focus-shifting range with a 1 µm shifting accuracy was achieved by combining the ETL with a 0.3 NA plan microscope objective lens. Carbon fibers imaging verified the depth imaging ability of the system, in vivo microvasculature of mouse ear and brain tissues of the mouse imaging further demonstrated the focusing scan ability in biomedical application. The fast VF-PAM system allows substantial shortening of the focus-shifting time, which will be more conducive to studying living biological tissue, and will promote the development of in vivo noninvasive PA depth imaging without mechanical scan.
©2014 Optical Society of America
OCIS codes: (180.6900) Three-dimensional microscopy; (170.0180) Microscopy; (170.7170) Ultrasound; (110.5120) Photoacoustic imaging.
References and links 1. P. Hajireza, W. Shi, and R. J. Zemp, “Label-free in vivo fiber-based optical-resolution photoacoustic
microscopy,” Opt. Lett. 36(20), 4107–4109 (2011). 2. H. F. Zhang, K. Maslov, G. Stoica, and L. V. Wang, “Functional photoacoustic microscopy for high-resolution
and noninvasive in vivo imaging,” Nat. Biotechnol. 24(7), 848–851 (2006). 3. Y. Yuan, S. H. Yang, and D. Xing, “Optical-resolution photoacoustic microscopy based on two-dimensional
scanning galvanometer,” Appl. Phys. Lett. 100(2), 023702 (2012). 4. A. M. Caravaca-Aguirre, D. B. Conkey, J. D. Dove, H. Ju, T. W. Murray, and R. Piestun, “High contrast three-
dimensional photoacoustic imaging through scattering media by localized optical fluence enhancement,” Opt. Express 21(22), 26671–26676 (2013).
5. L. V. Wang, “Multiscale photoacoustic microscopy and computed tomography,” Nat. Photonics 3(9), 503–509 (2009).
6. D. Razansky, M. Distel, C. Vinegoni, R. Ma, N. Perrimon, R. W. Köster, and V. Ntziachristos, “Multispectral opto-acoustic tomography of deep-seated fluorescent proteins in vivo,” Nat. Photonics 3(7), 412–417 (2009).
7. Z. L. Deng, X. Q. Yang, H. Gong, and Q. M. Luo, “Adaptive synthetic-aperture focusing technique for microvasculature imaging using photoacoustic microscopy,” Opt. Express 20(7), 7555–7563 (2012).
8. D. W. Yang, D. Xing, S. H. Yang, and L. Z. Xiang, “Fast full-view photoacoustic imaging by combined scanning with a linear transducer array,” Opt. Express 15(23), 15566–15575 (2007).
9. Z. Y. Yang, J. H. Chen, J. J. Yao, R. Q. Lin, J. Meng, C. B. Liu, J. H. Yang, X. Li, L. Wang, and L. Song, “Multi-parametric quantitative microvascular imaging with optical-resolution photoacoustic microscopy in vivo,” Opt. Express 22(2), 1500–1511 (2014).
10. S. L. Jiao, M. S. Jiang, J. M. Hu, A. Fawzi, Q. F. Zhou, K. K. Shung, C. A. Puliafito, and H. F. Zhang, “Photoacoustic ophthalmoscopy for in vivo retinal imaging,” Opt. Express 18(4), 3967–3972 (2010).
11. G. Xu, J. R. Rajian, G. Girish, M. J. Kaplan, J. B. Fowlkes, P. L. Carson, and X. D. Wang, “Photoacoustic and ultrasound dual-modality imaging of human peripheral joints,” J. Biomed. Opt. 18(1), 010502 (2013).
12. J. Y. Xiao, L. Yao, Y. Sun, E. S. Sobel, J. H. He, and H. B. Jiang, “Quantitative two-dimensional photoacoustic tomography of osteoarthritis in the finger joints,” Opt. Express 18(14), 14359–14365 (2010).
#214777 - $15.00 USD Received 26 Jun 2014; revised 23 Jul 2014; accepted 23 Jul 2014; published 12 Aug 2014(C) 2014 OSA 25 August 2014 | Vol. 22, No. 17 | DOI:10.1364/OE.22.020130 | OPTICS EXPRESS 20130

13. X. Wang, Y. Pang, G. Ku, X. Xie, G. Stoica, and L. V. Wang, “Noninvasive laser-induced photoacoustic tomography for structural and functional in vivo imaging of the brain,” Nat. Biotechnol. 21(7), 803–806 (2003).
14. Z. L. Tan, Y. F. Liao, Y. B. Wu, Z. L. Tang, and R. K. Wang, “Photoacoustic microscopy achieved by microcavity synchronous parallel acquisition technique,” Opt. Express 20(5), 5802–5808 (2012).
15. C. Zhang, K. Maslov, and L. V. Wang, “Subwavelength-resolution label-free photoacoustic microscopy of optical absorption in vivo,” Opt. Lett. 35(19), 3195–3197 (2010).
16. Z. L. Tan, Z. L. Tang, Y. B. Wu, Y. F. Liao, W. Dong, and L. N. Guo, “Multimodal subcellular imaging with microcavity photoacoustic transducer,” Opt. Express 19(3), 2426–2431 (2011).
17. S. H. Yang, F. Ye, and D. Xing, “Intracellular label-free gold nanorods imaging with photoacoustic microscopy,” Opt. Express 20(9), 10370–10375 (2012).
18. C. Zhang, Y. S. Zhang, D.-K. Yao, Y. Xia, and L. V. Wang, “Label-free photoacoustic microscopy of cytochromes,” J. Biomed. Opt. 18(2), 020504 (2013).
19. S. A. Ermilov, T. Khamapirad, A. Conjusteau, M. H. Leonard, R. Lacewell, K. Mehta, T. Miller, and A. A. Oraevsky, “Laser optoacoustic imaging system for detection of breast cancer,” J. Biomed. Opt. 14(2), 024007 (2009).
20. R. O. Esenaliev, I. V. Larina, K. V. Larin, D. J. Deyo, M. Motamedi, and D. S. Prough, “Optoacoustic technique for noninvasive monitoring of blood oxygenation: a feasibility study,” Appl. Opt. 41(22), 4722–4731 (2002).
21. J. Park, T. M. Cummins, M. Harrison, J. Lee, Q. F. Zhou, C.-L. Lien, and K. K. Shung, “High frequency photoacoustic imaging for in vivo visualizing blood flow of zebrafish heart,” Opt. Express 21(12), 14636–14642 (2013).
22. W. Göbel and F. Helmchen, “New angles on neuronal dendrites in vivo,” J. Neurophysiol. 98(6), 3770–3779 (2007).
23. Z. J. Chen, S. H. Yang, and D. Xing, “In vivo detection of hemoglobin oxygen saturation and carboxyhemoglobin saturation with multiwavelength photoacoustic microscopy,” Opt. Lett. 37(16), 3414–3416 (2012).
24. M. Nasiriavanaki, J. Xia, H. L. Wan, A. Q. Bauer, J. P. Culver, and L. V. Wang, “High-resolution photoacoustic tomography of resting-state functional connectivity in the mouse brain,” Proc. Natl. Acad. Sci. U.S.A. 111(1), 21–26 (2014).
25. P. Hajireza, A. Forbrich, and R. J. Zemp, “Multifocus optical-resolution photoacoustic microscopy using stimulated Raman scattering and chromatic aberration,” Opt. Lett. 38(15), 2711–2713 (2013).
26. G. Duemani Reddy, K. Kelleher, R. Fink, and P. Saggau, “Three-dimensional random access multiphoton microscopy for functional imaging of neuronal activity,” Nat. Neurosci. 11(6), 713–720 (2008).
27. P. A. Kirkby, K. M. Srinivas Nadella, and R. A. Silver, “A compact acousto-optic lens for 2D and 3D femtosecond based 2-photon microscopy,” Opt. Express 18(13), 13720–13745 (2010).
28. B. W. Jiang, X. Q. Yang, Y. Y. Liu, Y. Deng, and Q. M. Luo, “Multiscale photoacoustic microscopy with continuously tunable resolution,” Opt. Lett. 39(13), 3939–3941 (2014).
29. L. Xi, C. L. Song, and H. B. Jiang, “Confocal photoacoustic microscopy using a single multifunctional lens,” Opt. Lett. 39(11), 3328–3331 (2014).
30. B. Soetikno, C. Yeh, S. Hu, Q. Zhong, K. Maslov, and L. V. Wang, “Contour-scanning optical-resolution photoacoustic microscopy,” Photonics West (2013).
31. B. F. Grewe, F. F. Voigt, M. van ’t Hoff, and F. Helmchen, “Fast two-layer two-photon imaging of neuronal cell populations using an electrically tunable lens,” Biomed. Opt. Express 2(7), 2035–2046 (2011).
32. C. Zhang, K. Maslov, J. Yao, and L. V. Wang, “In vivo photoacoustic microscopy with 7.6-µm axial resolution using a commercial 125-MHz ultrasonic transducer,” J. Biomed. Opt. 17(11), 116016 (2012).
1. Introduction
Photoacoustic microscopy (PAM) is a high-resolution and high-contrast noninvasive biomedical imaging technique, which imaging the optical absorption contrast based on photoacoustic (PA) effect [1–4]. The energy of laser pulse absorbed by the sample partially converts into heat, which immediately leads to the generation of acoustic waves [5, 6]. High resolution PA imaging can be obtained by focusing the laser beam through a microscope objective lens and receiving the PA signals in the same area by an ultrasonic transducer. PAM has been applied in many biomedical research fields, such as vasculature structure imaging [7, 9], retinal imaging [10], peripheral joints and osteoarthritis imaging [11, 12], brain functional and molecular imaging [5, 13], cell and intracellular imaging [14–18]. In addition, PAM has also been developed as a promising tool for detection of breast tumors [19], monitoring of oxygenation [20] and visualizing blood flow of zebrafish heart [21]. However, in the above PA biomedical imaging, due to a single depth of focus, only a narrow depth range in focus is acquired. Mechanical scan can improve depth of field (DOF) by moving the objective or sample with a piezoelectric z-focusing device or motor-driven linear platform in depth direction [22–24]. But the focus-shifting speed is limited by mechanical inertia of these
#214777 - $15.00 USD Received 26 Jun 2014; revised 23 Jul 2014; accepted 23 Jul 2014; published 12 Aug 2014(C) 2014 OSA 25 August 2014 | Vol. 22, No. 17 | DOI:10.1364/OE.22.020130 | OPTICS EXPRESS 20131
moving devices, and the speed is 20 Hz [22]. In order to achieve fast inertia-free scan, the chromatic aberration has been exploited and reported previously in PAM [25], while the limitation of the system is that only a few discrete focus depths can be obtained. Moreover, fast focus-shifting methods have been developed for improving the DOF in other microscopy systems by using multiple acousto-optic deectors (AODs) [26] and acousto-optic lens [27]. The focus-shifting ranges of these systems are still fairly restricted and the maximum adjustable range is about 137 µm [27], which cannot meet the requirement of depth focusing scan.
In this paper, we have developed a fast variable focus photoacoustic microscopy (VF-PAM) using an electrically tunable lens (ETL), which provides an inertia-free focusing scan over a large depth range. The similar method has developed into other PAM system [28–30]. Different divergence angles of laser beam lead to different depths of focus, here, we introduce an ETL into the PAM system for focusing scan in different depths. The focus depths of the VF-PAM system can be varied as a function of the supplied electrical signal and shift continuously. To the best of our knowledge, this is the first report of using an ETL in PAM for fast shifting the focus in depth direction. The performance of the VF-PAM system has been demonstrated by imaging carbon fibers at different planes, microvasculature of mouse ear and brain tissues of the mouse in vivo. The fast focusing scan can be used to detect the dynamic changes of oxygen saturation at different depths. Also, this method may attempt to study the neural activity at different depths of brain in intact tissues.
2. Methods and materials
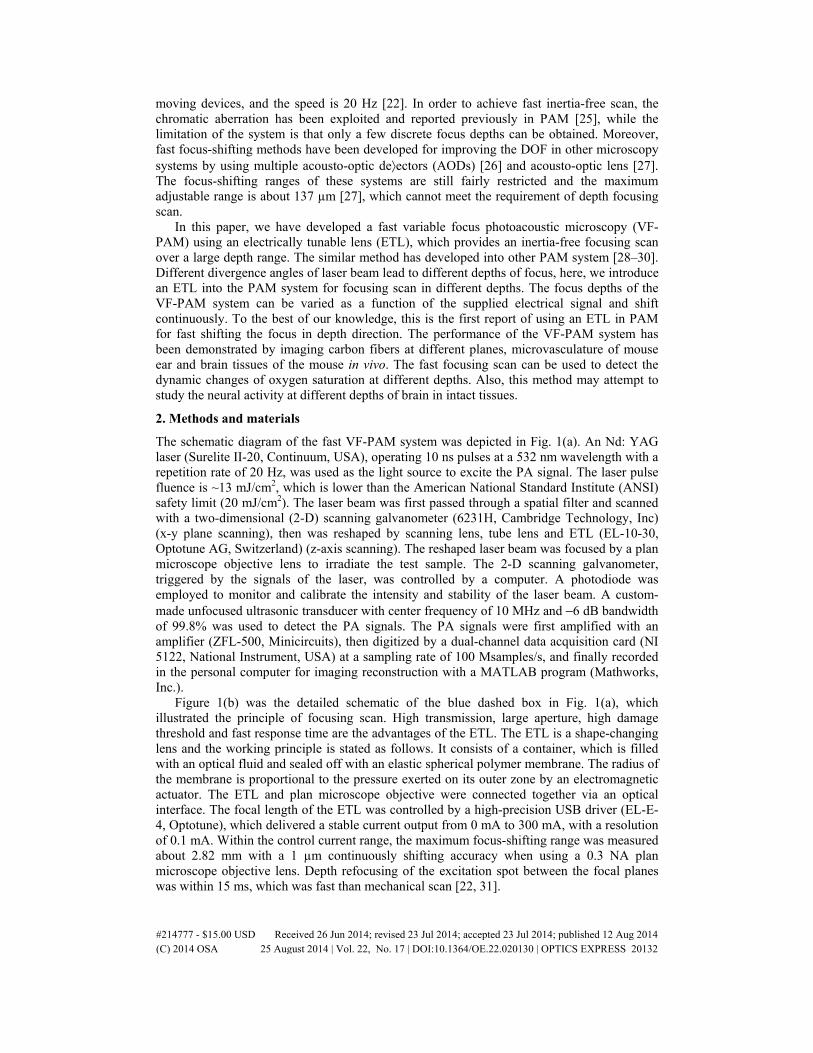
The schematic diagram of the fast VF-PAM system was depicted in Fig. 1(a). An Nd: YAG laser (Surelite II-20, Continuum, USA), operating 10 ns pulses at a 532 nm wavelength with a repetition rate of 20 Hz, was used as the light source to excite the PA signal. The laser pulse fluence is ~13 mJ/cm2, which is lower than the American National Standard Institute (ANSI) safety limit (20 mJ/cm2). The laser beam was first passed through a spatial filter and scanned with a two-dimensional (2-D) scanning galvanometer (6231H, Cambridge Technology, Inc) (x-y plane scanning), then was reshaped by scanning lens, tube lens and ETL (EL-10-30, Optotune AG, Switzerland) (z-axis scanning). The reshaped laser beam was focused by a plan microscope objective lens to irradiate the test sample. The 2-D scanning galvanometer, triggered by the signals of the laser, was controlled by a computer. A photodiode was employed to monitor and calibrate the intensity and stability of the laser beam. A custom-made unfocused ultrasonic transducer with center frequency of 10 MHz and −6 dB bandwidth of 99.8% was used to detect the PA signals. The PA signals were first amplified with an amplifier (ZFL-500, Minicircuits), then digitized by a dual-channel data acquisition card (NI 5122, National Instrument, USA) at a sampling rate of 100 Msamples/s, and finally recorded in the personal computer for imaging reconstruction with a MATLAB program (Mathworks, Inc.).
Figure 1(b) was the detailed schematic of the blue dashed box in Fig. 1(a), which illustrated the principle of focusing scan. High transmission, large aperture, high damage threshold and fast response time are the advantages of the ETL. The ETL is a shape-changing lens and the working principle is stated as follows. It consists of a container, which is filled with an optical fluid and sealed off with an elastic spherical polymer membrane. The radius of the membrane is proportional to the pressure exerted on its outer zone by an electromagnetic actuator. The ETL and plan microscope objective were connected together via an optical interface. The focal length of the ETL was controlled by a high-precision USB driver (EL-E-4, Optotune), which delivered a stable current output from 0 mA to 300 mA, with a resolution of 0.1 mA. Within the control current range, the maximum focus-shifting range was measured about 2.82 mm with a 1 µm continuously shifting accuracy when using a 0.3 NA plan microscope objective lens. Depth refocusing of the excitation spot between the focal planes was within 15 ms, which was fast than mechanical scan [22, 31].
#214777 - $15.00 USD Received 26 Jun 2014; revised 23 Jul 2014; accepted 23 Jul 2014; published 12 Aug 2014(C) 2014 OSA 25 August 2014 | Vol. 22, No. 17 | DOI:10.1364/OE.22.020130 | OPTICS EXPRESS 20132

Fig. 1. Schematic diagram of the VF-PAM system (a) and electrically tunable lens (ETL) placed on top of the plan microscopy objective lens (b). GP, glass plate; SL, scan lens; TL, tube lens; ETL, electrically tunable lens; POL, plan objective lens; UT, ultrasonic transducer; Amp, amplifier; DAQ, data acquisition system; NDF, neutral density filter; Pd, photodiode.
The lateral resolution and axial resolution of the VF-PAM system were measured by imaging a sharp-edged surgical blade and a ~7 µm diameter carbon fiber respectively. The PA imaging of in vitro red blood cells (RBCs) and carbon fibers further demonstrated the system resolution. Before experiment, the RBCs were placed on a cover glass, which was then placed against the ultrasound transducer and the carbon fibers were inserted in the agar at different planes. The capability of focusing scan was demonstrated in carbon fibers at different planes, in vivo microvasculature of a mouse ear and brain tissues of the mouse. In the in vivo study, the data were acquired on BALB/c mouse (40 g). Commercial hair remover (Payven Depilatory China) was employed to remove the hair from the ear and the brain before experiment and general anesthesia (i.e., sodium pentobarbital, 40 mg/kg; supplemental, 10 mg/kg/h) was applied to keep the mouse motionless during the experiment. After imaging, the mouse naturally recovered without observable laser damage. Due to the limitation of lateral scan imaging range, the in vivo experiment was employed a 0.1 NA plan microscope objective lens with a ~1 mm scan range and other experiments were acquired with a 0.3 NA plan microscope objective lens, which the scan range is ~180 µm. All the experimental procedures were carried out in accordance with the laboratory animal protocols approved by the South China Normal University. With the purpose of coupling the PA waves to the ultrasound transducer, a thin layer of ultrasonic gel was applied between the samples and the ultrasound transducer.
3. Results
3.1 Resolution evaluation and measurement of the focus-shifting range of the VF-PAM system
The lateral resolution of the VF-PAM system was determined by the numerical aperture (NA) of the plan microscope objective lens. The theoretical lateral resolution was calculated to be 1.08 µm (0.3 NA) at 532 nm. It was experimentally quantified by imaging a sharp-edged surgical blade indicated in Fig. 2(a), with a scanning step of ~0.5 µm. The edge-spread function (ESF) was estimated from the blade PA image along the dashed line. The line-spread function (LSF) was calculated as the derivative of the ESF. The full width at half maximum (FWHM) of the LSF defining the lateral resolution was estimated to be 1.3 µm, as shown in Fig. 2(b). Figure 2(c) showed the PA image of RBCs, the imaging result demonstrated individual RBCs could be clearly distinguished using our system. The RBC has the characteristics of thicker edge and thinner center, the contrast of the edge is higher than that of the center in PA image, which is matched very well with the image photographed by the
#214777 - $15.00 USD Received 26 Jun 2014; revised 23 Jul 2014; accepted 23 Jul 2014; published 12 Aug 2014(C) 2014 OSA 25 August 2014 | Vol. 22, No. 17 | DOI:10.1364/OE.22.020130 | OPTICS EXPRESS 20133

optical microscope (OM) presented in Fig. 2(d). The above experiments demonstrated the high lateral resolution of our system.
Fig. 2. Lateral resolution of the VF-PAM system. (a) PA image of a sharp-edged surgical blade acquired with the VF-PAM system. (b) Edge spread function (ESF) extracted from (a) along the dashed line and line spread function (LSF) obtained by taking the derivative of the ESF. (c) PA image of red blood cells (RBCs). (d) Optical microscope (OM) image of RBCs.
In order to measure the focus-shifting range of the VF-PAM system, carbon fibers at different depths were imaged respectively through shifting the focus. The lateral scan step was about 1.8 µm. Several measurements showed the maximum focus-shifting range was 2.82 mm, which was quite coincident with the theory (~2.8 mm). Figures 3(a) and 3(b) were PA images of the carbon fibers at upper and lower planes respectively. The inset at the bottom-right corner of Fig. 3(b) showed schematic diagram of the two planes carbon fibers with a depth interval of 2.82 mm. The FWHM of the fibers along the dashed line in Figs. 3(a) and 3(b) were shown in Figs. 3(d) and 3(e).
The theoretical axial resolution of the VF-PAM system, which was determined by the bandwidth of the receiving ultrasonic transducer [32], was calculated to be ~132 µm. In our system, the axial resolution was measured via using a ~7 µm diameter carbon fiber. Figure 3(c) showed the axial section PA image of the carbon fiber in Fig. 3(a). A PA axial spread profile of the carbon fiber along the dashed line in (c) was presented in Fig. 3(f). Owing to the small diameter of the carbon fiber, the FWHM of the envelope of the axial spread profile could be regarded as the axial resolution of the imaging system. As shown in Fig. 3(f), the axial resolution was estimated to be 148 µm.
#214777 - $15.00 USD Received 26 Jun 2014; revised 23 Jul 2014; accepted 23 Jul 2014; published 12 Aug 2014(C) 2014 OSA 25 August 2014 | Vol. 22, No. 17 | DOI:10.1364/OE.22.020130 | OPTICS EXPRESS 20134

Fig. 3. Focus-shifting range and axial resolution of the VF-PAM system. PA images of (a) the upper plane carbon fiber and (b) the lower plane carbon fiber. The inset at the bottom-right corner of (b) showed schematic diagram of the two planes carbon fibers, the depth interval between the two planes was 2.82 mm. (c) The axial section PA image of carbon fiber in (a). (d)-(e) Distribution of the PA amplitude (dots) along the dashed line in (a)-(b); the solid line is a Gaussian fitted curve. (f) Axial profile of the carbon fiber in (c); Blue line with dot: experimental signal; Red solid line: envelope of the experimental signal.
3.2 Imaging of carbon fibers at different focus depths by the VF-PAM system
Fig. 4. (a)-(h) A series of PA images of the two carbon fibers at different focus shifts acquired with the VF-PAM system, the shifting step was ~10 µm between images. The depth interval between the two planes carbon fibers was ~70 µm. (i) Snapshot of a 3-D animation (Media 1) showed the two planes carbon fibers. (j) Video (Media 2) of the two planes carbon fibers.
The capability of focusing scan of the VF-PAM system was demonstrated in carbon fibers. The carbon fibers at two different planes with a depth interval of ~70 µm were imaged. By shifting the focus from one planes to the other with a shifting step of ~10 µm within 15 ms, we acquired a series of PA images, as shown in Figs. 4(a)-4(h). We use the laser with a repetition rate of 20 Hz, so the image acquisition time is about 8.5 min for a ~180 µm PA imaging area with a scanning step of ~1.8 µm and the focus-shifting time in axial direction is 15 ms. Through focusing scan, we could observe that the two planes carbon fibers were in crossed form. Defining the focal plane locating at the upper plane carbon fiber was 0 µm, then the focal plane of the lower plane was 70 µm. Figures 4(a)-4(h) indicated that at 60 µm away
#214777 - $15.00 USD Received 26 Jun 2014; revised 23 Jul 2014; accepted 23 Jul 2014; published 12 Aug 2014(C) 2014 OSA 25 August 2014 | Vol. 22, No. 17 | DOI:10.1364/OE.22.020130 | OPTICS EXPRESS 20135

from the focal plane, the fibers was completely out of the DOF that the generated PA signals was too weak to discern from noise, while in the focal plane the signal-to-noise ratio reached more than 20 dB that was adequate for imaging micro blood vessels. In Fig. 4(i) (Media 1), snapshot of a 3-D animation showed the two planes carbon fibers, where the form of the two carbon fibers was clearly displayed. Figure 4(j) (Media 2) illustrated the video of the carbon fibers by using of the VF-PAM system. Media 2 depicted the process of focusing scan in depth direction directly. These results revealed the necessity of shifting the focus in axial direction to achieve depth imaging.
3.3 In vivo imaging of microvasculature and brain tissues by the VF-PAM system in animal model
Fig. 5. In vivo PA imaging of microvasculature of a mouse ear and brain tissues of mouse at different depths: (a) PA images of microvasculature of a mouse ear at different focus depths were acquired with the VF-PAM system, the depth interval was ~25 µm between PA images. (b)-(d) Three typical PA images of microvasculature, the focus depths were about 50 µm, 150 µm and 225 µm respectively. (e) Epidermis. (f) Brain subcutaneous vessels (~200 μm). (g) Brain cortex vessels (~400 μm). Brain skull is located at the depth from 200 μm to 400 μm.
To demonstrate the in vivo focusing scan of the VF-PAM system, microvasculature of the mouse ear were performed. In Fig. 5(a), PA images of a mouse ear microvasculature were obtained by focusing scan. The axial scanning range was taken from the tissues surface to approximately 225 µm below the surface. The depth interval was ~25 µm between PA images and the time for shifting the focus in depth direction was within 15 ms. These PA images showed that through focusing scan we could see more micro blood vessels in the focal plane. The extracted three typical PA images were displayed in Fig. 5(b) at about 50 µm depth, Fig. 5(c) at about 150 µm depth and Fig. 5(d) at about 225 µm depth in the mouse ear. As shown in Fig. 5(c), many capillaries in the dashed circle and more micro blood vessels indicated by white arrows were imaged with good contrast, which were not viewed in Fig. 5(b). However, since the capillaries were not in the DOF, it vanished in Fig. 5(d). To further demonstrate that the VF-PAM system can achieve deeper scan, brain tissues at different depths of the mouse were performed and we imaged brain subcutaneous vessels (~200 μm), as shown in Fig. 5(f), brain cortex vessels (~400 μm) shown in Fig. 5(g). The depth from 200 μm to 400 μm is brain
#214777 - $15.00 USD Received 26 Jun 2014; revised 23 Jul 2014; accepted 23 Jul 2014; published 12 Aug 2014(C) 2014 OSA 25 August 2014 | Vol. 22, No. 17 | DOI:10.1364/OE.22.020130 | OPTICS EXPRESS 20136

skull. The time of shifting the focus in depth direction was within 15 ms between PA images. These results show that we could detect depth vessels in tissues through focusing scan. These PA images indicate the capability of providing many structural details of microvasculature and brain tissues by using the VF-PAM system.
4. Discussions and conclusions
By combining the ETL with the PAM system, we have developed a VF-PAM system and presented an effective method for depth scan. Highly scattering tissues can influence the focusing of the light and lead to the decrease of sensitivity and resolution, while this problem is unavoidable in optics-related imaging and exists in other methods [24–27]. Still, depth of focusing scan up to several hundred microns is effective in biological tissues. Though the focusing effect would be worse in the depth tissues suffered from the strong optical scattering, focusing scan can improve the DOF of the imaging depth. In shallow tissue, compared with conventional mechanical scan in depth direction [22–24], the focus depths of our system can be readily controlled without inertia. The focus-shifting time of the ETL is 15 ms and the piezo-Z stage is 50 ms [22], compared with the system using piezo-Z stage, the VF-PAM system has the advantage of inertia-free fast focusing scan, which can avoid the motion artifacts. Both of the ETL and the piezo-Z stage can focus the light into different focal planes and the two axial scanning methods do not affect the focus ability of the systems. The focus-shifting is variable, which depending on the need of imaging, can be set to shift continuously in depth direction, shift rapidly to avoid motion artifacts, or jump from depth to depth to capture the interested information. Further improvements of the VF-PAM system are stated as follows. An advanced ultrasonic transducer with higher sensitivity and higher frequency will enhance the detection sensitivity and the axial resolution of our system. The enhancing of detection sensitivity can diminish power of the excitation laser, which will reduce damage to the biological tissues and the improvement of axial resolution can obtain more apparent structural details. In addition, ETL with faster response time and the laser pulse with higher repetition rate further shorten the full image acquisition time, which will be more conducive to real-time studying living biological tissue. If high-repetition laser is used (>1 kHz), the focus-shifting time 15 ms is still not fast enough, we can use the other type of the ETL to improve this problem to some extent, where the time can be further decreased by ~50%.
The experiments of carbon fibers, in vivo microvasculature of mouse ear and brain tissues of the mouse, demonstrated that our system is convenient for PA focusing scan. The VF-PAM system can reduce mechanical complexity to achieve fast focus-shifting, which overcome the movement of the objective or sample, so the imaging time is shortened. In conclusion, the VF-PAM system with the advantages of inertia-free fast focusing scan, large and continuous focus-shifting range provides an effective way for in vivo PA depth scan imaging.
Acknowledgment
This research is supported by the National Basic Research Program of China (2011CB910402, 2010CB732602), the Program for Changjiang Scholars and Innovative Research Team in University (IRT0829), the National Natural Science Foundation of China (61331001, 61361160414, 81127004, 11104087 and 11304103), the Specialized Research Fund for the Doctoral Program of Higher Education (20114407120001), and the Guangdong Natural Science Foundation (S2013020012646 and S2013040016419).
#214777 - $15.00 USD Received 26 Jun 2014; revised 23 Jul 2014; accepted 23 Jul 2014; published 12 Aug 2014(C) 2014 OSA 25 August 2014 | Vol. 22, No. 17 | DOI:10.1364/OE.22.020130 | OPTICS EXPRESS 20137