Embed Size (px)
Citation preview

LUND UNIVERSITY
PO Box 117221 00 Lund+46 46-222 00 00
In Vivo Analysis of Inhibitory Synaptic Inputs and Rebounds in Deep CerebellarNuclear Neurons
Bengtsson, Fredrik; Ekerot, Carl-Fredrik; Jörntell, Henrik
Published in:PLoS ONE
DOI:10.1371/journal.pone.0018822
2011
Link to publication
Citation for published version (APA):Bengtsson, F., Ekerot, C-F., & Jörntell, H. (2011). In Vivo Analysis of Inhibitory Synaptic Inputs and Rebounds inDeep Cerebellar Nuclear Neurons. PLoS ONE, 6(4). https://doi.org/10.1371/journal.pone.0018822
Total number of authors:3
General rightsUnless other specific re-use rights are stated the following general rights apply:Copyright and moral rights for the publications made accessible in the public portal are retained by the authorsand/or other copyright owners and it is a condition of accessing publications that users recognise and abide by thelegal requirements associated with these rights. • Users may download and print one copy of any publication from the public portal for the purpose of private studyor research. • You may not further distribute the material or use it for any profit-making activity or commercial gain • You may freely distribute the URL identifying the publication in the public portal
Read more about Creative commons licenses: https://creativecommons.org/licenses/Take down policyIf you believe that this document breaches copyright please contact us providing details, and we will removeaccess to the work immediately and investigate your claim.
In Vivo Analysis of Inhibitory Synaptic Inputs andRebounds in Deep Cerebellar Nuclear NeuronsFredrik Bengtsson1, Carl-Fredrik Ekerot1, Henrik Jorntell1,2*
1 Section for Neurophysiology, Department of Experimental Medical Science, Lund University, Lund, Sweden, 2 NeuroNano Research Center, Department of Experimental
Medical Science, Lund University, Lund, Sweden
Abstract
Neuronal function depends on the properties of the synaptic inputs the neuron receive and on its intrinsic responsiveproperties. However, the conditions for synaptic integration and activation of intrinsic responses may to a large extentdepend on the level of background synaptic input. In this respect, the deep cerebellar nuclear (DCN) neurons are ofparticular interest: they feature a massive background synaptic input and an intrinsic, postinhibitory rebound depolarizationwith profound effects on the synaptic integration. Using in vivo whole cell patch clamp recordings from DCN cells in the cat,we find that the background of Purkinje cell input provides a tonic inhibitory synaptic noise in the DCN cell. Under theseconditions, individual Purkinje cells appear to have a near negligible influence on the DCN cell and clear-cut rebounds aredifficult to induce. Peripheral input that drives the simple spike output of the afferent PCs to the DCN cell generates arelatively strong DCN cell inhibition, but do not induce rebounds. In contrast, synchronized climbing fiber activation, whichleads to a synchronized input from a large number of Purkinje cells, can induce profound rebound responses. In light ofwhat is known about climbing fiber activation under behaviour, the present findings suggest that DCN cell reboundresponses may be an unusual event. Our results also suggest that cortical modulation of DCN cell output require asubstantial co-modulation of a large proportion of the PCs that innervate the cell, which is a possible rationale for theexistence of the cerebellar microcomplex.
Citation: Bengtsson F, Ekerot C-F, Jorntell H (2011) In Vivo Analysis of Inhibitory Synaptic Inputs and Rebounds in Deep Cerebellar Nuclear Neurons. PLoSONE 6(4): e18822. doi:10.1371/journal.pone.0018822
Editor: Fabien Tell, The Research Center of Neurobiology-Neurophysiology of Marseille, France
Received January 21, 2011; Accepted March 4, 2011; Published April 28, 2011
Copyright: � 2011 Bengtsson et al. This is an open-access article distributed under the terms of the Creative Commons Attribution License, which permitsunrestricted use, distribution, and reproduction in any medium, provided the original author and source are credited.
Funding: The work was supported by SENSOPAC (an Integrated Project funded by the EU under FP6, IST-028056-SENSOPAC), by the National Institute ofNeurological Disorders and Stroke Grant (R01 NS-040863), the Swedish Research Council (project no. K2005-04X-14780-03A and K2006-04X-08291-19-3), theSegerfalk Foundation, the Swedish Medical Society, a Linne grant (project number 60012701) from the Swedish Research Council, the Knut and Alice WallenbergFoundation (project number: KAW 2004.0119) and the Medical Faculty at Lund University. The funders had no role in study design, data collection and analysis,decision to publish, or preparation of the manuscript.
Competing Interests: The authors have declared that no competing interests exist.
* E-mail: [email protected]
Introduction
For practical reasons, studies of synaptic integration and
intrinsic neuronal properties have mostly been performed in
excised pieces of brain tissue (brain slices/in vitro preparations).
However, it has gradually become recognized that the information
processing carried out by a neuron may change when it is
provided with in vivo-like patterns of synaptic input [1,2,3]. So far,
the main effects described have been an increase in the sensitivity
and a decrease in the response times to a given input [1,2,3,4,5,6].
However, the impact of synaptic noise on more profound intrinsic
membrane responses remains to be elucidated.
One such intrinsic neuronal response is the postinhibitory,
excitatory rebound response of the deep cerebellar nuclear (DCN)
cells described in vitro [7,8]. The rebound response is a dominating
response in vitro and many theories of cerebellar function
incorporate this response as a central feature of how the
cerebellum works [9,10,11,12].
However, in the cerebellum in vivo DCN cells receive input
from 100’s of Purkinje cells (PCs), which are spontaneously
active at high rates, even in the absence of excitatory synaptic
inputs [13]. This situation is likely to have a big impact on (1)
how the DCN cells integrate synaptic input and (2) the
conditions under which the rebound responses can be elicited.
Although it is clear that rebound-like responses can be evoked in
vivo with electrical stimulation within brain tissue [14,15], the
conditions and limits for evoking rebound responses in vivo, and
thereby their potential functional roles under behaviour, have
not been explored.
DCN cells in the anterior interposed nucleus (AIP) receive PC
input from the C3 zone of the cerebellar cortex, for which the
sagittal microzonal organization has been investigated in a
particularly high level of detail [16,17]. Each microzone receives
climbing fiber input from specific cell groups in the rostral dorsal
accessory part of the inferior olive (rDAO) [18]. The PCs of a
specific microzone in turn have a specific innervation territory in
the AIP [18,19,20,21,22], and the specificity in the olivo-cortico-
nuclear connections forms the basis for the microcomplex
organization of the cerebellar cicruitry [20,22,23,24,25]. In the
present study, we take advantage of the detailed knowledge of the
microcomplex organization for the rDAO-C3 zone-AIP system to
obtain a controlled activation of the PC input to the DCN cells to
characterize the limits and conditions for rebound activation. We
also analyze the spontaneous and evoked IPSPs to explore the
conditions for synaptic integration in DCN cells under a high
background of PC inputs.
PLoS ONE | www.plosone.org 1 April 2011 | Volume 6 | Issue 4 | e18822

Results
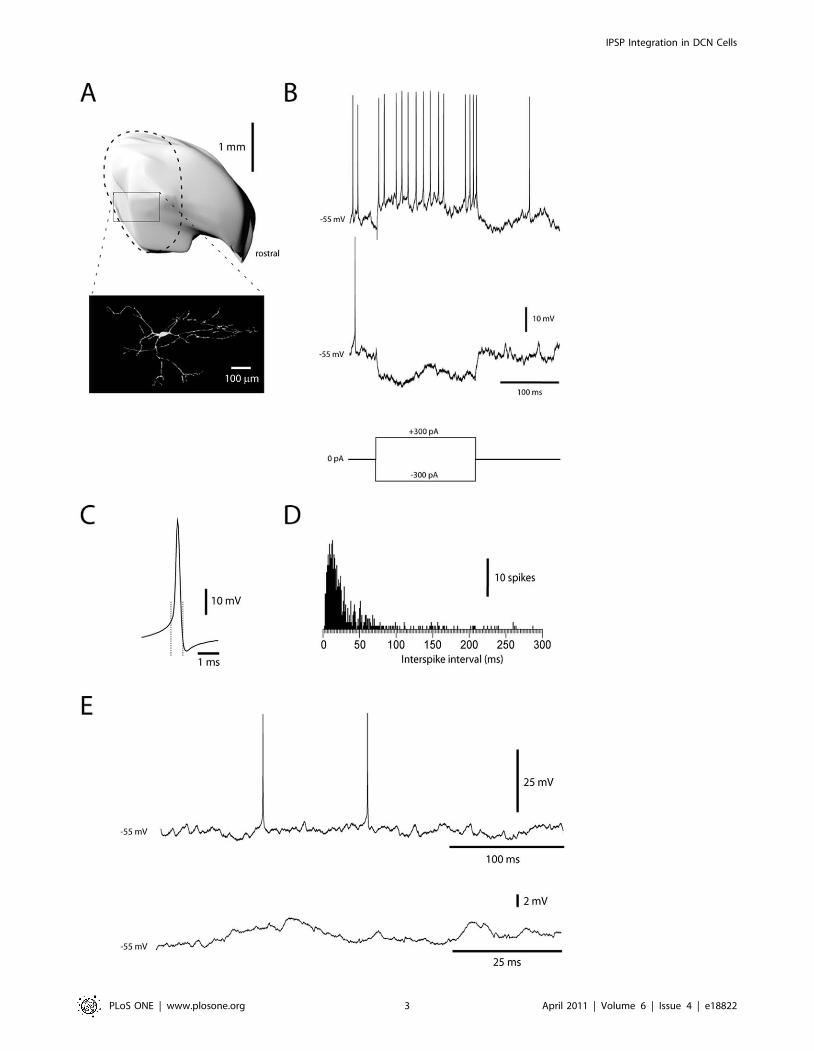
All DCN neurons in the present study were located in the
forelimb area of the anterior interposed nucleus (AIP) in the
decerebrated cat (Fig. 1A). We limited our study to neurons, which
in intracellular recordings had intermediate spike-widths (0.61+/
20.07 ms, mean+/2sd.; N = 36) (Fig. 1C). In contrast, spike-
widths of DCN neurons with broad spikes were 1.1+/20.14 ms
(N = 14) and for neurons with narrow spikes 0.49+/20.06 ms
(N = 3). Apart from spike widths, the neuron type we limited our
analysis to also differed from cells with narrow and broad spikes by
the distribution of their interspike intervals (21+/212 ms, 46+/
211 and 104+/251 ms, respectively) (Fig. 1C,D). DCN neurons
with intermediate spike widths presumably correspond to the non-
GABAergic projection neurons of the DCN [26].
Reconstructions of stained neurons (N = 3, Fig. 1A) were only
partial because of difficulties in following the dendrites along their
entire extent. Stained neurons were characterized by 7–9 dendrites
that each could be followed for more than 0.4 mm and radiated in
all directions. The membrane input resistance of the DCN
neurons, measured from the voltage response obtained by current
step commands (Fig. 1B), was 31+/25.2 MOhm (N = 5). This is in
the order of 1/10 to 1/20 of the values reported for rodents in the
slice in vitro [27,28]. The time-constant, measured from the voltage
response to the hyperpolarizing current step, was 7.1+/21.9 ms.
Spontaneous IPSPsPurkinje cells (PCs) of the C3 zone in our preparation fire
spontaneously at about 40 Hz (Fig. 2), similar to the PC firing rate
observed in the awake animal at rest (see for example [29]). Given
that a DCN cell in the cat receives at least in the order of 100’s of
PC inputs [23,30], one would have expected the baseline to be
heavily influenced by distinct IPSP events. However, this was not
the case. On the contrary, the intracellular DCN recordings
showed long periods with very low amplitude fluctuations,
seemingly devoid of unitary synaptic inputs (Fig. 1E, 3A), which
were only intermittently interrupted by spontaneous large IPSPs
(cf. below). Periods of low amplitude fluctuations were defined as
contiguous periods of 100 ms or more, during which the time
derivative of the recorded membrane potential was free of
deviations larger than two standard deviations. The root mean
square (RMS) value of periods of low amplitude fluctuations was
1.4–1.7 mV, recorded in 14 different cells.
To investigate the conditions that could generate the periods of
low amplitude fluctuations in the face of a high synaptic
background activity we used a model of a DCN neuron, in which
we simulated the integration of inhibitory synaptic inputs driven
by recorded spontaneous spike times in PCs (Fig. 3). The
simulation was carried out using different numbers of PCs
(Fig. 3B). In order to calibrate the model against recorded data,
we adjusted the synaptic weights of the afferent PCs so that the
simulated membrane potential obtained a RMS value of about
1.5 mV, i.e. in the range of the recorded data. Notably, in order
for the simulated membrane potential to stay within the same
RMS range as the recorded signal, the mean unitary IPSP
amplitude had to be very small, i.e. less than 0.1 mV in
simulations with .200 PCs.
With this model, we found that periods of low amplitude
fluctuations could only be obtained with a large number of non-
synchronized PCs onto the DCN neuron (Fig. 3B, bottom). In
contrast, if a low number of non-synchronized PCs converged on
the DCN, the simulation indicated that the baseline would display
a multitude of fast IPSP events (i.e. with deviations higher than 2
standard deviations, Fig. 3B, top). To further verify that the model
produced an accurate reflection of the recorded low amplitude
fluctuation periods in our DCN cells, we made a power spectral
density analysis of the recorded and simulated subthreshold
membrane potentials. Again, with a high number of PCs in the
model, the power spectral density of the baseline activity became
nearly identical to that of the DCN cell recording, which was not
the case for simulations with a low number of PCs (Fig. 3C).
Inferior olive stimulationIn the next step, we wanted to test how synchronization of PC
spike output was reflected in the membrane potential of the DCN
cell. Because of the microcomplex organization of the cerebellum
(see Introduction), in which the DCN cells only receive inputs from
Purkinje cells within a single or a few sagittal microzones, electrical
microstimulation within the inferior olive (IO) to simultaneously
activate the PCs of single microzones should be an effective way to
activate a large set of the inhibitory PC input to a DCN neuron.
Using this approach, we found that thresholds for evoking DCN
cell IPSPs, in the subset of DCN cells that were located within the
same microcomplex as the stimulation electrode in the IO, were
less than 15 uA. At current intensities of 50 uA or less we could
evoke IPSPs of up to 20 mV in amplitude (Fig. 4A) (15+/
22.6 mV, N = 14). These IO-evoked giant IPSPs were maximal,
since further increases in the IO stimulation intensity did not result
in larger IPSPs (Fig. 4A,B). The DCN cells were recorded at a
membrane potential of 245 to 250 mV to prevent the IPSPs
from reaching the reversal potential for chloride. The reversal
potential has been estimated to 278 mV in granule cells using the
same recording solution (Jorntell and Ekerot, 2006), which is also
close to the chloride reversal potential of 275 mV recorded for
DCN cells in vitro with the perforated patch technique [31].
To verify that IO stimulation intensities of this magnitude only
activated one or a few microzones of PCs in the cerebellar cortex,
we recorded the thresholds for evoking climbing fiber field
potentials across the entire mediolateral extent of the cerebellar
C3 zone over several folia (Fig. 4C). With threshold stimulation,
we could evoke climbing fiber field potentials along single cortical
strips/microzones (i.e. sagittally connected bands of spots) in the
medial and lateral parts of the C3 zone (c.f.([17,32]). With
increased stimulation intensities, the number of cortical micro-
zones with activated climbing fiber input also increased, but at the
point at which IO-evoked IPSPs were saturated, only 2–5 cortical
microzones were activated (Fig. 4D, dotted/crossed line). As the
stimulation intensity reached 300 uA, at least half of the
microzones of the C3 zone was activated (Fig. 4D). Notably, in
DCN cells for which the thresholds for IO-evoked IPSPs were
higher (blue lines in Fig. 4B), saturation of the evoked IPSPs
required considerably higher stimulation intensities.
Spontaneous giant IPSPThe predominant low amplitude fluctuation periods of the
DCN cell membrane potential trace (Fig. 3) were intermittently
interrupted by episodes of large spontaneous IPSP-like events
(Fig. 5A,B). These events could have very large peak amplitudes
(typically 3–10 mV) when recorded at a membrane potential of
245 to 250 mV and are referred to as ‘spontaneous giant IPSPs’
below. Spontaneous giant IPSPs had a falling phase with a similar
time course as submaximal IPSPs evoked by IO stimulation
(Fig. 5C) (Since each olivary cell innervates on average 7 PCs [33],
the IO evoked submaximal IPSPs must have been generated by at
least 7 PCs, but possibly more since the IO stimulation could have
activated more than one olivary cell). Spontaneous giant IPSPs
typically occurred in bursts with highly irregular intervals (Fig. 5D)
(the average CV for intervals between spontaneous giant IPSPs
IPSP Integration in DCN Cells
PLoS ONE | www.plosone.org 2 April 2011 | Volume 6 | Issue 4 | e18822
IPSP Integration in DCN Cells
PLoS ONE | www.plosone.org 3 April 2011 | Volume 6 | Issue 4 | e18822

was 98%+/26%) and at an average rate of 8–17 Hz (12.2+/21.2,
all data from 14 DCN recordings of at least 30 seconds each, 0 pA
bias current). About 10% (9.8+/26.1%) of the intervals between
spontaneous giant IPSPs were longer than 1 s, excluding that they
were generated by any single PC (Fig. 2). The high CV of the
intervals and the occurrence of very long intervals suggested that
the spontaneous giant IPSPs were generated by spontaneous
discharges in the climbing fibers, which occur in similar patterns
[34,35]. The widely varying peak amplitudes further suggested
that the spontaneous giant IPSPs were generated by synchronous
activation of multiple olivary cells with a highly variable
recruitment. Both spontaneous and IO-evoked giant IPSPs also
shared the conspicuous feature of a precisely timed, preceding
EPSP (peak amplitude: 0.5–1.5 mV (N = 10 cells)), which is
elicited via the direct climbing fiber collateral input to the DCN
cell [36]. The fact that the spontaneous giant IPSPs always were
smaller than the maximal IO-evoked IPSPs suggested that they
represented the activation of a subpopulation of the IO cells of the
particular microcomplex to which the DCN cell belonged. The
coactivation of small subpopulations of the IO cells could also
explain how spontaneous giant IPSPs episodically could occur at
much higher rates than the spontaneous climbing fiber discharge –
bursts of giant IPSPs could represent the sequential activation of
different subpopulations of IO cells innervating the microcomplex.
Importantly, even though spontaneous giant IPSPs had a strong
inhibitory effect on the spike activity, they failed to induce rebound
excitation (Fig. 5F).
Rebounds evoked by inferior olive stimulationIn contrast, in cells in which IO stimulation evoked saturated
IPSPs (Fig. 4), rebound responses were always evoked (Fig. 6) (the
spike inhibition was 88%+/27.8% for 10–15 ms, followed by a
rebound of +72+/214% lasting at least than 10 ms, N = 14). This
response was hence similar to the rebound depolarizing response
that has been described in vitro [7,8] in that it appeared to require a
preceding hyperpolarizing response beyond a threshold magnitude
(Fig. 6B,C). To directly investigate whether the rebound responses
were generated by the intrinsic membrane properties of the DCN
cells, we compared the responses evoked at different membrane
potentials (Fig. 6D). If the rebound response was directly driven by
excitatory synaptic input, a hyperpolarized membrane potential
would be expected to result in a decrease in the spike response
after the IO stimulation. In contrast, we could systematically
observe a clear INCREASE in the rebound spike response when
the cell was hyperpolarized. Conversely, when the cells were
depolarized there was a clear reduction of the rebound response
(Fig. 6D). A possible interpretation of these findings is that
hyperpolarization leads to a higher degree of deinactivation of low
threshold calcium channels, which in turn could lead to a boost of
the rebound [37].
Since the magnitude of IPSPs in whole cell recordings could
potentially be abnormal due to the uncertainty of the estimates of
the normal intracellular chloride concentrations in vivo, we also
made a large number of extracellular metal electrode recordings
(N = 174). In neurons with low-threshold inhibitory responses
evoked from the IO (N = 36), maximal inhibitory responses (net
change in spike activity 287%+/23.7% during 13+/21.5 ms,
mean+/2sem) were evoked by an increase of the stimulation
intensity of only 0–20 uA from the threshold, i.e. there was a
similar stimulus-response relationship as in the intracellular
records (Fig. 6A,B). In addition, in all these cases (N = 36),
maximal IO-evoked inhibition was associated with prominent
postinhibitory excitatory spike responses (net change in spike
output +124%+/222% during 26+/28.2 ms). At the point at
Figure 2. Activity in Purkinje cell projecting to the AIP. (A) Superimposed simple spike (top) and complex spikes from PC recorded in the C3zone. (B) Frequency distribution histogram of interspike intervals for the simple spike. Bin width, 1 ms. (C) Peri-complex spike histogram of simplespike activity. Bin width 10 ms. (D) Histogram showing that the simple spike frequency remained relatively constant over time. Bin width, 1 s. Werecorded the simple and complex spike activity of 16 PCs during more than 5 mins. The average firing frequency for simple spikes was 42+/25.4 Hzand for complex spikes 2.8+/20.5 Hz.doi:10.1371/journal.pone.0018822.g002
Figure 1. Identification of DCN neurons in whole cell recordings. (A) Location in the forelimb region (dashed line) of the anterior interposednucleus (reconstructed in 3D) and morphological reconstruction of a DCN neuron, recorded with neurobiotin in the recording solution. (B) Responsesof a DCN neuron to rectangular current step commands. (C) Average of 100 spikes recorded in one DCN neuron. Dashed lines indicate the start andthe end of the spike, with the starting point defined as the point at which the second derivative of the voltage trace reached its peak value. (D)Frequency histogram of interspike intervals recorded in this cell. (E) Examples of spontaneous activity recorded at rest (0 pA bias current).doi:10.1371/journal.pone.0018822.g001
IPSP Integration in DCN Cells
PLoS ONE | www.plosone.org 4 April 2011 | Volume 6 | Issue 4 | e18822

which IO stimulation evoked a maximal inhibitory response the
rebound response was saturated, i.e. it did not increase when the
stimulation intensity was increased by 2–3 times (Fig. 6B). In all
cases where the inhibitory response evoked from the IO was
graded (N = 11), we observed that submaximal inhibition, even
though it provided strong spike suppression (267%+/25.7%),
failed to trigger a rebound response (i.e. no increase in post-
inhibitory spike activity beyond 2 SDs of prestimulus activity)
(Fig. 6B).
IO-evoked rebound excitatory responses could not be explained
by the discharge patterns of PC simple spikes or mossy fibers
(Fig. 7). IO stimulation evoked a weak post-complex spike
facilitation of simple spike output (the facilitation was +43%+/
26% (mean+/2sem, N = 14 cells) so the amount of PC inhibition
would actually increase at the time of the DCN cell rebound
response. Similarly, the mossy fiber EPSP responses in whole cell
recordings from 72 granule cells in the C3 zone showed no post-
IO-stimulation change (at one standard deviation vs. prestimulus
activity; Fig. 7, bottom).
DCN cell responses to electrical stimulation in theclimbing fiber receptive field
The Purkinje cells of an entire microzone/microcomplex can
also be activated by using skin stimulation in the specific receptive
field of the climbing fibers of that microzone [17,19]. A
particularly effective way to evoke synchronized climbing fiber
input is to use electrical stimulation of this receptive field [19]. As
shown in Fig. 8A, this approach can be used to evoke a spike
response in the DCN cell that is very similar to that evoked from
the IO (Fig. 6B), i.e. initial excitation followed by strong inhibition
and then a postinhibitory rebound. The climbing fiber receptive
field of the DCN cell was defined as the skin site from which this
type of response (spike suppression of 100% for at least 20 ms
followed by a rebound of at least +50% for 30 ms, analyzed for 16
cells) could be evoked using electrical skin stimulation.
DCN cell responses to manual activation from specificskin areas
We also investigated the responses of DCN cells to more natural
patterns of synaptic input evoked by manual skin stimulation.
Manual skin stimulation within the climbing fiber receptive field
evoked the same response sequence (a spike activity depression of
284+/23.6% followed by a postinhibitory rebound of +46+/
25.5%, lasting for 22+/24 ms and 53+/28 ms, respectively
(N = 16)) as IO-stimulation (Fig. 8B). In the PCs of the C3 zone,
also the parallel fiber (PF) input is evoked from a small receptive
field. Importantly, the location of the PF receptive field is specific
to (and also ‘opposite’ to) that of the climbing fiber receptive field
of the PC (Fig. 8C), meaning that the PCs of a microzone can also
be driven by PF input from one specific skin area [38,39,40].
However, in contrast to the responses evoked from the climbing
fiber receptive field, manual skin stimulation of the PF receptive
field of the PC input evoked inhibition (as expected) but not
rebound. The spike reduction evoked from this skin area was
254%+/28.8% (lasting for 46+/23.0 ms) but the postinhibitory
activity was unchanged (1.3%+/20.7%, measured over the 50 ms
that immediately followed the inhibition) (N = 16) (Fig. 8D).
Discussion
In the present study, we used in vivo whole cell patch clamp
recordings from presumed excitatory projection cells of the
anterior interposed nucleus to explore the integration of PC
inhibitory synaptic inputs and the conditions for evoking
rebounds. We found a number of indications that individual PC
IPSPs in vivo are exceptionally small. At least during rest, the PC
inhibitory inputs seemed to be provided in a relatively tonic
fashion with a low degree of synchronization between the different
PCs (in accordance with observations on PC simple spike firing in
vivo [41,42]). Synchronized PC input, which was effectively
achieved with inferior olivary stimulation, resulted in very large
compound IPSPs in all of our DCN cells. Strong rebound
Figure 3. Non-synchronized, high frequency IPSP inputs generate smooth baseline. (A) Close-up of raw data. (B) Simulated data forvarying number of PC inputs. The number of PCs, the average IPSP frequency and the average IPSP amplitude is indicated for each simulation run. (C)Power spectral density analysis for recorded signal and simulated signal with low and high number of PC inputs, respectively. Numerical comparisonswere made for the relative power in different frequency intervals (inset table).doi:10.1371/journal.pone.0018822.g003
IPSP Integration in DCN Cells
PLoS ONE | www.plosone.org 5 April 2011 | Volume 6 | Issue 4 | e18822

responses required near maximal IO-evoked IPSPs, most likely
involving synchronous activation of all or most PC inputs onto the
DCN cell.
PC-to-DCN cell convergenceA critical factor in the understanding of DCN cell synaptic
integration is the number of convergent PCs onto each cell [30].
estimated the number of PC synapses on an interpositus neuron in
the cat to 18,000, but used only indirect numerical estimates. A
detailed electron microscopy study in the mouse [43] found that
the number of GABA boutons per um2 is 0.023. Since the somatic
diameter of stained DCN cells (this study and [44]) is about 35–
40 um, the surface area of the soma is about 15000 um2. On the
cell body alone, there should hence be more than 200 PC
synapses. Each DCN cell has about 8 dendrites (Fig. 1, see also
[44]) that each is at least 500 um long. About 70% of the dendritic
synapses are inhibitory [45]. With the dendritic diameter
estimated to be between 1 and 2 um, the dendritic surface area
Figure 4. IPSPs evoked in DCN neurons by IO stimulation. (A) Superimposed averages of IPSP responses evoked at different intensities of IO-stimulation in the same DCN cell. Note that even at nearly 10 times the stimulus intensity for evoking a maximal response, the amplitude of theresponse did not change. The double-peaked nature of the evoked IPSP matched that of the complex spikes in the afferent PCs (see panel E). (B)Stimulus-response curves for DCN cells with low-threshold IO-evoked IPSPs (T,15 uA, red curves) compared with stimulus-response curves for IO-evoked IPSPs in DCN neurons with higher thresholds (blue curves). (C) Thresholds for cerebellar cortical climbing fiber field responses along thelongitudinal axis of different folia of the forelimb area of the C3 zone. The recording sites are indicated on a photograph of the cerebellar anteriorlobe sublobules Va-Vc, in which the forelimb area of the C3 zone is located. The borders of the C3 zone are indicated by thick blue lines. The yellow tored coloring indicates the specific thresholds for evoking climbing fiber responses according to the key at left. (D) Comparison between stimulusresponse curves for low threshold DCN cell IPSPs and the number of cortical spots with evoked climbing fiber responses (data averaged from 5experiments, indicated by dashed line and crosses). (E) Maximal IO-evoked IPSPs consistently displayed two peaks, separated by about 3 ms (3.4+/20.7 ms, N = 5, analyzed only for cells with identified, low thresholds for IO-evoked IPSPs). The timing of the two peaks of the IPSP paralleled thetiming of the first two spikes recorded in the complex spikes from whole cell PC recordings (2.5+/20.3 ms, N = 9).doi:10.1371/journal.pone.0018822.g004
IPSP Integration in DCN Cells
PLoS ONE | www.plosone.org 6 April 2011 | Volume 6 | Issue 4 | e18822

was in the order of 25000–50000 um2. Altogether, the dendrites
and soma would be expected to receive roughly 600–1200
inhibitory synapses.
With a convergence of 600–1200 PCs, each firing at about
40 Hz, the DCN cells would be expected to receive PC-IPSP input
at 24000–48000 Hz. A major effect is the reduction of the input
resistance by one or two orders of magnitude, as compared to in
vitro preparations. This, in turn, will for example affect the
magnitude of the unitary IPSPs. Our data indicated that they were
much too small to be resolved individually, probably well below
0.1 mV. This was indicated by the amplitudes of 15–20 mVs of
maximal IO-evoked IPSPs (since these should correspond to the
simultaneous activation of all PCs, a unitary PC IPSP would be in
the range of 0.01–0.04 mV), the presence of IO-evoked IPSPs
with peak amplitudes of 0.8 mV or smaller and the simulations of
the membrane potential with spontaneous PC inputs.
The power spectral analysis showed that periods with low
amplitude fluctuations are a natural consequence of the conver-
gence on the DCN neuron of a large number of PC inhibitory
synaptic inputs with low individual weights, which occurred with a
low degree of synchronization. The resulting tonic inhibition can
be counterbalanced by a cationic leak with a reversal potential of
230 mV, which is a dominating conductance in these neurons
[46], and possibly also by background excitatory synaptic input
[6].
Concerted PC activation and the cerebellarmicrocomplex organization
It follows that the membrane potential of the DCN cell is in a
highly dynamic equilibrium [4,6], that could be rapidly changed as
a result of any increase or decrease in PC activity. However, if
each PC has a low influence, any substantial inhibitory or
Figure 5. Properties of spontaneous giant IPSPs. (A) Raw trace illustrating a sample period (dashed line) during which spontaneous giant IPSPs(arrows) occurred. (B) Close-up of another period with spontaneous giant IPSPs. (C) Raw traces of IPSPs (arrows, middle panel) and histogram of IPSPamplitudes (right panel) evoked by threshold IO stimulation. For comparison, the averaged maximal IO evoked IPSP is illustrated to the left. Dashedlines indicate onset of stimulation and onset latency time of the maximal IPSP. Note the later, variable response latencies (summarized in histogram atbottom right) of the threshold IPSPs, which are likely due to that the direct neuronal activation is replaced with a more indirect, synaptic activation ofthe IO neurons as the stimulation intensity is reduced [65]. All recordings were made at 250 mV. Only IPSP events with an absolute amplitude.0.7 mV were analyzed. (D) Histogram of intervals between sequential giant IPSPs recorded during 3 minutes. The coefficient of variation of theintervals was 104%. (E) Average of the largest spontaneous giant IPSPs (N = 15) recorded from one DCN neuron and average of submaximal IO-evoked IPSPs (N = 10) recorded in the same neuron. Dashed lines indicate start of excitatory component, start of inhibitory component and peak ofinhibitory component, respectively. (F) Peri-IPSP histogram of spike discharge relative to the onset of spontaneous giant IPSPs. Average from 9 DCNneurons. Bin width 5 ms.doi:10.1371/journal.pone.0018822.g005
IPSP Integration in DCN Cells
PLoS ONE | www.plosone.org 7 April 2011 | Volume 6 | Issue 4 | e18822

excitatory cortical modulation of a DCN cell requires a concerted
increase or decrease in the activity of many of the PCs that
innervate it. This is precisely what the microcomplex organization
of the cerebellar olivo-cortico-nuclear circuitry provides for. In a
cerebellar microcomplex, all PCs are innervated by climbing fibers
activated from the same receptive field [19,21]. The parallel fiber
(PF) inputs to all the PCs of a microcomplex are normally from the
same or closely functionally related peripheral sources, and also
the inhibitory input to the PCs of a microcomplex is homogenous
[39,40,47], presumably depending on cortical plasticity processes
[38,48,49]. Thereby, the PCs of a microcomplex are likely to be
activated and inhibited by similar behavioral events and their
firing modulations will be concerted across the microcomplex.
Behavioural studies have shown that this type of concerted PC
activation among functionally related PCs does indeed occur [50].
Relationship to previous in vivo studies of reboundsIn line with previous studies, we showed that IO stimulation can
evoke rebound responses [14,15]. However, with the cortical
recordings of the climbing fiber and mossy fiber responses in PCs
Figure 6. IO-evoked rebound responses. (A) Sample raw trace of rebound response evoked by maximal IO stimulation recorded at restingpotential. (B) Spike responses evoked by subthreshold, submaximal, maximal and supramaximal IO stimulation (20, 30, 50 and 150 uA). Bin width,5 ms. (C) Averages of responses evoked from the IO at different stimulation intensities recorded from another DCN neuron that was hyperpolarizedto prevent spiking, Note all-or-nothing character of the rebound response as the IPSP (arrowheads) became maximal. (D) Relationship betweenmembrane potential and the magnitude of the rebound response (expressed as net number of spikes, beyond prestimulus baseline, per stimulation).Lines indicate data obtained from the same cell at different membrane potentials.doi:10.1371/journal.pone.0018822.g006
IPSP Integration in DCN Cells
PLoS ONE | www.plosone.org 8 April 2011 | Volume 6 | Issue 4 | e18822

and granule cells, the present study provides a control of the extent
of activated elements that was not provided in these previous
studies. Presumably as the result of a more elaborated electrode
placement, we could also obtain our maximal responses at much
lower stimulation intensities (about one order of magnitude), which
means more specific effects in terms of the elements stimulated. In
our experiments, IO stimulation that evoked maximal DCN cell
inhibition also evoked powerful rebound responses in the DCN
cells. In contrast, submaximal IO-evoked inhibition consistently
failed to evoke clear-cut rebounds (i.e. post-inhibitory excitation
that exceeds 2 standard deviations of the pre-stimulus baseline).
These findings are hence partly in line with the findings of [51],
who questioned the role of rebounds in vivo, by confirming a
relatively high threshold in terms of the (high) proportion of the
afferent PCs that need to be activated with a high degree of
synchrony to elicit the rebound response in vivo.
A recent study [14] could also confirm previous studies that
inferior olivary stimulation [15] and high-intensity cortical
stimulation [52] evoke rebound-like responses in the DCN.
However, Hoebeek et al. used very high stimulation intensities
and did not control the effects of the stimulation, raising the issue
that the recorded responses may have been excitatory synaptic
responses rather than a true rebound response. Train stimulation
at current intensities of 150–300 uA is likely to activate more or
less the entire brain stem of the mouse, in particular the pyramidal
tract and the medial lemniscus. In the case of the cerebellar
cortical stimulation [14], the intensity used would be expected to
essentially activate the entire cerebellum. Both types of stimula-
tions could set up substantial prolonged responses in the cerebral
cortex, or other mossy fiber sources, which may spread to the
cerebellum in the form of late excitation in DCN cells.
The presence of rebounds in vivo has been demonstrated directly
by using hyperpolarizing current injections [14]. This issue was
Figure 8. DCN cell responses to skin stimulation. (A) Spike responses of a DCN cell to electrical skin stimulation (single shock, 0.2 ms) within theclimbing fiber receptive field. (B) Responses evoked by manual skin stimulation (50 ms) in the climbing fiber receptive field. (C) Locations of theparallel fiber and climbing fiber receptive fields for the PC input to the DCN neuron. (D) Response evoked by manual skin stimulation in the PC-parallel fiber receptive field. (E) For comparison, a peristimulus histogram of PC simple spike responses to manual skin stimulation within the parallelfiber receptive field. Histogram bin widths, 5 ms in (A), otherwise 10 ms.doi:10.1371/journal.pone.0018822.g008
Figure 7. IO-evoked responses in cortical neurons. Simple spikeresponses of a PC (1) and MF-EPSP responses of a granule cell recordedin the whole cell mode (2) to IO stimulation. The granule cell data isshown both as a sample raw trace (recorded at 265 mV) and as aperistimulus histogram of EPSPs with IO-stimulation at 150 uA, whichevoked substantial local climbing fiber field potentials in the cortex.Inset illustrates that the mossy fibers that innervate the DCN cells arecollaterals of the mossy fibers that innervate the granule cells (2). Binwidths in all histograms, 5 ms.doi:10.1371/journal.pone.0018822.g007
IPSP Integration in DCN Cells
PLoS ONE | www.plosone.org 9 April 2011 | Volume 6 | Issue 4 | e18822

not systematically investigated here, but current induced hyper-
polarization that would correspond to quite intense PC activation
did not evoke rebounds (Fig. 1), in line with our other findings
suggesting a high threshold for inducing rebounds in the adult cat
in vivo. Furthermore, our rebound responses were not entirely
congruent with the rebound responses from in vitro work, which
has described one fast rebound response, attributed to T-type
calcium channels [53], and a slow, prolonged rebound attributed
to persistent sodium current [54]. Possible reasons for the
discrepancy is that the channel composition in juvenile rodents,
explored in vitro, and the adult cat in vivo could be different.
Perhaps more importantly, the very different conductance state of
the in vivo neuron could mean that the activation of these
components is less distinct and may have different dynamics.
Potential roles of the post-inhibitory excitation in vivoWe used manual peripheral activation of PF inputs to PCs but
found that this type of input consistently failed to evoke rebounds
in the DCN cells. Since the temporal response profile and depth of
modulation of PC simple spike activation obtained with this
stimulation (Fig. 8E and [40]) is not different from that recorded
from PCs during different forms of behavioural modulation
[29,50,55] this finding suggested that PF activation of PCs in the
normal operational range may not be capable of eliciting
rebounds. A hypothetical possibility is that the degree of simple
spike synchrony between the different PCs of a microzone would
be dramatically higher in the awake than in the decerebrate
animal. However, speaking against this possibility is that the
background PC simple spike activity in our preparation is very
similar to that obtained in awake animals [29,56], and the degree
of coupling between climbing fibers is similar to that recorded in
intact animals [35,41,57]. In addition, the findings obtained from
IO stimulation in the present study suggest that rebounds require
that a very large proportion of the PCs innervating the same DCN
cell (i.e. PCs activated within the same sagittal band of one or a
few microzones) are activated in near-perfect synchrony (i.e.
within a couple of ms). Available data from awake animals show
that simple spikes among pairs of PCs within the same sagittal,
functional zone can be activated in relative synchrony during
relevant behaviour but only with a coupling ratio of a few percent
above chance [41].
In contrast, we found that synchronized activation of all the
climbing fibers within the microcomplex evoked strong rebounds,
which could suggest a role in vivo in association with climbing fiber
activation. Climbing fiber responses can be readily recorded
during motor performance [58,59,60,61]. In addition, the
climbing fiber system has natural mechanisms for synchronizing
its activation, and climbing fibers within the same microcomplex
display a heightened degree of synchrony [35,62]. However,
movement initiation is associated with a strong depression of IO
excitability [58,60,61,63] and during normal motor control, strong
inhibition followed by rebound excitation is a pattern that is not
observed in the DCN cell firing behaviour [59,64]. A remaining
possibility is that climbing fiber activation sufficiently synchronized
to evoke rebounds occurs only when a strong afferent drive to the
IO and synchronization of IO neurons coincide. This could for
example be triggered by situations that require cerebellar learning.
Alternatively, full-blown rebounds may be experimental artefacts
in the sense that the degree of synchronous activation obtained by
intracranial stimulation is unphysiological. The conductance
machinery underlying the rebound could instead serve the purpose
of speeding up the DCN cell response to situations that lead to a
fast reduction in the PC simple spike output. This would help
DCN cells to overcome the temporal limitations imposed by the
lingering decay phases of the spontaneously activated PC IPSPs
following inhibition from the cortical interneurons. Future studies
are needed to resolve whether rebound responses actually occur
under behavior or whether the conductance machinery that
underlie them have other functions.
Materials and Methods
Adult cats were prepared as previously described [40,65].
Briefly, following an initial anesthesia with propofol (DiprivanHZeneca Ltd, Macclesfield Cheshire, UK), the animals were
decerebrated at the intercollicular level and the anesthesia was
discontinued. The animals were artificially ventilated and the end-
expiratory CO2, blood pressure and rectal temperature were
continuously monitored and maintained within physiological
limits. Mounting in a stereotaxic frame, drainage of cerebrospinal
fluid, pneumothorax and clamping the spinal processes of a few
cervical and lumbar vertebral bodies served to increase the
mechanical stability of the preparation. Our EEG recordings were
characterized by a background of periodic 1–4 Hz oscillatory
activity, periodically interrupted by large-amplitude 7–14 Hz
spindle oscillations lasting for 0.5 s or more. These forms of
EEG activities are normally associated with deep stages of sleep.
The pattern of EEG activity and the blood pressure remained
stable, also on noxious stimulation, throughout experiments.
Recordings and stimulationThe initial delineation of the forelimb area of the C3 zone in the
cerebellar anterior lobe and the continuous monitoring of the
general condition in the sensitive mossy fiber-to-granule cell-to-
parallel fiber pathway were performed as described previously
[39]. Also the general recording procedures and the procedures for
placing stimulation electrodes in the inferior olive have been
described in detail elsewhere [65]. In vivo patch clamp recordings
were made from deep cerebellar nuclear cells with patch pipettes
pulled to 6–14 MOhm (potassium-gluconate based internal
solution, chloride 7.3 mM, same solution as in [65,66]. A special
adaptation for the DCN recordings was to pull the final 10 mm of
the patch pipettes to one long, narrow part (,200 um) using a
custom-made box-filament on a Sutter micropipette puller (P-97,
Sutter Instruments Co., USA). Extracellular metal electrode
recordings (exposed metal tips 3–15 um) were made from DCN
neurons, Purkinje cells of the C3 zone, and climbing fiber field
potentials in the molecular layer of the C3 zone.
In order to localize the anterior interposed nucleus (AIP), all
experiments started with a topographical exploration using a metal
electrode. The microelectrode was inserted at around the border
between the C2 and C3 zones just rostral to the primary fissure at
90u angle relative to the horizontal stereotaxic plane. To keep
track of the electrode location, we continuously monitored the
spontaneous activity and the field and unitary responses evoked by
electrical skin stimulation throughout electrode tracks. The dorsal
border of the AIP was identified by a marked increase in
background noise (presumably reflected neuronal multi-unit
activity) relative to the overlying white matter, and the
characteristic field potentials evoked by electrical skin stimulation
[19,67]. The medial and lateral borders of the AIP could be
identified on the basis of the receptive field topography for
climbing fiber-activated Purkinje cell inputs, as previously
described [19,67,68]. The ventral part of the nucleus was
characterized by a reduction in background noise.
Patch clamp pipettes were lowered under high positive pressure
(3–10 atmospheres) until we reached the dorsal part of the nucleus
according to the previous identification done with the metal
IPSP Integration in DCN Cells
PLoS ONE | www.plosone.org 10 April 2011 | Volume 6 | Issue 4 | e18822

electrode. Once inside the nucleus, the positive pressure was
reduced but not removed. When dramatic increases in tip
resistance occurred as the electrode was advanced, the positive
pressure was removed and a seal formation was attempted. Once
obtained (0.5–6 GOhm), rapid application of negative pressure
was used to gain access to intracellular space (N = 24). The failure
rate to both establish and break seals was markedly higher than in
granule cells [66,69]. In addition to the measures we have
previously used, for DCN neuron recordings major quality checks
for the recordings were the spike amplitudes (at least 35 mV) and
the amplitudes of the spontaneous and IO-evoked giant IPSPs.
Resting membrane potential was defined as the average potential
recorded between spikes at 0 pA bias current within 30 s after
intracellular access (250 to 255 mV). Whenever spike amplitudes
or giant IPSP amplitudes deteriorated by more than 20% from the
initial record after we gained intracellular access, the recording
was stopped since it was taken as an indication that the seal
between the recording electrode and the cell membrane
deteriorated. Access resistance was 7–15 MOhm and compensat-
ed off-line. Some neurons were stained by neurobiotin in the
electrode solution. After sagittal sectioning, the neurons, which
were always located in the AIP, were studied in the confocal
microscope. The reconstruction shown in Fig. 1 was made from
transparent z-stacks of confocal images from three contiguous
sagittal sections. The full extent of the dendrites was not
reconstructed, since the dendrites extended more than 0.4 mm
in each direction perpendicular to the plane of section (sagittal),
which made them very difficult to follow. Patch clamp recordings
from granule cells and Purkinje cells were obtained using the same
protocols as previously described [66], with the difference that
Purkinje cells were recorded with electrodes with 4–8 MOhm
resistance.
Input from the skin was quantified using pairs of closely spaced
percutaneous needles (stimulation with one square pulse at 0.1 ms,
1 Hz, 1 mA) and a strain-gauge device mounted on the index
finger of the investigator [65,66].
Periods of inhibited spike activity and postinhibitory rebound
spike responses were defined as coherent periods, that followed
immediately after a spike inhibition (more than 2 standard
deviations below prestimulus baseline), during which the spiking
activity was increased relative to the prestimulus baseline activity
by at least 2 standard deviations (SDs) for 10 ms or more.
In order to characterize the degree of randomness of the
membrane potential over time, we used Welch’s method to
estimate the power spectral density (PSD) (Matlab). This analysis
was applied to the intracellular activity in DCN cells prevented
from firing using hyperpolarizing bias current and in the traces
simulated by the model (see below).
We defined the onset of IPSPs (and EPSPs in granule cells) after
computing the standard deviation of the second time derivative
(smoothed by adjacent averaging of 65 samples of digitized data)
of the membrane potential during a 10 ms interval representing
baseline membrane activity starting 5 ms before the onset of the
PSP. The point when the recorded second time derivative first
exceeded a value greater than 2 standard deviations over more
than 5 sample bins (sample time 40 us) was taken as a probable
start of a PSP. The potential PSP was then searched for a time-
course typical for IPSPs (EPSPs in granule cells) as assessed by
template-matching (using scalable EPSP templates created from
isolated unitary EPSPs from the same recorded neuron using in-
house software, see [69]) and if a match was found it was classified
as an IPSP (/EPSP). The amplitude of a PSP was measured as the
difference between the average membrane potential during a
60.5 ms epoch around its the peak amplitude and the average
membrane potential during a 1 ms epoch preceding the onset of
the PSP.
Recordings of climbing fiber field potentials in the cerebellar
cortex were made with a tungsten-in-glass microelectrode inserted
in the superficial part of the cortex (inserted 100 um below the
cortical surface). Each folium of the cortex was investigated with
15–20 recording spots within the C3 zone.
All data are given as mean 6 standard deviation unless stated
otherwise.
Model of synaptic integration of IPSPs in DCN cellsA simple model of DCN cell synaptic integration, similar to that
previously used for granule cells [66,69], was used to calculate the
summation of Purkinje cell IPSPs. The only purpose of this model
was to analyze the pattern of membrane potential fluctuations
which could be obtained as a result of varying the number and
temporal density of Purkinje cell synaptic inputs. As the model was
used for simulations within a very narrow membrane potential
range, it was simplified to not include any active membrane
conductances. Different Purkinje cell inputs were assigned one
random out of 4 standardized IPSP amplitudes, with the largest
IPSP having four times the amplitude of the smallest IPSP. The
model assumed a background tonic excitation or leak to
counterbalance the tonic inhibition level to bring the membrane
potential to 250 mV on average (cf [4,46]). The spike times of
Purkinje cell simple spikes, recorded at a temporal resolution of
0.1 ms, was used to activate the IPSPs of the model. The
simulation runs were made with 4, 13, 40, 120 and 600 PC
inhibitory synapses, respectively.
Ethics statementThe experimental procedures were approved in advance by the
Malmo/Lund Animal Research Ethics Committee (permit
number and approval-ID: M32-09).
Acknowledgments
We thank Palmi Thor Thorbergsson at the Dept. of Electrical and
Information Technology, Lund University, for helping us with the power
spectral density analysis.
Author Contributions
Conceived and designed the experiments: FB HJ CFE. Performed the
experiments: FB HJ C-FE. Contributed reagents/materials/analysis tools:
FB HJ. Wrote the paper: HJ.
References
1. Destexhe A, Contreras D (2006) Neuronal computations with stochastic network
states. Science 314: 85–90.
2. Destexhe A, Rudolph M, Pare D (2003) The high-conductance state of
neocortical neurons in vivo. Nat Rev Neurosci 4: 739–751.
3. Wolfart J, Debay D, Le Masson G, Destexhe A, Bal T (2005) Synaptic
background activity controls spike transfer from thalamus to cortex. Nat
Neurosci 8: 1760–1767.
4. Gauck V, Jaeger D (2000) The control of rate and timing of spikes in the deep
cerebellar nuclei by inhibition. Journal of Neuroscience 20: 3006–3016.
5. Anderson JS, Lampl I, Gillespie DC, Ferster D (2000) The contribution of noise to
contrast invariance of orientation tuning in cat visual cortex. Science 290: 1968–1972.
6. Gauck V, Jaeger D (2003) The contribution of NMDA and AMPA
conductances to the control of spiking in neurons of the deep cerebellar nuclei.
J Neurosci 23: 8109–8118.
IPSP Integration in DCN Cells
PLoS ONE | www.plosone.org 11 April 2011 | Volume 6 | Issue 4 | e18822

7. Jahnsen H (1986) Electrophysiological characteristics of neurones in the guinea-
pig deep cerebellar nuclei in vitro. j 372: 129–147.8. Aizenman CD, Manis PB, Linden DJ (1998) Polarity of long-term synaptic gain
change is related to postsynaptic spike firing at a cerebellar inhibitory synapse.
Neuron 21: 827–835.9. Kistler WM, De Zeeuw CI (2003) Time windows and reverberating loops: a
reverse-engineering approach to cerebellar function. Cerebellum 2: 44–54.10. Medina JF, Nores WL, Ohyama T, Mauk MD (2000) Mechanisms of cerebellar
learning suggested by eyelid conditioning. Current Opinion in Neurobiology 10:
717–724.11. Wetmore DZ, Mukamel EA, Schnitzer MJ (2008) Lock-and-key mechanisms of
cerebellar memory recall based on rebound currents. J Neurophysiol 100:2328–2347.
12. Jacobson GA, Rokni D, Yarom Y (2008) A model of the olivo-cerebellar systemas a temporal pattern generator. Trends in Neurosciences 31: 617–625.
13. Cerminara NL, Rawson JA (2004) Evidence that climbing fibers control an
intrinsic spike generator in cerebellar Purkinje cells. Journal of Neuroscience 24:4510–4517.
14. Hoebeek FE, Witter L, Ruigrok TJ, De Zeeuw CI (2010) Differential olivo-cerebellar cortical control of rebound activity in the cerebellar nuclei. Proc Natl
Acad Sci U S A 107: 8410–8415.
15. Kitai ST, McCrea RA, Preston RJ, Bishop GA (1977) Electrophysiological andhorseradish peroxidase studies of precerebellar afferents to the nucleus
interpositus anterior. I. Climbing fiber system. Brain Res 122: 197–214.16. Apps R, Hawkes R (2009) Cerebellar cortical organization: a one-map
hypothesis. Nat Rev Neurosci 10: 670–681.17. Ekerot CF, Garwicz M, Schouenborg J (1991) Topography and nociceptive
receptive fields of climbing fibres projecting to the cerebellar anterior lobe in the
cat. Journal of Physiology (London) 441: 257–274.18. Garwicz M, Apps R, Trott JR (1996) Micro-organization of olivocerebellar and
corticonuclear connections of the paravermal cerebellum in the cat. EuropeanJournal of Neuroscience 8: 2726–2738.
19. Garwicz M, Ekerot CF (1994) Topographical organization of the cerebellar
cortical projection to nucleus interpositus anterior in the cat. Journal ofPhysiology (London) 474: 245–260.
20. Apps R, Garwicz M (2005) Anatomical and physiological foundations ofcerebellar information processing. Nature Reviews: Neuroscience 6: 297–311.
21. Apps R, Garwicz M (2000) Precise matching of olivo-cortical divergence andcortico-nuclear convergence between somatotopically corresponding areas in the
medial C1 and medial C3 zones of the paravermal cerebellum. European
Journal of Neuroscience 12: 205–214.22. Sugihara I (2010) Compartmentalization of the Deep Cerebellar Nuclei Based
on Afferent Projections and Aldolase C Expression. Cerebellum.23. Ito M (1984) The Cerebellum and Neural Control. New York: Raven Press.
24. Oscarsson O (1979) Functional units of the cerebellum - sagittal zones and
microzones. Trends in Neurosciences 2: 144–145.25. Andersson G, Oscarsson O (1978) Climbing fiber microzones in cerebellar
vermis and their projection to different groups of cells in the lateral vestibularnucleus. Experimental Brain Research 32: 565–579.
26. Uusisaari M, Obata K, Knopfel T (2007) Morphological and electrophysiolog-ical properties of GABAergic and non-GABAergic cells in the deep cerebellar
nuclei. J Neurophysiol 97: 901–911.
27. Gauck V, Thomann M, Jaeger D, Borst A (2001) Spatial distribution of low- andhigh-voltage-activated calcium currents in neurons of the deep cerebellar nuclei.
J Neurosci 21: RC158.28. Pedroarena CM, Schwarz C (2003) Efficacy and short-term plasticity at
GABAergic synapses between Purkinje and cerebellar nuclei neurons.
J Neurophysiol 89: 704–715.29. Cerminara NL, Apps R, Marple-Horvat DE (2009) An internal model of a
moving visual target in the lateral cerebellum. J Physiol 587: 429–442.30. Palkovits M, Mezey E, Hamori J, Szentagothai J (1977) Quantitative histological
analysis of the cerebellar nuclei in the cat. I. Numerical data on cells and
synapses. Exp Brain Res 28: 189–209.31. Zheng N, Raman IM (2009) Ca currents activated by spontaneous firing and
synaptic disinhibition in neurons of the cerebellar nuclei. J Neurosci 29:9826–9838.
32. Ekerot CF, Larson B (1979) The dorsal spino-olivocerebellar system in the cat.II. Somatotopical organization. Experimental Brain Research 36: 219–232.
33. Sugihara I, Wu HS, Shinoda Y (2001) The entire trajectories of single
olivocerebellar axons in the cerebellar cortex and their contribution toCerebellar compartmentalization. J Neurosci 21: 7715–7723.
34. Chorev E, Yarom Y, Lampl I (2007) Rhythmic episodes of subthresholdmembrane potential oscillations in the rat inferior olive nuclei in vivo. J Neurosci
27: 5043–5052.
35. Bengtsson F, Jorntell H (2009) Climbing Fiber Coupling between AdjacentPurkinje Cell Dendrites in Vivo. Front Cell Neurosci 3: 7.
36. Llinas R, Muhlethaler M (1988) Electrophysiology of guinea-pig cerebellarnuclear cells in the in vitro brain stem-cerebellar preparation. J Physiol 404:
241–258.37. Alvina K, Ellis-Davies G, Khodakhah K (2009) T-type calcium channels
mediate rebound firing in intact deep cerebellar neurons. Neuroscience 158:
635–641.38. Dean P, Porrill J, Ekerot CF, Jorntell H (2010) The cerebellar microcircuit as an
adaptive filter: experimental and computational evidence. Nat Rev Neurosci 11: 30–43.
39. Ekerot CF, Jorntell H (2001) Parallel fibre receptive fields of Purkinje cells and
interneurons are climbing fibre-specific. EurJNeurosci 13: 1303–1310.40. Jorntell H, Ekerot CF (2002) Reciprocal bidirectional plasticity of parallel fiber
receptive fields in cerebellar Purkinje cells and their afferent interneurons.
Neuron 34: 797–806.41. De Zeeuw CI, Koekkoek SK, Wylie DR, Simpson JI (1997) Association between
dendritic lamellar bodies and complex spike synchrony in the olivocerebellarsystem. J Neurophysiol 77: 1747–1758.
42. Wise AK, Cerminara NL, Marple-Horvat DE, Apps R (2010) Mechanisms of
synchronous activity in cerebellar Purkinje cells. J Physiol 588: 2373–2390.43. Sultan F, Konig T, Mock M, Thier P (2002) Quantitative organization of
neurotransmitters in the deep cerebellar nuclei of the Lurcher mutant. J CompNeurol 452: 311–323.
44. Matsushita M, Iwahori N (1971) Structural organization of the interpositus andthe dentate nuclei. Brain Res 35: 17–36.
45. De Zeeuw CI, Berrebi AS (1996) Individual Purkinje cell axons terminate on
both inhibitory and excitatory neurons in the cerebellar and vestibular nuclei.AnnNYAcadSci 781: 607–610.
46. Raman IM, Gustafson AE, Padgett D (2000) Ionic currents and spontaneousfiring in neurons isolated from the cerebellar nuclei. Journal of Neuroscience 20:
9004–9016.
47. Ekerot CF, Jorntell H (2003) Parallel fiber receptive fields: a key tounderstanding cerebellar operation and learning. Cerebellum 2: 101–109.
48. Jorntell H, Hansel C (2006) Synaptic memories upside down: bidirectionalplasticity at cerebellar parallel fiber-Purkinje cell synapses. Neuron 52: 227–238.
49. Jorntell H, Bengtsson F, Schonewille M, De Zeeuw CI (2010) Cerebellarmolecular layer interneurons - computational properties and roles in learning.
Trends Neurosci 33: 524–532.
50. Medina JF, Lisberger SG (2007) Variation, signal, and noise in cerebellarsensory-motor processing for smooth-pursuit eye movements. J Neurosci 27:
6832–6842.51. Alvina K, Walter JT, Kohn A, Ellis-Davies G, Khodakhah K (2008) Questioning
the role of rebound firing in the cerebellum. Nat Neurosci 11: 1256–1258.
52. Hesslow G (1994) Inhibition of classically conditioned eyeblink responses bystimulation of the cerebellar cortex in the decerebrate cat. Journal of Physiology
(London) 476: 245–256.53. Molineux ML, McRory JE, McKay BE, Hamid J, Mehaffey WH, et al. (2006)
Specific T-type calcium channel isoforms are associated with distinct burstphenotypes in deep cerebellar nuclear neurons. Proc Natl Acad Sci U S A 103:
5555–5560.
54. Sangrey T, Jaeger D (2010) Analysis of distinct short and prolonged componentsin rebound spiking of deep cerebellar nucleus neurons. Eur J Neurosci 32:
1646–1657.55. Pasalar S, Roitman AV, Durfee WK, Ebner TJ (2006) Force field effects on
cerebellar Purkinje cell discharge with implications for internal models. Nat
Neurosci 9: 1404–1411.56. Armstrong DM, Rawson JA (1979) Activity patterns of cerebellar cortical
neurones and climbing fibre afferents in the awake cat. Journal of Physiology(London) 289: 425–448.
57. Lang EJ, Sugihara I, Welsh JP, Llinas R (1999) Patterns of spontaneous purkinjecell complex spike activity in the awake rat. J Neurosci 19: 2728–2739.
58. Apps R, Atkins MJ, Garwicz M (1997) Gating of cutaneous input to cerebellar
climbing fibres during a reaching task in the cat. Journal of Physiology (London)502(Pt 1): 203–214.
59. van Kan PL, Houk JC, Gibson AR (1993) Output organization of intermediatecerebellum of the monkey. J Neurophysiol 69: 57–73.
60. Gibson AR, Horn KM, Pong M (2004) Activation of climbing fibers.
Cerebellum 3: 212–221.61. Horn KM, Pong M, Gibson AR (2004) Discharge of inferior olive cells during
reaching errors and perturbations. Brain Res 996: 148–158.62. Sugihara I, Marshall SP, Lang EJ (2007) Relationship of complex spike
synchrony bands and climbing fiber projection determined by reference to
aldolase C compartments in Crus IIa of the rat cerebellar cortex. Journal ofComparative Neurology 501: 13–29.
63. Horn KM, Van Kan PL, Gibson AR (1996) Reduction of rostral dorsalaccessory olive responses during reaching. J Neurophysiol 76: 4140–4151.
64. Mason CR, Miller LE, Baker JF, Houk JC (1998) Organization of reaching andgrasping movements in the primate cerebellar nuclei as revealed by focal
muscimol inactivations. J Neurophysiol 79: 537–554.
65. Jorntell H, Ekerot CF (2003) Receptive field plasticity profoundly alters thecutaneous parallel fiber synaptic input to cerebellar interneurons in vivo. Journal
of Neuroscience 23: 9620–9631.66. Jorntell H, Ekerot CF (2006) Properties of somatosensory synaptic integration in
cerebellar granule cells in vivo. Journal of Neuroscience 26: 11786–11797.
67. Ekerot CF, Jorntell H, Garwicz M (1995) Functional relation betweencorticonuclear input and movements evoked on microstimulation in cerebellar
nucleus interpositus anterior in the cat. Experimental Brain Research 106:365–376.
68. Jorntell H, Ekerot CF (1999) Topographical organization of projections to catmotor cortex from nucleus interpositus anterior and forelimb skin. Journal of
Physiology (London) 514(Pt 2): 551–566.
69. Bengtsson F, Jorntell H (2009) Sensory transmission in cerebellar granule cellsrelies on similarly coded mossy fiber inputs. Proc Natl Acad Sci U S A 106:
2389–2394.
IPSP Integration in DCN Cells
PLoS ONE | www.plosone.org 12 April 2011 | Volume 6 | Issue 4 | e18822


![THE EFFECT OF SYNAPTIC DEPRESSION ON MODEL INHIBITORY … · phenomenological models [2], [36] have been able to capture the essence of synaptic transmission between pairs of neurons](https://img.dokumen.tips/doc/110x75/5f3df958df75e7017103e764/the-effect-of-synaptic-depression-on-model-inhibitory-phenomenological-models-2.jpg)


