Embed Size (px)
Citation preview
RESEARCH ARTICLE Open Access
In vitro three-dimensional modeling of fallopiantube secretory epithelial cellsKate Lawrenson1†, Maria Notaridou2†, Nathan Lee1, Elizabeth Benjamin3, Ian J Jacobs4, Christopher Jones2
and Simon A Gayther1*
Abstract
Background: Fallopian tube secretory epithelial cells (FTSECs) have been implicated as a cell-of-origin for high-grade serous epithelial ovarian cancer. However, there are relatively few in vitro models of this tissue type availablefor use in studies of FTSEC biology and malignant transformation. In vitro three-dimensional (3D) cell culture modelsaim to recreate the architecture and geometry of tissues in vivo and restore the complex network of cell-cell/cell-matrix interactions that occur throughout the surface of the cell membrane.
Results: We have established and characterized 3D spheroid culture models of primary FTSECs. FTSEC spheroidscontain central cores of hyaline matrix surrounded by mono- or multi-layer epithelial sheets. We found that 3Dculturing alters the molecular characteristics of FTSECs compared to 2D cultures of the same cells. Gene expressionprofiling identified more than a thousand differentially expressed genes between 3D and 2D cultures of the sameFTSEC lines. Pathways significantly under-represented in 3D FTSEC cultures were associated with cell cycleprogression and DNA replication. This was also reflected in the reduced proliferative indices observed in 3Dspheroids stained for the proliferation marker MIB1. Comparisons with gene expression profiles of fresh fallopiantube tissues revealed that 2D FTSEC cultures clustered with follicular phase tubal epithelium, whereas 3D FTSECcultures clustered with luteal phase samples.
Conclusions: This 3D model of fallopian tube secretory epithelial cells will advance our ability to study theunderlying biology and etiology of fallopian tube tissues and the pathogenesis of high-grade serous epithelialovarian cancer.
Keywords: Fallopian tube secretory epithelial cells, Gene expression microarray, Three-dimensional in vitro models,Tissue microenvironment, Ovarian cancer
BackgroundThe human fallopian tube is lined by a simple columnarepithelium consisting of both ciliated and secretoryepithelial cells. Fallopian tube secretory epithelial cells(FTSECs) are of particular interest given their proposedrole as a precursor tissue for high-grade serous epithelialovarian cancers, which is the most common ovarian can-cer histological subtype [1,2]. However, the biology ofFTSECs remains poorly understood. This is partly dueto difficulties in accessing normal primary FTSECs andin the subsequent development of in vitro models of this
tissue type. Primary FTSECs have proved challenging toculture, reportedly loosing expression of differentiatedmarkers when propagated in vitro. This indicates a cellu-lar plasticity that is strongly influenced by culture condi-tions [3]. Recent advances in ex vivo culture of fallopianepithelia have been achieved by plating the cells ontocollagen matrices [4,5]. Under these conditions lineageand differentiation markers are maintained, but unfortu-nately the cells have an limited capacity for proliferationand cannot be sub-cultured without being immortalizedor transformed [6].Current evidence suggests that FTSECs are a likely
origin of high-grade serous epithelial ovarian cancers(HGSOCs) [1,2]. The biological characteristics of the cell-of -origin for different cancers are likely to influencethe etiology of the malignant disease [7], including the
* Correspondence: [email protected]†Equal contributors1Department of Preventive Medicine, University of Southern California/KeckSchool of Medicine, 1450 Biggy Street, Los Angeles, CaliforniaFull list of author information is available at the end of the article
© 2013 Lawrenson et al.; licensee BioMed Central Ltd. This is an Open Access article distributed under the terms of theCreative Commons Attribution License (http://creativecommons.org/licenses/by/2.0), which permits unrestricted use,distribution, and reproduction in any medium, provided the original work is properly cited.
Lawrenson et al. BMC Cell Biology 2013, 14:43http://www.biomedcentral.com/1471-2121/14/43

somatic genetic events that occur during neoplastic devel-opment. Gaining a better understanding of the initiationand early stage development of HGSOCs is likely to be ofclinical importance. The majority of epithelial ovarian tu-mors are diagnosed at the late stages (stage III/IV) when5-year survival rates are only ~30%. In contrast, patientsdiagnosed with stage I disease have survival rates of over90%, and are often cured by surgical intervention. Theability to detect HGSOCs in the earliest stages would rep-resent a realistic approach to reducing mortality and a bet-ter understanding of the role of FTSECs in the initiationof HGSOCs may be key to the discovery of novel bio-markers associated with early stage disease.Although the basic functions of all epithelia are the
same, there are many fundamental differences in cellmorphology, cell function and gene expression acrossthe epithelial cells of different organs. Regardless of celltype, classical cell culture techniques typically involveculturing cells on plastic surfaces that bear limited re-semblance to the organs from which the cells originate.Traditional two-dimensional (2D) in vitro techniquesloose the architecture and geometrical features of tissuesin vivo, as well as the gradients of nutrients, oxygen, car-bon dioxide and other factors that characterize thesetissues. Seminal work in three-dimensional (3D) model-ing by Bissell and colleagues has shown that culturingnormal breast epithelial cells in 3D can induce gland for-mation, restore cellular polarity and induce upregulatedexpression of biologically active molecules, therebysimulating the in vivo environment [8-10]. Similar ap-proaches have since been used for other epithelial celltypes. In most instances, 3D cultures display histologicalfeatures and differentiated phenotypes that are rarelyachieved in 2D cultures [10-12]. The aim of the currentstudy was to establish new 3D models of FTSECs, and
to investigate whether 3D FTSEC cultures are morebiologically relevant models than monolayer cultures.We developed in vitro 3D cultures of FTSECs thatmimic features of fallopian tube epithelia in vivo; thecharacteristics of these models suggests that they aresuitable for studying both the biology of normal fallopiantube epithelial cells and the early-stage development ofHGSOCs.
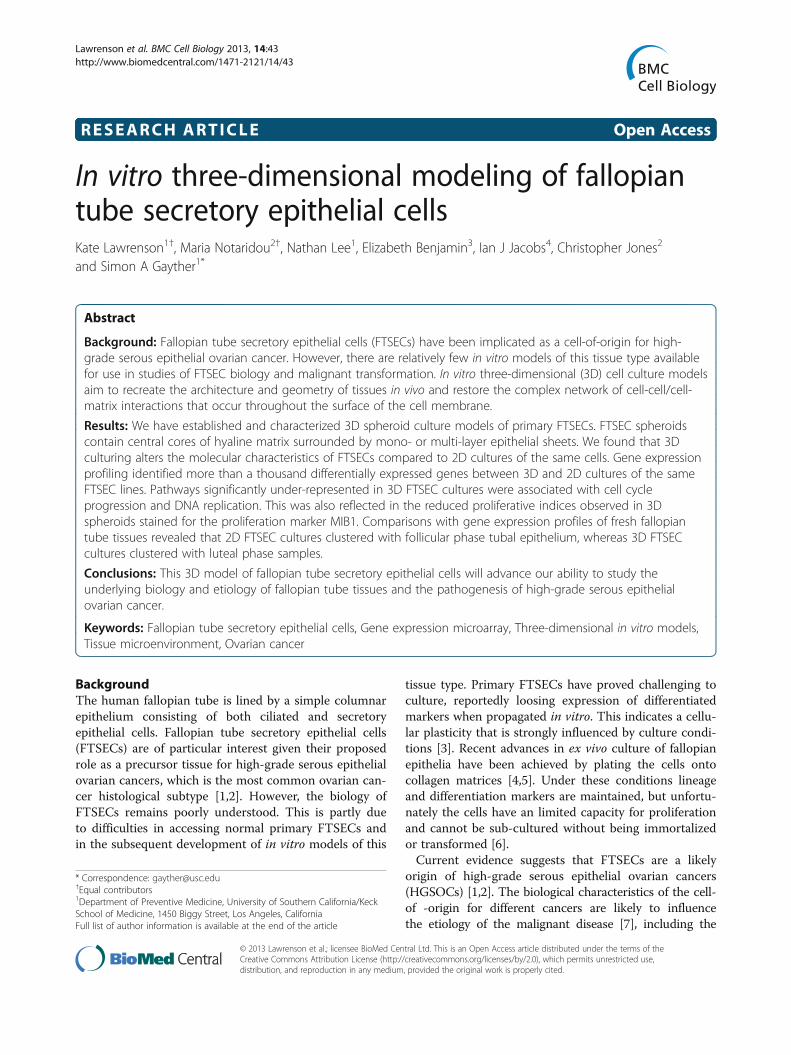
ResultsIsolation of fallopian tube secretory epithelial cellsFallopian tube epithelial cells were isolated from disease-free fallopian tubes of women undergoing partial salpin-gectomy or total abdominal hysterectomy with bilateralsalpingoophorectomy (Table 1). Epithelial cells wereharvested from the ampullary regions of fallopian tubesamples. Primary cell cultures were confirmed as epithe-lial by immunofluorescent staining to analyze expressionof cytokeratin (Figure 1a). Two of five FTSEC cultures alsoexpressed the gynecological epithelial cell marker CA125.The absence of stromal contaminants was shown by ab-sence of staining for Von Willenbrand Factor VIII, whichis expressed by endothelial cells, and the fibroblasticmarker fibroblast surface protein (data not shown).Almost all cells in FTSEC cultures expressed the lineage-specific marker PAX8 in the nucleus (Figure 1a), indicat-ing that the cell culture protocol enriched for fallopiantube secretory epithelial cells (FTSECs) [1,13]. FTSECsalso expressed vimentin and laminin (Figure 1a). FTSECscould be successfully subcultured but had a limited life-span in culture, which is typical of primary cells. PrimaryFTSECs proliferated for 34–60 days (equating to 10–16passages in culture) (Figure 1b) at which point cells ac-quired senescent morphologies and expressed senescence-associated β-galactosidase (data not shown). The modal
Table 1 Patient information
Cell line Patient age Menopausal status Clinical data Histopathological diagnosis Histopathology report – ovariesand fallopian tubes
FTE01 51 NK Mucinous cyst on theleft ovary
Benign follicular and epithelialinclusion cysts. Benign serous
cystadenofibroma.
Fallopian tubes normal
FTE02 50 NK Benign fibrosis Leiomyomas and folicular ovariancysts
Mild chronic salpingitis in one tubebut no evidence of malignancy
FTE03 38 Pre Fibroid. Adenomyosis Secretory endometrium and benignleiomyoma
Fallopian tubes normal
FTE05 54 Post Complex hyperplasiawith atypia
Autolysed endometrium.No evidence of invasive carcinoma.
Benign leiomyomas.
Post-menopausal features present inboth ovaries. Fallopian tubes normal.
FTE283 65 Post Grade 2–3 endometrialcancer
Grade 2 endometrioidadenocarcinoma of the endometrium,
with >50% myometrial invasion
Post-menopausal features present inboth ovaries. Fallopian tubes normal.
FTE284 60 Post History provenendometrial cancer
Grade 2 endometrioid adenocarcinomaof the endometrium
Fallopian tubes normal
FTSEC cell lines were collected from patients aged between 38 and 65 years of age. For all patients, fallopian tube tissues were confirmed to be histologicallynormal. For the pre-menopausal patient the phase of the menstrual cycle was not known. NK = not known.
Lawrenson et al. BMC Cell Biology 2013, 14:43 Page 2 of 15http://www.biomedcentral.com/1471-2121/14/43
karyotype for 5/6 cell lines was 46,XX (Figure 1c); one cellline (FTSEC05) displayed an abnormal karyotype of 46,XX, t(6;6) (p21;q21) in all of the 19 cells analyzed, and wastherefore excluded from further analyses.
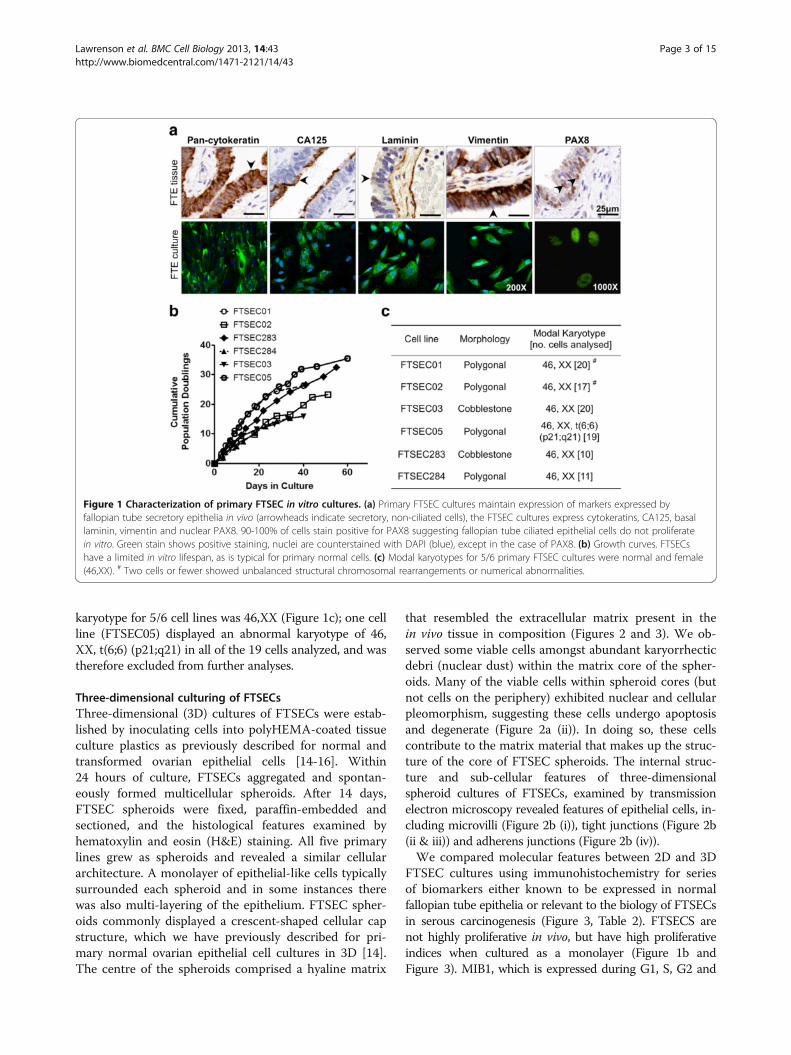
Three-dimensional culturing of FTSECsThree-dimensional (3D) cultures of FTSECs were estab-lished by inoculating cells into polyHEMA-coated tissueculture plastics as previously described for normal andtransformed ovarian epithelial cells [14-16]. Within24 hours of culture, FTSECs aggregated and spontan-eously formed multicellular spheroids. After 14 days,FTSEC spheroids were fixed, paraffin-embedded andsectioned, and the histological features examined byhematoxylin and eosin (H&E) staining. All five primarylines grew as spheroids and revealed a similar cellulararchitecture. A monolayer of epithelial-like cells typicallysurrounded each spheroid and in some instances therewas also multi-layering of the epithelium. FTSEC spher-oids commonly displayed a crescent-shaped cellular capstructure, which we have previously described for pri-mary normal ovarian epithelial cell cultures in 3D [14].The centre of the spheroids comprised a hyaline matrix
that resembled the extracellular matrix present in thein vivo tissue in composition (Figures 2 and 3). We ob-served some viable cells amongst abundant karyorrhecticdebri (nuclear dust) within the matrix core of the spher-oids. Many of the viable cells within spheroid cores (butnot cells on the periphery) exhibited nuclear and cellularpleomorphism, suggesting these cells undergo apoptosisand degenerate (Figure 2a (ii)). In doing so, these cellscontribute to the matrix material that makes up the struc-ture of the core of FTSEC spheroids. The internal struc-ture and sub-cellular features of three-dimensionalspheroid cultures of FTSECs, examined by transmissionelectron microscopy revealed features of epithelial cells, in-cluding microvilli (Figure 2b (i)), tight junctions (Figure 2b(ii & iii)) and adherens junctions (Figure 2b (iv)).We compared molecular features between 2D and 3D
FTSEC cultures using immunohistochemistry for seriesof biomarkers either known to be expressed in normalfallopian tube epithelia or relevant to the biology of FTSECsin serous carcinogenesis (Figure 3, Table 2). FTSECS arenot highly proliferative in vivo, but have high proliferativeindices when cultured as a monolayer (Figure 1b andFigure 3). MIB1, which is expressed during G1, S, G2 and
Figure 1 Characterization of primary FTSEC in vitro cultures. (a) Primary FTSEC cultures maintain expression of markers expressed byfallopian tube secretory epithelia in vivo (arrowheads indicate secretory, non-ciliated cells), the FTSEC cultures express cytokeratins, CA125, basallaminin, vimentin and nuclear PAX8. 90-100% of cells stain positive for PAX8 suggesting fallopian tube ciliated epithelial cells do not proliferatein vitro. Green stain shows positive staining, nuclei are counterstained with DAPI (blue), except in the case of PAX8. (b) Growth curves. FTSECshave a limited in vitro lifespan, as is typical for primary normal cells. (c) Modal karyotypes for 5/6 primary FTSEC cultures were normal and female(46,XX). # Two cells or fewer showed unbalanced structural chromosomal rearrangements or numerical abnormalities.
Lawrenson et al. BMC Cell Biology 2013, 14:43 Page 3 of 15http://www.biomedcentral.com/1471-2121/14/43
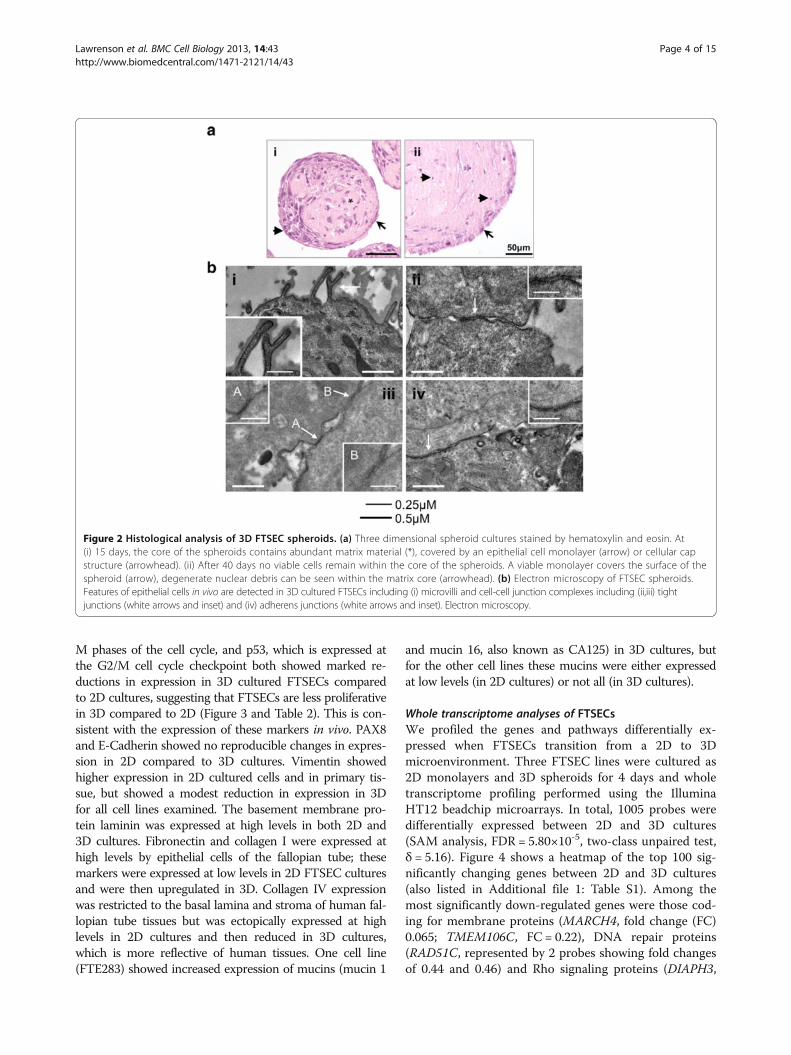
M phases of the cell cycle, and p53, which is expressed atthe G2/M cell cycle checkpoint both showed marked re-ductions in expression in 3D cultured FTSECs comparedto 2D cultures, suggesting that FTSECs are less proliferativein 3D compared to 2D (Figure 3 and Table 2). This is con-sistent with the expression of these markers in vivo. PAX8and E-Cadherin showed no reproducible changes in expres-sion in 2D compared to 3D cultures. Vimentin showedhigher expression in 2D cultured cells and in primary tis-sue, but showed a modest reduction in expression in 3Dfor all cell lines examined. The basement membrane pro-tein laminin was expressed at high levels in both 2D and3D cultures. Fibronectin and collagen I were expressed athigh levels by epithelial cells of the fallopian tube; thesemarkers were expressed at low levels in 2D FTSEC culturesand were then upregulated in 3D. Collagen IV expressionwas restricted to the basal lamina and stroma of human fal-lopian tube tissues but was ectopically expressed at highlevels in 2D cultures and then reduced in 3D cultures,which is more reflective of human tissues. One cell line(FTE283) showed increased expression of mucins (mucin 1
and mucin 16, also known as CA125) in 3D cultures, butfor the other cell lines these mucins were either expressedat low levels (in 2D cultures) or not all (in 3D cultures).
Whole transcriptome analyses of FTSECsWe profiled the genes and pathways differentially ex-pressed when FTSECs transition from a 2D to 3Dmicroenvironment. Three FTSEC lines were cultured as2D monolayers and 3D spheroids for 4 days and wholetranscriptome profiling performed using the IlluminaHT12 beadchip microarrays. In total, 1005 probes weredifferentially expressed between 2D and 3D cultures(SAM analysis, FDR = 5.80×10⁻⁵, two-class unpaired test,δ = 5.16). Figure 4 shows a heatmap of the top 100 sig-nificantly changing genes between 2D and 3D cultures(also listed in Additional file 1: Table S1). Among themost significantly down-regulated genes were those cod-ing for membrane proteins (MARCH4, fold change (FC)0.065; TMEM106C, FC = 0.22), DNA repair proteins(RAD51C, represented by 2 probes showing fold changesof 0.44 and 0.46) and Rho signaling proteins (DIAPH3,
Figure 2 Histological analysis of 3D FTSEC spheroids. (a) Three dimensional spheroid cultures stained by hematoxylin and eosin. At(i) 15 days, the core of the spheroids contains abundant matrix material (*), covered by an epithelial cell monolayer (arrow) or cellular capstructure (arrowhead). (ii) After 40 days no viable cells remain within the core of the spheroids. A viable monolayer covers the surface of thespheroid (arrow), degenerate nuclear debris can be seen within the matrix core (arrowhead). (b) Electron microscopy of FTSEC spheroids.Features of epithelial cells in vivo are detected in 3D cultured FTSECs including (i) microvilli and cell-cell junction complexes including (ii,iii) tightjunctions (white arrows and inset) and (iv) adherens junctions (white arrows and inset). Electron microscopy.
Lawrenson et al. BMC Cell Biology 2013, 14:43 Page 4 of 15http://www.biomedcentral.com/1471-2121/14/43
Figure 3 Immunohistochemical staining of 2D and 3D cultured FTSECs and primary fallopian tube tissue. Immunohistochemical stainingof p53 (clone Do7) and a proliferation marker, MIB1, shows high expression of both markers in 2D cultured cells but low expression in 3D FTSECcultures (at day 15), and fallopian tube epithelia in vivo. Laminin and vimentin are expressed in 2D cultured cells, 3D cultured cells and in vivo.Expression of fibronectin and collagen I was lower in 2D cultured cells than 3D cultures and fallopian tube epithelia in fresh tissue specimens.Collagen IV is predominantly expressed in the basal lamina (arrow) and stroma of fallopian tubes but was expressed at high levels by 2D culturedcells. Expression of this marker was low/absent in 3D cultured cells. * Fibronectin, collagen I and collagen IV were also examined in FTSEC01,expression patterns were highly similar to data for FTSEC283 and FTSEC03. Expression of collagen IV was restricted to the basal lamina andstroma. None of the markers examined were differentially expressed by ciliated and secretory fallopian tube epithelial cells in vivo. As our cellisolates were predominantly PAX8 positive (Figure 1), we do not expect ciliated cells to be present in the FTSEC spheroid cultures. Brown staindenotes positive antigen detection, cells are counterstained with eosin (blue). Light microscopy. Scale bars = 100 μm.
Lawrenson et al. BMC Cell Biology 2013, 14:43 Page 5 of 15http://www.biomedcentral.com/1471-2121/14/43
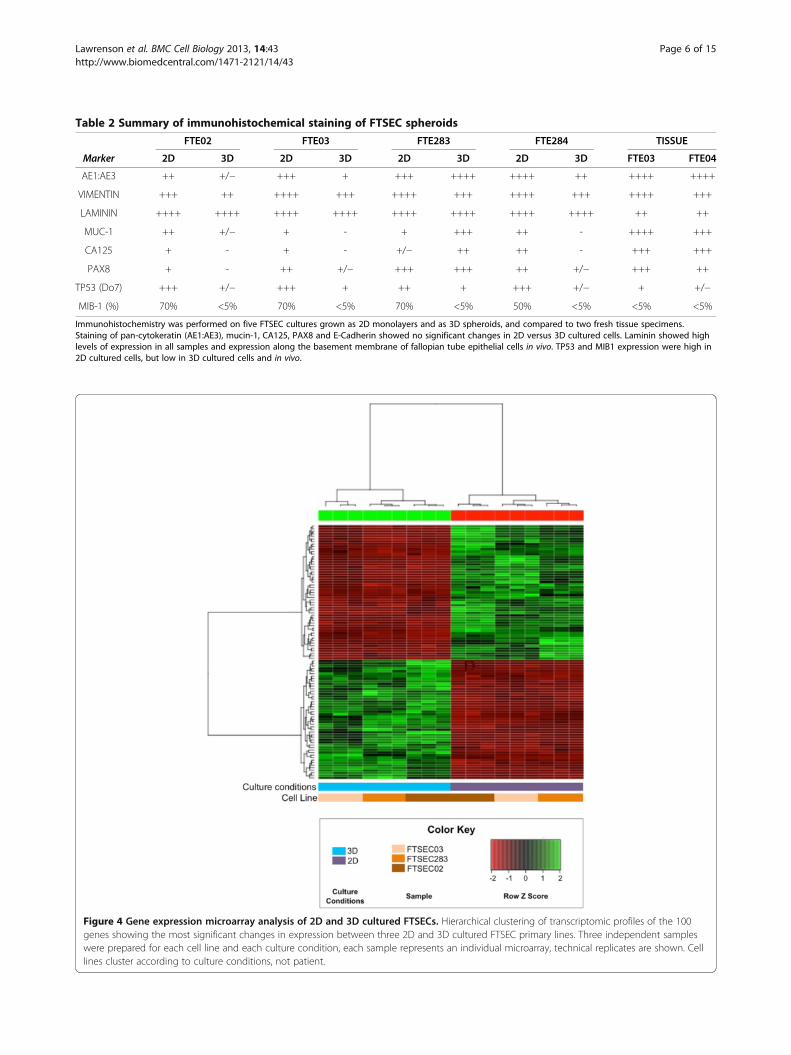
Table 2 Summary of immunohistochemical staining of FTSEC spheroids
FTE02 FTE03 FTE283 FTE284 TISSUE
Marker 2D 3D 2D 3D 2D 3D 2D 3D FTE03 FTE04
AE1:AE3 ++ +/− +++ + +++ ++++ ++++ ++ ++++ ++++
VIMENTIN +++ ++ ++++ +++ ++++ +++ ++++ +++ ++++ +++
LAMININ ++++ ++++ ++++ ++++ ++++ ++++ ++++ ++++ ++ ++
MUC-1 ++ +/− + - + +++ ++ - ++++ +++
CA125 + - + - +/− ++ ++ - +++ +++
PAX8 + - ++ +/− +++ +++ ++ +/− +++ ++
TP53 (Do7) +++ +/− +++ + ++ + +++ +/− + +/−
MIB-1 (%) 70% <5% 70% <5% 70% <5% 50% <5% <5% <5%
Immunohistochemistry was performed on five FTSEC cultures grown as 2D monolayers and as 3D spheroids, and compared to two fresh tissue specimens.Staining of pan-cytokeratin (AE1:AE3), mucin-1, CA125, PAX8 and E-Cadherin showed no significant changes in 2D versus 3D cultured cells. Laminin showed highlevels of expression in all samples and expression along the basement membrane of fallopian tube epithelial cells in vivo. TP53 and MIB1 expression were high in2D cultured cells, but low in 3D cultured cells and in vivo.
Figure 4 Gene expression microarray analysis of 2D and 3D cultured FTSECs. Hierarchical clustering of transcriptomic profiles of the 100genes showing the most significant changes in expression between three 2D and 3D cultured FTSEC primary lines. Three independent sampleswere prepared for each cell line and each culture condition, each sample represents an individual microarray, technical replicates are shown. Celllines cluster according to culture conditions, not patient.
Lawrenson et al. BMC Cell Biology 2013, 14:43 Page 6 of 15http://www.biomedcentral.com/1471-2121/14/43
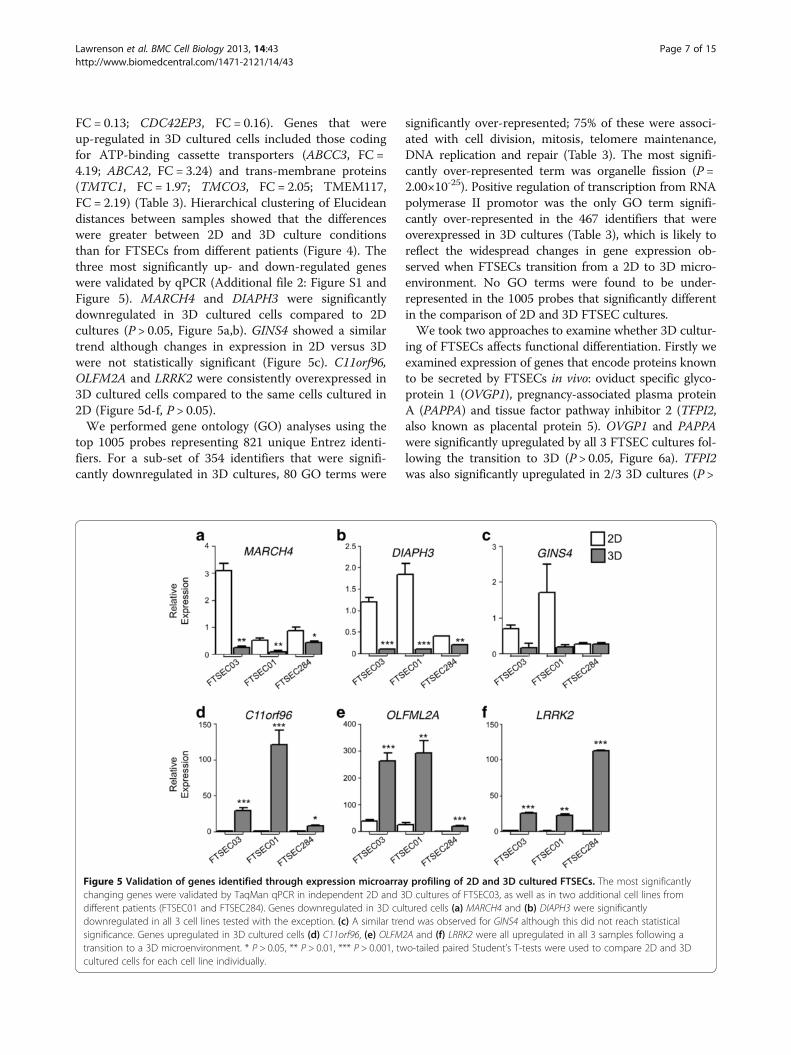
FC = 0.13; CDC42EP3, FC = 0.16). Genes that wereup-regulated in 3D cultured cells included those codingfor ATP-binding cassette transporters (ABCC3, FC =4.19; ABCA2, FC = 3.24) and trans-membrane proteins(TMTC1, FC = 1.97; TMCO3, FC = 2.05; TMEM117,FC = 2.19) (Table 3). Hierarchical clustering of Elucideandistances between samples showed that the differenceswere greater between 2D and 3D culture conditionsthan for FTSECs from different patients (Figure 4). Thethree most significantly up- and down-regulated geneswere validated by qPCR (Additional file 2: Figure S1 andFigure 5). MARCH4 and DIAPH3 were significantlydownregulated in 3D cultured cells compared to 2Dcultures (P > 0.05, Figure 5a,b). GINS4 showed a similartrend although changes in expression in 2D versus 3Dwere not statistically significant (Figure 5c). C11orf96,OLFM2A and LRRK2 were consistently overexpressed in3D cultured cells compared to the same cells cultured in2D (Figure 5d-f, P > 0.05).We performed gene ontology (GO) analyses using the
top 1005 probes representing 821 unique Entrez identi-fiers. For a sub-set of 354 identifiers that were signifi-cantly downregulated in 3D cultures, 80 GO terms were
significantly over-represented; 75% of these were associ-ated with cell division, mitosis, telomere maintenance,DNA replication and repair (Table 3). The most signifi-cantly over-represented term was organelle fission (P =2.00×10⁻²⁵). Positive regulation of transcription from RNApolymerase II promotor was the only GO term signifi-cantly over-represented in the 467 identifiers that wereoverexpressed in 3D cultures (Table 3), which is likely toreflect the widespread changes in gene expression ob-served when FTSECs transition from a 2D to 3D micro-environment. No GO terms were found to be under-represented in the 1005 probes that significantly differentin the comparison of 2D and 3D FTSEC cultures.We took two approaches to examine whether 3D cultur-
ing of FTSECs affects functional differentiation. Firstly weexamined expression of genes that encode proteins knownto be secreted by FTSECs in vivo: oviduct specific glyco-protein 1 (OVGP1), pregnancy-associated plasma proteinA (PAPPA) and tissue factor pathway inhibitor 2 (TFPI2,also known as placental protein 5). OVGP1 and PAPPAwere significantly upregulated by all 3 FTSEC cultures fol-lowing the transition to 3D (P > 0.05, Figure 6a). TFPI2was also significantly upregulated in 2/3 3D cultures (P >
Figure 5 Validation of genes identified through expression microarray profiling of 2D and 3D cultured FTSECs. The most significantlychanging genes were validated by TaqMan qPCR in independent 2D and 3D cultures of FTSEC03, as well as in two additional cell lines fromdifferent patients (FTSEC01 and FTSEC284). Genes downregulated in 3D cultured cells (a) MARCH4 and (b) DIAPH3 were significantlydownregulated in all 3 cell lines tested with the exception. (c) A similar trend was observed for GINS4 although this did not reach statisticalsignificance. Genes upregulated in 3D cultured cells (d) C11orf96, (e) OLFM2A and (f) LRRK2 were all upregulated in all 3 samples following atransition to a 3D microenvironment. * P > 0.05, ** P > 0.01, *** P > 0.001, two-tailed paired Student’s T-tests were used to compare 2D and 3Dcultured cells for each cell line individually.
Lawrenson et al. BMC Cell Biology 2013, 14:43 Page 7 of 15http://www.biomedcentral.com/1471-2121/14/43
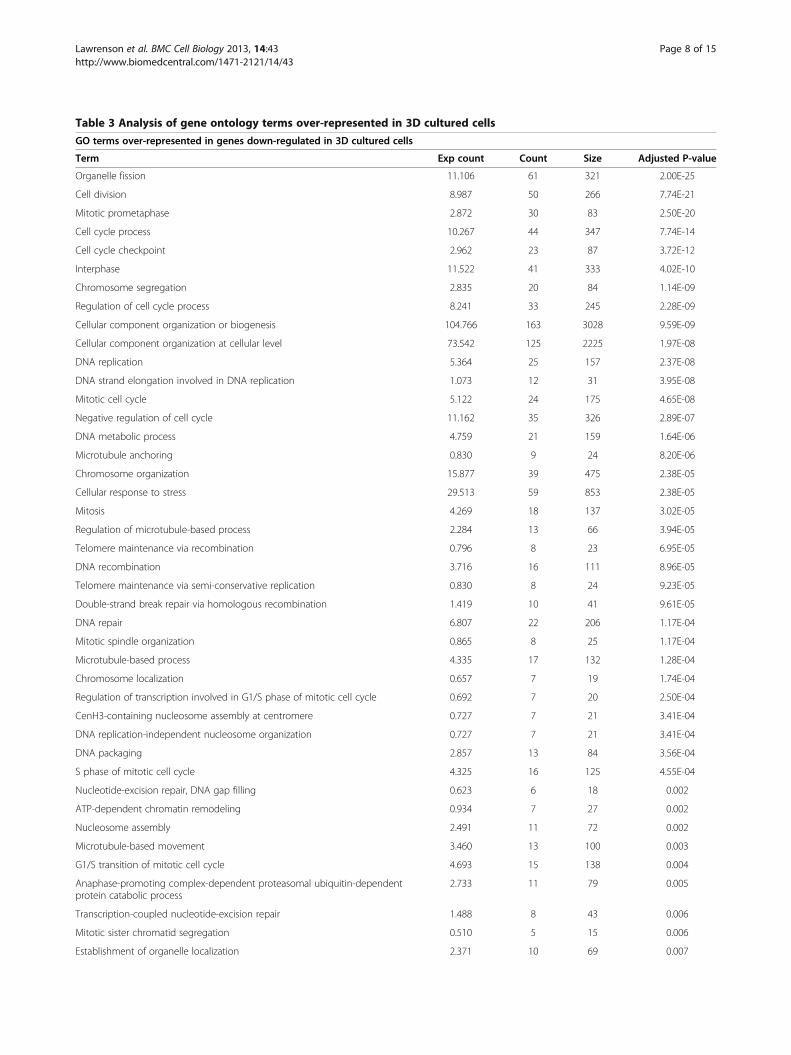
Table 3 Analysis of gene ontology terms over-represented in 3D cultured cells
GO terms over-represented in genes down-regulated in 3D cultured cells
Term Exp count Count Size Adjusted P-value
Organelle fission 11.106 61 321 2.00E-25
Cell division 8.987 50 266 7.74E-21
Mitotic prometaphase 2.872 30 83 2.50E-20
Cell cycle process 10.267 44 347 7.74E-14
Cell cycle checkpoint 2.962 23 87 3.72E-12
Interphase 11.522 41 333 4.02E-10
Chromosome segregation 2.835 20 84 1.14E-09
Regulation of cell cycle process 8.241 33 245 2.28E-09
Cellular component organization or biogenesis 104.766 163 3028 9.59E-09
Cellular component organization at cellular level 73.542 125 2225 1.97E-08
DNA replication 5.364 25 157 2.37E-08
DNA strand elongation involved in DNA replication 1.073 12 31 3.95E-08
Mitotic cell cycle 5.122 24 175 4.65E-08
Negative regulation of cell cycle 11.162 35 326 2.89E-07
DNA metabolic process 4.759 21 159 1.64E-06
Microtubule anchoring 0.830 9 24 8.20E-06
Chromosome organization 15.877 39 475 2.38E-05
Cellular response to stress 29.513 59 853 2.38E-05
Mitosis 4.269 18 137 3.02E-05
Regulation of microtubule-based process 2.284 13 66 3.94E-05
Telomere maintenance via recombination 0.796 8 23 6.95E-05
DNA recombination 3.716 16 111 8.96E-05
Telomere maintenance via semi-conservative replication 0.830 8 24 9.23E-05
Double-strand break repair via homologous recombination 1.419 10 41 9.61E-05
DNA repair 6.807 22 206 1.17E-04
Mitotic spindle organization 0.865 8 25 1.17E-04
Microtubule-based process 4.335 17 132 1.28E-04
Chromosome localization 0.657 7 19 1.74E-04
Regulation of transcription involved in G1/S phase of mitotic cell cycle 0.692 7 20 2.50E-04
CenH3-containing nucleosome assembly at centromere 0.727 7 21 3.41E-04
DNA replication-independent nucleosome organization 0.727 7 21 3.41E-04
DNA packaging 2.857 13 84 3.56E-04
S phase of mitotic cell cycle 4.325 16 125 4.55E-04
Nucleotide-excision repair, DNA gap filling 0.623 6 18 0.002
ATP-dependent chromatin remodeling 0.934 7 27 0.002
Nucleosome assembly 2.491 11 72 0.002
Microtubule-based movement 3.460 13 100 0.003
G1/S transition of mitotic cell cycle 4.693 15 138 0.004
Anaphase-promoting complex-dependent proteasomal ubiquitin-dependentprotein catabolic process
2.733 11 79 0.005
Transcription-coupled nucleotide-excision repair 1.488 8 43 0.006
Mitotic sister chromatid segregation 0.510 5 15 0.006
Establishment of organelle localization 2.371 10 69 0.007
Lawrenson et al. BMC Cell Biology 2013, 14:43 Page 8 of 15http://www.biomedcentral.com/1471-2121/14/43
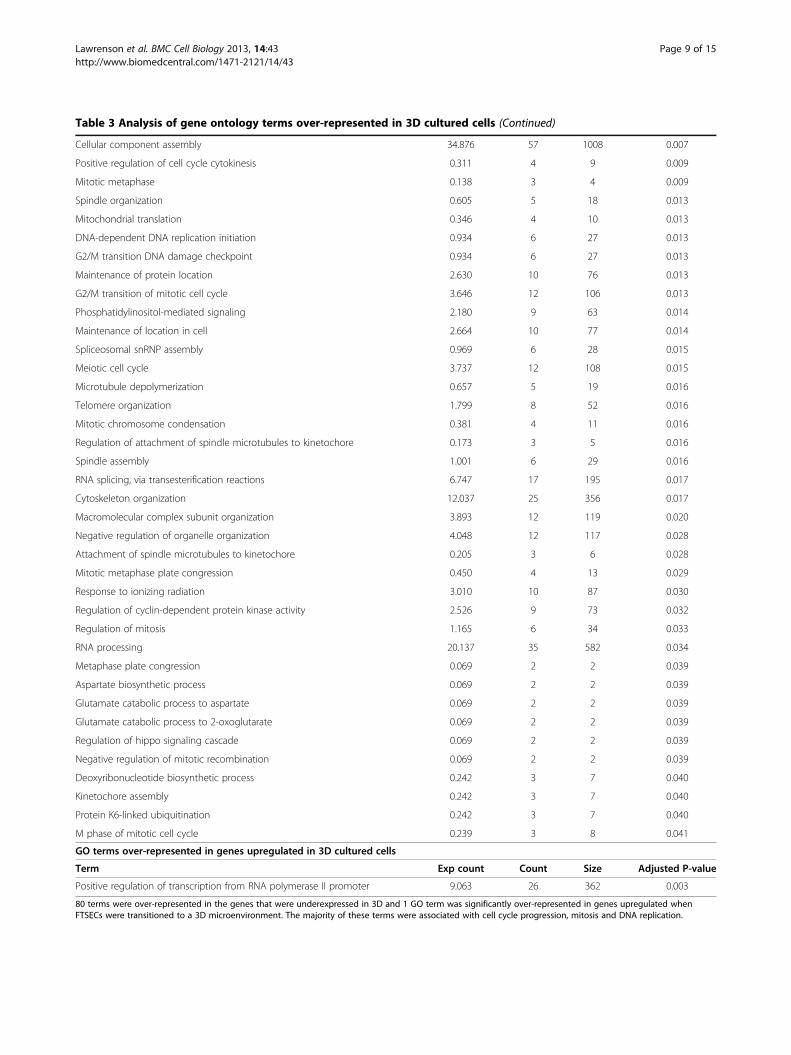
Table 3 Analysis of gene ontology terms over-represented in 3D cultured cells (Continued)
Cellular component assembly 34.876 57 1008 0.007
Positive regulation of cell cycle cytokinesis 0.311 4 9 0.009
Mitotic metaphase 0.138 3 4 0.009
Spindle organization 0.605 5 18 0.013
Mitochondrial translation 0.346 4 10 0.013
DNA-dependent DNA replication initiation 0.934 6 27 0.013
G2/M transition DNA damage checkpoint 0.934 6 27 0.013
Maintenance of protein location 2.630 10 76 0.013
G2/M transition of mitotic cell cycle 3.646 12 106 0.013
Phosphatidylinositol-mediated signaling 2.180 9 63 0.014
Maintenance of location in cell 2.664 10 77 0.014
Spliceosomal snRNP assembly 0.969 6 28 0.015
Meiotic cell cycle 3.737 12 108 0.015
Microtubule depolymerization 0.657 5 19 0.016
Telomere organization 1.799 8 52 0.016
Mitotic chromosome condensation 0.381 4 11 0.016
Regulation of attachment of spindle microtubules to kinetochore 0.173 3 5 0.016
Spindle assembly 1.001 6 29 0.016
RNA splicing, via transesterification reactions 6.747 17 195 0.017
Cytoskeleton organization 12.037 25 356 0.017
Macromolecular complex subunit organization 3.893 12 119 0.020
Negative regulation of organelle organization 4.048 12 117 0.028
Attachment of spindle microtubules to kinetochore 0.205 3 6 0.028
Mitotic metaphase plate congression 0.450 4 13 0.029
Response to ionizing radiation 3.010 10 87 0.030
Regulation of cyclin-dependent protein kinase activity 2.526 9 73 0.032
Regulation of mitosis 1.165 6 34 0.033
RNA processing 20.137 35 582 0.034
Metaphase plate congression 0.069 2 2 0.039
Aspartate biosynthetic process 0.069 2 2 0.039
Glutamate catabolic process to aspartate 0.069 2 2 0.039
Glutamate catabolic process to 2-oxoglutarate 0.069 2 2 0.039
Regulation of hippo signaling cascade 0.069 2 2 0.039
Negative regulation of mitotic recombination 0.069 2 2 0.039
Deoxyribonucleotide biosynthetic process 0.242 3 7 0.040
Kinetochore assembly 0.242 3 7 0.040
Protein K6-linked ubiquitination 0.242 3 7 0.040
M phase of mitotic cell cycle 0.239 3 8 0.041
GO terms over-represented in genes upregulated in 3D cultured cells
Term Exp count Count Size Adjusted P-value
Positive regulation of transcription from RNA polymerase II promoter 9.063 26 362 0.003
80 terms were over-represented in the genes that were underexpressed in 3D and 1 GO term was significantly over-represented in genes upregulated whenFTSECs were transitioned to a 3D microenvironment. The majority of these terms were associated with cell cycle progression, mitosis and DNA replication.
Lawrenson et al. BMC Cell Biology 2013, 14:43 Page 9 of 15http://www.biomedcentral.com/1471-2121/14/43
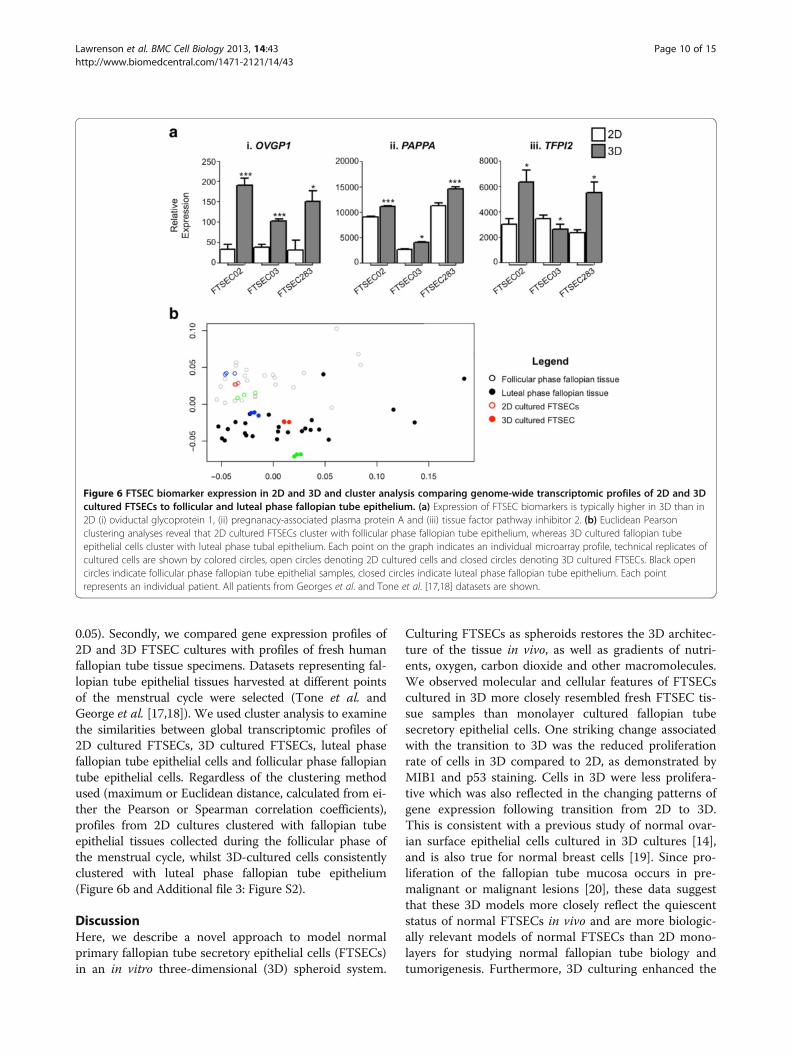
0.05). Secondly, we compared gene expression profiles of2D and 3D FTSEC cultures with profiles of fresh humanfallopian tube tissue specimens. Datasets representing fal-lopian tube epithelial tissues harvested at different pointsof the menstrual cycle were selected (Tone et al. andGeorge et al. [17,18]). We used cluster analysis to examinethe similarities between global transcriptomic profiles of2D cultured FTSECs, 3D cultured FTSECs, luteal phasefallopian tube epithelial cells and follicular phase fallopiantube epithelial cells. Regardless of the clustering methodused (maximum or Euclidean distance, calculated from ei-ther the Pearson or Spearman correlation coefficients),profiles from 2D cultures clustered with fallopian tubeepithelial tissues collected during the follicular phase ofthe menstrual cycle, whilst 3D-cultured cells consistentlyclustered with luteal phase fallopian tube epithelium(Figure 6b and Additional file 3: Figure S2).
DiscussionHere, we describe a novel approach to model normalprimary fallopian tube secretory epithelial cells (FTSECs)in an in vitro three-dimensional (3D) spheroid system.
Culturing FTSECs as spheroids restores the 3D architec-ture of the tissue in vivo, as well as gradients of nutri-ents, oxygen, carbon dioxide and other macromolecules.We observed molecular and cellular features of FTSECscultured in 3D more closely resembled fresh FTSEC tis-sue samples than monolayer cultured fallopian tubesecretory epithelial cells. One striking change associatedwith the transition to 3D was the reduced proliferationrate of cells in 3D compared to 2D, as demonstrated byMIB1 and p53 staining. Cells in 3D were less prolifera-tive which was also reflected in the changing patterns ofgene expression following transition from 2D to 3D.This is consistent with a previous study of normal ovar-ian surface epithelial cells cultured in 3D cultures [14],and is also true for normal breast cells [19]. Since pro-liferation of the fallopian tube mucosa occurs in pre-malignant or malignant lesions [20], these data suggestthat these 3D models more closely reflect the quiescentstatus of normal FTSECs in vivo and are more biologic-ally relevant models of normal FTSECs than 2D mono-layers for studying normal fallopian tube biology andtumorigenesis. Furthermore, 3D culturing enhanced the
Figure 6 FTSEC biomarker expression in 2D and 3D and cluster analysis comparing genome-wide transcriptomic profiles of 2D and 3Dcultured FTSECs to follicular and luteal phase fallopian tube epithelium. (a) Expression of FTSEC biomarkers is typically higher in 3D than in2D (i) oviductal glycoprotein 1, (ii) pregnanacy-associated plasma protein A and (iii) tissue factor pathway inhibitor 2. (b) Euclidean Pearsonclustering analyses reveal that 2D cultured FTSECs cluster with follicular phase fallopian tube epithelium, whereas 3D cultured fallopian tubeepithelial cells cluster with luteal phase tubal epithelium. Each point on the graph indicates an individual microarray profile, technical replicates ofcultured cells are shown by colored circles, open circles denoting 2D cultured cells and closed circles denoting 3D cultured FTSECs. Black opencircles indicate follicular phase fallopian tube epithelial samples, closed circles indicate luteal phase fallopian tube epithelium. Each pointrepresents an individual patient. All patients from Georges et al. and Tone et al. [17,18] datasets are shown.
Lawrenson et al. BMC Cell Biology 2013, 14:43 Page 10 of 15http://www.biomedcentral.com/1471-2121/14/43
production of secretory products by FTSECs. Oviductspecific glycoprotein 1 (OVGP1), also known as mucin 9,is normally secreted by non-cilated tubal epithelia and im-proves in vitro fertilization rates by reducing polyspermyand increasing blastocyst formation rates [21,22]. Wefound OVGP1 to be upregulated ~2-4 fold in FTSECs cul-tured in 3D. Similarly, a second glycoprotein, pregnancyassociated plasma protein A (PAPPA) was also signifi-cantly upregulated in 3D. Increased expression of thesebioactive glycoprotein molecules suggests FTSECs grownin 3D have enhanced functional differentiation comparedto their 2D counterparts.We compared global expression profiles of 2D and 3D
cultured cells with biomarker expression in primaryfresh fallopian tube tissue samples. We showed that geneprofiles in 2D cultured cells cluster with follicular phasefallopian epithelial tissue, whereas 3D cultured cells clus-ter with luteal phase fallopian tube samples. This resultmay also be driven by the proliferative signature of the2D cultured cells, as the follicular phase of the men-strual cycle is the proliferative phase, when raised levelsof estradiol stimulate proliferation of the epithelia liningthe endometrium and fallopian tube [23]. We found thatgene expression profiles of 3D cultured FTSECs clusterwith those of luteal phase fallopian tube tissues. Thisphase of the cell cycle is the secretory phase, which mayindicate a commitment to secretory differentiationFTSECs cultured in 3D. Consistent with this, we ob-served upregulation of an secreted proteins as well as anFTSEC marker (PAX8) when one FTSEC line was cul-tured in 3D. These data strongly suggest that culturingin 3D enhances functional differentiation of FTSECs toa secretory phenotype.Previous studies have reported culture of human fallo-
pian tube epithelia ex vivo, on collagen gel and alginatematrices [4,5]. These models have significantly advancedour ability to model human and murine polarized fallo-pian tube epithelia in vitro. However, one limitation ofex vivo models is the restricted ability to sub-culture thecells. Using a growth factor rich media we were able tosubculture the fallopian tube epithelial cells we isolated.We then selected a spheroid culture method to establish3D cultures because this approach offers flexibility fordownstream molecular analysis, and can be scaled up ordown to perform high-throughput molecular screeningor large-scale mass cultures. Although we did not supplymatrix proteins in the cultures, fallopian tube secretoryepithelial cells produced a matrix of which laminin wasa major component. Laminin is the major protein in thebasal lamina, the aspect of the basement membrane towhich epithelial cells are adhered in vivo via integrin-mediated interactions. We hypothesize that altered cell-matrix interactions may contribute to the altered geneexpression patterns we observed. While the 3D FTSEC
cultures presented here do not recreate the complexconvoluted architecture of the lumen of a fallopian tubein vivo, in FTSEC spheroids the epithelial cell-basementmembrane interaction is restored. We observed that theouter surface of the spheroid is reminiscent of the lumenof the fallopian tube in that cells are in contact withother mucosal epithelia throughout the lateral domainsof the cell, and basal domains of the cells are in contactwith a basement membrane-type matrix. In contrast,cells trapped within the spheroid cores are surroundedby matrix, which is an ectopic microenvironment fornormal epithelial cells. We hypothesize that this mayinduce programmed cell death, resulting in the high fre-quency of apoptotic cell debris observed within the coresbut not at the periphery of FTSEC spheroids. Alterna-tively the physiological conditions within spheroidscould have contributed to the changes survival of cells atthe centre of the multicellular aggregates, since mathem-atical modeling suggests that deficiencies in ATP [24],glucose, hydrogen and oxygen [25] may all induce nec-rotic cell death of cells within spheroid cores.Many key cellular processes are now known to be dif-
ferently regulated between 2D and 3D cultures, and vari-ous factors can induce differential gene expression in3D, including altered cell-cell and/or cell-matrix commu-nications, nutrient and oxygen gradients, and reducedrates of proliferation. We propose that the 3D models aremore biologically relevant tools of FTSECs than trad-itional 2D monolayers with which to study fallopian tubeepithelial cell biology and pathogenesis. Perhaps thegreatest potential for clinical impact of these models willcome from their use in studies of tumor initiation. Thishas become particularly significant since it was establishedrecently that the epithelia lining of the fallopian tube likelyrepresents the cell of origin for a proportion of HGSOCs.HGSOCs bear morphological resemblance to Müllerianepithelia and over 80% of this tumor type overexpressPAX8 [26], an FTSEC marker that can be used to distin-guish ovarian serous tumors from other, morphologicallysimilar neoplasms [27,28]. We identified additional FTSECbiomarkers that represent novel candidate HGSOC bio-markers. These include LRRK2, a gene that encodes a kin-ase involved in Parkinsons Disease [29,30]. LRRK2 has notpreviously been implicated in ovarian cancer developmentbut analyses of The Cancer Genome Atlas (TCGA) datasuggests ~3% of primary HGSOCs harbor somatic muta-tions in this gene [31-33]. Other novel FTSEC biomarkersthat are overexpressed in HGSOCs include CELSR3, anatypical cadherin; ABCC3, an ABC transport protein im-plicated in drug resistance [34]; and CTHRC1, a secretedprotein shown to be a candidate biomarker for breastand pancreatic cancer [35,36]. Analyses of primaryHGSOC specimens and sera collected from ovarian can-cer patients will be required to determine whether any
Lawrenson et al. BMC Cell Biology 2013, 14:43 Page 11 of 15http://www.biomedcentral.com/1471-2121/14/43
of these novel biomarkers have clinical utility in theearly detection of HGSOC.While it is now widely accepted that a proportion of
HGSOCS originate in the fallopian tube, the early stagesof disease development are poorly understood and manyquestions remain to be answered. Reports show differ-ences in the proportions of ciliated and secretoryepithelial cells, marker expression and hormone respon-siveness between the epithelia found in fimbrial andampullary regions of the fallopian tube [23,37,38]. How-ever, as yet we do not yet know why FTSECs in the fim-brial region of the fallopian tube are more prone toneoplastic transformation. One hypothesis is that theproximity to the mitogenic environment of the ovarianstroma may influence the phenotype of fimbrial FTSECs.Alternatively the region of transition between FTSECs andovarian mesothelial-type epithelial cells is inherently moreprone to neoplastic transformation. In the future, these3D models of FTSEC transformation that incorporatecommon somatic genetic alterations characteristic ofHGSOC (BRCA1, p53 [31]) or even recently discoveredsusceptibility alleles that confer low-risk of EOC in thegeneral population [39-45] will be vital tools in answeringsome of the key questions regarding EOC initiation anddevelopment.
ConclusionIn conclusion we have developed a novel 3D in vitroculture model of fallopian tube secretory cells that rep-resent a precursor tissue of high-grade serous ovariancancer. The greatest potential clinical use for thesemodels is likely to come from molecular and phenotypicstudies of the initiation and early stage development ofovarian cancer leading to the discovery of novel bio-markers for early stage disease detection. These modelsmay also have applications beyond the study of ovariancarcinogenesis, for example for studying the interactionsbetween the fallopian tube epithelium and oocytes or zy-gotes. Co-culture of fallopian tube epithelial cells hasbeen shown to promote the in vitro development of em-bryos. In future, novel 3D co-culture methodologies, inwhich glycoprotein secretion is enhanced, may improvein vitro embryogenesis. Models of benign fallopian tubediseases that are commonly associated with female infer-tility, such as salpingitis and pelvic inflammatory disease,are also few in number; but the models we describe herecould be used to mimic such conditions in vitro andhelp to improve their diagnosis and treatment. Ultim-ately, it is hoped that these models will lead to muchneeded insights into the biology and pathogenesis of fal-lopian secretory epithelial cells and that this knowledgewith be invaluable in increasing our ability to diagnoseand treat benign and malignant disease arising in the fal-lopian tubes.
MethodsTissue collection and cell culturePatients scheduled to undergo surgical procedures forbenign gynecological conditions (including fibroids,polyps) or total abdominal hysterectomies for endomet-rial cancer provided informed written consent, prior tosurgery, agreeing to participate in the study. This studywas performed with permission of the UCL InstitutionalEthics Committee. Fallopian tubes were inspected bythe operating surgeon and a gynecological pathologistand confirmed to be free of malignancy. The distal ampul-lary region of the fallopian tube was isolated and dissectedopen to reveal the lumen. Epithelial cells were harvestedby gentle brushing with a sterile cytobrush. All FTSEC cellcultures were maintained in MCDB105:Medium 199(mixed in a 1:1 ratio) supplemented with 15% fetal bovineserum (Hyclone), 10 ng/ml epidermal growth factor,0.5 mg/ml hydrocortisone, 5 mg/ml insulin, and 34 mgprotein/ml bovine pituitary extract, (all Sigma, St Louis,MO, USA). For growth curves 1 × 10⁵ cells were plated intriplicate. Cultures were passaged and population dou-blings (PD) calculated using the following formula:
PD = log (total cell number at each passage/initial cellnumber)/log2.
For analysis of cellular karyotype, cells were taken at alow passage and seeded at low density in a 25 cm2 flask.The karyotypes were analysed by a certified clinical cyto-geneticist (TDL genetics, London, UK). The number ofchromosomes as well as their length, the position of thecentromeres, banding pattern and any other physicalcharacteristics were commented on to give a detailed de-scription of any abnormalities.
Immunofluorescent cytochemistryCell monolayers were grown on glass coverslips to of~80% confluency. Cells were washed with ice cold PBS-Ag(PBS with 0.3% fish skin gelatin, Sigma) and fixed for10 min in 3% paraformaldehyde, then re-washed with PBS-Ag. Cells were permeabilized with 0.3%v/v Triton X-100 inPBS-Ag, rinsed twice again and blocked with goat serum(Invitrogen, Carlsbad, CA, USA) for 30 min. Primary anti-bodies were diluted 1:1000 in PBSAg and applied to thecells for 1 hour. After rinsing the antibody, secondary wasapplied for 20 min in the dark, Alexa Fluor 488-coupledsecondary or antibodies (Invitrogen) were used for antigendetection. The coverslips were then rinsed and transferredto labelled slides to add DAPI stain for nuclear staining.The slides were viewed under an Olympus BX64 fluores-cence microscope (Olympus, Tokyo, Japan) and imageswere captured and analyzed using Cytovision Genus 3.6Software (Leica, Wetzlar, Germany).
Lawrenson et al. BMC Cell Biology 2013, 14:43 Page 12 of 15http://www.biomedcentral.com/1471-2121/14/43
Three-dimensional cell culture and immunohistochemistryTissue culture vessels were twice coated with a 1.5% ofpoly-2-hydroxyethyl methacrylate (polyHEMA, Sigma) so-lution in 95% ethanol, and allowed to dry. Before use,polyHEMA coated plates were washed with sterile PBS.Cells were trypsinised and counted, and 1×10⁵ cells platedinto polyHEMA coated P100 dishes in 25 mls completemedium. To fix the 3D cultures, spheroids were collectedinto a 50 ml falcon tube washed twce in PBS and fixed for30 mins in neutal-buffered formalin (VWR, West Chester,PA, USA). Fixed 3D cultures were then processed into par-affin blocks, sectioned and stained by immunohistochemis-try at UCL Advanced Diagnostics immunocytochemistryservice laboratory (UCL, London) and at the TranslationalPathology Core Facility at UCLA, Los Angeles, California.Staining was performed using standard immunohistochem-ical staining techniques with the following antibodies colla-gen type I (Santa Cruz Biotechnology, Santa Cruz, CA,USA), collagen type 4 (Abcam, Cambridge, MA, USA),laminin (Dako, Glostrup, Denmark), pan-cytokeratin (cloneAE1/AE3, Dako), p53 (Do7, Dako) and MIB1 (Dako).
Transmission electron microscopyFTSECs were grown as 3D spheroids for 4 days, afterwhich cells were harvested by centrifugation and the cul-ture media aspirated. Spheroids were washed with PBSand fixed with ½ strength Karnovsky’s Fixative overnightat 4°C. Spheroids were then rinsed in 0.1 M CacodylateBuffer for 10mins, post-fixed in 2% Osmium Tetroxide for1 hour, then rinsed again in 0.1 M Cacodylate Buffer for10 mins. Blocking was performed by immersing spheroidsin 1% Uranyl Acetate for 1 hour; spheroids were washedwith distilled water and by dehydrated with 50%, 70%,85%, 95% ethanol for 10 mins each, the 100% ethanolthree times for 10 mins each. Spheroids were immersed1× in 50:50 Ethanol:Propylene Oxide and 3× in PropyleneOxide for 10 mins each. Spheroids were then transferredto 50:50 Epon:Propylene Oxide for 3 hrs, then placed in avacuum for 1 hr. The previous step was repeated with80:20 Epon:Propylene Oxide mix then pure Epon (twice)for 3 hrs and in vacuum for 1 hr. Blocks were finally trans-ferred to a 60°C oven overnight. Blocks were sectioned forTransmission Electron Microscopy and analysed using aJEOL JEM 2100 200 Kv Transmission Electron Micro-scope (JEOL, Peabody, MA).
Gene expression microarray analysisRNA was extracted from 2D or 4-day old 3D culturesusing the Illustra RNAspin mini kit (GE Heathcare) andmicroarray analyses performed using the Illumina HT-12 Gene Expression Beadchips (Illumina, San Diego,CA, USA) at the USC Epigenome Centre core facility.Data have been deposited onto the GEO database. Rawdata were analysed using methods from the specified
Bioconductor [46] packages; beadarray to import andprocess the raw data from the chip images [47], the BASHalgorithm [48] for detecting and managing spatial artefacts;the package limma [49], to implement background correc-tion using negative control probes and quantile signalnormalisation using negative and positive control probes[50]. Summary data was exported as log transformed meanvalues of probe signals. For differential gene expressionanalysis the log-transformed summary probe expressiondata were analysed using an implementation of theSignifcance Analysis of Microarrays (SAM) method [51] inthe package siggenes. A two-class analysis using a modifedt-statistic was used to identify genes that were differentiallyexpressed according to their culture conditions.
Gene ontology analysisThe R package GOstats was used to identify geneontology terms that are over/under represented in thedifferentially expressed genes. An implementation of theHypergeometric test [52] was performed using the func-tion hyperGTest. This computes Hypergeometric p-values for over or under-representation of each GO termin the specified ontology among the GO annotations forgenes of interest. P-values were corrected for multipletesting of the total number of ontology terms, using themethod described by Benjamini & Hochberg [53].
Cluster analysisGene expression data for human fallopian tube epithelialcells were downloaded from the Gene Expression Omni-bus (http://www.ncbi.nlm.nih.gov/geo/). The data of Toneet al. and George et al. [17,18] and were downloaded asraw files from GEO (GSE28044 and GSE12172). Thesedata are profiles for microdissected fallopian tube epithe-lial cells thus minimizing the chance that contaminationby stromal or immune cells could affect the profiles. Un-supervised hierarchical cluster analyses were performed toascertain the quality of biological replicates and also howthe relationships between cell lines and culture conditionsimpact upon gene expression, as well the similaritiesbetween culture conditions and primary tissue samples.Maximum and Euclidean distances were calculated,again in ‘R’, using Spearman’s or Pearson’s correlationon untransformed probe expression values and clus-tered by Ward’s minimum variance method. The dataset supporting the results of this article is available inthe GEO repository (www.ncbi.nlm.nih.gov/geo/), studyidentifier GSE51220.
Additional files
Additional file 1: Table S1. Gene expression microarray analysis ofgene expression changes associated with transfer of fallopian tubesecretory epithelial cells (FTSECs) from a 2D to a 3D microenvironment.
Lawrenson et al. BMC Cell Biology 2013, 14:43 Page 13 of 15http://www.biomedcentral.com/1471-2121/14/43

The 100 most significantly changing genes in 3D cultured FTSECscompared to 2D cultured FTSECs. 53 genes were significantlyupregulated, 47 genes were significantly downregulated.
Additional file 2: Figure S1. Validation of genes identified asdifferentially expressed in 2D and 3D cultured FTSECs. We validated thetop 3 up- and downregulated genes by qPCR.
Additional file 3: Figure S2. Cluster analyses comparing genome-widetranscriptomic profiles of 2D and 3D cultured FTSECs to follicular andluteal phase fallopian tube epithelium. Each point on the graph indicatesan individual microarray profile, technical replicates of cultured cells areshown by colored circles, open circles denoting 2D cultured cells andclosed circles denoting 3D cultured FTSECs. Black open circles indicatefollicular phase fallopian tube epithelial samples, closed circles indicateluteal phase fallopian tube epithelium. Each point represents anindividual patient. All patients from Georges et al. and Tone et al. [17,18]datasets are shown. Clustering is consistent regardless of cluster methodused (a) Euclidean Spearman, (b) maximum Pearson and (c) maximumSpearman.
AbbreviationsFTSEC: Fallopian tube epithelial cell; polyHEMA: Poly-2-hydroxyethylmethacrylate; 3D: Three-dimensional; 2D: Two-dimensional.
Competing interestsThe authors declare that they have no competing interest.
Authors’ contributionsKL and SAG designed the study and wrote the manuscript. KL, MN and NLperformed the experiments. EB provided pathology expertise. CJ analyzedthe microarray data. All authors read and approved the final manuscript.
AcknowledgementsThis research was performed at the Keck School of Medicine, University ofSouthern California, Los Angeles, California, USA, and at the Institute forWomen’s Health, University College London, UK. Electron microscopy wasperformed at the USC/Norris Cancer Center Cell and Tissue Imaging CoreFacility and gene expression microarrays were performed at the USCEpigenome Centre Core facility. The content of this article is solely theresponsibility of the authors and does not necessarily represent the officialviews of the National Cancer Institute or the National Institutes of Health.
Grant supportKL is funded by National Institute of Health grant 5 U19 CA148112-02 and anAnn Schreiber Program of Excellence award from the Ovarian CancerResearch Fund. MN was funded by an MRC studentship. Some of this workundertaken at UCLH/UCL was partly funding from the Department ofHealth’s NIHR Biomedical Research Centre funding scheme. Part of thisresearch was performed within the USC Norris Comprehensive CancerCentre (NCI CCSG grant P30CA014089). This work was in part supported bythe Genetic Associations and Mechanismsin Oncology (GAME-ON)consortium: a NCI Cancer Post-GWAS Initiative (U19-CA148112).
Author details1Department of Preventive Medicine, University of Southern California/KeckSchool of Medicine, 1450 Biggy Street, Los Angeles, California.2Gynaecological Cancer Research Laboratories, UCL EGA Institute forWomen’s Health, University College London, The Paul O’Gorman Building,Gower Street, London WC1E 6DD, UK. 3Department of Histopathology,Cancer Institute, University College London, Rockefeller Building, UniversityStreet, London WC1E 6JJ, UK. 4Faculty of Medical and Human Sciences, 1stFloor, Innovation Centre, Core Technology Facility, The University ofManchester, 46 Grafton Street, Manchester M13 9NT, UK.
Received: 25 March 2013 Accepted: 23 September 2013Published: 27 September 2013
References1. Kurman RJ, Shih IM: Molecular pathogenesis and extraovarian origin of
epithelial ovarian cancer–shifting the paradigm. Hum Pathol 2011,42(7):918–931.
2. Bowen NJ, Logani S, Dickerson EB, Kapa LB, Akhtar M, Benigno BB,McDonald JF: Emerging roles for PAX8 in ovarian cancer andendosalpingeal development. Gynecol Oncol 2007, 104(2):331–337.
3. Henriksen T, Tanbo T, Abyholm T, Oppedal BR, Claussen OP, Hovig T:Epithelial cells from human fallopian tube in culture. Hum Reprod 1990,5(1):25–31.
4. Fotheringham S, Levanon K, Drapkin R: Ex vivo culture of primary humanfallopian tube epithelial cells. J Vis Exp 2011(51):2728.
5. Levanon K, Ng V, Piao HY, Zhang Y, Chang MC, Roh MH, Kindelberger DW,Hirsch MS, Crum CP, Marto JA, et al: Primary ex vivo cultures of humanfallopian tube epithelium as a model for serous ovarian carcinogenesis.Oncogene 2010, 29(8):1103–1113.
6. Karst AM, Levanon K, Drapkin R: Modeling high-grade serous ovariancarcinogenesis from the fallopian tube. Proc Natl Acad Sci U S A 2011,108(18):7547–7552.
7. Ince TA, Richardson AL, Bell GW, Saitoh M, Godar S, Karnoub AE, Iglehart JD,Weinberg RA: Transformation of different human breast epithelial celltypes leads to distinct tumor phenotypes. Cancer Cell 2007, 12(2):160–170.
8. Jones PL, Schmidhauser C, Bissell MJ: Regulation of gene expression andcell function by extracellular matrix. Crit Rev Eukaryot Gene Expr 1993,3(2):137–154.
9. Aggeler J, Ward J, Blackie LM, Barcellos-Hoff MH, Streuli CH, Bissell MJ:Cytodifferentiation of mouse mammary epithelial cells cultured on areconstituted basement membrane reveals striking similarities todevelopment in vivo. J Cell Sci 1991, 99(Pt 2):407–417.
10. Streuli CH, Schmidhauser C, Bailey N, Yurchenco P, Skubitz AP, Roskelley C,Bissell MJ: Laminin mediates tissue-specific gene expression in mammaryepithelia. J Cell Biol 1995, 129(3):591–603.
11. Li ML, Aggeler J, Farson DA, Hatier C, Hassell J, Bissell MJ: Influence of areconstituted basement membrane and its components on casein geneexpression and secretion in mouse mammary epithelial cells. Proc NatlAcad Sci U S A 1987, 84(1):136–140.
12. Streuli CH, Bailey N, Bissell MJ: Control of mammary epithelialdifferentiation: basement membrane induces tissue-specific geneexpression in the absence of cell-cell interaction and morphologicalpolarity. J Cell Biol 1991, 115(5):1383–1395.
13. Jarboe EA, Folkins AK, Drapkin R, Ince TA, Agoston ES, Crum CP: Tubal andovarian pathways to pelvic epithelial cancer: a pathological perspective.Histopathology 2009, 55(5):619.
14. Lawrenson K, Benjamin E, Turmaine M, Jacobs I, Gayther S, Dafou D: In vitrothree-dimensional modelling of human ovarian surface epithelial cells.Cell Prolif 2009, 42(3):385–393.
15. Lawrenson K, Sproul D, Grun B, Notaridou M, Benjamin E, Jacobs IJ, DafouD, Sims AH, Gayther SA: Modelling genetic and clinical heterogeneity inepithelial ovarian cancers. Carcinogenesis 2011, 32(10):1540–1549.
16. Lawrenson K, Grun B, Benjamin E, Jacobs IJ, Dafou D, Gayther SA:Senescent fibroblasts promote neoplastic transformation of partiallytransformed ovarian epithelial cells in a three-dimensional model ofearly stage ovarian cancer. Neoplasia 2010, 12(4):317–325.
17. Tone AA, Begley H, Sharma M, Murphy J, Rosen B, Brown TJ, Shaw PA: Geneexpression profiles of luteal phase fallopian tube epithelium from BRCAmutation carriers resemble high-grade serous carcinoma. Clin Cancer Res2008, 14(13):4067–4078.
18. George SH, Greenaway J, Milea A, Clary V, Shaw S, Sharma M, Virtanen C,Shaw PA: Identification of abrogated pathways in fallopian tubeepithelium from BRCA1 mutation carriers. J Pathol 2011, 225(1):106–117.
19. Lee GY, Kenny PA, Lee EH, Bissell MJ: Three-dimensional culture models ofnormal and malignant breast epithelial cells. Nat Methods 2007, 4(4):359–365.
20. Yanai-Inbar I, Silverberg SG: Mucosal epithelial proliferation of thefallopian tube: prevalence, clinical associations, and optimal strategy forhistopathologic assessment. Int J Gynecol Pathol 2000, 19(2):139–144.
21. McCauley TC, Buhi WC, Wu GM, Mao J, Caamano JN, Didion BA, Day BN:Oviduct-specific glycoprotein modulates sperm-zona binding andimproves efficiency of porcine fertilization in vitro. Biol Reprod 2003,69(3):828–834.
22. Kouba AJ, Abeydeera LR, Alvarez IM, Day BN, Buhi WC: Effects of theporcine oviduct-specific glycoprotein on fertilization, polyspermy, andembryonic development in vitro. Biol Reprod 2000, 63(1):242–250.
23. Donnez J, Casanas-Roux F, Caprasse J, Ferin J, Thomas K: Cyclic changes inciliation, cell height, and mitotic activity in human tubal epitheliumduring reproductive life. Fertil Steril 1985, 43(4):554–559.
Lawrenson et al. BMC Cell Biology 2013, 14:43 Page 14 of 15http://www.biomedcentral.com/1471-2121/14/43

24. Bertuzzi A, Fasano A, Gandolfi A, Sinisgalli C: Necrotic core in EMT6/Rotumour spheroids: is it caused by an ATP deficit? J Theor Biol 2010,262(1):142–150.
25. Schaller G, Meyer-Hermann M: Continuum versus discrete model: acomparison for multicellular tumour spheroids. Philos Trans A Math PhysEng Sci 2006, 364(1843):1443–1464.
26. Köbel M, Kalloger SE, Boyd N, McKinney S, Mehl E, Palmer C, Leung S,Bowen NJ, Ionescu DN, Rajput A, et al: Ovarian carcinoma subtypes aredifferent diseases: implications for biomarker studies. PLoS Med 2008,5(12):e232.
27. Tong GX, Devaraj K, Hamele-Bena D, Yu WM, Turk A, Chen X, Wright JD,Greenebaum E: Pax8: a marker for carcinoma of Müllerian origin inserous effusions. Diagn Cytopathol 2011, 39(8):567–574.
28. Laury AR, Hornick JL, Perets R, Krane JF, Corson J, Drapkin R, Hirsch MS:PAX8 reliably distinguishes ovarian serous tumors from malignantmesothelioma. Am J Surg Pathol 2010, 34(5):627–635.
29. Gilks WP, Abou-Sleiman PM, Gandhi S, Jain S, Singleton A, Lees AJ, Shaw K,Bhatia KP, Bonifati V, Quinn NP, et al: A common LRRK2 mutation inidiopathic Parkinson’s disease. Lancet 2005, 365(9457):415–416.
30. Di Fonzo A, Rohé CF, Ferreira J, Chien HF, Vacca L, Stocchi F, Guedes L,Fabrizio E, Manfredi M, Vanacore N, et al: A frequent LRRK2 gene mutationassociated with autosomal dominant Parkinson’s disease. Lancet 2005,365(9457):412–415.
31. Network CGAR: Integrated genomic analyses of ovarian carcinoma.Nature 2011, 474(7353):609–615.
32. Cerami E, Gao J, Dogrusoz U, Gross BE, Sumer SO, Aksoy BA, Jacobsen A,Byrne CJ, Heuer ML, Larsson E, et al: The cBio cancer genomics portal: anopen platform for exploring multidimensional cancer genomics data.Cancer Discov 2012, 2(5):401–404.
33. Gao J, Aksoy BA, Dogrusoz U, Dresdner G, Gross B, Sumer SO, Sun Y,Jacobsen A, Sinha R, Larsson E, et al: Integrative analysis of complexcancer genomics and clinical profiles using the cBioPortal. Sci Signal2013, 6(269):l1.
34. O’Brien C, Cavet G, Pandita A, Hu X, Haydu L, Mohan S, Toy K, Rivers CS,Modrusan Z, Amler LC, et al: Functional genomics identifies ABCC3 as amediator of taxane resistance in HER2-amplified breast cancer.Cancer Res 2008, 68(13):5380–5389.
35. Park EH, Kim S, Jo JY, Kim SJ, Hwang Y, Kim JM, Song SY, Lee DK, Koh SS:Collagen triple helix repeat containing-1 promotes pancreatic cancerprogression by regulating migration and adhesion of tumor cells.Carcinogenesis 2013, 34(3):694–702.
36. Turashvili G, Bouchal J, Baumforth K, Wei W, Dziechciarkova M, Ehrmann J,Klein J, Fridman E, Skarda J, Srovnal J, et al: Novel markers fordifferentiation of lobular and ductal invasive breast carcinomas by lasermicrodissection and microarray analysis. BMC Cancer 2007, 7:55.
37. Palter SF, Mulayim N, Senturk L, Arici A: Interleukin-8 in the humanfallopian tube. J Clin Endocrinol Metab 2001, 86(6):2660–2667.
38. Laird SM, Hill CJ, Warren MA, Tuckerman EM, Li TC: The production ofplacental protein 14 by human uterine tubal epithelial cells in culture.Hum Reprod 1995, 10(6):1346–1351.
39. Song H, Ramus SJ, Tyrer J, Bolton KL, Gentry-Maharaj A, Wozniak E, Anton-Culver H, Chang-Claude J, Cramer DW, DiCioccio R, et al: A genome-wideassociation study identifies a new ovarian cancer susceptibility locus on9p22.2. Nat Genet 2009, 41(9):996–1000.
40. Bolton KL, Tyrer J, Song H, Ramus SJ, Notaridou M, Jones C, Sher T, Gentry-Maharaj A, Wozniak E, Tsai YY, et al: Common variants at 19p13 areassociated with susceptibility to ovarian cancer. Nat Genet 2010,42(10):880–884.
41. Goode EL, Chenevix-Trench G, Song H, Ramus SJ, Notaridou M, LawrensonK, Widschwendter M, Vierkant RA, Larson MC, Kjaer SK, et al: A genome-wide association study identifies susceptibility loci for ovarian cancer at2q31 and 8q24. Nat Genet 2010, 42(10):874–879.
42. Bojesen SE, Pooley KA, Johnatty SE, Beesley J, Michailidou K, Tyrer JP,Edwards SL, Pickett HA, Shen HC, Smart CE: Multiple independent variantsat the TERT locus are associated with telomere length and risks of breastand ovarian cancer. Nat Genet 2013, 45(4):371–384. 384e371-372.
43. Permuth-Wey J, Lawrenson K, Shen HC, Velkova A, Tyrer JP, Chen Z, Lin HY,Chen YA, Tsai YY, Qu X: Identification and molecular characterization of anew ovarian cancer susceptibility locus at 17q21.31. Nat Commun 2013,4:1627.
44. Pharoah PD, Tsai YY, Ramus SJ, Phelan CM, Goode EL, Lawrenson K, BuckleyM, Fridley BL, Tyrer JP, Shen H: GWAS meta-analysis and replicationidentifies three new susceptibility loci for ovarian cancer. Nat Genet 2013,45(4):362–370. 370e361-362.
45. Shen H, Fridley BL, Song H, Lawrenson K, Cunningham JM, Ramus SJ, CicekMS, Tyrer J, Stram D, Larson MC, et al: Epigenetic analysis leads toidentification of HNF1B as a subtype-specific susceptibility gene forovarian cancer. Nat Commun 2013, 4:1628.
46. Gentleman RC, Carey VJ, Bates DM, Bolstad B, Dettling M, Dudoit S, Ellis B,Gautier L, Ge Y, Gentry J, et al: Bioconductor: open software development forcomputational biology and bioinformatics. Genome Biol 2004, 5(10):R80.
47. Kuhn K, Baker SC, Chudin E, Lieu MH, Oeser S, Bennett H, Rigault P, BarkerD, McDaniel TK, Chee MS: A novel, high-performance random arrayplatform for quantitative gene expression profiling. Genome Res 2004,14(11):2347–2356.
48. Cairns JM, Dunning MJ, Ritchie ME, Russell R, Lynch AG: BASH: a tool formanaging BeadArray spatial artefacts. Bioinformatics 2008, 24(24):2921–2922.
49. Smyth GK: Linear models and empirical bayes methods for assessingdifferential expression in microarray experiments. Stat Appl Genet Mol Biol2004, 3:Article3.
50. Shi W, Oshlack A, Smyth GK: Optimizing the noise versus bias trade-off forIllumina whole genome expression BeadChips. Nucleic Acids Res 2010,38(22):e204.
51. Tusher VG, Tibshirani R, Chu G: Significance analysis of microarraysapplied to the ionizing radiation response. Proc Natl Acad Sci U S A 2001,98(9):5116–5121.
52. Alexa A, Rahnenführer J, Lengauer T: Improved scoring of functionalgroups from gene expression data by decorrelating GO graph structure.Bioinformatics 2006, 22(13):1600–1607.
53. Benjamini Y, Hochberg Y: Controlling the false discovery rate: a practicaland powerful approach to multiple testing. J R Stat Soc Ser B 1995,1(51):298–300.
doi:10.1186/1471-2121-14-43Cite this article as: Lawrenson et al.: In vitro three-dimensional modelingof fallopian tube secretory epithelial cells. BMC Cell Biology 2013 14:43.
Submit your next manuscript to BioMed Centraland take full advantage of:
• Convenient online submission
• Thorough peer review
• No space constraints or color figure charges
• Immediate publication on acceptance
• Inclusion in PubMed, CAS, Scopus and Google Scholar
• Research which is freely available for redistribution
Submit your manuscript at www.biomedcentral.com/submit
Lawrenson et al. BMC Cell Biology 2013, 14:43 Page 15 of 15http://www.biomedcentral.com/1471-2121/14/43