Embed Size (px)
Citation preview

In vitro characterization of cardiac
radiofrequency ablation lesions using optical
coherence tomography
Christine P. Fleming
1, Kara J. Quan
2,3, Hui Wang
1, Guy Amit
2,4, and Andrew M.
Rollins*1
1Case Western Reserve University. Biomedical Engineering Department. Cleveland, OH. 44106 2MetroHealth Medical Center. Heart and Vascular Center. Cleveland, OH 44109
3Currently with North Ohio Heart Center. Cardiac Electrophysiology. Elyria, OH 44035 4Currently with Soroka University Medical Center. Department of Cardiology. Beer Sheva, Israel
Abstract: Currently, cardiac radiofrequency ablation (RFA) is guided by
indirect signals. We demonstrate optical coherence tomography (OCT)
characterization of RFA lesions within swine ventricular wedges.
Untreated tissue exhibited a consistent birefringence artifact within OCT
images due to the organized myocardium, which was not present in treated
tissue. Birefringence artifacts were detected by filtering with a Laplacian of
Gaussian (LoG) to quantify gradient strength. The gradient strength
distinguished RFA lesions from untreated sites (p=5.93x10⁻¹⁵
) with a
sensitivity and specificity of 94.5% and 86.7% respectively. This study
demonstrates the potential of OCT for monitoring cardiac RFA, confirming
lesion formation and providing feedback to avoid complications.
2009 Optical Society of America
OCIS codes: (170.4500) Optical coherence tomography; (170.1020) Ablation of tissue;
(170.1610) Clinical applications; (170.6935) Tissue characterization
______________________________________________________________
References and Links
1. W. Rosamond, K. Flegal, K. Furie, A. Go, K. Greenlund, N. Haase, S. M. Hailpern, M. Ho, V. Howard, B.
Kissela, S. Kittner, D. Lloyd-Jones, M. McDermott, J. Meigs, C. Moy, G. Nicho, C. O’Donnell, V. Roger,
P. Sorlie, J. Steinberger, T. Thom, M. Wilson, and Y. Hong, "Heart Disease and Stroke Statistics 2008
Update: A Report From the American Heart Association Statistics Committee and Stroke Statistics
Subcommittee," Circulation 117, e25-e146 (2008).
2. S. K. S. Huang and M. A. Wood, Catheter Ablation of Cardiac Arrhythmias (Saunders, 2006).
3. R. Brockman, "Cardiac Ablation Catheters Generic Arrhythmia Indications for Use; Guidance for Industry,"
(FDA Center for Devices and Radiological Health. Cardiac Electrophysiology and Monitoring Branch
Division of Cardiovascular and Respiratory Devices Office of Device Evaluation, Rockville, MD, 2002).
4. B. Joung, M. Lee, J.-H. Sung, J.-Y. Kim, S. Ahn, and S. Kim, "Pediatric Radiofrequency Catheter Ablation
Sedation Methods and Success, Complication and Recurrence Rates," Circulation Journal 70, 278-284
(2006).
5. A. O. Grant, "Recent Advances in the Treatment of Arrhythmias," Circulation Journal 67, 651-655 (2003).
6. D. O’Donnell and V. Nadurata, "Radiofrequency Ablation for Post Infarction Ventricular Tachycardia,"
Indian Pacing Electrophysiol. J. 4, 63-72 (2004).
#117702 - $15.00 USD Received 28 Sep 2009; revised 21 Dec 2009; accepted 22 Dec 2009; published 28 Jan 2010
(C) 2010 OSA 1 February 2010 / Vol. 18, No. 3 / OPTICS EXPRESS 3079

7. T. Dickfeld, R. Kato, M. Zviman, S. Nazarian, H. Ashikaga, A. C. Lardo, R. D. Berger, H. Calkins, and H.
Halperin, "Characterization of Acute and Subacute Radiofrequency Ablation Lesions with Non-enhanced
Magnetic Resonance Imaging," Heart Rhythm 4, 208-214 (2007).
8. T. Dickfeld, R. Kato, M. Zviman, S. Lai, G. Meininger, A. C. Lardo, A. Roguin, D. Blumke, R. Berger, H.
Calkins, and H. Halperin, "Characterization of Radiofrequency Ablation Lesions with Gadolinium-
Enhanced Cardiovascular Magnetic Resonance Imaging," J Am Coll Cardiol 47, 370-378 (2006).
9. J. Alaeddini, M. A. Wood, B. P. Lee, and K. A. Ellenbogen, "Incidence, Time Course, and Characteristics of
Microbubble Formation During Radiofrequency Ablation of Pulmonary Veins with an 8-mm Ablation
Catheter," Pacing Clin Electrophysiol 29, 979-984 (2006).
10. M. David Schwartzman, R. John Nosbisch, and R. Debra Housel, "Echocardiographically guided left atrial
ablation: Characterization of a new technique," Heart Rhythm Society 3, 930-938 (2006).
11. T. Dickfeld, R. Kato, M. Zviman, S. Lai, G. Meininger, A. C. Lardo, A. Roguin, D. Blumke, R. Berger, H.
Calkins, and H. Halperin, "Characterization of Radiofrequency Ablation Lesions With Gadolinium-
Enhanced Cardiovascular Magnetic Resonance Imaging," Journal of the American College of Cardiology
47, 370–378 (2008).
12. T. Dickfeld, R. Kato, M. Zviman, S. Nazarian, J. Dong, H. Ashikaga, A. C. Lardo, R. D. Berger, H. Calkins,
and H. Halperin, "Characterization of acute and subacute radiofrequency ablation lesions with nonenhanced
magnetic resonance imaging," Heart Rhythm 4, 208-214 (2007).
13. E. J. Schmidt, V. K. Reddy, and J. N. Ruskin, "Nonenhanced magnetic resonance imaging for
characterization of acute and subacute radiofrequency ablation lesions," Heart Rhythm 4, 215-217 (2007).
14. J.-F. Ren and F. E. Marchinski, "Utility of Intracardiac Echocardiography in Left Heart Ablation for
Tachyarrhythmias," Echocardiography 24, 533-540 (2007).
15. W. Drexler and J. G. Fujimoto, eds., Optical Coherence Tomography: Technology and Applications
(Springer, 2008).
16. M. Gupta, A. M. Rollins, J. A. Izatt, and I. R. Efimov, "Imaging of the atrioventricular node using optical
coherence tomography," J Cardiovasc Electrophysiol 13, 95 (2002).
17. M. W. Jenkins, R. S. Wade, Y. Cheng, A. M. Rollins, and I. R. Efimov, "Optical Coherence Tomography
Imaging of the Purkinje Network," J Cardiovasc Electrophysiol (2005).
18. M. E. Brezinski, "Applications of optical coherence tomography to cardiac and musculoskeletal diseases:
bench to bedside?," J Biomed Opt 12, 051705 (2007).
19. C. P. Fleming, C. Ripplinger, B. Webb, I. R. Efimov, and A. M. Rollins, "Quantification of Cardiac Fiber
Orientation Using Optical Coherence Tomography," J Biomed Opt 13, 030505 (2008).
20. W. Hucker, C. Ripplinger, C. P. Fleming, V. Fedorov, A. M. Rollins, and I. R. Efimov, "Bimodal
Biophotonic Imaging of the Structure-Function Relationship in Cardiac Tissue," J Biomed Opt 13, 054012
(2008).
21. N. A. Patel, X. Li, D. L. Stamper, J. G. Fujimoto, and M. E. Brezinski, "Guidance of aortic ablation using
optical coherence tomography," The International Journal of Cardiovascular Imaging 19, 171-178 (2003).
22. S. A. Boppart, J. Herrmann, C. Pitris, D. L. Stamper, M. E. Brezinski, and J. G. Fujimoto, "High-Resolution
Optical Coherence Tomography-Guided Laser Ablation of Surgical Tissue," Journal of Surgical Research
82, 275-284 (1999).
23. B. J. Vakoc, G. J. Tearney, and B. E. Bouma, "Real-time microscopic visualization of tissue response to
laser thermal therapy," Journal of Biomedical Optics Letters 12, 020501 (2007).
24. M. Ford, Y. Zhou, H. Wang, C. X. Deng, and A. M. Rollins, "Optical coherence tomography monitoring of
cardiac ablation by high-intensity focused ultrasound," Proceedings of the SPIE 5686, 432 (2005).
25. J. Swartling, S. Palsson, P. Platonov, S. B. Olsson, and S. Andersson-Engels, "Changes in tissue optical
properties due to radio-frequency ablation of myocardium," Med Biol Eng Comput 41, 403-409 (2003).
26. S. Sato, T. Shimada, M. Ishihara, T. Arai, T. Matsui, A. Kurita, M. Obara, M. Kikuchi, H. Wakisaka, and H.
Ashida, "Laser Ablation Characteristics of Myocardium Tissue in the UV Spectral Region: An In-vitro
Study with Porcine Myocardium Tissue," in OSA BOSD, (1999).
27. S. Bosman, "Heat-induced structural alterations in myocardium in relation to changing optical properties,"
Applied Optics 32, 461-463 (1993).
28. J. M. Schmitt, A. Knuttel, M. Yadlowsky, and M. A. Eckhaus, "Optical-coherence tomography of a dense
tissue: statistics of attenuation and backscattering," Phys. Med. Biol. 39, 1705-1720 (1994).
29. J. F. de Boer, S. M. Srinivas, A. Malekafzali, Z. Chen, and J. S. Nelson, "Imaging thermally damaged tissue
by polarization sensitive optical coherence tomography," Optics Express 3, 212-218 (1998).
30. K. Schoenenberger, J. Bill W. Colston, D. J. Maitland, L. B. D. Silva, and M. J. Everett, "Mapping of
birefringence and thermal damage in tissue by use of polarization-sensitive optical coherence tomography,"
Applied Optics 37, 6026-6036 (1998).
31. B. Liu, M. Harman, S. Giattina, D. Stamper, Charles Demakis, M. Chilek, S. Raby, and M. Brezinski,
"Characterizing of tissue microstructure with single-detector polarization-sensitive optical coherence
tomography," Applied Optics 45, 4464-4479 (2006).
#117702 - $15.00 USD Received 28 Sep 2009; revised 21 Dec 2009; accepted 22 Dec 2009; published 28 Jan 2010
(C) 2010 OSA 1 February 2010 / Vol. 18, No. 3 / OPTICS EXPRESS 3080

32. S. D. Giattina, B. K. Courtney, P. R. Herz, M. Harman, S. Shortkroff, D. L. Stamper, B. Liu, J. G. Fujimoto,
and M. E. Brezinski, "Assessment of coronary plaque collagen with polarization sensitive optical coherence
tomography (PS-OCT)," International Journal of Cardiology 107, 400-409 (2006).
33. Y. Yang, L. Wu, Y. Feng, and R. K. Wang, "Observations of birefringence in tissues from optic-fibre-based
optical coherence tomography," Measurement Science and Technology 14, 41–46 (2003).
34. A. M. Rollins, M. D. Kulkarni, S. Yazdanfar, R. Un-arunyawee, and J. A. Izatt, "In Vivo Video Rate Optical
Coherence Tomography," Optics Express 3, 219-229 (1998).
35. Z. Hu and A. M. Rollins, "Quasi-telecentric optical design of a microscope-compatible OCT scanner,"
Optics Express 13, 6407-6415 (2005).
36. Z. Hu and A. Rollins, "Fourier domain optical coherence tomography with a linear-in-wavenumber
spectrometer.," Opt Lett 32, 3524-3527 (2007).
37. B. Holmbom, U. Niislund, A. Eriksson, I. Virtancn, and L.-E. Thornell, "Comparison of
triphenyltetrazolium chloride (TTC) staining versus detection of fibronectin in experimental myocardial
infarction," Histochemistry 99, 265-275 (1993).
38. L. Bretzner and T. Lindeberg, "Feature Tracking with Automatic Selection of Spatial Scales," Computer
Vision and Image Understanding 71, 385-392 (1998).
39. P. Whittaker, S.-m. Zheng, M. J. Patterson, R. A. Kloner, K. E. Daly, and R. A. Hartman, "Histologic
Signatures of Thermal Injury: Applications in Transmyocardial Laser Revascularization and Radiofrequency
Ablation," Lasers in Surgery and Medicine 27, 305–318 (2000).
40. J. M. Cooper, J. L. Sapp, U. Tedrow, C. P. Pellegrin, D. Robinson, L. M. Epstein, and W. G. Stevenson,
"Ablation with an internally irrigated radiofrequency catheter: Learning how to avoid steam pops," Heart
Rhythm 1, 329–333 (2004).
1. Introduction
1.1 Radiofrequency ablation
Cardiac arrhythmias afflict millions of patients in the United States, resulting in frequent
hospitalizations and high medical costs[1]. Radiofrequency ablation (RFA) is the standard of
care to cure many arrhythmias. The goal of RFA is to target and eradicate the critical
component of an abnormal reentrant circuit or abnormal ectopic site in the heart, while
minimizing or avoiding damage to normal areas of the heart. RFA has revolutionized the
treatment of arrhythmias with over 80,000 procedures performed in the United States each
year[2]. According to a 2002 report by the FDA, 95% of RFA procedures are acutely
successful, 90% are chronically successful, and 2.5% have major complications. [3]
However, the complication rates vary, depending on the type of arrhythmia which is targeted.
Ablation of atrial flutter or atrial tachycardia had rare reported complications[3-5], whereas
ablation of ventricular tachycardia had a 2-8% range of complication rates.[3, 6]
The duration of RFA procedures may range from 2 to 8 hours, depending on the type of
arrhythmia that is targeted. Currently ablation is monitored by indirect means by changes in
catheter-tissue contact temperature, impedance, and intracardiac electrograms. A direct
image of the cardiac tissue during RFA could help guide the precise application of energy,
monitor the successful formation of a lesion, visualize early effects of overtreatment, and
potentially decrease procedure time. Reduction of procedure time would furthermore reduce
radiation exposure to the patient and operator because the procedure is performed under
fluoroscopy. In short, RFA therapy could benefit greatly from real time direct imaging,
because it could lead to decreased procedure time, fewer complications, and increased acute
and chronic success rates.
1.2 Monitoring radiofrequency ablation therapy
Currently, RFA procedures utilize fluoroscopy, static images from computed tomography
merged with fluoroscopy, and/or noncontact, three-dimensional reconstructed mapping to
visualize the position of catheters in the heart. Monitoring the delivery of RF energy to the
#117702 - $15.00 USD Received 28 Sep 2009; revised 21 Dec 2009; accepted 22 Dec 2009; published 28 Jan 2010
(C) 2010 OSA 1 February 2010 / Vol. 18, No. 3 / OPTICS EXPRESS 3081

endocardium is only by indirect means; that is, from change in the amplitude of intracardiac
electrograms, change in tissue temperature, and change in impedance, all of which are
measured at the tip of the catheter. These indirect methods of monitoring may result in
delivering more ablation lesions than necessary to cure the arrhythmia and may also prolong
procedural time.
There are other approaches under investigation to monitor and guide RFA therapy, including
magnetic resonance imaging (MRI) [7, 8] and intracardiac echocardiography [9, 10]. MRI
obtains a three dimensional anatomy of the heart that can be merged with voltage maps. The
MRI is utilized for pre-procedural planning and for post-procedural evaluation. Gadolinium
enhancement of the MRI images has been used post-procedurally to increase the contrast
between ablated nonviable tissue formed by RFA lesions and viable tissue [8, 11]. However,
MRI is limited because it does not provide real-time guidance. Recent studies have utilized
non-contrast mediated MRI to characterize ablation lesions[12, 13]. Additionally, not all RFA
patients can undergo MRI evaluation, because MRI is contraindicated in patients with
implantable devices such as cardiac pacemakers or defibrillators. Intracardiac
echocardiography monitors RFA therapy in real time to assess catheter-tissue contact and
contact angle[14]. Additionally, intracardiac echo may visualize restenosis of pulmonary
vessels[14] and may allow titration of RFA energy to reduce the incidence of embolic events
due to over-treatment of cardiac tissue[9] . However, intracardiac echocardiography does not
have sufficient contrast to visualize the formation of lesions.
Radiofrequency ablation therapy is a standard of care for the treatment of specific
arrhythmias, and this procedure would benefit significantly from a compact, high-resolution,
real-time, image-based monitoring technology. We hypothesize that the emerging imaging
technique of optical coherence tomography (OCT) can monitor the formation of lesions
produced by cardiac radiofrequency ablation therapy. In this manuscript, we aim to show that
OCT can validate that a lesion has been made, by distinguishing radiofrequency (RF) treated
from untreated cardiac tissue.
1.3 Optical coherence tomography
OCT provides real-time subsurface imaging of biological tissues with high spatial resolution
(on the order of ten micrometers) in three dimensions in vivo[15]. Depth-gated signals are
acquired using low-coherence interferometry. OCT is extremely sensitive to backscattered
light and is capable of imaging to depths of 1-2 mm in cardiac tissue[16, 17]. OCT has been
used for intra-coronary imaging[18], imaging of the myocardium within animal models of
arrhythmias[17, 19, 20], and analyzing myocardial fiber structure using image analysis[19,
20]. In addition, OCT has been used to image laser aortic ablation, [21] laser ablation of
brain, liver, kidney, lung and rectus abdominis muscles [22], laser ablation of the
esophagus[23] and high intensity focused ultrasound (HIFU) ablation lesions in ventricular
myocardium[24]. Previous studies have shown that the optical properties of heated
myocardium (absorption, scattering and anisotropy coefficients) are significantly different
from normal tissue [25-27] and that these optical properties can be extracted from OCT
images [28] for the purpose of tissue classification. Birefringence is an optical property of
highly organized tissue such as cartilage and muscle which results in modulation of the state
of polarization of light propagating in the tissue. Polarization-sensitive OCT (PSOCT) has
been used to measure tissue birefringence to assess tissue damage due to ablation therapy[29,
30]. Tissue birefringence can be observed as artifacts within conventional OCT images [31-
33]. These artifacts have been used previously to assess collagen content within
atherosclerotic plaques[32].
OCT can potentially address unmet clinical needs of cardiac radiofrequency ablation
therapy by assessing the contact and contact angle of the RF catheter with the tissue,
confirming that a lesion has been formed when RF energy is delivered, detecting early
damage, and identifying structures for procedural guidance. Imaging to monitor tissue
#117702 - $15.00 USD Received 28 Sep 2009; revised 21 Dec 2009; accepted 22 Dec 2009; published 28 Jan 2010
(C) 2010 OSA 1 February 2010 / Vol. 18, No. 3 / OPTICS EXPRESS 3082

contact and contact angle can increase the efficiency of RF energy delivery. Acute success
and efficacy of ablation are determined through functional electrophysiology (EP) testing, to
ensure that the lesions interrupt conduction. The ability to directly confirm that a lesion has
been formed after energy delivery will eliminate ambiguity when EP testing shows that
conduction interruption was not achieved, by eliminating the possibility the energy dose
failed to result in a lesion. The ability to detect early damage could enable titration of energy
delivery and reduce complication rates.
Here, we report that clinically relevant ablation lesions in ventricular myocardium in vitro
can be distinguished from untreated tissue using OCT imaging, by detecting changes in tissue
birefringence, optical properties, and tissue architecture. We also observe that over-treated
lesions exhibit additional characteristic features, and that gaps between lesions are detectable.
This work sets the foundation for investigating the feasibility of real-time monitoring of RFA
therapy using OCT. While the axial field of view of OCT imaging is too small to encompass
an entire RFA lesion, real time monitoring of RFA therapy with high-resolution imaging
could provide direct visualization of the heart surface, visualization and confirmation of
ablation lesion formation, and feedback to titrate RFA dosage to avoid complications and
minimize procedure time.
2. Methods
2.1 In vitro ablation protocol
Freshly excised ventricular wedges from swine hearts were used for in vitro characterization
of ablation lesions with OCT imaging. Following the onset of general anesthesia, a lateral
thoracotomy was performed, and the heart was rapidly excised and placed in ice-cold
phosphate buffered saline (PBS). The right ventricular free wall, left ventricular free wall,
and ventricular septum were dissected and placed in ice-cold PBS, up to 2 hours, until the
start of RFA. All animal studies were conducted according to protocols approved by the
Institutional Animal Care and Use Committee of Case Western Reserve University.
Dissected ventricular wedges were placed in a bath with PBS maintained at 37oC with
super-perfusion flow (Figure 1-A). During the application of RF energy, all samples were
submerged in 3 cm of PBS so that the RF catheter tip is completely submerged and operates
normally. It is standard clinical practice to create lesions using a temperature controlled
protocol (50-70oC) by delivering RF energy for a fixed duration (e.g. 60 seconds), where the
RF generator controls RF power to reach and maintain the target temperature. For this study,
a series of ablative lesions were created with a temperature controlled (70oC) protocol with a
maximum delivered power of 50W and maximal duration of 60 seconds, using a clinical RFA
generator (Maestro 3000, Boston Scientific). Endocardial lesions were created using a 7Fr,
4mm tip catheter (Blazer II, Boston Scientific), applying RF energy for 10 seconds (n=19), 20
seconds (n=22), 30 seconds (n=23), and 60 (n=28) seconds distributed over 7 hearts for a total
of 92 lesions.
An additional set of endocardial ablation lesions were created on ventricular tissue with
the same temperature controlled protocol. After creating ablation lesions, these samples were
subsequently volumetrically imaged by OCT to test the ablility to identify of gaps within
linear ablation lines.
#117702 - $15.00 USD Received 28 Sep 2009; revised 21 Dec 2009; accepted 22 Dec 2009; published 28 Jan 2010
(C) 2010 OSA 1 February 2010 / Vol. 18, No. 3 / OPTICS EXPRESS 3083

Figure 1. Experimental setup for in vitro characterization of ablation lesions using OCT. A) In vitro radiofrequency
ablation lesions created on excised ventricular wedges in a temperature controlled bath with super-perfusion flow. B)
Gross pathology of ablative lesions on the endocardial surface of swine right ventricle. (Pins demarcate ends of
ablative lesions) C) Optical coherence tomography (OCT) system. D) Representative OCT image of a seven
millimeter image of ablative lesion and adjacent tissue. E) TTC stain of ablative lesion shown in panel (D). White
necrotic tissue of ablative lesion and red viable tissue are demonstrated.
2.2 Optical coherence tomography imaging
After administering RFA, a pair of pins was placed along the maximal dimension of each
ablation lesion (Figure 1-B). Imaging was conducted with a time-domain OCT system
described previously[34] with a light source centered at1310 nm with a 70 nm bandwidth
(Figure 1-C). The axial and lateral resolution of the system was approximately 10 and 18
micrometers respectively (in air). Seven-millimeter OCT scans were recorded to encompass
the lesion, and seven-millimeter control images were recorded of areas where no RFA energy
was delivered (480 A-lines per image). These data were used for the lesion detection study.
Three dimensional image sets of ventricular wedges with RFA lesions were acquired with
a microscope-integrated 1310nm Fourier Domain OCT (FDOCT) system. The axial and
lateral resolution of this system was approximately 10 micrometers (in air)[35]. Spectral
interferograms were acquired with a linear in wavenumber (k=2π/λ) spectrometer[36] onto a
1024 pixel line scan camera (Goodrich) spectrometer, acquired at 40 images per second (1000
A-lines per image). The system has a 2mm -6dB imaging range and 110dB signal-to-noise
ratio. Three-dimensional image sets were 4 x 4 x 4.3 mm3 in dimension, with 400 images per
volume. These data were used to investigate the appearance of gaps
2.3 Validation
Staining with triphenyltetrazolium chloride (TTC) was used to identify necrosis and quantify
lesion size. TTC is a vital stain for assessing dehydrogenase enzyme activity and has been
widely used for assessing acute myocardial injury to differentiate necrosis from viable
tissue[37]. Tetrazolium salts produce colored precipitates in the presence of an intact
dehydrogenase system. Necrotic tissue lacks dehydregease activity and fails to stain.
.Directly after imaging, the tissue was sliced in the direction of the OCT B-scan, as indicated
by the pins and incubated in 1.0% TTC in PBS for 20 minutes at room temperature. The TTC
stained samples were digitized with a calibration marker. Using the software package Image
J (NIH), lesion depth, width, and area were recorded for each lesion.
2.4 Image analysis
Two main characteristics of OCT images of RFA lesions, compared to untreated tissue, were
observed and targeted for quantitative analysis. First, the intensity increases due to increased
#117702 - $15.00 USD Received 28 Sep 2009; revised 21 Dec 2009; accepted 22 Dec 2009; published 28 Jan 2010
(C) 2010 OSA 1 February 2010 / Vol. 18, No. 3 / OPTICS EXPRESS 3084

scattering. Second, the birefringence artifact is eliminated due to decreased tissue
birefringence. Image analysis tools were developed (using Matlab 7.4, Mathworks Inc.) to
quantify these two parameters for the purpose of distinguishing ablation lesions from
untreated tissue. Preprocessing was conducted for each image to reduce noise by convolving
with a 5 x 5 Wiener filter and removing the noise floor from the image. The images were
flattened by detecting the tissue surface with using a threshold. Thereafter, each image was
decimated to 190 x 24 pixels (Figure 2-a-c) to reduce computation and speckle noise in axial
scans (Figure 2-g-i). The region of interest (ROI) analyzed was 525 microns in length in the
axial dimension, starting 100 µm below the sample surface to avoid surface reflections and
the endocardial layer. The lateral region of interest was the entire 7mm image for untreated
tissue, and the area in between the pins for treated tissue. The intensity parameter was
calculated as the mean intensity of the decimated and flattened OCT image within the ROI.
Figure 2. Dark band due to tissue birefringence a-b) OCT images of an untreated site obtained with different
polarization states of the sample arm light. . Location of band moves as the polarization state in the sample arm is
changed. Birefringence dependent bands are highlighted with green arrows. (Media 1) c) Representative OCT image
of an ablation lesion. d-f) Decimated and flattened version of images shown in a-c. Region of interest, 525µm, used
in analysis shown in panel e as white horizontal lines. g-j) Representative averaged axial scans from the sites
indicated in e-h, shows change in location of the band within axial scans of untreated site (g and h). No band in OCT
image of ablation lesion. Images acquired with time domain (TDOCT) system.
A dark band was consistently observed within images of untreated tissue (e.g. Figure 2-
a,b). To demonstrate that the observed bands were birefringence artifacts and not tissue
structures, a sample site was imaged while the polarization state of the sample arm light was
changed using a polarization controller. Figure 2 shows two images of the identical site
illuminated by different polarization states. It can be clearly observed that the band changes
location in a polarization-dependent way.
In order to automatically detect the birefringence artifact, a Laplacian of Gaussian (LoG)
was implemented. The LoG filter has been previously used to identify regions that are
brighter or darker than their surroundings[38]. The LoG is a linear filter and is a combination
#117702 - $15.00 USD Received 28 Sep 2009; revised 21 Dec 2009; accepted 22 Dec 2009; published 28 Jan 2010
(C) 2010 OSA 1 February 2010 / Vol. 18, No. 3 / OPTICS EXPRESS 3085
of a Laplacian operation and a Gaussian filter. The Laplacian estimates the second derivative
of the signal. The Gaussian filter is used to smooth the data and reduce the contribution of
noise to the second derivative. The parameters of the LoG are the kernel dimensions and the
standard deviation for the Gaussian. LoG with a 20x1 pixel kernel size and 0.5 pixel
standard deviation was convolved with the flattened and decimated OCT image. The gradient
strength parameter, representing the presence of the birefringence artifact, was defined as the
mean pixel value within the ROI of the LoG-filtered image.
2.5 Statistical analysis
Student t-tests and receiver operator characteristic curves (ROC) were used to determine
whether the quantified tissue classification parameters can be used for binary differentiation
of untreated tissue from TTC-confirmed RFA lesions. Results are reported as mean (95%
confidence interval). The software package Origin 8.0 was used to conduct statistical
analysis and a p-value less than 0.05 was considered statistically significant.
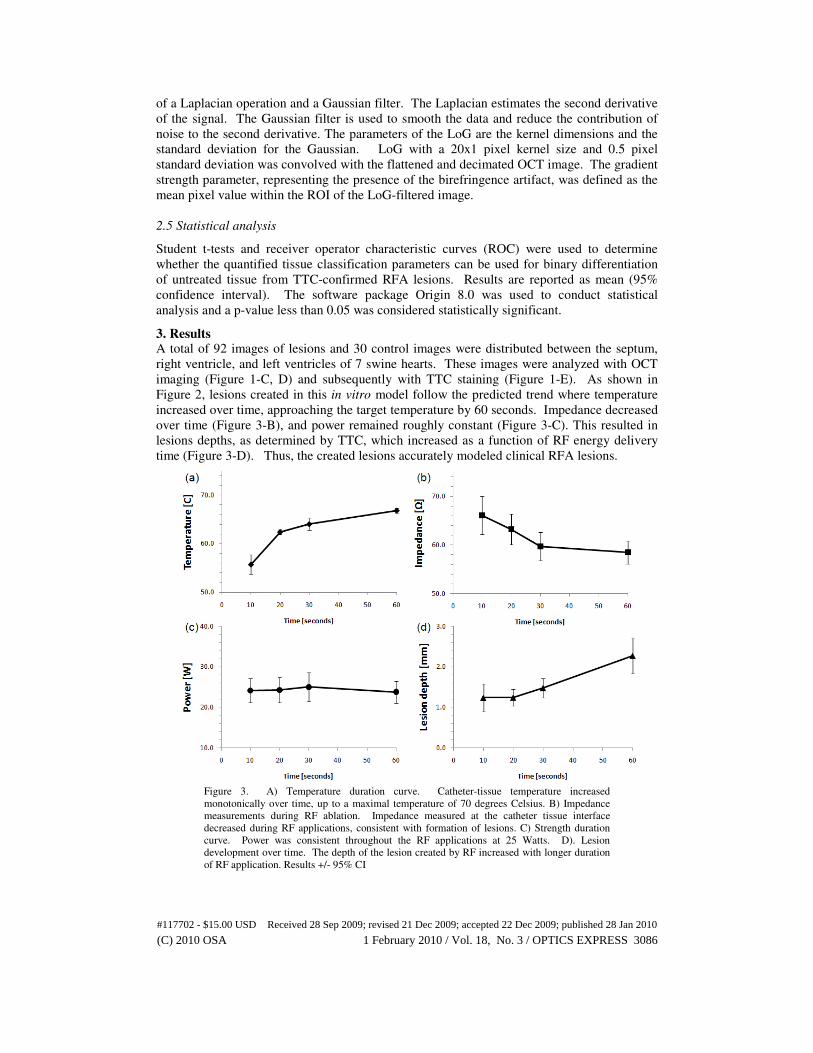
3. Results A total of 92 images of lesions and 30 control images were distributed between the septum,
right ventricle, and left ventricles of 7 swine hearts. These images were analyzed with OCT
imaging (Figure 1-C, D) and subsequently with TTC staining (Figure 1-E). As shown in
Figure 2, lesions created in this in vitro model follow the predicted trend where temperature
increased over time, approaching the target temperature by 60 seconds. Impedance decreased
over time (Figure 3-B), and power remained roughly constant (Figure 3-C). This resulted in
lesions depths, as determined by TTC, which increased as a function of RF energy delivery
time (Figure 3-D). Thus, the created lesions accurately modeled clinical RFA lesions.
Figure 3. A) Temperature duration curve. Catheter-tissue temperature increased
monotonically over time, up to a maximal temperature of 70 degrees Celsius. B) Impedance
measurements during RF ablation. Impedance measured at the catheter tissue interface
decreased during RF applications, consistent with formation of lesions. C) Strength duration
curve. Power was consistent throughout the RF applications at 25 Watts. D). Lesion
development over time. The depth of the lesion created by RF increased with longer duration
of RF application. Results +/- 95% CI
#117702 - $15.00 USD Received 28 Sep 2009; revised 21 Dec 2009; accepted 22 Dec 2009; published 28 Jan 2010
(C) 2010 OSA 1 February 2010 / Vol. 18, No. 3 / OPTICS EXPRESS 3086

3.1 Tissue classification
OCT images of untreated sites had a characteristic polarization-dependent band, due to the
birefringence property of highly organized myocardial tissue (Figure 4).
Figure 4. Representative OCT images of untreated ventricular endocardium. Birefringence
band is visible within images of untreated tissue (indicated by green arrows in panel A). Right
ventricle (A,B), left ventricle (C,D), and right ventricular septum (E,F). Images acquired with
time domain (TDOCT) system.
RFA lesions (Figure 5) were characterized by increased intensity and an absence of a
birefringence dependent polarization artifact band.
#117702 - $15.00 USD Received 28 Sep 2009; revised 21 Dec 2009; accepted 22 Dec 2009; published 28 Jan 2010
(C) 2010 OSA 1 February 2010 / Vol. 18, No. 3 / OPTICS EXPRESS 3087

Figure 5. Representative OCT images of endocardial radiofrequency ablation lesions. Pins are
placed along the ends of the lesion and are visible within OCT images. Yellow dotted lines
indicate the area of the RFA lesion. Ablation lesions are characterized by increased signal
intensity and absence of polarization artifact. Right ventricle (A,B), left ventricle (C,D), and
right ventricular septum (E,F). Images acquired with time domain (TDOCT) system.
To evaluate the ability of each image analysis parameter to distinguish lesions from
untreated tissue, a receiver operator characteristic analysis was conducted. The mean value of
analysis parameters gradient strength and mean intensity for each site was used for analysis.
The lateral region of interest for lesions was defined as the area between the pins. The area
under the curve was largest for the gradient strength, 0.94. The gradient strength was
significantly different between untreated samples 2.0 (0.25) and ablation lesions -1.2 (0.1),
p=5.93x10⁻⁵
. By choosing a threshold that produces the maximum accuracy, 0.78, the
gradient strength had a high sensitivity and specificity, 94.5% and 86.7% respectively. When
analyzing the data according to tissue type, the gradient strength had an AUC of 0.99, 0.95,
and 0.97 for the left ventricle, right ventricle, and ventricular septum and a sensitivity and
specificity for the right ventricle (94.6%, 93.3%), left ventricle (96.4%, 100%) and ventricular
septum (96.3%, 100%). Mean intensity was significantly increased, p=2.82x10⁻⁴
, between
untreated samples 35.8 (1.7) and ablation lesions 43.5 (1.0). However, mean intensity was
not a strong classifying parameter with an AUC of 0.72 and a threshold of 28.7 that produces
maximum accuracy resulted in a sensitivity of 94.6% and specificity of26.7%. This is
demonstrated Figure 6, where the main parameter separating untreated sites from ablation
lesions was the gradient strength.
#117702 - $15.00 USD Received 28 Sep 2009; revised 21 Dec 2009; accepted 22 Dec 2009; published 28 Jan 2010
(C) 2010 OSA 1 February 2010 / Vol. 18, No. 3 / OPTICS EXPRESS 3088

Figure 6. Distinguishing ablation lesions and untreated tissue using gradient strength. a) Scatter
plot for each image within the TDOCT dataset, with gradient strength on the x-axis and
intensity on the y-axis. Ablation lesions (open shapes), untreated tissue (filled shapes). Left
ventricle – circle, right ventricle – square, ventricular septum - triangle B) Receiver operator
characteristic (ROC) curve for gradient strength to distinguish ablation lesions from untreated
tissue. Lesions can be distinguished from untreated samples within all sites using gradient
strength as a discriminating factor, with a 0.94 area under curve (AUC). C) ROC curve for
intensity. Intensity had a low classification power to distinguish ablation lesions from
untreated tissue, with a 0.72 AUC.
A mean 24W of RF energy was delivered to the wedges, resulting in an average lesion depth
of 1.5 (0.10) mm and surface width of 4.5 (0.14) mm, determined by TTC staining. The
surface width indicated by the pins was 3.9 (0.08) mm. The width of ablation lesions
confirmed by TTC vital staining was slightly larger (0.67 mm) than the distance between pins
used to identify RFA lesions within OCT images. Thus, the area used for analysis of RFA
lesions within OCT images was confirmed to be necrotic tissue. Image analysis parameters
gradient strength and mean intensity did not show a relationship with lesion depth.
#117702 - $15.00 USD Received 28 Sep 2009; revised 21 Dec 2009; accepted 22 Dec 2009; published 28 Jan 2010
(C) 2010 OSA 1 February 2010 / Vol. 18, No. 3 / OPTICS EXPRESS 3089

Within volumetric image sets of linear ablation lines, a gap of viable tissue between two
ablation lesions was identifiable within OCT images as a birefringent dependent band (Figure
7).
Figure 7. Gap of untreated tissue within linear ablation line characterized by band due to
polarization artifact. a) The gap of untreated tissue was characterized by a strong birefringence
dependent band. b) TTC vital staining of ablation two ablation lesions with gap of untreated
tissue. c) OCT image decimated to 512 x 13 pixels. d-f) Representative averaged axial scans
from decimated image within areas with lesion (d,f) and untreated tissue (e). Band is observed
within area of treated tissue and not ablation lesions. Images acquired with microscope
integrated Fourier Domain (FDOCT) system.
3.2 Visualization of overtreatment
Within a subset of OCT images of RFA lesions (n=34), disruptions were visible within the
myocardium (Figure 8). These disruptions were attributed to over-treatment; however none
of the procedures produced craters, tearing of the endocardial surface, or audible steam pops,
indicative of endocardial or myocardial rupture. The standard measurements of mean
temperature (p=0.997), impedance (p=0.467), and power (p=0.488), were not significantly
different between lesions without visible disruptions and over-treated lesions.
Figure 8. Representative OCT images of the endocardium with visualization of “over treated”
RFA lesions. Disruptions within the endocardium and myocardium are visible, and may be
precursors to steam pops and crater formation. Yellow dotted lines circumscribe each lesion.
Images acquired with time domain (TDOCT) system.
4. Discussion
Radiofrequency ablation (RFA) causes thermal damage due to resistive heating, producing an
area of coagulation necrosis[2]. Thermal damage of the myocardium has been shown to
cause changes in the optical properties of tissue, in particular anisotropy coefficient,
scattering coefficient[25-27], and birefringence[39]. Our results show that using a
conventional, single detector, OCT system there are measurable tissue characteristics that are
#117702 - $15.00 USD Received 28 Sep 2009; revised 21 Dec 2009; accepted 22 Dec 2009; published 28 Jan 2010
(C) 2010 OSA 1 February 2010 / Vol. 18, No. 3 / OPTICS EXPRESS 3090
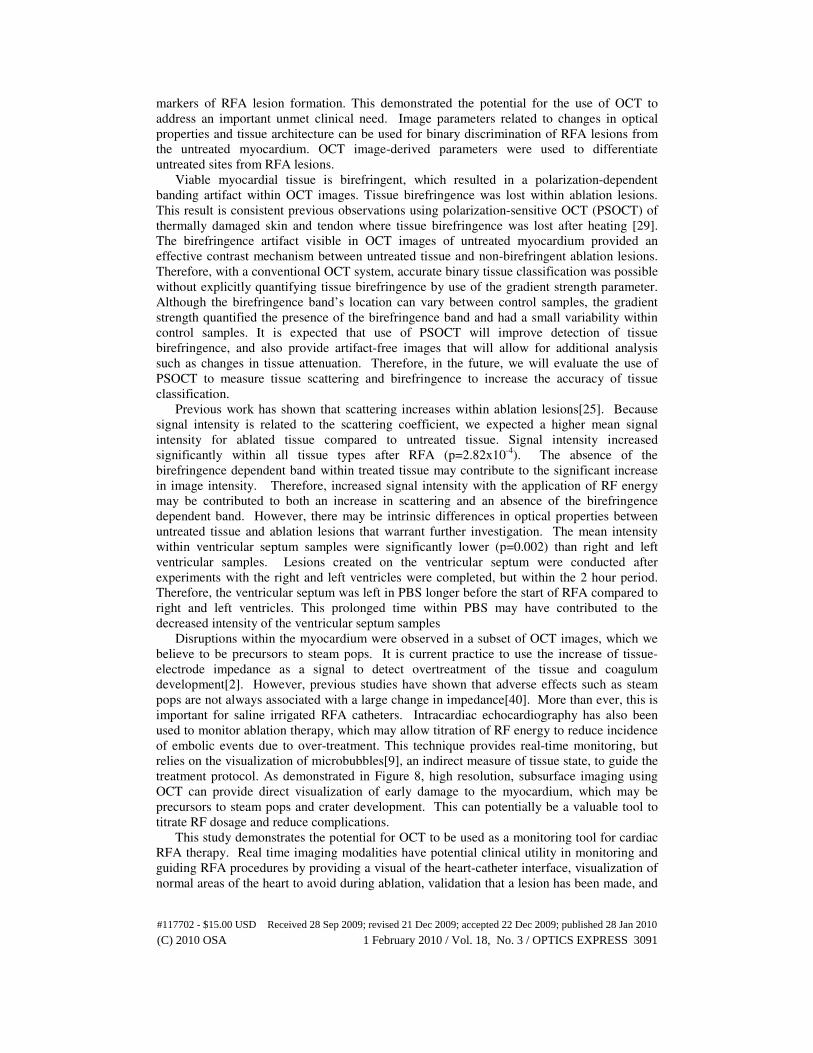
markers of RFA lesion formation. This demonstrated the potential for the use of OCT to
address an important unmet clinical need. Image parameters related to changes in optical
properties and tissue architecture can be used for binary discrimination of RFA lesions from
the untreated myocardium. OCT image-derived parameters were used to differentiate
untreated sites from RFA lesions.
Viable myocardial tissue is birefringent, which resulted in a polarization-dependent
banding artifact within OCT images. Tissue birefringence was lost within ablation lesions.
This result is consistent previous observations using polarization-sensitive OCT (PSOCT) of
thermally damaged skin and tendon where tissue birefringence was lost after heating [29].
The birefringence artifact visible in OCT images of untreated myocardium provided an
effective contrast mechanism between untreated tissue and non-birefringent ablation lesions.
Therefore, with a conventional OCT system, accurate binary tissue classification was possible
without explicitly quantifying tissue birefringence by use of the gradient strength parameter.
Although the birefringence band’s location can vary between control samples, the gradient
strength quantified the presence of the birefringence band and had a small variability within
control samples. It is expected that use of PSOCT will improve detection of tissue
birefringence, and also provide artifact-free images that will allow for additional analysis
such as changes in tissue attenuation. Therefore, in the future, we will evaluate the use of
PSOCT to measure tissue scattering and birefringence to increase the accuracy of tissue
classification.
Previous work has shown that scattering increases within ablation lesions[25]. Because
signal intensity is related to the scattering coefficient, we expected a higher mean signal
intensity for ablated tissue compared to untreated tissue. Signal intensity increased
significantly within all tissue types after RFA (p=2.82x10⁻⁴
). The absence of the
birefringence dependent band within treated tissue may contribute to the significant increase
in image intensity. Therefore, increased signal intensity with the application of RF energy
may be contributed to both an increase in scattering and an absence of the birefringence
dependent band. However, there may be intrinsic differences in optical properties between
untreated tissue and ablation lesions that warrant further investigation. The mean intensity
within ventricular septum samples were significantly lower (p=0.002) than right and left
ventricular samples. Lesions created on the ventricular septum were conducted after
experiments with the right and left ventricles were completed, but within the 2 hour period.
Therefore, the ventricular septum was left in PBS longer before the start of RFA compared to
right and left ventricles. This prolonged time within PBS may have contributed to the
decreased intensity of the ventricular septum samples
Disruptions within the myocardium were observed in a subset of OCT images, which we
believe to be precursors to steam pops. It is current practice to use the increase of tissue-
electrode impedance as a signal to detect overtreatment of the tissue and coagulum
development[2]. However, previous studies have shown that adverse effects such as steam
pops are not always associated with a large change in impedance[40]. More than ever, this is
important for saline irrigated RFA catheters. Intracardiac echocardiography has also been
used to monitor ablation therapy, which may allow titration of RF energy to reduce incidence
of embolic events due to over-treatment. This technique provides real-time monitoring, but
relies on the visualization of microbubbles[9], an indirect measure of tissue state, to guide the
treatment protocol. As demonstrated in Figure 8, high resolution, subsurface imaging using
OCT can provide direct visualization of early damage to the myocardium, which may be
precursors to steam pops and crater development. This can potentially be a valuable tool to
titrate RF dosage and reduce complications.
This study demonstrates the potential for OCT to be used as a monitoring tool for cardiac
RFA therapy. Real time imaging modalities have potential clinical utility in monitoring and
guiding RFA procedures by providing a visual of the heart-catheter interface, visualization of
normal areas of the heart to avoid during ablation, validation that a lesion has been made, and
#117702 - $15.00 USD Received 28 Sep 2009; revised 21 Dec 2009; accepted 22 Dec 2009; published 28 Jan 2010
(C) 2010 OSA 1 February 2010 / Vol. 18, No. 3 / OPTICS EXPRESS 3091

detecting precursors to complications. Our results do not provide evidence that OCT may be
suitable for assessing depth of cardiac RFA lesions. We demonstrated that OCT can be used
to differentiate ablation lesions from untreated tissue and visualize potential complications
due over treatment. These results motivate the next step toward translation of this
technology. Future in vivo investigations will require catheter based imaging using PSOCT
for assessing dynamics due to RF energy delivery. A contact OCT catheter will displace
blood from the OCT field of view, allowing the OCT probe beam direct access to the tissue
surface. Saline irrigated RFA catheters are becoming standard during complex RFA
procedures and could be used in combination with contact OCT catheters to further displace
blood. A forward-imaging probe in contact with the tissue will largely mitigate motion
artifacts during in vivo imaging. High speed imaging will further mitigate motion artifact as
well as any artifacts due to changes in myocardial optical properties as a function of time
during the cardiac cycle. This will enable future studies to evaluate the ability for OCT to
discriminate viable tissue from ablation lesions in the presence of blood, with varying catheter
contact angle, and in vivo. Catheter-based imaging will allow for real-time monitoring
during RF energy delivery, assessment of tissue contact, and observation of the time
dependence of image analysis parameters to evaluate whether OCT guidance can identify
early markers of complications and observe lesion formation in real time.
5. Conclusion
This study demonstrates that optical coherence tomography has the potential to monitor the
formation of radiofrequency lesions in the heart. Our experimental results validate that using
OCT imaging, RFA lesions can be distinguished from the untreated endocardium. Changes
in optical properties and loss of birefringence provide intrinsic contrast between untreated
tissue and ablation lesions. In addition, potential predictors of complications such as crater
formation are visible within OCT images.
A direct image by OCT has the potential to guide the precise application of energy, avoid
normal cardiac structures where ablation could be harmful, ensure adequate tissue contact
during energy delivery and provide real-time formation of successful lesions. Importantly,
this may decrease the procedure time and radiation exposure to the patient and physician.
Furthermore, real-time feedback from OCT during RFA therapy may enable decreased
complication rates. Therefore, these data set the foundation for OCT as an imaging modality
for future real-time direct monitoring of cardiac RFA therapy.
Acknowledgements
The authors would like to thank Lee Barwick, Bryan Webb, and Dr. Steve Schomisch for
technical assistance and Dr. David Rosenbaum for advice and consultation. The project was
supported by the Wallace H. Coulter Foundation and by the National Institutes of Health
(HL085939, HL083048, RR1246). The content is solely the responsibility of the authors and
does not necessarily represent the official views of the National Heart Lung and Blood
Institute or the National Institutes of Health.
#117702 - $15.00 USD Received 28 Sep 2009; revised 21 Dec 2009; accepted 22 Dec 2009; published 28 Jan 2010
(C) 2010 OSA 1 February 2010 / Vol. 18, No. 3 / OPTICS EXPRESS 3092