Embed Size (px)
Citation preview

UNITED BANK LIMITEDUBL Head OfficeI.I. Chundrigar Road, Karachi - 74000, Pakistan.UAN: 111-825-888 Website: www.ubldigital.com
HALF YEARLY REPORTJUNE 30, 2021 (UN-AUDITED)
In Touchwith Tomorrow


01Half Yearly Report 2021
CONTENTS
Company Information ......................................................................................................................... 02
Directors’ Report to the Members ........................................................................................................ 03
Unconsolidated Condensed Interim Financial Statements of United Bank Limited .......................................................................................................................... 10
Auditors’ Review Report ...................................................................................................................... 11
Unconsolidated Condensed Interim Statement of Financial Position .................................................. 12
Unconsolidated Condensed Interim Profit And Loss Account ............................................................. 13
Unconsolidated Condensed Interim Statement of Comprehensive Income ........................................ 14
Unconsolidated Condensed Interim Statement of Changes In Equity ................................................ 15
Unconsolidated Condensed Interim Cash Flow Statement ................................................................. 16
Notes To The Unconsolidated Condensed Interim Financial Statements ........................................... 17
Consolidated Condensed Interim Financial Statements of United Bank Limited .......................................................................................................................... 49
Consolidated Condensed Interim Statement of Financial Position ..................................................... 50
Consolidated Condensed Interim Profit And Loss Account ................................................................. 51
Consolidated Condensed Interim Statement of Comprehensive Income ............................................ 52
Consolidated Condensed Interim Statement of Changes In Equity .................................................... 53
Consolidated Condensed Interim Cash Flow Statement ..................................................................... 54
Notes To The Consolidated Condensed Interim Financial Statements ............................................... 55
Directors’ Report to the Members (Urdu) ............................................................................................ 90

02 United Bank Limited
Sir Mohammed Anwar Pervez, OBE, HPkChairman/Non-Executive Director
Lord Zameer M. Choudrey, CBE, SI PkNon-Executive Director
Mr. Haider Zameer ChoudreyNon-Executive Director
Mr. Rizwan PervezNon-Executive Director
Mr. Shazad G. DadaPresident & CEO
Mr. Arshad Ahmad MirNon-Executive Director
Mr. Amar Zafar KhanIndependent Director
Mr. Tariq RashidIndependent Director
Ms. Shazia SyedIndependent Director
COMMITTEES OF THE BOARD
BOARD AUDIT COMMITTEE (BAC):
Ms. Shazia Syed ChairpersonMr. Haider Zameer Choudrey MemberMr. Rizwan Pervez MemberMr. Aqeel Ahmed Nasir Secretary BOARD HUMAN RESOURCE & COMPENSATION COMMITTEE (HRCC):
Mr. Tariq Rashid ChairmanSir Mohammed Anwar Pervez, OBE, HPk MemberMr. Arshad Ahmad Mir MemberMr. Rizwan Pervez MemberMs. Sadia Saeed* Secretary BOARD RISK & COMPLIANCE COMMITTEE (BRCC):
Mr. Arshad Ahmad Mir ChairmanLord Zameer M. Choudrey, CBE, SI Pk MemberMs. Shazia Syed MemberMr. Shazad G. Dada MemberMr. Imran Sarwar Secretary BOARD IT COMMITTEE (BITC):
Mr. Tariq Rashid ChairmanLord Zameer M. Choudrey, CBE, SI,Pk MemberMr. Haider Zameer Choudrey Member Mr. Shazad G. Dada MemberMr. Muhammad Faisal Anwar Secretary
BOARD NOMINATION COMMITTEE (BNC):
Sir Mohammed Anwar Pervez, OBE, HPk ChairmanLord Zameer M. Choudrey, CBE, SI Pk MemberMr. Arshad Ahmad Mir MemberMr. Aqeel Ahmed Nasir Secretary
Chief Financial Officer
Mr. Aameer Karachiwalla
Company Secretary & Chief Legal Counsel
Mr. Aqeel Ahmed Nasir
Registered Office:13th Floor, UBL Building, Jinnah Avenue,Blue Area, Islamabad.
UBL Head OfficeI.I. Chundrigar Road, Karachi – 74000, Pakistan.
Share RegistrarTHK Associates (Pvt.) LimitedPlot No. 32-C, Jami Commercial Street - 2 D.H.A. Phase VII,Karachi - 75500.Phone No.: 021-35310187UAN: 021-111-000-322Fax No.: 021-35310190Email: [email protected]
AuditorsM/s. A. F. Ferguson & Co., Chartered Accountants
Legal AdvisorsM/s. Mehmood Abdul Ghani & Co.,Advocates
ContactsUAN: 111-825-111Contact Centre: 111-825-888Website: www.ubldigital.com Email: [email protected]
Board of Directors
*Ms. Sadia Saeed, Secretary Board Human Resource & Compensation Committee (HRCC) has completed her term of employment on 19 July 2021 and subsequently Mr. Minhas Wirasat Ali has been given charge as Acting Head HR / Secretary HRCC.
COMPANY INFORMATION

03Half Yearly Report 2021
On behalf of the Board of Directors, we are pleased to present the financial statements of United Bank Limited (UBL) for the half year ended June 30, 2021.
Performance Overview
On a standalone basis, UBL recorded Profit Before Tax (PBT) of Rs. 25.9 billion for the half year ended June 30, 2021, a strong growth of 37% year on year. On a quarter on quarter basis, the bank recorded a strong growth in PBT of 12% Q2’21 versus Q1’21.
UBL’s gross revenues stood at Rs. 46.5 billion for H1’21 (H1’20: Rs. 48.0 billion). Net mark-up income was recorded at Rs. 35.1 billion for H1’21 (H1’20: Rs. 39.1 billion). The bank recorded non-markup income of Rs. 11.4 billion for H1’21, an increase of 28% over H1’20, owing mainly to capital gains realized on foreign bonds as well as strong growth in all major fee lines.
The bank’s operating expenses stood at Rs. 20.2 billion for H1’21, a growth of 5% over H1’20. Cost to income ratio remained lean at 43% for H1’21 as against 40% in the corresponding period of last year.
The bank recorded a net provision reversal of Rs. 87 million in H1’21 against a net provision charge of Rs. 9.4 billion in H1’20, owing mainly to sustained recovery efforts within both the domestic and international segments.
Financial Highlights
On a standalone basis, UBL recorded Profit After Tax (PAT) of Rs. 15.0 billion for H1’21 versus a PAT of Rs. 11.4 billion for H1’20, a strong growth of 32% year on year. Earnings per share (EPS) was measured at Rs. 12.25 for H1’21 (H1’20: Rs. 9.31).
On a consolidated basis, UBL recorded PAT of Rs. 15.0 billion (H1’20: Rs. 10.7 billion). The consolidated EPS was measured at Rs. 12.24 for H1’21 (H1’20: Rs. 8.94).
Net Markup Income
Net markup income was recorded at Rs. 35.1 billion for H1’21, 10% lower on a year on year basis. The bank’s markup earning assets averaged Rs. 1.8 trillion in H1’21, growing by 11% year on year. Bank level Net interest margin (NIM) was measured at 3.9% for H1’21 (H1’20: 5.0%). In order to support the economy during the pandemic, the State Bank of Pakistan (SBP) reduced the policy rate from 13.25% at Dec’19 to 7.00% by Jun’20. The average interest rates stood close to 11.0% in H1’20 versus 7.0% in H1’21, due to which higher net markup income was earned in the corresponding period of last year.
Domestic deposits averaged Rs. 1.4 trillion in H1’21, with one of the highest portfolio growth levels achieved of 20%. Domestic CASA deposits averaged Rs. 1.2 trillion for H1’21, a growth of 19% year on year, with an incremental increase in the base of Rs. 195 billion. The average CASA to total deposits ratio was measured at 85.1% in H1’21 (H1’20: 85.5%). The Branch banking segment continued to actively solicit new relationships as it added approximately 290,000 new current account relationships in H1’21 as against
DIRECTORS’ REPORT TO THE MEMBERS

04 United Bank Limited
231,000 current account relationships on boarded in the corresponding period of last year. This led to average current deposits growing by 22% year on year to Rs. 618 billion in H1’21, and resultantly, the average current to total deposits ratio improved to 43% in H1’21 from 42% in H1’20. The domestic portfolio of savings accounts averaged Rs. 603 billion in H1’21, recording a strong growth of 16% year on year. The steady build-up in low cost deposits as well as a sharp reduction in the policy rate led to the domestic cost of deposits declining to 3.4% in H1’21 from 5.5% in H1’20.
On the asset side, bank level performing advances averaged Rs. 537 billion for H1’21 (H1’20: Rs. 605 billion), while domestic performing advances averaged Rs. 436 billion for H1’21 (H1’20: Rs. 484 billion). Maintaining strong focus on asset quality, the domestic corporate loan book averaged Rs. 355 billion for H1’21, down 13% year on year. Consumer loans averaged Rs. 19 billion for H1’21, growing by 9% year on year, driven mainly by growth in the secured autos segment. The Islamic loan book is up 58% year on year in averages, being recorded at Rs. 31 billion for H1’21. Within UBL International, the bank has significantly de-risked its balance sheet as the average performing loan book reduced from USD 758 million in H1’20 to USD 644 million in H1’21, a decline of 15% year on year.
The bank’s markup earning investments averaged Rs. 1.2 trillion for H1’21, growing by growth of 26% over H1’20. The domestic government securities portfolio earned the bank a healthy yield of over 8.0% during the period under review. UBL International’s foreign bonds portfolio averaged USD 735 million, growing by 10% year on year, yielding 5.3% in H1’21.
Non-Markup Income
The bank earned non-markup income of Rs. 11.4 billion in H1’21, an increase of 28% year on year and contributed 25% of the total revenues of the bank in H1’21 (H1’20: 19%).
Fees and commission income of Rs. 6.6 billion was earned in H1’21, a growth of 26% compared to last year. This performance was driven by the domestic franchise which recorded a strong 35% growth in fee revenues in H1’21 versus H1’20.
Customer fees from branch banking operations stood at Rs. 820 million for H1’21, largely in line with revenues earned last year. UBL maintained its leadership position in the domestic home remittances space with a market share of over 20%. As a result, commission income from home remittances of Rs. 841 million was earned in H1’21, up 12% year on year.
The bank maintained its momentum within the bancassurance business as premium volumes of Rs. 1.8 billion were underwritten in H1’21, an increase of 81% over H1’20. Bancassurance commissions stood at Rs. 883 million in H1’21, a strong growth of 84% year on year. With business momentum picking up, income from debit and credit card fees of Rs. 1.1 billion was earned in H1’21 (H1’20: Rs. 690 million). The bank earned investment banking fees of Rs. 343 million in H1’21 versus Rs. 85 million in H1’20, led by corporate mandates for debt arrangement and advisory services. Commission income from cash management was recorded at Rs. 462 million for H1’21, growing by 24% year on year.
The bank earned foreign exchange income of Rs. 1.2 billion in H1’21 (H1’20: Rs. 1.7 billion). Dividend income of Rs. 881 million was recorded for H1’21, an increase of 11% year on year, with improved payouts from fertilizer and energy stocks as well group entities. The bank realized capital gains of Rs. 2.5 billion in H1’21 (H1’20: Rs. 676 million), primarily on the timely sale of foreign debt securities.

05Half Yearly Report 2021
Provisions and loan losses
UBL recorded a net provision reversal of Rs. 87 million for H1’21 as against a net provision charge of Rs. 9.4 billion in the corresponding period of last year.
Bank level non-performing loans (NPLs) stood at Rs. 82.1 billion at Jun’21, compared to Rs. 83.6 billion at Dec’20, reducing by Rs. 1.6 billion. Bank level asset quality improved marginally from 13.7% at Dec’20 to 12.9% at Jun’21, while specific coverage was enhanced from 85.8% at Dec’20 to 86.7% at Jun’21.
UBL Domestic
Gross advances for the domestic bank stood at Rs. 479 billion at Jun’21 (Dec’20: Rs. 458 billion), and constituted over 75% of the bank’s total portfolio. Domestic NPLs reduced by nearly Rs. 1.0 billion since Dec’20, from Rs. 28.7 billion at Dec’20 to Rs. 27.8 billion at Jun’21.
The domestic bank recorded net provision reversals of Rs. 1.1 billion for H1’21 versus a net provision charge of Rs. 1.1 billion in H1’20. Domestic bank’s asset quality improved from 6.3% at Dec’20 to 5.8% at Jun’21.
UBL International
UBL International’s NPLs have remained largely unchanged at USD 344.6 million at Jun’21 (Dec’20: USD 343.3 million). A net provision charge of USD 6.6 million was recorded for H1’21 against a net provision charge of USD 52.0 million in H1’20. Specific coverage was enhanced from 85.9% at Dec’20 to 86.3% at Jun’21. Furthermore, specific coverage with Forced Sale Value (FSV) of mortgaged properties and cash collateral stood at 94.8% at Jun’21 (Dec’20: 95.5%, refer to note 10.3.2 to the financial statements).
Cost management
Improving operational efficiencies remains a key focus for UBL. The bank is continually striving to optimize its cost base, while improving service delivery through investment in IT as well as expanding capacity across the branch network.
UBL’s operating expenses were recorded at Rs. 20.2 billion for H1’21, with growth contained at 5% year on year. Employee compensation was recorded at Rs. 8.3 billion for H1’21, an increase of 4% year on year. Property expenses were recorded at Rs. 3.2 billion for H1’21, largely in line with last year. IT expenses were recorded at Rs. 2.1 billion, up 8% over H1’20. Other operating expenses were recorded at Rs. 6.6 billion for H1’21, an increase of 8% year on year, mainly due to higher sales commissions and increased business volumes as economic activity builds up to pre COVID levels.
Balance Sheet management
UBL’s balance sheet stood at Rs. 2.4 trillion, growing by 17% since Dec’20. Bank level deposits grew by 13% over Dec’20 to Rs. 1.85 trillion. This performance is led by the Branch Banking Group as domestic deposits stood at Rs. 1.6 trillion, growing by 16% over Dec’20, which enabled the bank to record an average market share of 8.3% of total banking sector deposits for H1’21, improving from an average market share of 8.0%

06 United Bank Limited
for H1’20. Domestic current deposits closed Jun’21 at Rs. 715 billion, growing by a strong 16% over Dec’20, while the saving portfolio stood at Rs. 701 billion, increasing by 18%. This enabled the bank to improve its CASA to total deposits ratio from 85.2% at Dec’20 to 86.2% at Jun’21. UBL International’s deposits stood at USD 1.3 billion at Jun’21, a slight decline of 5% since Dec’20.
Bank level net advances closed at Rs. 557 billion as at Jun’21 (Dec’20: Rs. 530 billion).. Our lending strategy is aimed at ensuring efficient allocation of capital while maximizing overall returns from relationships. Domestic performing advances stood at Rs. 451 billion, growing by 5% since Dec’20. The bank is aggressively looking to expand within the Islamic banking space as performing advances stood at Rs. 43 billion, increasing more than two-folds over the Dec’20 levels of Rs. 21 billion. UBL International’s net advances stood at USD 655 million at Jun’21, an increase of 8% over Dec’20, with growth mainly within trade based and FI lending in line with the bank’s strategy.
Bank level investments stood at Rs. 1.46 trillion at Jun’21, an increase of 29% over Dec’20. Excess liquidity is primarily deployed in government securities within UBL Domestic, as Rs. 209 billion is invested in fixed income PIBs, Rs. 408 billion invested in floating rate PIBs and Rs. 633 billion invested in treasury bills. In the current interest rate environment, the investments strategy is aimed at maintaining stable margins across a well-diversified mix of shorter and longer tenor instruments.
Capital Ratios
The bank seeks to maintain a strong capital base that provides a solid foundation for future growth initiatives as well as maintaining adequate buffers over regulatory requirements.
UBL has been designated a Domestic Systemically Important Bank (D-SIB) by the SBP. This designation initially required the bank to hold an additional 1.5% Higher Loss Absorbency (HLA) Surcharge, over and above the applicable minimum capital adequacy ratio (CAR) limit in 2019, on both a standalone and consolidated basis. However, SBP reduced the HLA surcharge by 50 bps to 1.0% effective March 2020 as per their latest D-SIB designation.
SBP has also provided regulatory relief post COVID-19 to support the banking sector in extending credit facilities to its customers. In this respect, SBP has reduced the Capital Conservation Buffer (CCB) from its existing level of 2.5% to 1.5%, for the time being till further instructions are issued. Thus, the minimum CAR requirement for UBL stood at 12.5% (including the HLA Surcharge of 1.0%) as at June 30, 2021.
The overall CAR stood at 23.5% at Jun’21 (Dec’20: 24.4%), a buffer of 11.0% over the minimum regulatory requirement of 12.5%. The Common Equity Tier 1 (CET-1) ratio stood at 16.4% at Jun’21 (Dec’20: 17.0%). Total Tier 1 Capital ratio was measured at 17.7% at Jun’21 (Dec’20: 18.4%).
The Board of Directors of UBL declared an interim cash dividend of Rs. 4.0 per share in their meeting in Karachi held on August 6, 2021, along with the results for the half year ended June 30, 2021.
Economy Review
The country is well on its way to economic recovery following the outbreak of the COVID pandemic in Q1’20. The resumption of industrial activity across the country is supporting employment levels driven

07Half Yearly Report 2021
by a more favorable business environment. The government’s nation-wide vaccination drive is picking up momentum in a bid to protect its citizens. GDP growth rate was recorded at 3.9% for FY’21 (FY’20: negative 0.5%) a notable achievement in light of the challenges faced during the period. However, the threat of a prolonged fourth wave of the pandemic due to the spread of new variants may impact this nascent recovery. Furthermore, the country is still in the midst of an IMF program which has tough conditions, which are likely to challenge the existing growth oriented policy measures of the government.
Controlling inflation levels continues to be a major challenge for the incumbent government. Policy measures require the right balance between monetary stimulus, maintaining fiscal discipline and ensuring that overall price levels remain contained. The Consumer Price Index (CPI) stood at 9.7% for the month of Jun’21, down 120 bps month on month mainly due to a reduction in the price levels of food items, while average inflation for FY’21 was measured at 8.9% versus 10.8% in FY’20.
On the external front, the country’s balance of payment position has been largely favorable, primarily on the back of strong growth in home remittance flows, which reached a record high of USD 29.4 billion in FY’21 registering a growth of 27% year on year. However, the trade deficit continues to be impacted by increase in imports of capital goods, industrial materials, food and commodity items. Furthermore, oil prices have increased by over 90% since Jun’20, which added significant pressure on the current account position. The current account recorded a deficit of USD 1.9 billion for FY’21 versus a deficit of USD 4.4 billion in the corresponding period of last year. The country’s imports stood at USD 56.4 billion for FY’21, an increase of 26.6% year on year while exports for FY’21 stood at USD 25.3 billion, up 18.3% year on year.
The country also ventured into international markets with multiple new Eurobond issues worth USD 3.5 billion in 2021. Furthermore, the momentum continued within SBP’s ‘Roshan Digital’ initiative for overseas Pakistanis as funds in excess of USD 1.5 billion have been mobilized till Jun’21. These positive developments were also reflected in the domestic FX markets as the PKR appreciated by 1.4% against the USD since Dec’20, closing at Rs. 157.54. However, the exchange rate has experienced some pressures post June 30, 2021, with the exchange rate hovering over the Rs. 160 level. Overall, FX reserves have increased by 18.9% since Dec’20, standing at USD 24.4 billion at Jun’21. The country’s capital markets maintained stable volumes and valuation trends in the first half of 2021 as the KSE-100 index closed at 47.4 k points at Jun’21, up 8% since Dec’20.
Deposits for the banking sector stood at Rs. 19.8 trillion at Jun’21, up 11% since Dec’20, while banking sector advances closed at Rs. 9.0 trillion at Jun’21, up 6% over Dec’20. Non-performing loans for the banking industry stood at Rs. 850 billion at Mar’21, 3% above Dec’20, as the asset quality deteriorated slightly from 9.2% at Dec’20 to 9.3% at Mar’21.
UBL International
The economic recovery within the GCC has started to build some momentum with demand picking up as the vaccination drive continues across the region. The OPEC member countries decision to maintain production cuts has resulted in a significant pick up in the global oil prices, which will support economic recovery in the near term. Within UBL International, the bank aims to maintain its business model on
08 United Bank Limited
the foundations of a stable base of core deposits. On the asset side, lending remains selective, confined to existing quality relationships, with close oversight to contain any new NPL formation. The bank is also actively pursuing more trade based financing opportunities as well as looking to expand its FI lending book. Excess liquidity is primarily deployed in sovereign debt securities with an aim to maintain healthy net interest margins. Furthermore, the bank is actively looking to exit non-core jurisdictions and re-allocate capital to more profitable regions and business opportunities. As part of the global realignment strategy, the bank intends to voluntarily wind up its wholly owned subsidiary, UBL (Switzerland) AG, subject to relevant legal and regulatory approvals.
UBL International’s deposits averaged USD 1.3 billion for H1’21 (H1’20: USD 1.5 billion). Cost of deposits was reduced from 1.8% in H1’20 to 1.2% in H1’21. Performing advances averaged USD 644 million for H1’21, declining by 15% over H1’20. The investment portfolio, comprising mainly of sovereign bonds, averaged USD 757 million, earning the bank a healthy yield of 5.5% during H1’21. This performance enabled UBL International to record a PBT of USD 19.1 million for the half year ended June 30, 2021 (H1’20: Loss before tax of USD 38.1 million).
Credit Rating
VIS Credit Rating Company Limited (VIS) re-affirmed the entity ratings of UBL at ‘‘AAA / A-1+” (Triple A / A-One Plus) on June 30, 2021. Furthermore, UBL’s Additional Tier-1 (ADT-1) TFC has also been re-affirmed at ‘AA+’ (Double A plus). Outlook on the assigned ratings are ‘Stable’.
Awards and Recognition
UBL was declared Pakistan’s Best Digital Bank for the second year in a row by Asiamoney, an associate of Euromoney. The awards recognize UBL’s leading role as one of the most progressive and innovative banks in the country. The adoption of a forward looking digital strategy has resulted in the bank maintaining its market penetration while developing innovative solutions for the future.
UBL was recognized as the “Bank of the Year 2020 - Pakistan” at the Banker Awards. The Banker, is an affiliate of the Financial Times UK and is the world’s leading financial publication. One of the most prestigious titles in the global banking industry, the Banker Awards recognize excellence in performance, adding customer value, innovation and leadership in society. UBL won the award, for the fourth time within a decade, as a result of its contribution, during extraordinary times during the current pandemic, while expanding the scope of financial services in Pakistan as a core strategy and spearheading innovation in the local banking industry.
UBL was declared the ‘Best Digital Bank’ at the 2020 Pakistan Banking Awards. The award recognizes UBL work on ventures to bring about many customer centric technological offerings, and honors UBL’s position as Pakistan’s leading progressive and innovative Bank.

09Half Yearly Report 2021
Shazad G. Dada
President & CEO Karachi, August 06th, 2021
Arshad Ahmad MirDirector
Aameer KarachiwallaChief Financial Of�cer
Shazad G. DadaPresident &
Chief Executive Of�cer
Shazia Syed Director
Arshad Ahmad Mir Director
Sir Mohammed Anwar Pervez, OBE, HPkChairman
Aameer KarachiwallaChief Financial Of�cer
Shazad G. DadaPresident &
Chief Executive Of�cer
Shazia Syed Director
Arshad Ahmad Mir Director
Sir Mohammed Anwar Pervez, OBE, HPkChairman
UBL was also awarded the “Best Mobile App” and “Best Emerging Technology” awards at the prestigious Pakistan Digital Awards 2021. The award recognizes outstanding innovation and creativity of the best digital professionals and companies in the country.
Future Outlook
Being one of the biggest financial institutions of the country, UBL will continue to play a leading role to broaden the scope of financial services across the country. Branch Banking Group remains the core of the UBL franchise where the aim is to expand our active customer base and offer innovative solutions to fulfill the needs of an emerging economy. As part of improving service levels, the bank is re-investing in its network and people while setting significantly higher standards for per branch deposits and profitability. Our award winning digital products continue to support the network in providing innovative solutions in a secure and convenient manner to an ever growing customer base. As recovery picks up, the bank is actively looking to extend credit, within established as well as emerging sectors, while maintaining an efficient RWA profile. Improving the compliance culture in line with best practices remains a key strategic priority. UBL’s most valuable asset are its people, and the bank remains committed to invest in their growth and development.
Acknowledgements
In the end, on behalf of the board of director’s, we would like to express our gratitude to UBL shareholders and customers for their continued trust in the UBL brand. We value the commitment and dedication with which our staff continues to perform, particularly during this challenging period, ensuring uninterrupted services across all touchpoints. We would also like to extend our appreciation to the Government of Pakistan, the State Bank of Pakistan, the Securities and Exchange Commission of Pakistan and other regulatory bodies for their continuous guidance and support.

UNCONSOLIDATED CONDENSED INTERIM FINANCIAL STATEMENTS
FOR THE SIX MONTHS ENDEDJune 30, 2021(Un-audited)

INDEPENDENT AUDITORS’ REVIEW REPORT
TO THE MEMBERS OF UNITED BANK LIMITED
REPORT ON REVIEW OF UNCONSOLIDATED CONDENSED INTERIM FINANCIAL STATEMENTS
Introduction
We have reviewed the accompanying unconsolidated condensed interim statement of financial position of United Bank Limited (“the Bank”) as at June 30, 2021 and the related unconsolidated condensed interim profit and loss account, unconsolidated condensed interim statement of comprehensive income, unconsolidated condensed interim statement of changes in equity and unconsolidated condensed interim cash flow statement, and notes to the unconsolidated condensed interim financial statements for the six-month period then ended (here-in-after referred to as the “interim financial statements”). Management is responsible for the preparation and presentation of these interim financial statements in accordance with accounting and reporting standards as applicable in Pakistan for interim financial reporting. Our responsibility is to express a conclusion on these interim financial statements based on our review. The figures for the quarters ended June 30, 2021 and June 30, 2020 in the unconsolidated condensed interim profit and loss account and unconsolidated condensed interim statement of comprehensive income have not been reviewed and we do not express a conclusion on them.
Scope of Review
We conducted our review in accordance with International Standard on Review Engagements 2410, “Review of Interim Financial Information Performed by the Independent Auditor of the Entity”. A review of interim financial statements consists of making inquiries, primarily of persons responsible for financial and accounting matters, and applying analytical and other review procedures. A review is substantially less in scope than an audit conducted in accordance with International Standards on Auditing and consequently does not enable us to obtain assurance that we would become aware of all significant matters that might be identified in an audit. Accordingly, we do not express an audit opinion.
Conclusion
Based on our review, nothing has come to our attention that causes us to believe that the accompanying interim financial statements are not prepared, in all material respects, in accordance with the accounting and reporting standards as applicable in Pakistan for interim financial reporting.
The engagement partner on the review resulting in this independent auditor’s review report is Shahbaz Akbar.
Chartered AccountantsKarachiDated: August 25, 2021
11Half Yearly Report 2021

12 United Bank Limited
UNCONSOLIDATED CONDENSED INTERIM STATEMENT OF FINANCIAL POSITIONAS AT JUNE 30, 2021
(Un-audited) (Audited) June 30,
2021 December 31,
2020
ASSETSCash and balances with treasury banks 6 245,296,668 250,838,052Balances with other banks 7 20,658,741 13,888,765Lendings to financial institutions 8 21,734,325 19,959,132Investments 9 1,457,482,781 1,128,674,494Advances 10 557,240,340 530,279,496Fixed assets 11 51,321,573 51,207,703Intangible assets 12 1,741,813 1,829,211Deferred tax assets 13 6,487,373 6,399,267Other assets 14 36,320,098 46,507,193
2,398,283,712 2,049,583,313
LIABILITIESBills payable 16 31,794,022 29,733,813Borrowings 17 263,712,120 128,987,415Deposits and other accounts 18 1,849,832,299 1,640,211,901Liabilities against assets subject to finance lease - - Subordinated debt 19 10,000,000 10,000,000Deferred tax liabilities - - Other liabilities 20 61,248,390 56,577,277
2,216,586,831 1,865,510,406
NET ASSETS 181,696,881 184,072,907
REPRESENTED BY:Share capital 12,241,797 12,241,797Reserves 63,167,322 62,274,068Surplus on revaluation of assets 21 27,374,984 27,640,579Unappropriated profit 78,912,778 81,916,463
181,696,881 184,072,907
CONTINGENCIES AND COMMITMENTS 22
The annexed notes from 1 to 41 form an integral part of these unconsolidated condensed interim financial statements.
Aameer Karachiwalla Shazad G. Dada Shazia Syed Arshad Ahmad Mir Sir Mohammed Anwar Pervez, OBE, HPk Chief Financial Officer President & Director Director Chairman Chief Executive Officer
--------------------------------- (Rupees in '000) ---------------------------------
Note
UNCONSOLIDATED CONDENSED INTERIM PROFIT AND LOSS ACCOUNT (UN-AUDITED)FOR THE SIX MONTHS ENDED JUNE 30, 2021
Note
Mark-up / return / interest earned 24 35,925,457 43,067,661 67,751,048 86,448,014 Mark-up / return / interest expensed 25 17,694,416 21,289,376 32,662,142 47,327,204 Net mark-up / interest income 18,231,041 21,778,285 35,088,906 39,120,810
Non mark-up / interest incomeFee and commission income 26 3,564,368 2,261,860 6,604,890 5,248,309 Dividend income 628,742 399,431 881,158 793,328 Foreign exchange income 710,330 1,000,193 1,194,558 1,732,617 Income / (loss) from derivatives 1,504 (2,234) 8,758 (13,508) Gain on securities - net 27 677,562 334,118 2,544,500 676,337 Other income 28 63,606 269,359 195,629 491,513 Total non mark-up / interest income 5,646,112 4,262,727 11,429,493 8,928,596 Total Income 23,877,153 26,041,012 46,518,399 48,049,406
Non mark-up / Interest expensesOperating expenses 29 10,345,999 9,689,626 20,198,825 19,163,219 Workers' Welfare Fund 272,283 280,975 517,178 499,275 Other charges / (reversals) 30 14,947 (28,706) 39,494 152,333 Total non mark-up / interest expenses 10,633,229 9,941,895 20,755,497 19,814,827
Profit before provisions 13,243,924 16,099,117 25,762,902 28,234,579 (Reversals) / provisions and write-offs - net 31 (441,467) 5,729,367 (87,396) 9,429,821
PROFIT BEFORE TAXATION 13,685,391 10,369,750 25,850,298 18,804,758
Taxation 32 6,092,761 4,028,953 10,852,991 7,403,980
PROFIT AFTER TAXATION 7,592,630 6,340,797 14,997,307 11,400,778
Earnings per share - basic and diluted 33 6.20 5.18 12.25 9.31
The annexed notes from 1 to 41 form an integral part of these unconsolidated condensed interim financial statements.
Aameer Karachiwalla Shazad G. Dada Shazia Syed Arshad Ahmad Mir Sir Mohammed Anwar Pervez, OBE, HPk Chief Financial Officer President & Director Director Chairman Chief Executive Officer
-------------- (Rupees in '000) --------------
----------- (Rupees) -----------
April - June 2021
January - June 2020
January - June 2021
April - June 2020
Aameer KarachiwallaChief Financial Of�cer
Shazad G. DadaPresident &
Chief Executive Of�cer
Shazia Syed Director
Arshad Ahmad Mir Director
Sir Mohammed Anwar Pervez, OBE, HPkChairman
UNCONSOLIDATED CONDENSED INTERIM STATEMENT OF FINANCIAL POSITION(UN-AUDITED)AS AT JUNE 30, 2021

13Half Yearly Report 2021
UNCONSOLIDATED CONDENSED INTERIM PROFIT AND LOSS ACCOUNT (UN-AUDITED)FOR THE SIX MONTHS ENDED JUNE 30, 2021
Note
Mark-up / return / interest earned 24 35,925,457 43,067,661 67,751,048 86,448,014 Mark-up / return / interest expensed 25 17,694,416 21,289,376 32,662,142 47,327,204 Net mark-up / interest income 18,231,041 21,778,285 35,088,906 39,120,810
Non mark-up / interest incomeFee and commission income 26 3,564,368 2,261,860 6,604,890 5,248,309 Dividend income 628,742 399,431 881,158 793,328 Foreign exchange income 710,330 1,000,193 1,194,558 1,732,617 Income / (loss) from derivatives 1,504 (2,234) 8,758 (13,508) Gain on securities - net 27 677,562 334,118 2,544,500 676,337 Other income 28 63,606 269,359 195,629 491,513 Total non mark-up / interest income 5,646,112 4,262,727 11,429,493 8,928,596 Total Income 23,877,153 26,041,012 46,518,399 48,049,406
Non mark-up / Interest expensesOperating expenses 29 10,345,999 9,689,626 20,198,825 19,163,219 Workers' Welfare Fund 272,283 280,975 517,178 499,275 Other charges / (reversals) 30 14,947 (28,706) 39,494 152,333 Total non mark-up / interest expenses 10,633,229 9,941,895 20,755,497 19,814,827
Profit before provisions 13,243,924 16,099,117 25,762,902 28,234,579 (Reversals) / provisions and write-offs - net 31 (441,467) 5,729,367 (87,396) 9,429,821
PROFIT BEFORE TAXATION 13,685,391 10,369,750 25,850,298 18,804,758
Taxation 32 6,092,761 4,028,953 10,852,991 7,403,980
PROFIT AFTER TAXATION 7,592,630 6,340,797 14,997,307 11,400,778
Earnings per share - basic and diluted 33 6.20 5.18 12.25 9.31
The annexed notes from 1 to 41 form an integral part of these unconsolidated condensed interim financial statements.
Aameer Karachiwalla Shazad G. Dada Shazia Syed Arshad Ahmad Mir Sir Mohammed Anwar Pervez, OBE, HPk Chief Financial Officer President & Director Director Chairman Chief Executive Officer
-------------- (Rupees in '000) --------------
----------- (Rupees) -----------
April - June 2021
January - June 2020
January - June 2021
April - June 2020
Aameer KarachiwallaChief Financial Of�cer
Shazad G. DadaPresident &
Chief Executive Of�cer
Shazia Syed Director
Arshad Ahmad Mir Director
Sir Mohammed Anwar Pervez, OBE, HPkChairman
UNCONSOLIDATED CONDENSED INTERIM PROFIT AND LOSS ACCOUNT (UN-AUDITED)FOR THE SIX MONTHS ENDED JUNE 30, 2021

14 United Bank Limited
UNCONSOLIDATED CONDENSED INTERIM STATEMENT OF COMPREHENSIVE INCOME (UN-AUDITED)FOR THE SIX MONTHS ENDED JUNE 30, 2021
Profit after taxation for the period 7,592,630 6,340,797 14,997,307 11,400,778
Other comprehensive income
Items that may be reclassified to profit and loss accountin subsequent periods
Effect of translation of net investment in foreign branches 1,168,238 180,368 (606,477) 2,771,342
Movement in surplus / (deficit) on revaluation ofinvestments - net of tax 1,358,115 7,808,347 (240,412) 1,905,668
2,526,353 7,988,715 (846,889) 4,677,010
Items that will not be reclassified to profit and lossaccount in subsequent periods
Remeasurement loss on defined benefitobligations - net of tax - (835,581) - (1,355,438)
Movement in surplus on revaluation of fixedassets - net of tax 495 (99) (237) 1,123
Movement in surplus on revaluation of non-banking assets- net of tax 219 (920) 219 (920)
714 (836,600) (18) (1,355,235)
Total comprehensive income for the period 10,119,697 13,492,912 14,150,400 14,722,553
The annexed notes from 1 to 41 form an integral part of these unconsolidated condensed interim financial statements.
Aameer Karachiwalla Shazad G. Dada Shazia Syed Arshad Ahmad Mir Sir Mohammed Anwar Pervez, OBE, HPk Chief Financial Officer President & Director Director Chairman Chief Executive Officer
January - June 2020
January - June 2021
April - June 2020
April - June 2021
--------------------------------- (Rupees in '000) ---------------------------------
Aameer KarachiwallaChief Financial Of�cer
Shazad G. DadaPresident &
Chief Executive Of�cer
Shazia Syed Director
Arshad Ahmad Mir Director
Sir Mohammed Anwar Pervez, OBE, HPkChairman
UNCONSOLIDATED CONDENSED INTERIM STATEMENT OF COMPREHENSIVE INCOME (UN-AUDITED)FOR THE SIX MONTHS ENDED JUNE 30, 2021

15Half Yearly Report 2021
UNCONSOLIDATED CONDENSED INTERIM STATEMENT OF CHANGES IN EQUITY (UN-AUDITED)FOR THE SIX MONTHS ENDED JUNE 30, 2021
Investments Fixed assetsNon-
banking assets
Balance as at December 31, 2019 (Audited) 12,241,797 26,143,887 33,175,725 653,502 25,152,570 31,071 71,670,331 169,068,883Total comprehensive income for the six months ended June 30, 2020Profit after taxation for the six months ended June 30, 2020 - - - - - - 11,400,778 11,400,778Other comprehensive income - net of tax - 2,771,342 - 1,905,668 1,123 (920) (1,355,438) 3,321,775Total comprehensive income for the six months ended June 30, 2020 - 2,771,342 - 1,905,668 1,123 (920) 10,045,340 14,722,553Transfer to statutory reserve - - 1,140,078 - - - (1,140,078) - Transfer from surplus on revaluation on disposal to unappropriated
profit - net of tax - - - - (110,838) (13,897) 124,735 -
Transfer from surplus on revaluation of fixed assets to unappropriatedprofit - net of tax - - - - (25,774) - 25,774 -
Transactions with owners for the six months ended June 30, 2020Final cash dividend - December 31, 2019 declared subsequent to the
year end at Rs. 4.0 per share - - - - - - (4,896,719) (4,896,719)Interim cash dividend - March 31, 2020 declared at Rs.2.5 per share - - - - - - (3,060,449) (3,060,449)Balance as at June 30, 2020 (Un-audited) 12,241,797 28,915,229 34,315,803 2,559,170 25,017,081 16,254 72,768,934 175,834,268Total comprehensive income for the six months ended
December 31, 2020Profit after taxation for the six months ended December 31, 2020 - - - - - - 9,498,005 9,498,005Other comprehensive income - net of tax - (1,906,764) - 95,762 (720) (1) 552,357 (1,259,366)Total comprehensive income for the six months ended
December 31, 2020 - (1,906,764) - 95,762 (720) (1) 10,050,362 8,238,639Transfer from surplus on revaluation on disposal to unappropriated
profit - net of tax - - - - (5,508) (15,340) 20,848 - Transfer to statutory reserve - - 949,800 - - - (949,800) - Transfer from surplus on revaluation of fixed assets to unappropriated
profit - net of tax - - - - (26,119) - 26,119 - Transactions with owners for the six months ended December 31, 2020 - - - - - - - - Balance as at December 31, 2020 (Audited) 12,241,797 27,008,465 35,265,603 2,654,932 24,984,734 913 81,916,463 184,072,907Total comprehensive income for the six months ended June 30, 2021Profit after taxation for the six months ended June 30, 2021 - - - - - - 14,997,307 14,997,307Other comprehensive income - net of tax - (606,477) - (240,412) (237) 219 - (846,907)Total comprehensive income for the six months ended June 30, 2021 - (606,477) - (240,412) (237) 219 14,997,307 14,150,400Transfer from surplus on revaluation on disposal to unappropriated
profit - net of tax - - - - (2,641) - 2,641 - Transfer to statutory reserve - - 1,499,731 - - - (1,499,731) - Transfer from surplus on revaluation of fixed assets to unappropriated
profit - net of tax - - - - (22,524) - 22,524 - Transactions with owners for the half year ended June 30, 2021Final cash dividend - December 31, 2020 declared subsequent to the
year end at Rs.9.5 per share - - - - - - (11,629,707) (11,629,707)Interim cash dividend - March 31, 2021 declared at Rs.4.0 per share - - - - - - (4,896,719) (4,896,719)Balance as at June 30, 2021 (Un-audited) 12,241,797 26,401,988 36,765,334 2,414,520 24,959,332 1,132 78,912,778 181,696,881
The annexed notes from 1 to 41 form an integral part of these unconsolidated condensed interim financial statements.
Aameer Karachiwalla Shazad G. Dada Shazia Syed Arshad Ahmad Mir Sir Mohammed Anwar Pervez, OBE, HPk Chief Financial Officer President & Director Director Chairman Chief Executive Officer
----------------------------------------------------------------------------------------------------- (Rupees in '000) -----------------------------------------------------------------------------------------------------
Share Capital
Capital reserve - exchange translation
Statutory reserve
Surplus / (Deficit) on revaluationUnappro-
priated profit Total
Aameer KarachiwallaChief Financial Of�cer
Shazad G. DadaPresident &
Chief Executive Of�cer
Shazia Syed Director
Arshad Ahmad Mir Director
Sir Mohammed Anwar Pervez, OBE, HPkChairman
UNCONSOLIDATED CONDENSED INTERIM STATEMENT OF CHANGES IN EQUITY (UN-AUDITED)FOR THE SIX MONTHS ENDED JUNE 30, 2021

16 United Bank Limited
.
NOTES TO AND FORMING PART OF THE UNCONSOLIDATED CONDENSED INTERIM FINANCIAL STATEMENTS (UN-AUDITED)FOR THE SIX MONTHS ENDED JUNE 30, 2021
1. STATUS AND NATURE OF BUSINESS
The aforementioned transfer of shareholding did not have any effect on the ultimate beneficial ownership of the Bank.
2. BASIS OF PRESENTATION
2.1
2.2
2.3
3. STATEMENT OF COMPLIANCE
3.1
-
-
- Provisions of and directives issued under the Banking Companies Ordinance, 1962;- Provisions of and directives issued under the Companies Act, 2017; and-
United Bank Limited (the Bank) is a banking company incorporated in Pakistan and is engaged in commercial banking andrelated services. The Bank's registered office and principal office are situated at UBL Building, Jinnah Avenue, Blue Area,Islamabad and at UBL Head Office, I. I. Chundrigar Road, Karachi respectively. The Bank operates 1,348 (December 31,2020: 1,356) branches inside Pakistan including 100 (December 31, 2020: 100) Islamic Banking branches and 2(December 31, 2020: 2) branches in Export Processing Zones. The Bank also operates 13 (December 31, 2020: 14)branches outside Pakistan.
During the period, an internal reorganization exercise was undertaken by the Bestway Group by virtue of which Bestway(Holdings) Limited has transferred its entire shareholding of 51.6 percent in the Bank to a new Company “BestwayInternational Holdings Limited” (BIHL) on March 19, 2021. BIHL is a wholly owned subsidiary of the newly incorporatedBestway Group Limited (BGL). Both BIHL and BGL have been incorporated in Guernsey.
Key financial figures of the Islamic Banking branches are disclosed in note 38 to these unconsolidated condensed interimfinancial statements.
These unconsolidated condensed interim financial statements of the Bank have been prepared in accordance with theaccounting and reporting standards as applicable in Pakistan for interim financial reporting. The accounting and reportingstandards as applicable in Pakistan for interim financial reporting comprise of:
International Accounting Standard (IAS) 34, Interim Financial Reporting, issued by the International AccountingStandards Board (IASB) as notified under the Companies Act, 2017;
Islamic Financial Accounting Standards (IFAS) issued by the Institute of Chartered Accountants of Pakistan as arenotified under the Companies Act, 2017;
Directives issued by the State Bank of Pakistan (SBP) and the Securities and Exchange Commission of Pakistan(SECP).
Whenever the requirements of the Banking Companies Ordinance, 1962, the Companies Act, 2017 or the directives issuedby the SBP and the SECP differ with the requirements of IAS 34 or IFAS, the requirements of the Banking CompaniesOrdinance, 1962, the Companies Act, 2017 and the said directives prevail.
In accordance with the directives of the Federal Government regarding the shifting of the banking system to Islamic modes,SBP has issued various circulars from time to time. Permissible forms of trade-related modes of financing includespurchase of goods by banks from customers and immediate resale to them at appropriate mark-up in price on deferredpayment basis. The purchase and resale arising under these arrangements are not reflected in these unconsolidatedcondensed interim financial statements as such, but are restricted to the amount of facility actually utilized and theappropriate portion of mark - up thereon. However, the Islamic Banking branches of the Bank have complied with therequirements set out under the Islamic Financial Accounting Standards (IFAS), issued by the Institute of CharteredAccountants of Pakistan (ICAP) as are notified under the provisions of Companies Act, 2017.
The Bank was a subsidiary of Bestway (Holdings) Limited which is a wholly owned subsidiary of Bestway Group Limitedincorporated in United Kingdom.
The Bank's ordinary shares are listed on Pakistan Stock Exchange (PSX). Its Global Depository Receipts (GDRs) are onthe list of the UK Listing Authority and the London Stock Exchange Professional Securities Market. These GDRs are alsoeligible for trading on the International Order Book System of the London Stock Exchange. Further, the GDRs constitute anoffering in the United States only to qualified institutional buyers in reliance on Rule 144A under the US Securities Act of1933 and an offering outside the United States in reliance on Regulation S.
These unconsolidated condensed interim financial statements have been prepared in conformity with the format of interimfinancial statements prescribed by the State Bank of Pakistan (SBP) vide BPRD Circular No. 5 dated March 22, 2019.
6
UNCONSOLIDATED CONDENSED INTERIM CASH FLOW STATEMENT (UN-AUDITED)FOR THE SIX MONTHS ENDED JUNE 30, 2021
CASH FLOW FROM OPERATING ACTIVITIESProfit before taxation 25,850,298 18,804,758Less: Dividend income (881,158) (793,328)
24,969,140 18,011,430Adjustments: Depreciation on fixed assets 1,387,570 1,370,224 Depreciation on Islamic financing against leased assets (Ijarah) 84,917 124,174 Depreciation on right-of-use assets 924,501 977,682 Amortisation 380,843 383,908 Workers' Welfare Fund 517,178 499,275 Provision for retirement benefits 471,713 506,526 Provision for compensated absences 86,226 92,549 Provision against loans and advances - net 452,208 9,310,888 Reversal of provision for diminution in value of investments - net (714,640) (416,765) (Reversal) / provision against off balance sheet items (330,661) 214,965 Interest expense on lease liability against right-of-use assets 473,603 584,330 Gain on sale of operating fixed assets - net (4,721) (50,191) Gain on sale of ijarah assets - net (3,222) (548) Gain on sale of non-banking asset - (223,054) Bad debts written-off directly 20,382 38,618 Unrealized gain on revaluation of investments classified as held for trading (5,006) (14,504) Other provisions & write-offs 485,315 282,115
4,226,206 13,680,19229,195,346 31,691,622
(Increase) / Decrease in operating assets Lendings to financial institutions (1,775,193) 12,027,104 Held for trading securities (62,057,326) 62,512,826 Advances (27,536,716) 41,777,254 Other assets (excluding advance taxation) 3,847,752 2,562,798
(87,521,483) 118,879,982Increase in operating liabilities Bills payable 2,060,209 4,297,093 Borrowings 134,724,705 1,097,319 Deposits and other accounts 209,620,398 121,613,145 Other liabilities (excluding current taxation) 2,858,965 (13,089,564)
349,264,277 113,917,993290,938,140 264,489,597
Payments on account of staff retirement benefits (1,714,702) (1,218,999)Income taxes paid (5,006,930) (1,167,349)Net cash flow generated from operating activities 284,216,508 262,103,249
CASH FLOW FROM INVESTING ACTIVITIESNet investments in available for sale securities (209,399,726) (267,130,129)Net investments in held to maturity securities (56,825,708) 28,505,850Net investments in subsidiaries and associates (200,000) - Dividend income received 904,124 667,607Investment in fixed assets and intangible assets (1,844,447) (1,671,800)Sale proceeds from disposal of fixed assets 11,958 163,871Sale proceeds from disposal of ijarah assets 21,587 952Effect of translation of net investment in foreign branches (606,477) 2,771,342Net cash flow used in investing activities (267,938,689) (236,692,307)
CASH FLOW FROM FINANCING ACTIVITIESPayment of lease liability against right-of-use assets (1,195,507) (1,006,745)Dividends paid (13,853,720) (6,494,483)Net cash flow used in financing activities (15,049,227) (7,501,228)
Increase in cash and cash equivalents 1,228,592 17,909,714Cash and cash equivalents at the beginning of the period 264,726,817 256,590,772
Cash and cash equivalents at the end of the period 265,955,409 274,500,486
The annexed notes from 1 to 41 form an integral part of these unconsolidated condensed interim financial statements.
Aameer Karachiwalla Shazad G. Dada Shazia Syed Arshad Ahmad Mir Sir Mohammed Anwar Pervez, OBE, HPk Chief Financial Officer President & Director Director Chairman Chief Executive Officer
-------------- (Rupees in '000) --------------
January - June 2021
January - June 2020
Aameer KarachiwallaChief Financial Of�cer
Shazad G. DadaPresident &
Chief Executive Of�cer
Shazia Syed Director
Arshad Ahmad Mir Director
Sir Mohammed Anwar Pervez, OBE, HPkChairman
UNCONSOLIDATED CONDENSED INTERIM CASH FLOW STATEMENT (UN-AUDITED)FOR THE SIX MONTHS ENDED JUNE 30, 2021

17Half Yearly Report 2021
.
NOTES TO AND FORMING PART OF THE UNCONSOLIDATED CONDENSED INTERIM FINANCIAL STATEMENTS (UN-AUDITED)FOR THE SIX MONTHS ENDED JUNE 30, 2021
1. STATUS AND NATURE OF BUSINESS
The aforementioned transfer of shareholding did not have any effect on the ultimate beneficial ownership of the Bank.
2. BASIS OF PRESENTATION
2.1
2.2
2.3
3. STATEMENT OF COMPLIANCE
3.1
-
-
- Provisions of and directives issued under the Banking Companies Ordinance, 1962;- Provisions of and directives issued under the Companies Act, 2017; and-
United Bank Limited (the Bank) is a banking company incorporated in Pakistan and is engaged in commercial banking andrelated services. The Bank's registered office and principal office are situated at UBL Building, Jinnah Avenue, Blue Area,Islamabad and at UBL Head Office, I. I. Chundrigar Road, Karachi respectively. The Bank operates 1,348 (December 31,2020: 1,356) branches inside Pakistan including 100 (December 31, 2020: 100) Islamic Banking branches and 2(December 31, 2020: 2) branches in Export Processing Zones. The Bank also operates 13 (December 31, 2020: 14)branches outside Pakistan.
During the period, an internal reorganization exercise was undertaken by the Bestway Group by virtue of which Bestway(Holdings) Limited has transferred its entire shareholding of 51.6 percent in the Bank to a new Company “BestwayInternational Holdings Limited” (BIHL) on March 19, 2021. BIHL is a wholly owned subsidiary of the newly incorporatedBestway Group Limited (BGL). Both BIHL and BGL have been incorporated in Guernsey.
Key financial figures of the Islamic Banking branches are disclosed in note 38 to these unconsolidated condensed interimfinancial statements.
These unconsolidated condensed interim financial statements of the Bank have been prepared in accordance with theaccounting and reporting standards as applicable in Pakistan for interim financial reporting. The accounting and reportingstandards as applicable in Pakistan for interim financial reporting comprise of:
International Accounting Standard (IAS) 34, Interim Financial Reporting, issued by the International AccountingStandards Board (IASB) as notified under the Companies Act, 2017;
Islamic Financial Accounting Standards (IFAS) issued by the Institute of Chartered Accountants of Pakistan as arenotified under the Companies Act, 2017;
Directives issued by the State Bank of Pakistan (SBP) and the Securities and Exchange Commission of Pakistan(SECP).
Whenever the requirements of the Banking Companies Ordinance, 1962, the Companies Act, 2017 or the directives issuedby the SBP and the SECP differ with the requirements of IAS 34 or IFAS, the requirements of the Banking CompaniesOrdinance, 1962, the Companies Act, 2017 and the said directives prevail.
In accordance with the directives of the Federal Government regarding the shifting of the banking system to Islamic modes,SBP has issued various circulars from time to time. Permissible forms of trade-related modes of financing includespurchase of goods by banks from customers and immediate resale to them at appropriate mark-up in price on deferredpayment basis. The purchase and resale arising under these arrangements are not reflected in these unconsolidatedcondensed interim financial statements as such, but are restricted to the amount of facility actually utilized and theappropriate portion of mark - up thereon. However, the Islamic Banking branches of the Bank have complied with therequirements set out under the Islamic Financial Accounting Standards (IFAS), issued by the Institute of CharteredAccountants of Pakistan (ICAP) as are notified under the provisions of Companies Act, 2017.
The Bank was a subsidiary of Bestway (Holdings) Limited which is a wholly owned subsidiary of Bestway Group Limitedincorporated in United Kingdom.
The Bank's ordinary shares are listed on Pakistan Stock Exchange (PSX). Its Global Depository Receipts (GDRs) are onthe list of the UK Listing Authority and the London Stock Exchange Professional Securities Market. These GDRs are alsoeligible for trading on the International Order Book System of the London Stock Exchange. Further, the GDRs constitute anoffering in the United States only to qualified institutional buyers in reliance on Rule 144A under the US Securities Act of1933 and an offering outside the United States in reliance on Regulation S.
These unconsolidated condensed interim financial statements have been prepared in conformity with the format of interimfinancial statements prescribed by the State Bank of Pakistan (SBP) vide BPRD Circular No. 5 dated March 22, 2019.
6
NOTES TO AND FORMING PART OF THE UNCONSOLIDATED CONDENSED INTERIM FINANCIAL STATEMENTS (UN-AUDITED)FOR THE SIX MONTHS ENDED JUNE 30, 2021

18 United Bank Limited
.
NOTES TO AND FORMING PART OF THE UNCONSOLIDATED CONDENSED INTERIM FINANCIAL STATEMENTS (UN-AUDITED)FOR THE SIX MONTHS ENDED JUNE 30, 2021
3.2
3.3
3.4
3.5
3.6
3.7 Standards, interpretations of and amendments to accounting and reporting standards that are not yet effective
4. SIGNIFICANT ACCOUNTING POLICIES AND FINANCIAL RISK MANAGEMENT
4.1
4.2
5. BASIS OF MEASUREMENT
5.1
IFRS 9 has been applicable in several overseas jurisdictions from January 1, 2018. Accordingly, the requirements of thisstandard are incorporated in the Bank’s unconsolidated condensed interim financial statements for the jurisdictions whereIFRS 9 has been adopted. As per the SBP's BPRD Circular Letter no. 24 dated July 05, 2021, the implementation of IFRS9 to banks in Pakistan has been deferred to accounting periods beginning on or after January 1, 2022. Meanwhile, thebanks are required to submit IFRS 9 compatible pro forma financial statements for year ending December 31, 2021 andperform parallel run of IFRS 9 on quarterly basis. Further, the SBP will provide a timeline by December 2021 for absorptionof "Expected Credit Loss" (ECL), for Capital Adequacy Ratio (CAR) purposes, after assessment / evaluation of pro formafinancial statements.
These unconsolidated condensed interim financial statements represent the separate condensed interim financialstatements of the Bank. The consolidated condensed interim financial statements of the Bank and its subsidiary companiesare presented separately.
The SBP vide BSD Circular letter No. 10, dated August 26, 2002 has deferred the applicability of International AccountingStandard 39, Financial Instruments: Recognition and Measurement and International Accounting Standard 40, InvestmentProperty for banking companies till further instructions. Moreover, SBP vide BPRD circular no. 4, dated February 25, 2015has deferred the applicability of Islamic Financial Accounting Standards (IFAS) 3, Profit and Loss Sharing on Deposits.Further, according to the notification of the SECP issued vide SRO 411(I)/2008 dated April 28, 2008, International FinancialReporting Standard (IFRS) 7, Financial Instruments: Disclosures has not been made applicable for banks. Accordingly, therequirements of these standards have not been considered in the preparation of these unconsolidated condensed interimfinancial statements. However, investments have been classified and valued in accordance with the requirements ofvarious circulars issued by the SBP.
The disclosures made in these unconsolidated condensed interim financial statements have been limited based on aformat prescribed by the SBP vide BPRD Circular Letter No. 5 dated March 22, 2019 and IAS 34, Interim FinancialReporting. They do not include all the disclosures required for annual financial statements, and these unconsolidatedcondensed interim financial statements should be read in conjunction with the unconsolidated financial statements of theBank for the year ended December 31, 2020.
There are certain amendments to existing accounting and reporting standards that have become applicable to the Bank foraccounting periods beginning on or after January 1, 2021. These are either considered to not be relevant or do not haveany significant impact on these unconsolidated condensed interim financial statements.
Standards, interpretations of and amendments to accounting and reporting standards that are effective in thecurrent period
The SECP vide its notification SRO 633 (I)/2014 dated 10 July 2014, adopted IFRS 10 effective from the periods startingfrom June 30, 2014. However, vide its notification SRO 56 (I)/2016 dated January 28, 2016, it has been notified that therequirements of IFRS 10 and section 228 of the Companies Act, 2017 will not be applicable with respect to the investmentin mutual funds established under trust structure.
These unconsolidated condensed interim financial statements have been prepared under the historical cost conventionexcept that certain operating fixed assets / non-banking assets acquired in satisfaction of claims have been stated atrevalued amounts, certain investments and derivative financial instruments have been stated at fair value and netobligations in respect of defined benefit schemes are carried at their present values.
There are certain other new amendments that are mandatory for the Bank's accounting periods beginning on or afterJanuary 1, 2022, but are considered not to be relevant or will not have any significant effect on the Bank's operations andare, therefore, not detailed in these unconsolidated condensed interim financial statements.
The financial risk management objectives and policies adopted by the Bank are consistent with those disclosed in theunconsolidated financial statements for the year ended December 31, 2020.
The accounting policies adopted in the preparation of these unconsolidated condensed interim financial statements areconsistent with those applied in the preparation of the unconsolidated financial statements of the Bank for the year endedDecember 31, 2020.
7
NOTES TO AND FORMING PART OF THE UNCONSOLIDATED CONDENSED INTERIM FINANCIAL STATEMENTS (UN-AUDITED)FOR THE SIX MONTHS ENDED JUNE 30, 2021
19Half Yearly Report 2021
NOTES TO AND FORMING PART OF THE UNCONSOLIDATED CONDENSED INTERIM FINANCIAL STATEMENTS (UN-AUDITED)FOR THE SIX MONTHS ENDED JUNE 30, 2021
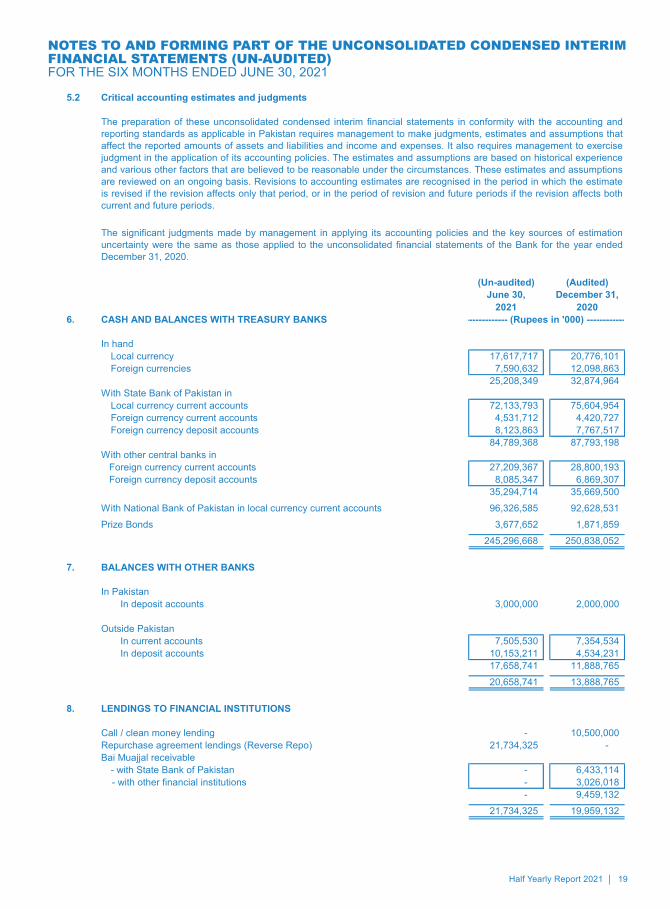
5.2 Critical accounting estimates and judgments
(Un-audited) (Audited)June 30,
2021December 31,
20206. CASH AND BALANCES WITH TREASURY BANKS
In handLocal currency 17,617,717 20,776,101Foreign currencies 7,590,632 12,098,863
25,208,349 32,874,964With State Bank of Pakistan in
Local currency current accounts 72,133,793 75,604,954Foreign currency current accounts 4,531,712 4,420,727Foreign currency deposit accounts 8,123,863 7,767,517
84,789,368 87,793,198With other central banks in Foreign currency current accounts 27,209,367 28,800,193 Foreign currency deposit accounts 8,085,347 6,869,307
35,294,714 35,669,500With National Bank of Pakistan in local currency current accounts 96,326,585 92,628,531Prize Bonds 3,677,652 1,871,859
245,296,668 250,838,052
7. BALANCES WITH OTHER BANKS
In PakistanIn deposit accounts 3,000,000 2,000,000
Outside PakistanIn current accounts 7,505,530 7,354,534 In deposit accounts 10,153,211 4,534,231
17,658,741 11,888,765 20,658,741 13,888,765
8. LENDINGS TO FINANCIAL INSTITUTIONS
Call / clean money lending - 10,500,000 Repurchase agreement lendings (Reverse Repo) 21,734,325 - Bai Muajjal receivable
- with State Bank of Pakistan - 6,433,114 - with other financial institutions - 3,026,018
- 9,459,132 21,734,325 19,959,132
The preparation of these unconsolidated condensed interim financial statements in conformity with the accounting andreporting standards as applicable in Pakistan requires management to make judgments, estimates and assumptions thataffect the reported amounts of assets and liabilities and income and expenses. It also requires management to exercisejudgment in the application of its accounting policies. The estimates and assumptions are based on historical experienceand various other factors that are believed to be reasonable under the circumstances. These estimates and assumptionsare reviewed on an ongoing basis. Revisions to accounting estimates are recognised in the period in which the estimateis revised if the revision affects only that period, or in the period of revision and future periods if the revision affects bothcurrent and future periods.
The significant judgments made by management in applying its accounting policies and the key sources of estimationuncertainty were the same as those applied to the unconsolidated financial statements of the Bank for the year endedDecember 31, 2020.
-------------- (Rupees in '000) --------------
8
NOTES TO AND FORMING PART OF THE UNCONSOLIDATED CONDENSED INTERIM FINANCIAL STATEMENTS (UN-AUDITED)FOR THE SIX MONTHS ENDED JUNE 30, 2021

20 United Bank Limited
NOTES TO AND FORMING PART OF THE UNCONSOLIDATED CONDENSED INTERIM FINANCIAL STATEMENTS (UN-AUDITED)FOR THE SIX MONTHS ENDED JUNE 30, 2021
9. INVESTMENTS
9.1 Investments by type
Held for trading securitiesMarket Treasury Bills 65,066,792 - 5,006 65,071,798 3,009,238 - 228 3,009,466
Available for sale securitiesMarket Treasury Bills 568,391,131 - 245,214 568,636,345 341,885,979 - 238,363 342,124,342Pakistan Investment Bonds - fixed 43,914,994 - (77,655) 43,837,339 76,334,054 - 333,950 76,668,004Pakistan Investment Bonds - floaters 365,457,101 - (1,286,525) 364,170,576 340,678,646 - (2,569,332) 338,109,314Government of Pakistan Eurobonds 23,564,640 (290,271) 881,753 24,156,122 24,216,628 (105,010) 1,126,146 25,237,764Government of Pakistan Sukuk 25,602,301 (2,332) 91,324 25,691,293 23,232,221 (8,713) (50,261) 23,173,247Government of Pakistan Mudarabah Pool 1,138,873 - - 1,138,873 466,435 - - 466,435Corporate Sukuks 1,220,000 - - 1,220,000 1,220,000 - - 1,220,000Ordinary shares of listed companies 13,918,677 (4,887,512) 3,294,757 12,325,922 13,345,156 (5,479,476) 2,517,580 10,383,260Preference shares 36,667 - - 36,667 36,667 - - 36,667Ordinary shares of unlisted companies 790,495 (52,989) 16 737,522 808,294 (134,392) 36 673,938Investment in REIT 458,590 - 834 459,424 458,590 - (16,676) 441,914Investment in Mutual Fund 250,000 - (28,115) 221,885 250,000 - (21,482) 228,518Term Finance Certificates 782,335 (161,996) - 620,339 662,335 (162,033) - 500,302Foreign bonds - sovereign 43,240,040 (571,385) 765,188 43,433,843 53,560,498 (909,881) 2,494,807 55,145,424Foreign bonds - others 2,159,398 (18,307) 71,438 2,212,529 4,494,088 (24,002) 299,217 4,769,303
1,090,925,242 (5,984,792) 3,958,229 1,088,898,679 881,649,591 (6,823,507) 4,352,348 879,178,432Held to maturity securitiesMarket Treasury Bills 2,302,818 - - 2,302,818 2,696,727 - - 2,696,727Pakistan Investment Bonds - fixed 164,631,960 - - 164,631,960 160,738,122 - - 160,738,122Pakistan Investment Bonds - floaters 42,574,919 - - 42,574,919 - - - - Government of Pakistan Eurobonds 9,343,334 (127,403) - 9,215,931 9,383,208 (45,483) - 9,337,725Government of Pakistan Sukuk 812,095 (3,823) - 808,272 824,745 (3,374) - 821,371Bai Muajjal with Government of Pakistan 38.2.1 31,115,551 - - 31,115,551 29,569,648 - - 29,569,648Term Finance Certificates 7,084,206 (69,951) - 7,014,255 4,516,483 (69,951) - 4,446,532Corporate Sukuks 11,429,759 (50,934) - 11,378,825 12,022,820 (57,846) - 11,964,974Participation Term Certificates 437 (437) - - 437 (437) - - Debentures 2,266 (2,266) - - 2,266 (2,266) - - Corporate Bond 1,059,404 (14,421) - 1,044,983 - - - - Foreign bonds - sovereign 26,921,077 (560,318) - 26,360,759 21,361,427 (628,582) - 20,732,845Foreign bonds - others 1,941,765 (17,816) - 1,923,949 1,261,784 (23,219) - 1,238,565CDC SAARC Fund 342 - - 342 347 - - 347
299,219,933 (847,369) - 298,372,564 242,378,014 (831,158) - 241,546,856Associates
UBL Financial Sector Fund 350,000 - - 350,000 150,000 - - 150,000UBL Insurers Limited 240,000 - - 240,000 240,000 - - 240,000Khushhali Bank Limited 9.4 832,485 - - 832,485 832,485 - - 832,485
1,422,485 - - 1,422,485 1,222,485 - - 1,222,485SubsidiariesUnited National Bank Limited (UBL UK) 2,855,223 - - 2,855,223 2,855,223 - - 2,855,223UBL (Switzerland) AG - - - - 589,837 - - 589,837UBL Fund Managers Limited 100,000 - - 100,000 100,000 - - 100,000United Executors and Trustees
Company Limited 9.6 30,100 - - 30,100 30,100 - - 30,1002,985,323 - - 2,985,323 3,575,160 - - 3,575,160
Discontinued operationsUBL Bank (Tanzania) Limited 9.7 1,831,006 (1,688,911) - 142,095 1,831,006 (1,688,911) - 142,095UBL (Switzerland) AG 9.8 589,837 - - 589,837 - - - - Total Investments 1,462,040,618 (8,521,072) 3,963,235 1,457,482,781 1,133,665,494 (9,343,576) 4,352,576 1,128,674,494
------------------------------------------------------------------------------------------- (Rupees in '000) -------------------------------------------------------------------------------------------
June 30, �2021 (Un-audited) December 31, 2020 (Audited)Cost /
Amortised cost
Provision for
diminution
Surplus / (Deficit)
Carrying Value
Cost / Amortised
cost
Provision for
diminution
Surplus / (Deficit)
Carrying ValueNote
9
NOTES TO AND FORMING PART OF THE UNCONSOLIDATED CONDENSED INTERIM FINANCIAL STATEMENTS (UN-AUDITED)FOR THE SIX MONTHS ENDED JUNE 30, 2021

21Half Yearly Report 2021
NOTES TO AND FORMING PART OF THE UNCONSOLIDATED CONDENSED INTERIM FINANCIAL STATEMENTS (UN-AUDITED)FOR THE SIX MONTHS ENDED JUNE 30, 2021
(Un-audited) (Audited)
Note June 30, 2021
December 31, 2020
9.1.1 Investments given as collateral - at market value
Market Treasury Bills 43,952,534 59,846,168 Pakistan Investment Bonds - fixed 2,081,906 - Pakistan Investment Bonds - floaters 120,696,000 -
166,730,440 59,846,168 9.2 Provision for diminution in value of investments
9.2.1 Opening balance 9,343,576 9,117,891 Exchange adjustments (26,480) 34,098
Charge / (reversals)Charge for the period / year 282,804 853,323 Reversals for the period / year (997,444) (511,772)
31 (714,640) 341,551 Amounts written off (81,384) (149,964) Closing balance 9.5 8,521,072 9,343,576
9.2.2 Particulars of provision against debt securities
Category of classification
DomesticLoss 285,584 285,584 292,496 292,496
9.3
9.4
9.5
9.6
9.7
9.8 The shareholders of the Bank have approved the decision to voluntarily and orderly wind up UBL (Switzerland) AG, awholly owned subsidiary of the Bank in the Extra Ordinary General Meeting (EOGM) of shareholders held on August 06,2021. This decision is in line with the Bank’s strategy to exit from non-core markets. The winding up is subject to fulfilmentof relevant legal and regulatory requirements both in Pakistan and Switzerland.
The shareholders of the Bank, in their annual general meeting held on March 27, 2020, resolved to wind up “UnitedExecutors and Trustees Company Limited”, a wholly owned subsidiary of the Bank. Accordingly, a special resolution waspassed on March 19, 2021 by the shareholders of “United Executors and Trustees Company Limited” to appointliquidators and voluntarily wind up the company. The liquidators will conclude the process of voluntary winding-up as perthe requirements of applicable laws and regulations.
UBL Bank (Tanzania) Limited ("UBTL") is a wholly owned subsidiary of United Bank Limited. UBTL sold materially all of itsassets and liabilities held as at October 31, 2019, including the loans and advances and deposit book to EXIM BankTanzania Limited ("Exim"), in line with the Asset and Liabilities Purchase Agreement signed on May 22, 2019. The controlof these assets and liabilities was transferred to Exim effective from November 1, 2019. The Banking operations of thesubsidiary ceased on November 1, 2019. UBTL is in process of winding up and voluntary liquidation.
(Audited)(Un-audited)
The market value of securities classified as held-to-maturity as at June 30, 2021 amounted to Rs. 301,982.991 million(December 31, 2020: Rs. 246,788.536 million).
This represents the Bank's subscription towards the paid-up capital of Khushhali Bank Limited. Pursuant to section 10 ofthe Khushhali Bank Ordinance, 2000, strategic investors including the Bank cannot sell or transfer their investment beforea period of five years that has expired on October 10, 2005. Thereafter, such sale / transfer would be subject to the priorapproval of the SBP. However, these shares are still appearing as frozen as no approval has been obtained by the Bankto unfreeze these shares.
Provision against investments includes expected credit loss under IFRS 9 amounting to Rs: 1,606.092 million (December31, 2020 Rs. 1,748.301 million) for overseas branches.
------- (Rupees in '000) -------
June 30, 2021 December 31, 2020
----------------------------- (Rupees in '000) -------------------------
Non performing investment (NPI) Provision
Non performing investment (NPI) Provision
10
NOTES TO AND FORMING PART OF THE UNCONSOLIDATED CONDENSED INTERIM FINANCIAL STATEMENTS (UN-AUDITED)FOR THE SIX MONTHS ENDED JUNE 30, 2021

22 United Bank Limited
NOTES TO AND FORMING PART OF THE UNCONSOLIDATED CONDENSED INTERIM FINANCIAL STATEMENTS (UN-AUDITED)FOR THE SIX MONTHS ENDED JUNE 30, 2021
10. ADVANCES
Note(Un-audited) (Audited) (Un-audited) (Audited) (Un-audited) (Audited)
June 30, 2021
December 31, 2020
June 30, 2021
December 31, 2020
June 30, 2021
December 31, 2020
Loans, cash credits, runningfinances, etc. 468,981,088 474,312,018 79,387,208 80,691,738 548,368,296 555,003,756
Islamic financings and relatedassets 38.3 43,489,775 20,542,257 95,273 107,478 43,585,048 20,649,735
Bills discounted and purchased 40,557,006 30,828,990 2,574,662 2,824,527 43,131,668 33,653,517Advances - gross 553,027,869 525,683,265 82,057,143 83,623,743 635,085,012 609,307,008
Provision against advances- Specific - - (71,166,060) (71,755,668) (71,166,060) (71,755,668)- General (6,678,612) (7,271,844) - - (6,678,612) (7,271,844)
10.3 (6,678,612) (7,271,844) (71,166,060) (71,755,668) (77,844,672) (79,027,512)
Advances - net of provision 546,349,257 518,411,421 10,891,083 11,868,075 557,240,340 530,279,496
(Un-audited) (Audited)June 30,
2021December 31, 2020
10.1 Particulars of advances - gross
In local currency 472,628,812 453,024,198In foreign currencies 162,456,200 156,282,810
635,085,012 609,307,008
10.2
DomesticOther Assets Especially Mentioned* 153,143 527 189,538 497Substandard 2,525,259 624,336 2,690,171 662,589Doubtful 685,672 341,615 1,599,695 798,209Loss 24,398,551 23,318,137 24,259,582 23,164,558
27,762,625 24,284,615 28,738,986 24,625,853Overseas Not past due but impaired** 4,090,173 1,993,065 5,820,717 2,681,378Overdue by:
Upto 90 days 3,250,055 1,670,741 1,064,806 135,44391 to 180 days 1,806,307 819,681 5,232,868 4,695,361181 to 365 days 511,681 511,694 6,841,381 6,407,521˃ 365 days 44,636,302 41,886,264 35,924,985 33,210,112
54,294,518 46,881,445 54,884,757 47,129,815
Total 82,057,143 71,166,060 83,623,743 71,755,668
* The other assets especially mentioned category pertains to agricultural finance and advances to small enterprises.** Not past due but impaired category mainly represents restructured exposure.
Category of Classification Non-Performing
LoansProvision
Non-Performing
LoansProvision
June 30, 2021 December 31, 2020
--------------------------------------------------------------------------- (Rupees in '000) ---------------------------------------------------------------------------
------- (Rupees in '000) -------
(Un-audited) (Audited)
Total
---------------------------------------------- (Rupees in '000) --------------------------------------------------------
Performing Non-performing
Advances include Rs. 82,057.143 million (December 31, 2020: Rs. 83,623.743 million) which have been placed under non-performing status as detailed below:
11
NOTES TO AND FORMING PART OF THE UNCONSOLIDATED CONDENSED INTERIM FINANCIAL STATEMENTS (UN-AUDITED)FOR THE SIX MONTHS ENDED JUNE 30, 2021
23Half Yearly Report 2021
NOTES TO AND FORMING PART OF THE UNCONSOLIDATED CONDENSED INTERIM FINANCIAL STATEMENTS (UN-AUDITED)FOR THE SIX MONTHS ENDED JUNE 30, 2021
10. ADVANCES
Note(Un-audited) (Audited) (Un-audited) (Audited) (Un-audited) (Audited)
June 30, 2021
December 31, 2020
June 30, 2021
December 31, 2020
June 30, 2021
December 31, 2020
Loans, cash credits, runningfinances, etc. 468,981,088 474,312,018 79,387,208 80,691,738 548,368,296 555,003,756
Islamic financings and relatedassets 38.3 43,489,775 20,542,257 95,273 107,478 43,585,048 20,649,735
Bills discounted and purchased 40,557,006 30,828,990 2,574,662 2,824,527 43,131,668 33,653,517Advances - gross 553,027,869 525,683,265 82,057,143 83,623,743 635,085,012 609,307,008
Provision against advances- Specific - - (71,166,060) (71,755,668) (71,166,060) (71,755,668)- General (6,678,612) (7,271,844) - - (6,678,612) (7,271,844)
10.3 (6,678,612) (7,271,844) (71,166,060) (71,755,668) (77,844,672) (79,027,512)
Advances - net of provision 546,349,257 518,411,421 10,891,083 11,868,075 557,240,340 530,279,496
(Un-audited) (Audited)June 30,
2021December 31, 2020
10.1 Particulars of advances - gross
In local currency 472,628,812 453,024,198In foreign currencies 162,456,200 156,282,810
635,085,012 609,307,008
10.2
DomesticOther Assets Especially Mentioned* 153,143 527 189,538 497Substandard 2,525,259 624,336 2,690,171 662,589Doubtful 685,672 341,615 1,599,695 798,209Loss 24,398,551 23,318,137 24,259,582 23,164,558
27,762,625 24,284,615 28,738,986 24,625,853Overseas Not past due but impaired** 4,090,173 1,993,065 5,820,717 2,681,378Overdue by:
Upto 90 days 3,250,055 1,670,741 1,064,806 135,44391 to 180 days 1,806,307 819,681 5,232,868 4,695,361181 to 365 days 511,681 511,694 6,841,381 6,407,521˃ 365 days 44,636,302 41,886,264 35,924,985 33,210,112
54,294,518 46,881,445 54,884,757 47,129,815
Total 82,057,143 71,166,060 83,623,743 71,755,668
* The other assets especially mentioned category pertains to agricultural finance and advances to small enterprises.** Not past due but impaired category mainly represents restructured exposure.
Category of Classification Non-Performing
LoansProvision
Non-Performing
LoansProvision
June 30, 2021 December 31, 2020
--------------------------------------------------------------------------- (Rupees in '000) ---------------------------------------------------------------------------
------- (Rupees in '000) -------
(Un-audited) (Audited)
Total
---------------------------------------------- (Rupees in '000) --------------------------------------------------------
Performing Non-performing
Advances include Rs. 82,057.143 million (December 31, 2020: Rs. 83,623.743 million) which have been placed under non-performing status as detailed below:
11
NOTES TO AND FORMING PART OF THE UNCONSOLIDATED CONDENSED INTERIM FINANCIAL STATEMENTS (UN-AUDITED)FOR THE SIX MONTHS ENDED JUNE 30, 2021
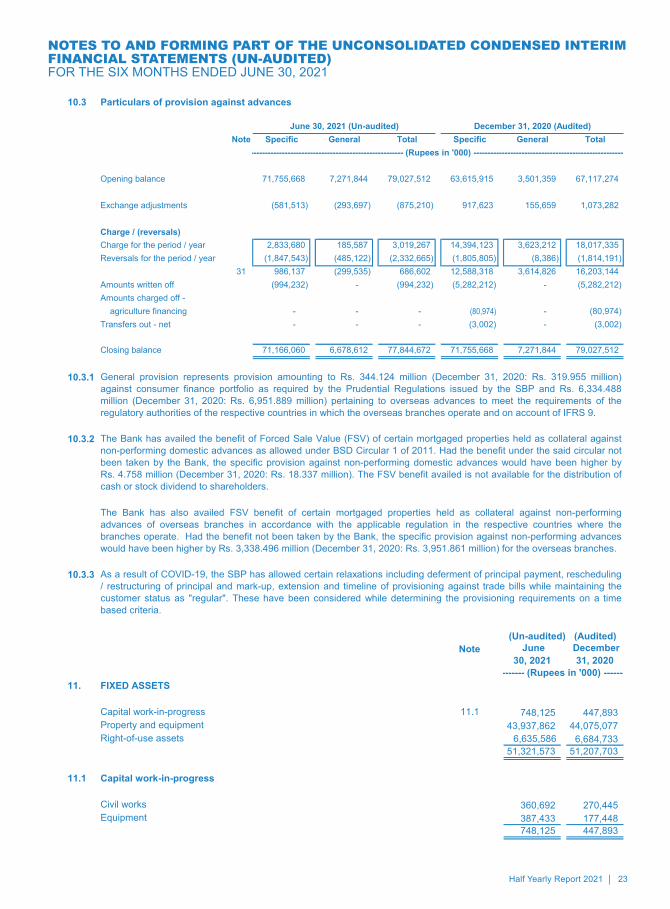
10.3 Particulars of provision against advances
Note Specific General Total Specific General Total
Opening balance 71,755,668 7,271,844 79,027,512 63,615,915 3,501,359 67,117,274
Exchange adjustments (581,513) (293,697) (875,210) 917,623 155,659 1,073,282
Charge / (reversals)Charge for the period / year 2,833,680 185,587 3,019,267 14,394,123 3,623,212 18,017,335 Reversals for the period / year (1,847,543) (485,122) (2,332,665) (1,805,805) (8,386) (1,814,191)
31 986,137 (299,535) 686,602 12,588,318 3,614,826 16,203,144 Amounts written off (994,232) - (994,232) (5,282,212) - (5,282,212) Amounts charged off -
agriculture financing - - - (80,974) - (80,974) Transfers out - net - - - (3,002) - (3,002)
Closing balance 71,166,060 6,678,612 77,844,672 71,755,668 7,271,844 79,027,512
10.3.1
10.3.2
10.3.3
(Un-audited) (Audited)
11. FIXED ASSETS
Capital work-in-progress 11.1 748,125 447,893Property and equipment 43,937,862 44,075,077Right-of-use assets 6,635,586 6,684,733
51,321,573 51,207,703
11.1 Capital work-in-progress
Civil works 360,692 270,445Equipment 387,433 177,448
748,125 447,893
June 30, 2021 (Un-audited) December 31, 2020 (Audited)
--------------------------------------------------------------------------- (Rupees in '000) ---------------------------------------------------------------------------
General provision represents provision amounting to Rs. 344.124 million (December 31, 2020: Rs. 319.955 million)against consumer finance portfolio as required by the Prudential Regulations issued by the SBP and Rs. 6,334.488million (December 31, 2020: Rs. 6,951.889 million) pertaining to overseas advances to meet the requirements of theregulatory authorities of the respective countries in which the overseas branches operate and on account of IFRS 9.
------- (Rupees in '000) -------
The Bank has availed the benefit of Forced Sale Value (FSV) of certain mortgaged properties held as collateral againstnon-performing domestic advances as allowed under BSD Circular 1 of 2011. Had the benefit under the said circular notbeen taken by the Bank, the specific provision against non-performing domestic advances would have been higher byRs. 4.758 million (December 31, 2020: Rs. 18.337 million). The FSV benefit availed is not available for the distribution ofcash or stock dividend to shareholders.
December 31, 2020
June 30, 2021
The Bank has also availed FSV benefit of certain mortgaged properties held as collateral against non-performingadvances of overseas branches in accordance with the applicable regulation in the respective countries where thebranches operate. Had the benefit not been taken by the Bank, the specific provision against non-performing advanceswould have been higher by Rs. 3,338.496 million (December 31, 2020: Rs. 3,951.861 million) for the overseas branches.
As a result of COVID-19, the SBP has allowed certain relaxations including deferment of principal payment, rescheduling/ restructuring of principal and mark-up, extension and timeline of provisioning against trade bills while maintaining thecustomer status as "regular". These have been considered while determining the provisioning requirements on a timebased criteria.
12
Note
NOTES TO AND FORMING PART OF THE UNCONSOLIDATED CONDENSED INTERIM FINANCIAL STATEMENTS (UN-AUDITED)FOR THE SIX MONTHS ENDED JUNE 30, 2021
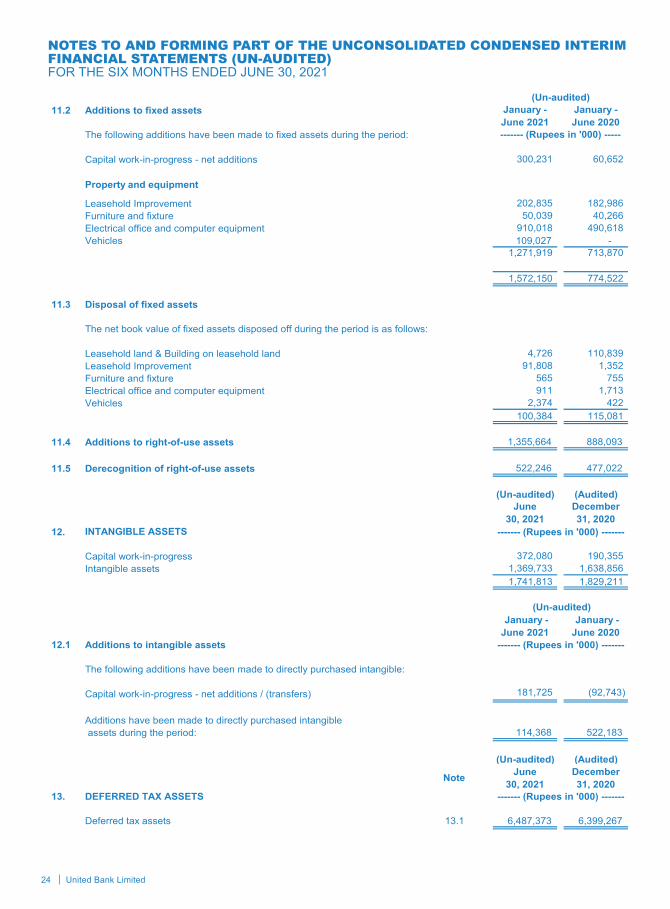
24 United Bank Limited
NOTES TO AND FORMING PART OF THE UNCONSOLIDATED CONDENSED INTERIM FINANCIAL STATEMENTS (UN-AUDITED)FOR THE SIX MONTHS ENDED JUNE 30, 2021
11.2 Additions to fixed assets
The following additions have been made to fixed assets during the period:
Capital work-in-progress - net additions 300,231 60,652
Property and equipment
Leasehold Improvement 202,835 182,986 Furniture and fixture 50,039 40,266 Electrical office and computer equipment 910,018 490,618 Vehicles 109,027 -
1,271,919 713,870
1,572,150 774,522
11.3 Disposal of fixed assets
The net book value of fixed assets disposed off during the period is as follows:
Leasehold land & Building on leasehold land 4,726 110,839 Leasehold Improvement 91,808 1,352 Furniture and fixture 565 755 Electrical office and computer equipment 911 1,713 Vehicles 2,374 422
100,384 115,081
11.4 Additions to right-of-use assets 1,355,664 888,093
11.5 Derecognition of right-of-use assets 522,246 477,022
(Un-audited) (Audited)June
30, 2021December 31, 2020
12. INTANGIBLE ASSETS
Capital work-in-progress 372,080 190,355 Intangible assets 1,369,733 1,638,856
1,741,813 1,829,211
January - June 2021
January - June 2020
12.1 Additions to intangible assets
The following additions have been made to directly purchased intangible:
Capital work-in-progress - net additions / (transfers) 181,725 (92,743)
Additions have been made to directly purchased intangible assets during the period: 114,368 522,183
(Un-audited) (Audited)
Note June 30, 2021
December 31, 2020
13. DEFERRED TAX ASSETS
Deferred tax assets 13.1 6,487,373 6,399,267
(Un-audited)January - June 2021
January - June 2020
------- (Rupees in '000) -----
------- (Rupees in '000) -------
(Un-audited)
------- (Rupees in '000) -------
------- (Rupees in '000) -------
13
NOTES TO AND FORMING PART OF THE UNCONSOLIDATED CONDENSED INTERIM FINANCIAL STATEMENTS (UN-AUDITED)FOR THE SIX MONTHS ENDED JUNE 30, 2021
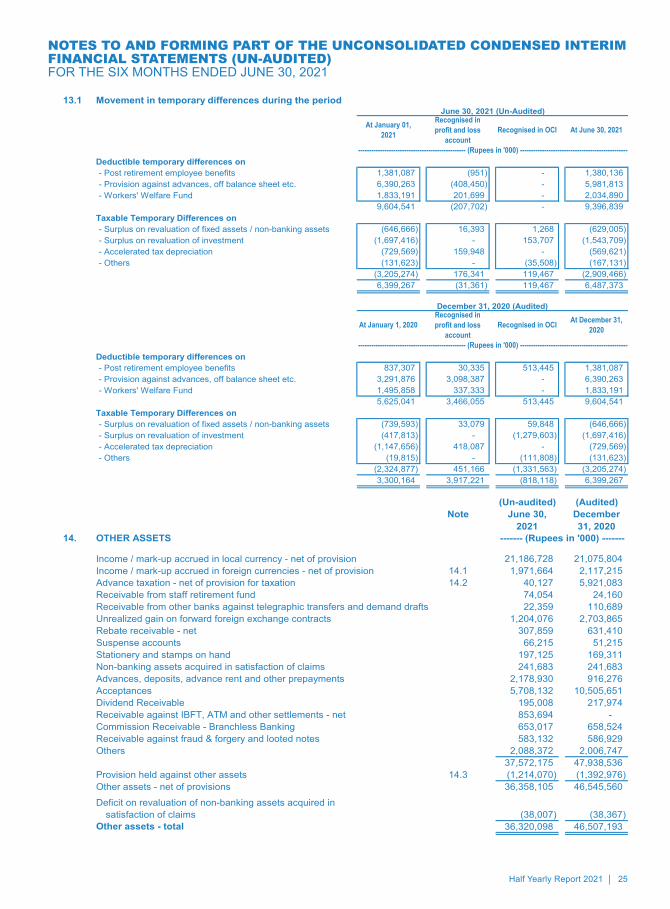
25Half Yearly Report 2021
NOTES TO AND FORMING PART OF THE UNCONSOLIDATED CONDENSED INTERIM FINANCIAL STATEMENTS (UN-AUDITED)FOR THE SIX MONTHS ENDED JUNE 30, 2021
13.1 Movement in temporary differences during the period
Deductible temporary differences on- Post retirement employee benefits 1,381,087 (951) - 1,380,136 - Provision against advances, off balance sheet etc. 6,390,263 (408,450) - 5,981,813 - Workers' Welfare Fund 1,833,191 201,699 - 2,034,890
9,604,541 (207,702) - 9,396,839 Taxable Temporary Differences on- Surplus on revaluation of fixed assets / non-banking assets (646,666) 16,393 1,268 (629,005) - Surplus on revaluation of investment (1,697,416) - 153,707 (1,543,709) - Accelerated tax depreciation (729,569) 159,948 - (569,621) - Others (131,623) - (35,508) (167,131)
(3,205,274) 176,341 119,467 (2,909,466) 6,399,267 (31,361) 119,467 6,487,373
Deductible temporary differences on- Post retirement employee benefits 837,307 30,335 513,445 1,381,087 - Provision against advances, off balance sheet etc. 3,291,876 3,098,387 - 6,390,263 - Workers' Welfare Fund 1,495,858 337,333 - 1,833,191
5,625,041 3,466,055 513,445 9,604,541 Taxable Temporary Differences on- Surplus on revaluation of fixed assets / non-banking assets (739,593) 33,079 59,848 (646,666) - Surplus on revaluation of investment (417,813) - (1,279,603) (1,697,416) - Accelerated tax depreciation (1,147,656) 418,087 - (729,569) - Others (19,815) - (111,808) (131,623)
(2,324,877) 451,166 (1,331,563) (3,205,274) 3,300,164 3,917,221 (818,118) 6,399,267
(Un-audited) (Audited)Note
14. OTHER ASSETS
Income / mark-up accrued in local currency - net of provision 21,186,728 21,075,804Income / mark-up accrued in foreign currencies - net of provision 14.1 1,971,664 2,117,215Advance taxation - net of provision for taxation 14.2 40,127 5,921,083Receivable from staff retirement fund 74,054 24,160Receivable from other banks against telegraphic transfers and demand drafts 22,359 110,689Unrealized gain on forward foreign exchange contracts 1,204,076 2,703,865Rebate receivable - net 307,859 631,410Suspense accounts 66,215 51,215Stationery and stamps on hand 197,125 169,311Non-banking assets acquired in satisfaction of claims 241,683 241,683Advances, deposits, advance rent and other prepayments 2,178,930 916,276Acceptances 5,708,132 10,505,651Dividend Receivable 195,008 217,974Receivable against IBFT, ATM and other settlements - net 853,694 - Commission Receivable - Branchless Banking 653,017 658,524Receivable against fraud & forgery and looted notes 583,132 586,929Others 2,088,372 2,006,747
37,572,175 47,938,536Provision held against other assets 14.3 (1,214,070) (1,392,976)Other assets - net of provisions 36,358,105 46,545,560Deficit on revaluation of non-banking assets acquired in
satisfaction of claims (38,007) (38,367)Other assets - total 36,320,098 46,507,193
------- (Rupees in '000) -------
December 31, 2020
June 30, 2021
Recognised in profit and loss
accountAt January 1, 2020
------------------------------------------------- (Rupees in '000) -------------------------------------------------
Recognised in OCI At December 31, 2020
June 30, 2021 (Un-Audited)
December 31, 2020 (Audited)
------------------------------------------------- (Rupees in '000) -------------------------------------------------
At January 01, 2021
Recognised in profit and loss
accountRecognised in OCI At June 30, 2021
14
NOTES TO AND FORMING PART OF THE UNCONSOLIDATED CONDENSED INTERIM FINANCIAL STATEMENTS (UN-AUDITED)FOR THE SIX MONTHS ENDED JUNE 30, 2021

26 United Bank Limited
NOTES TO AND FORMING PART OF THE UNCONSOLIDATED CONDENSED INTERIM FINANCIAL STATEMENTS (UN-AUDITED)FOR THE SIX MONTHS ENDED JUNE 30, 2021
14.1
14.2
(Un-audited) (Audited)Note
14.3 Provision held against other assets
Advances and other receivables 54,108 84,272 Fraud & forgery and looted notes 604,364 626,435 Others 555,598 682,269
1,214,070 1,392,976 14.3.1 Movement of provision held against other assets
Opening balance 1,392,976 1,271,877 Exchange adjustments (11,571) 655
Charge / (reversals)Charge for the period / year 26,768 249,664 Reversals for the period / year (125,306) (94,809)
31 (98,538) 154,855 Amounts written off (30,184) (37,656) Transfers (out) / in - net (38,613) 3,245 Closing balance 1,214,070 1,392,976
15. CONTINGENT ASSETS
There were no contingent assets as at the statement of financial position date.
The income tax authorities have issued amended assessment orders for the tax years 2003 to 2020, and created additional tax demands (including disallowances of provisions made prior to Seventh Schedule) of Rs.13,752 million (December 31,2020: Rs.11,610 million). The Bank has filed appeals before the various appellate forums against these amendments.Where the appellate authorities have allowed relief on certain issues, the assessing authorities have filed appeals beforehigher appellate forums. Where the appellate authorities have not allowed relief the Bank has filed appeals before higherappellate forums. The management of the Bank is confident that the appeals will be decided in favor of the Bank.
The Income Tax returns of the Bank have been filed up to the tax year 2020 (accounting year ended December 31, 2019)and were deemed to be assessed under section 120 of the Income Tax Ordinance, 2001 (Ordinance).
This includes unrealised mark-up held in suspense amounting to Rs. 14,852.074 million (December 31, 2020: Rs.13,639.898 million) kept against non-performing overseas advances / investment as per the requirements of the regulatoryauthorities of the respective countries in which the overseas branches operate.
The tax returns for Azad Kashmir (AK) and Gilgit Baltistan (GB) Branches have been filed upto the tax year 2020 (financialyear 2019) under the provisions of section 120(1) read with section 114 of the Ordinance and in compliance with the termsof the agreement between banks and the Azad Kashmir Council in May 2005. The returns filed are considered as deemedassessment orders under the law.
--------------------------------- (Rupees in '000) ---------------------------------
The Bank has received corrective tax assessment of QAR 1 M (Rs: 42.551 million) from the General tax Authority (GTA) inrespect of tax year 2004 with no supporting calculations from GTA. Management has requested details for 2004assessment from GTA, however to date no response has been received. Management is confident that the matters will bedecided in favour of the Bank and the possibility of any outcome against it is remote.
The tax returns for Yemen have been filed upto the year ended December 31, 2019 and for UAE and Qatar branches uptothe year ended December 31, 2020 under the provisions of the laws prevailing in the respective countries, and are deemedas assessed unless opened for reassessment.
The tax authorities have also carried out monitoring for Federal Excise Duty, Sales tax and withholding taxes coveringperiod from years ended 2005 to 2019. Consequently various addbacks and demands were raised creating a total demandof Rs. 2,467 million (December 31, 2020: Rs. 1,274 million). The Bank has filed appeals against all such demands and isconfident that these would be decided in the favor of the Bank.
June 30, 2021
December 31, 2020
15
NOTES TO AND FORMING PART OF THE UNCONSOLIDATED CONDENSED INTERIM FINANCIAL STATEMENTS (UN-AUDITED)FOR THE SIX MONTHS ENDED JUNE 30, 2021

27Half Yearly Report 2021
NOTES TO AND FORMING PART OF THE UNCONSOLIDATED CONDENSED INTERIM FINANCIAL STATEMENTS (UN-AUDITED)FOR THE SIX MONTHS ENDED JUNE 30, 2021
(Un-audited) (Audited)
16. BILLS PAYABLE
In Pakistan 30,886,817 28,820,012 Outside Pakistan 907,205 913,801
31,794,022 29,733,813
17. BORROWINGS
SecuredBorrowings from the State Bank of Pakistan under:
Export refinance scheme 33,443,583 30,724,174 Long term financing facility 21,272,946 22,243,644 Refinance scheme for payment of wages and salaries 4,611,535 5,587,037 Renewable energy scheme 239,851 146,985 Temporary economic refinance scheme 3,996,989 307,540 Other Borrowings 453,092 464,621
64,017,996 59,474,001 Repurchase agreement borrowings 172,698,967 59,835,819
236,716,963 119,309,820 Unsecured Call borrowings 25,290,923 2,397,485 Overdrawn nostro accounts 837,744 356,029 Money market deals 866,490 6,924,081
26,995,157 9,677,595
263,712,120 128,987,415
18. DEPOSITS AND OTHER ACCOUNTS
In Local Currency
In Foreign Currencies Total In Local
CurrencyIn Foreign Currencies Total
CustomersFixed deposits 165,704,035 118,301,677 284,005,712 171,340,589 123,785,587 295,126,176Savings deposits 612,040,337 47,619,222 659,659,559 509,712,356 48,079,084 557,791,440Sundry deposits 24,630,724 1,128,624 25,759,348 5,022,037 1,750,251 6,772,288Margin deposits 3,891,316 1,885,453 5,776,769 3,833,926 3,164,625 6,998,551Current accounts - remunerative 1,978,906 3,161,803 5,140,709 1,387,144 5,240,221 6,627,365Current accounts - non-remunerative 629,793,467 113,133,250 742,926,717 549,419,858 111,464,961 660,884,819
1,438,038,785 285,230,029 1,723,268,814 1,240,715,910 293,484,729 1,534,200,639Financial InstitutionsCurrent deposits 22,475,062 1,490,512 23,965,574 20,978,533 1,941,161 22,919,694Savings deposits 59,944,811 263,591 60,208,402 56,409,524 42,544 56,452,068Term deposits 40,850,400 1,539,109 42,389,509 25,207,956 1,431,544 26,639,500
123,270,273 3,293,212 126,563,485 102,596,013 3,415,249 106,011,262
1,561,309,058 288,523,241 1,849,832,299 1,343,311,923 296,899,978 1,640,211,901
18.1
June 30, 2021
December 31, 2020
--------------------------------- (Rupees in '000) ---------------------------------
June 30, 2021 (Un-audited) December 31, �2020 (Audited)
--------------------------------------------------------------------------------- (Rupees in '000) --------------------------------------------------------------------------------
Deposits eligible to be covered under insurance arrangements in accordance with DPC Circular No. 04 dated June 22,2018 amounted to Rs.1,048,412.550 million (December 31, 2020: Rs 991,687.959 million).
16
NOTES TO AND FORMING PART OF THE UNCONSOLIDATED CONDENSED INTERIM FINANCIAL STATEMENTS (UN-AUDITED)FOR THE SIX MONTHS ENDED JUNE 30, 2021
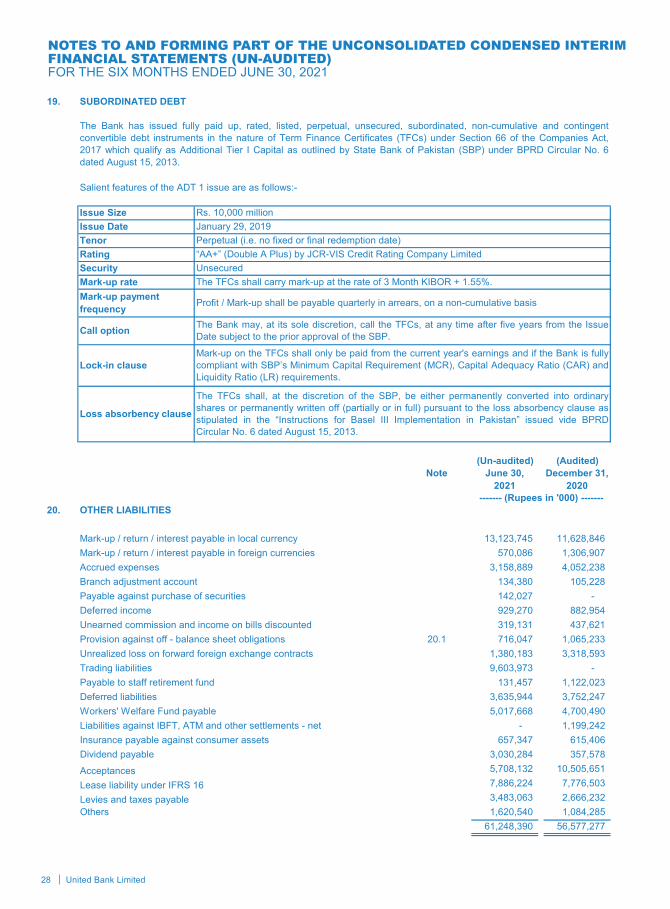
28 United Bank Limited
NOTES TO AND FORMING PART OF THE UNCONSOLIDATED CONDENSED INTERIM FINANCIAL STATEMENTS (UN-AUDITED)FOR THE SIX MONTHS ENDED JUNE 30, 2021
19. SUBORDINATED DEBT
Salient features of the ADT 1 issue are as follows:-
(Un-audited) (Audited)Note
20. OTHER LIABILITIES
Mark-up / return / interest payable in local currency 13,123,745 11,628,846 Mark-up / return / interest payable in foreign currencies 570,086 1,306,907 Accrued expenses 3,158,889 4,052,238 Branch adjustment account 134,380 105,228 Payable against purchase of securities 142,027 - Deferred income 929,270 882,954 Unearned commission and income on bills discounted 319,131 437,621 Provision against off - balance sheet obligations 20.1 716,047 1,065,233 Unrealized loss on forward foreign exchange contracts 1,380,183 3,318,593 Trading liabilities 9,603,973 - Payable to staff retirement fund 131,457 1,122,023 Deferred liabilities 3,635,944 3,752,247 Workers' Welfare Fund payable 5,017,668 4,700,490 Liabilities against IBFT, ATM and other settlements - net - 1,199,242 Insurance payable against consumer assets 657,347 615,406 Dividend payable 3,030,284 357,578
Acceptances 5,708,132 10,505,651
Lease liability under IFRS 16 7,886,224 7,776,503 Levies and taxes payable 3,483,063 2,666,232 Others 1,620,540 1,084,285
61,248,390 56,577,277
Mark-up payment frequency Profit / Mark-up shall be payable quarterly in arrears, on a non-cumulative basis
RatingTenor
The Bank has issued fully paid up, rated, listed, perpetual, unsecured, subordinated, non-cumulative and contingentconvertible debt instruments in the nature of Term Finance Certificates (TFCs) under Section 66 of the Companies Act,2017 which qualify as Additional Tier I Capital as outlined by State Bank of Pakistan (SBP) under BPRD Circular No. 6dated August 15, 2013.
“AA+” (Double A Plus) by JCR-VIS Credit Rating Company LimitedPerpetual (i.e. no fixed or final redemption date)
Rs. 10,000 millionIssue SizeIssue Date January 29, 2019
Unsecured
------- (Rupees in '000) -------
December 31, 2020
June 30, 2021
Mark-up rate The TFCs shall carry mark-up at the rate of 3 Month KIBOR + 1.55%.
Loss absorbency clause
Lock-in clause
Call option The Bank may, at its sole discretion, call the TFCs, at any time after five years from the IssueDate subject to the prior approval of the SBP.
Mark-up on the TFCs shall only be paid from the current year's earnings and if the Bank is fullycompliant with SBP’s Minimum Capital Requirement (MCR), Capital Adequacy Ratio (CAR) andLiquidity Ratio (LR) requirements.
The TFCs shall, at the discretion of the SBP, be either permanently converted into ordinaryshares or permanently written off (partially or in full) pursuant to the loss absorbency clause asstipulated in the “Instructions for Basel III Implementation in Pakistan” issued vide BPRDCircular No. 6 dated August 15, 2013.
Security
17
NOTES TO AND FORMING PART OF THE UNCONSOLIDATED CONDENSED INTERIM FINANCIAL STATEMENTS (UN-AUDITED)FOR THE SIX MONTHS ENDED JUNE 30, 2021

29Half Yearly Report 2021
NOTES TO AND FORMING PART OF THE UNCONSOLIDATED CONDENSED INTERIM FINANCIAL STATEMENTS (UN-AUDITED)FOR THE SIX MONTHS ENDED JUNE 30, 2021
(Un-audited) (Audited)Note
20.1 Provision against off-balance sheet obligations
Opening balance 1,065,233 622,264 Exchange adjustment (18,525) 11,220
Charge / (reversals)Charge for the period / year 5,266 568,987 Reversals for the period / year (335,927) (137,238)
31 (330,661) 431,749
Closing balance 716,047 1,065,233
21. SURPLUS ON REVALUATION OF ASSETS
Surplus arising on revaluation of assets
Available for sale securities 9.1 3,958,229 4,352,348 Fixed assets 25,587,613 25,630,817 Non-banking assets acquired in satisfaction of claims 1,856 1,496
29,547,698 29,984,661 Less: Deferred tax liability on revaluation of:
Available for sale securities 1,543,709 1,697,416 Fixed assets 628,281 646,083 Non-banking assets acquired in satisfaction of claims 724 583
2,172,714 2,344,082
27,374,984 27,640,579
22. CONTINGENCIES AND COMMITMENTS
Guarantees 22.1 144,360,746 147,936,161 Commitments 22.2 930,927,752 891,767,423 Other contingent liabilities 22.3 15,872,321 15,539,628
1,091,160,819 1,055,243,212
22.1 Guarantees:
Financial guarantees 43,401,076 43,027,825 Performance guarantees 100,959,670 104,908,336
144,360,746 147,936,161 22.2 Commitments:
Documentary credits and short-term trade-related transactions- letters of credit 196,084,599 137,787,140
Commitments in respect of:- forward foreign exchange contracts 22.2.2 618,694,809 635,597,333 - forward Government securities transactions 22.2.3 707,328 - - derivatives - FX options 22.2.4 2,338,968 - - forward lending 22.2.5 109,818,687 115,451,442- operating leases 22.2.6 151,022 55,009
Commitments for acquisition of operating fixed assets 22.2.7- Fixed assets 2,230,323 2,038,561
- Intangible 902,016 837,938 930,927,752 891,767,423
June 30, 2021
December 31, 2020
------- (Rupees in '000) -------
18
NOTES TO AND FORMING PART OF THE UNCONSOLIDATED CONDENSED INTERIM FINANCIAL STATEMENTS (UN-AUDITED)FOR THE SIX MONTHS ENDED JUNE 30, 2021

30 United Bank Limited
NOTES TO AND FORMING PART OF THE UNCONSOLIDATED CONDENSED INTERIM FINANCIAL STATEMENTS (UN-AUDITED)FOR THE SIX MONTHS ENDED JUNE 30, 2021
22.2.1 Commitments to extend credit
(Un-audited) (Audited)Note
22.2.2 Commitments in respect of forward foreign exchange contracts
Purchase 338,686,761 342,792,602
Sale 280,008,048 292,804,731
22.2.3 Commitments in respect of forward government securities transactions
Purchase 707,328 -
Sale - -
22.2.4 Commitments in respect of derivatives
FX options - purchased 1,169,484 -
FX options - sold 1,169,484 -
22.2.5 Commitments in respect of forward lending
Undrawn formal standby facilities, credit lines and other commitments to lend 22.2.5.1 60,644,632 57,591,623
Others 49,174,055 57,859,819 109,818,687 115,451,442
22.2.5.1
(Un-audited) (Audited)
22.2.6 Commitments in respect of operating leases
Not later than one year 150,770 50,579 Later than one year and not later than five years 22 4,197 Later than five years 230 233
151,022 55,009
22.2.7 Commitments in respect of capital expenditure 3,132,339 2,876,499
22.3 Other contingent liabilities
22.3.1 Claims against the Bank not acknowledged as debts 11,783,017 11,450,325
Based on legal advice and / or internal assessments, management is confident that the matters will be decided in theBank's favour and the possibility of any outcome against the Bank is remote and accordingly no provision has been madein these unconsolidated condensed interim financial statements.
These mainly represent counter claims filed by the borrowers for restricting the Bank from disposal of assets (such asmortgaged / pledged assets kept as security).
These represent commitments that are irrevocable because they cannot be withdrawn at the discretion of the bankwithout the risk of incurring significant penalty or expense.
------- (Rupees in '000) -------
------- (Rupees in '000) -------
June 30, 2021
December 31, 2020
December 31, 2020
June 30, 2021
The Bank makes commitments to extend credit in the normal course of its business but these being revocablecommitments do not attract any significant penalty or expense if the facility is unilaterally withdrawn.
19
NOTES TO AND FORMING PART OF THE UNCONSOLIDATED CONDENSED INTERIM FINANCIAL STATEMENTS (UN-AUDITED)FOR THE SIX MONTHS ENDED JUNE 30, 2021

31Half Yearly Report 2021
NOTES TO AND FORMING PART OF THE UNCONSOLIDATED CONDENSED INTERIM FINANCIAL STATEMENTS (UN-AUDITED)FOR THE SIX MONTHS ENDED JUNE 30, 2021
22.3.2
22.3.3 For contingencies relating to taxation, refer note 14.2.
23. DERIVATIVE INSTRUMENTS
Product analysis
Counterparties
Total Hedging 1,169,484 - 707,328 (183) - - 1,876,812 (183) Market making 1,169,484 - - - - - 1,169,484 -
2,338,968 - 707,328 (183) - - 3,046,296 (183)
Counterparties
Total Hedging - - - - - - - - Market making - - - - - - - -
- - - - - - - -
24. MARK-UP / RETURN / INTEREST EARNEDOn:Loans and advances 18,620,914 32,357,771Investments 48,166,699 52,367,899Lendings to financial institutions 722,797 1,370,790Balances with banks 240,638 351,554
67,751,048 86,448,014
25. MARK-UP / RETURN / INTEREST EXPENSED
On:Deposits 25,814,351 35,278,389Borrowings 4,382,104 8,870,607Subordinated debt 441,847 652,061Cost of foreign currency swaps against foreign currency deposits / borrowings 1,550,237 1,941,817Lease liability under IFRS 16 473,603 584,330
32,662,142 47,327,204
Forward purchase contracts of government securities
Notional principal
Mark to Market Gain
Mark to Market Loss
------- (Rupees in '000) -------
January - June 2020
Forward sale contracts of government securities Total
During 2016, penalties amounting to Rs. 4.089 billion were levied by the FE Adjudication Court of the State Bank ofPakistan relating to alleged contraventions of the requirements of foreign exchange regulations with respect to issuanceand certification of E-Forms by the Bank to certain customers (exporters) who failed to submit the export documents thereagainst. Consequently, foreign exchange on account of export proceeds have not been repatriated. The Bank maintainsthat it fully discharged its liability, in accordance with the law and has filed a civil suit in the High Court of Sindh challengingthe levy of the penalty. The High Court has granted a stay on action being taken against the Bank. The management,based on the advice from legal counsel, is confident that the view of the Bank will prevail and the Bank will not be exposedto any loss on this account.
Mark to Market Loss
Notional principal
Mark to Market Loss Notional principal Mark to Market
Gain / (Loss)Notional principal
Mark to Market Gain
Notional principal
Forward purchase contracts of government securities
Forward sale contracts of government securities
June 30, 2021 (Un-Audited)
December 31, 2020 (Audited)
------------------------------------------------------------------------------------------------------------ (Rupees in '000) ------------------------------------------------------------------------------------------------------------
FX options
Notional principal
Mark to Market Loss Notional principal Mark to Market
Gain / (Loss)
TotalFX options
Notional principal
January - June 2021
------- (Un-audited) -------
------------------------------------------------------------------------------------------------------------ (Rupees in '000) ------------------------------------------------------------------------------------------------------------
20
NOTES TO AND FORMING PART OF THE UNCONSOLIDATED CONDENSED INTERIM FINANCIAL STATEMENTS (UN-AUDITED)FOR THE SIX MONTHS ENDED JUNE 30, 2021

32 United Bank Limited
NOTES TO AND FORMING PART OF THE UNCONSOLIDATED CONDENSED INTERIM FINANCIAL STATEMENTS (UN-AUDITED)FOR THE SIX MONTHS ENDED JUNE 30, 2021
26. FEE AND COMMISSION INCOME
Branch banking customer fee 820,291 824,344Consumer finance related fee 479,126 425,798Card related fees (debit and credit cards) 1,135,999 690,363Investment banking fee 343,216 85,319Financial Institution rebate / commission 156,835 139,349Corporate service charges / facility fee 376,681 185,604Commission on trade 320,007 348,756Commission on guarantees 275,578 356,906Commission on cash management 461,703 373,443Commission on remittances including home remittances - net 1,110,448 1,092,127Commission on bancassurance 882,534 478,967Commission on Benazir Income Support Program - 38,359Rent on lockers 95,652 93,817Others 146,820 115,157
6,604,890 5,248,309
27. GAIN ON SECURITIES - NET
Realised 27.1 2,539,494 661,833Unrealised - held for trading 9.1 5,006 14,504
2,544,500 676,337
27.1 Realised gain on:
Federal Government securities 790,970 342,851Shares 298,863 (164,582)Foreign securities 1,449,227 487,178Other Securities 434 (3,614)
2,539,494 661,833
28. OTHER INCOME
Charges recovered 130,948 115,912 Rent on properties 40,072 25,740
Gain on sale of operating fixed assets - net 4,721 50,191 Gain on sale of Ijarah assets - net 3,222 548 Gain on disposal of non-banking assets - net - 223,054 Gain on trading liabilities - net 16,666 76,068
195,629 491,513
------- (Rupees in '000) -------
------- (Un-audited) ------- January - June 2021
January - June 2020 Note
21
NOTES TO AND FORMING PART OF THE UNCONSOLIDATED CONDENSED INTERIM FINANCIAL STATEMENTS (UN-AUDITED)FOR THE SIX MONTHS ENDED JUNE 30, 2021

33Half Yearly Report 2021
NOTES TO AND FORMING PART OF THE UNCONSOLIDATED CONDENSED INTERIM FINANCIAL STATEMENTS (UN-AUDITED)FOR THE SIX MONTHS ENDED JUNE 30, 2021
29. OPERATING EXPENSES
Total compensation expense 8,255,548 7,970,879
Property expenseRent and taxes 538,405 498,705 Insurance 102,205 92,220 Utilities cost 661,737 603,043 Security 502,727 509,719 Repair and maintenance 82,383 65,150 Depreciation 399,330 391,604 Depreciation - right-of-use assets 924,501 977,682 Others 30,277 27,729
3,241,565 3,165,852 Information technology expensesSoftware maintenance 793,690 675,495 Hardware maintenance 177,794 136,081 Depreciation 385,638 388,336 Amortisation 380,843 383,908 Network charges 356,445 352,267
2,094,410 1,936,087 Other operating expensesDirectors' fees and allowances 34,050 49,749 Fees and allowances to Shariah Board 4,818 4,560 Legal and professional charges 242,328 290,252 Commission paid to branchless banking agents 207,616 186,004 Commission paid to sales force 624,849 482,679 Outsourced service costs 631,486 670,712 Travelling and conveyance 45,452 48,115 Clearing charges 89,830 121,421 Depreciation - others 602,602 590,284 Depreciation on Islamic financing against leased assets 84,917 124,174 Training and development 9,090 19,022 Postage and courier charges 163,482 127,037 Communication 224,631 223,969 Stationery and printing 376,288 258,914 Marketing, advertisement and publicity 249,781 196,733 Donations 71,096 240,980 Auditors' remuneration 36,945 41,397 Insurance 46,492 96,534 Deposit Protection Premium 793,350 683,778 Cash transportation and sorting charges 414,374 372,220 Entertainment 73,243 61,800 Vehicle expenses 46,818 46,365 Subscription 47,045 48,359 Office running expenses 75,862 83,908 Banking service charges 927,806 762,884 Repairs and maintenance 335,353 207,062 Cartage, freight and conveyance 23,070 19,336 Zakat paid by overseas branch 6,406 7,369 Brokerage expenses 9,794 13,296 Miscellaneous expenses 108,428 11,488
6,607,302 6,090,401 20,198,825 19,163,219
30. OTHER CHARGES
Penalties imposed by the SBP 28,179 152,252 Other penalties 11,315 81
39,494 152,333
------- (Un-audited) ------- January - June 2021
January - June 2020
------- (Rupees in '000) -------
22
NOTES TO AND FORMING PART OF THE UNCONSOLIDATED CONDENSED INTERIM FINANCIAL STATEMENTS (UN-AUDITED)FOR THE SIX MONTHS ENDED JUNE 30, 2021

34 United Bank Limited
NOTES TO AND FORMING PART OF THE UNCONSOLIDATED CONDENSED INTERIM FINANCIAL STATEMENTS (UN-AUDITED)FOR THE SIX MONTHS ENDED JUNE 30, 2021
Note
31. (REVERSALS) / PROVISIONS AND WRITE-OFFS - NET
Provision against loans and advances - net 10.3 686,602 9,588,341 Reversal of provision for diminution in value of investments - net 9.2 (714,640) (416,765) Bad debts written off directly 20,382 38,618 Reversal of provision against other assets - net 14.3.1 (98,538) (65,845) (Reversal) / provision against off - balance sheet obligations 20.1 (330,661) 214,965 Recovery of written-off / charged off bad debts (234,394) (277,453) Other provisions / write-offs - net 583,853 347,960
(87,396) 9,429,821
32. TAXATION
Current 11,010,646 10,176,632 Prior years (189,016) - Deferred 31,361 (2,772,652)
10,852,991 7,403,980
33. EARNINGS PER SHARE
Profit after taxation for the period 14,997,307 11,400,778
Weighted average number of ordinary shares 1,224,179,687 1,224,179,687
Earnings per share - basic and diluted 12.25 9.31
34. FAIR VALUE MEASUREMENTS
34.1
Level 1: Fair value measurements using quoted prices (unadjusted) in active markets for identical assets or liabilities.
The Bank measures fair values using the following fair value hierarchy that reflects the significance of the inputs used inmaking the measurements:
Level 2: Fair value measurements using inputs other than quoted prices included within Level 1 that are observable forthe assets or liability, either directly (i.e. as prices) or indirectly (i.e. derived from prices).
Level 3: Fair value measurements using input for the asset or liability that are not based on observable market data (i.e.unobservable inputs).
------- (Un-audited) -------
The fair value of quoted securities other than those classified as held to maturity, is based on quoted market price.Quoted securities classified as held to maturity are carried at cost. The fair value of unquoted equity securities, other thaninvestments in associates and subsidiaries, is determined on the basis of the break-up value of these investments as pertheir latest available audited financial statements.
The fair value of unquoted debt securities, fixed term loans, other assets, other liabilities, fixed term deposits andborrowings cannot be calculated with sufficient reliability due to the absence of a current and active market for theseassets and liabilities and reliable data regarding market rates for similar instruments.
In the opinion of the management, the fair value of the remaining financial assets and liabilities are not significantlydifferent from their carrying values since these are either short-term in nature or, in the case of customer loans anddeposits, are frequently repriced.
There were no convertible dilutive potential ordinary shares outstanding as at June 30, 2021 and June 30, 2020.
------- (Number of shares) -------
---------- (Rupees) ----------
------- (Rupees in '000) -------
January - June 2021
January - June 2020
23
NOTES TO AND FORMING PART OF THE UNCONSOLIDATED CONDENSED INTERIM FINANCIAL STATEMENTS (UN-AUDITED)FOR THE SIX MONTHS ENDED JUNE 30, 2021

35Half Yearly Report 2021
NOTES TO AND FORMING PART OF THE UNCONSOLIDATED CONDENSED INTERIM FINANCIAL STATEMENTS (UN-AUDITED)FOR THE SIX MONTHS ENDED JUNE 30, 2021
On balance sheet financial instruments Level 1 Level 2 Level 3 Total
Financial assets measured at fair value- Investments
Government Securities (T-bills, PIBs, GoP Sukuks and Eurobonds, Mudarabah Pool) 1,092,702,346 - 1,092,702,346 - 1,092,702,346
Foreign Bonds - Sovereign 43,433,843 - 43,433,843 - 43,433,843Foreign Bonds - others 2,212,529 - 2,212,529 - 2,212,529Ordinary shares of listed companies 12,325,922 12,325,922 - - 12,325,922Mutual funds 221,885 - 221,885 - 221,885Debt securities (TFCs , Sukuks) 1,840,339 - 1,840,339 - 1,840,339Investment in REIT 459,424 459,424 - - 459,424
1,153,196,288 12,785,346 1,140,410,942 - 1,153,196,288Financial assets not measured at fair value
Government Securities (T-bills, PIBs, GoP Sukuks Eurobonds, Bai Muajjal) 248,346,633 - 250,461,873 - 250,461,873
Foreign Bonds - Sovereign 28,663,577 - 29,838,081 - 29,838,081Foreign Bonds - others 1,923,949 - 1,999,967 - 1,999,967Debt securities (TFCs, Sukuks) 19,438,405 - 19,683,070 - 19,683,070
298,372,564 - 301,982,991 - 301,982,9911,451,568,852 12,785,346 1,442,393,933 - 1,455,179,279
Off-balance sheet financial instruments -measured at fair valueForward purchase and sale of foreign exchange contracts 618,694,809 - (176,107) - (176,107)
FX options - purchased and sold 2,338,968 - - - -
Forward purchase of government securities 707,328 - (183) - (183)
Fair Value of non-financial assetsFixed Assets 36,315,390 - - 36,315,390 36,315,390Non-banking assets acquired in satisfaction of claims 203,676 - - 203,676 203,676
36,519,066 - - 36,519,066 36,519,066
On balance sheet financial instruments Level 1 Level 2 Level 3 Total
Financial assets measured at fair value- Investments
Government Securities (T-bills, PIBs, GoP Sukuks and Eurobonds, Mudarabah Pool) 808,788,572 - 808,788,572 - 808,788,572
Foreign Bonds - Sovereign 55,145,424 - 45,358,275 - 45,358,275Foreign Bonds - others 4,769,303 - 7,083,775 - 7,083,775Ordinary shares of listed companies 10,383,260 13,410,747 - - 13,410,747Mutual funds 228,518 - 252,931 - 252,931Debt securities (TFCs, Sukuks) 1,720,302 - 1,914,241 - 1,914,241Investment in REIT 441,914 520,708 - - 520,708
881,477,293 13,931,455 863,397,794 - 877,329,249Financial assets not measured at fair value
Government Securities (T-bills, PIBs, GoP Sukuks Eurobonds, Bai Muajjal) 200,466,866 - 206,791,388 - 206,791,388
Foreign Bonds - Sovereign 23,429,572 - 22,141,647 - 22,141,647Foreign Bonds - others 1,238,565 - 1,285,465 - 1,285,465Debt securities (TFCs, Sukuks) 16,411,853 - 16,570,036 - 16,570,036
241,546,856 - 246,788,536 - 246,788,5361,123,024,149 13,931,455 1,110,186,330 - 1,124,117,785
Off-balance sheet financial instruments - measured at fair valueForward purchase and sale of foreign exchange contracts 635,597,333 - 614,728 - 614,728
FX options - purchased and sold - - - - -
Forward purchase of government securities - - - - -
Fair Value of non-financial assetsFixed Assets 36,492,910 - - 36,492,910 36,492,910Non-banking assets acquired in satisfaction of claims 203,316 - - 203,316 203,316
36,696,226 - - 36,696,226 36,696,226
34.2
-------------------------- (Rupees in '000) --------------------------
The table below analyses financial instruments measured at the end of the reporting period by the level in the fair valuehierarchy into which the fair value measurement is categorised:
June 30, 2021 (Un-audited)Carrying /
Notional valueFair value
December 31, 2020 (Audited)Carrying /
Notional valueFair value
-------------------------- (Rupees in '000) --------------------------
Certain categories of fixed assets (land and buildings) and non-banking assets acquired in satisfactions of claims are carriedat revalued amounts (level 3 measurement) determined by professional valuers based on their assessment of the marketvalues.
24
NOTES TO AND FORMING PART OF THE UNCONSOLIDATED CONDENSED INTERIM FINANCIAL STATEMENTS (UN-AUDITED)FOR THE SIX MONTHS ENDED JUNE 30, 2021
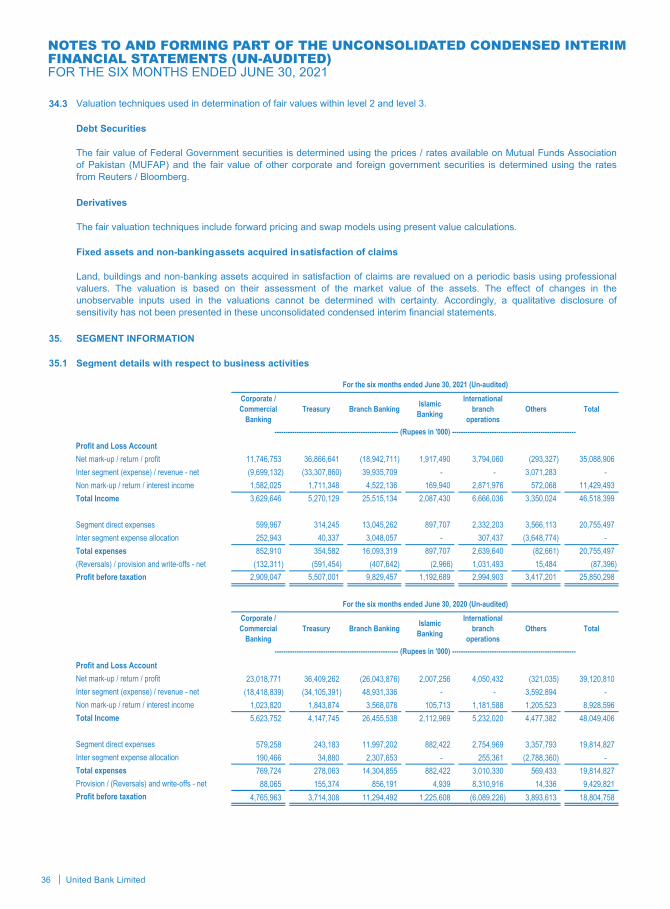
36 United Bank Limited
NOTES TO AND FORMING PART OF THE UNCONSOLIDATED CONDENSED INTERIM FINANCIAL STATEMENTS (UN-AUDITED)FOR THE SIX MONTHS ENDED JUNE 30, 2021
34.3 Valuation techniques used in determination of fair values within level 2 and level 3.
Debt Securities
Derivatives
The fair valuation techniques include forward pricing and swap models using present value calculations.
Fixed assets and non-banking assets acquired in satisfaction of claims
35. SEGMENT INFORMATION
35.1 Segment details with respect to business activities
Profit and Loss AccountNet mark-up / return / profit 11,746,753 36,866,641 (18,942,711) 1,917,490 3,794,060 (293,327) 35,088,906Inter segment (expense) / revenue - net (9,699,132) (33,307,860) 39,935,709 - - 3,071,283 - Non mark-up / return / interest income 1,582,025 1,711,348 4,522,136 169,940 2,871,976 572,068 11,429,493Total Income 3,629,646 5,270,129 25,515,134 2,087,430 6,666,036 3,350,024 46,518,399
Segment direct expenses 599,967 314,245 13,045,262 897,707 2,332,203 3,566,113 20,755,497Inter segment expense allocation 252,943 40,337 3,048,057 - 307,437 (3,648,774) - Total expenses 852,910 354,582 16,093,319 897,707 2,639,640 (82,661) 20,755,497(Reversals) / provision and write-offs - net (132,311) (591,454) (407,642) (2,966) 1,031,493 15,484 (87,396)Profit before taxation 2,909,047 5,507,001 9,829,457 1,192,689 2,994,903 3,417,201 25,850,298
Profit and Loss AccountNet mark-up / return / profit 23,018,771 36,409,262 (26,043,876) 2,007,256 4,050,432 (321,035) 39,120,810 Inter segment (expense) / revenue - net (18,418,839) (34,105,391) 48,931,336 - - 3,592,894 - Non mark-up / return / interest income 1,023,820 1,843,874 3,568,078 105,713 1,181,588 1,205,523 8,928,596 Total Income 5,623,752 4,147,745 26,455,538 2,112,969 5,232,020 4,477,382 48,049,406
Segment direct expenses 579,258 243,183 11,997,202 882,422 2,754,969 3,357,793 19,814,827 Inter segment expense allocation 190,466 34,880 2,307,653 - 255,361 (2,788,360) - Total expenses 769,724 278,063 14,304,855 882,422 3,010,330 569,433 19,814,827 Provision / (Reversals) and write-offs - net 88,065 155,374 856,191 4,939 8,310,916 14,336 9,429,821 Profit before taxation 4,765,963 3,714,308 11,294,492 1,225,608 (6,089,226) 3,893,613 18,804,758
TreasuryInternational
branch operations
Corporate / Commercial
BankingBranch Banking TotalOthersIslamic
Banking
For the six months ended June 30, 2020 (Un-audited)
-------------------------------------------------------- (Rupees in '000) --------------------------------------------------------
The fair value of Federal Government securities is determined using the prices / rates available on Mutual Funds Associationof Pakistan (MUFAP) and the fair value of other corporate and foreign government securities is determined using the ratesfrom Reuters / Bloomberg.
Land, buildings and non-banking assets acquired in satisfaction of claims are revalued on a periodic basis using professionalvaluers. The valuation is based on their assessment of the market value of the assets. The effect of changes in theunobservable inputs used in the valuations cannot be determined with certainty. Accordingly, a qualitative disclosure ofsensitivity has not been presented in these unconsolidated condensed interim financial statements.
For the six months ended June 30, 2021 (Un-audited)International
branch operations
Others Total
-------------------------------------------------------- (Rupees in '000) --------------------------------------------------------
Islamic Banking
Corporate / Commercial
BankingTreasury Branch Banking
25
NOTES TO AND FORMING PART OF THE UNCONSOLIDATED CONDENSED INTERIM FINANCIAL STATEMENTS (UN-AUDITED)FOR THE SIX MONTHS ENDED JUNE 30, 2021

37Half Yearly Report 2021
NOTES TO AND FORMING PART OF THE UNCONSOLIDATED CONDENSED INTERIM FINANCIAL STATEMENTS (UN-AUDITED)FOR THE SIX MONTHS ENDED JUNE 30, 2021
Statement of financial positionCash & Bank balances 9,515 79,563,460 120,701,478 12,368,881 52,524,357 787,718 265,955,409Investments 7,503,061 1,262,799,248 - 68,539,121 113,080,763 5,560,588 1,457,482,781Net inter segment lending - - 1,325,910,472 30,847,176 - 85,877,346 1,442,634,994Lendings to financial institutions - 21,734,325 - - - - 21,734,325Advances - performing 357,454,663 16,939 43,424,604 43,456,874 95,822,270 6,173,907 546,349,257Advances - non-performing net of provision 2,907,797 - 547,031 8,832 7,413,073 14,350 10,891,083Others 9,497,782 16,100,463 15,152,667 2,580,305 11,385,322 41,154,318 95,870,857Total Assets 377,372,818 1,380,214,435 1,505,736,252 157,801,189 280,225,785 139,568,227 3,840,918,706
Borrowings 55,761,710 179,699,106 4,559,481 3,696,805 19,995,018 - 263,712,120Subordinated debt - - - - - 10,000,000 10,000,000Deposits and other accounts 48,779,096 134,986 1,450,404,464 143,200,166 207,000,082 313,505 1,849,832,299Net inter segment borrowing 257,031,378 1,184,593,196 - - 1,010,420 - 1,442,634,994Others 13,969,542 11,201,953 45,315,747 4,942,051 4,693,095 12,920,024 93,042,412Total Liabilities 375,541,726 1,375,629,241 1,500,279,692 151,839,022 232,698,615 23,233,529 3,659,221,825Equity 1,831,092 4,585,194 5,456,560 5,962,167 47,527,170 116,334,698 181,696,881Total Equity & liabilities 377,372,818 1,380,214,435 1,505,736,252 157,801,189 280,225,785 139,568,227 3,840,918,706
Contingencies and Commitments 365,216,743 198,404,513 29,959,047 30,665,208 464,452,076 2,463,232 1,091,160,819
Statement of financial positionCash & Bank balances 5,833 81,844,130 122,637,049 12,061,714 47,378,919 799,172 264,726,817Investments 4,803,162 932,393,450 - 62,729,601 123,251,328 5,496,953 1,128,674,494Net inter segment lending - - 1,139,940,361 7,997,409 - 77,017,055 1,224,954,825Lendings to financial institutions - - - 19,959,132 - - 19,959,132Advances - performing 360,426,353 - 41,532,652 20,521,606 89,119,069 6,811,741 518,411,421Advances - non-performing net of provision 3,287,884 - 802,173 16,551 7,754,943 6,524 11,868,075Others 14,416,544 16,648,272 14,968,909 1,705,673 13,301,659 44,902,317 105,943,374Total Assets 382,939,776 1,030,885,852 1,319,881,144 124,991,686 280,805,918 135,033,762 3,274,538,138
Borrowings 51,240,762 60,191,848 4,600,487 3,632,752 9,321,566 - 128,987,415Subordinated debt - - - - - 10,000,000 10,000,000Deposits and other accounts 50,351,838 132,797 1,257,985,091 111,478,161 220,015,338 248,676 1,640,211,901Net inter segment borrowing 263,282,545 960,917,205 - - 755,075 - 1,224,954,825Others 13,412,717 3,328,909 47,513,400 4,811,546 6,305,922 10,938,596 86,311,090Total Liabilities 378,287,862 1,024,570,759 1,310,098,978 119,922,459 236,397,901 21,187,272 3,090,465,231Equity 4,651,914 6,315,093 9,782,166 5,069,227 44,408,017 113,846,490 184,072,907Total Equity & liabilities 382,939,776 1,030,885,852 1,319,881,144 124,991,686 280,805,918 135,033,762 3,274,538,138
Contingencies and Commitments 349,133,005 285,716,584 13,182,354 5,991,566 398,498,688 2,721,015 1,055,243,212
As at December 31, 2020 (Audited)
-------------------------------------------------------- (Rupees in '000) --------------------------------------------------------
Others TotalCorporate / Commercial
BankingTreasury Branch Banking Islamic
Banking
International branch
operations
-------------------------------------------------------- (Rupees in '000) --------------------------------------------------------
TotalTreasury Branch Banking Islamic Banking
International branch
operations
As at June 30, 2021 (Un-audited)Corporate / Commercial
BankingOthers
26
NOTES TO AND FORMING PART OF THE UNCONSOLIDATED CONDENSED INTERIM FINANCIAL STATEMENTS (UN-AUDITED)FOR THE SIX MONTHS ENDED JUNE 30, 2021

38 United Bank Limited
NO
TES
TO A
ND
FO
RM
ING
PAR
T O
F TH
E U
NC
ON
SOLI
DAT
ED C
ON
DEN
SED
INTE
RIM
FIN
ANC
IAL
STAT
EMEN
TS (U
N-A
UD
ITED
)FO
R T
HE
SIX
MO
NTH
S EN
DED
JU
NE
30, 2
021
36.
REL
ATED
PAR
TY T
RAN
SAC
TIO
NS
The
Bank
has
rela
ted
party
tran
sact
ions
with
its
asso
ciat
es, s
ubsi
diar
y co
mpa
nies
, em
ploy
ee b
enef
it pl
ans
and
its D
irect
ors
and
Key
Man
agem
ent P
erso
nnel
.
Stat
emen
t of f
inan
cial
pos
ition
Bal
ance
s w
ith o
ther
ban
ksIn
cur
rent
acc
ount
s-
-
-
1,
360,
706
-
-
-
-
-
1,
482,
280
-
-
In
dep
osit
acco
unts
-
-
-
1,73
2,96
7-
-
-
-
-
-
-
-
-
-
-
3,
093,
673
-
-
-
-
-
1,
482,
280
-
-
Inve
stm
ents
Ope
ning
bal
ance
-
-
-
5,40
6,16
61,
582,
485
3,99
7,48
9-
-
-
5,
406,
166
1,58
2,48
53,
943,
202
Inve
stm
ent m
ade
durin
g th
e pe
riod
/ yea
r-
-
-
-
20
0,00
02,
563,
634
-
-
-
-
-
54
,287
Inve
stm
ent d
ispo
sed
/ writ
ten
off d
urin
g th
e pe
riod
/ yea
r-
-
-
-
-
(1
50,8
20)
-
-
-
-
-
-
C
losi
ng b
alan
ce-
-
-
5,
406,
166
1,78
2,48
56,
410,
303
-
-
-
5,40
6,16
61,
582,
485
3,99
7,48
9
Prov
isio
n fo
r dim
inut
ion
in v
alue
of i
nves
tmen
ts-
-
-
1,
688,
911
-
1,43
4,28
7-
-
-
1,
688,
911
-
1,
544,
596
Prov
isio
n w
ritte
n of
f-
-
-
-
-
77
,606
-
-
-
-
-
-
Adva
nces
O
peni
ng b
alan
ce-
1023
7,86
1-
-
9,
365,
687
-
4,
624
220,
133
-
2,15
5,14
912
,715
,998
Addi
tion
durin
g th
e pe
riod
/ yea
r-
191
25,3
57-
-
17
,381
,345
-
83
872
,462
-
-
16
,398
,899
Rep
aid
durin
g th
e pe
riod
/ yea
r-
(156
)(2
2,39
1)-
-
(2
3,38
4,74
6)-
(5,4
52)
(68,
603)
-
(152
,755
)(1
9,74
9,21
0)Tr
ansf
er in
- ne
t / (w
rite-
off)
-
-
-
-
-
-
-
-
13,8
69-
(2
,002
,394
)-
C
losi
ng b
alan
ce-
4524
0,82
7-
-
3,
362,
286
-
10
237,
861
-
-
9,
365,
687
Asso
ciate
s
------
------
------
------
------
------
------
------
------
------
------
------
------
------
------
------
------
------
------
-----
(Rup
ees i
n '00
0) --
------
------
------
------
------
------
------
------
------
------
------
------
------
------
------
------
------
------
------
---
The
Bank
ente
rsin
totra
nsac
tions
with
rela
ted
parti
esin
the
ordi
nary
cour
seof
busi
ness
and
onsu
bsta
ntia
llyth
esa
me
term
sas
for
com
para
ble
trans
actio
nsw
ithpe
rson
ofsi
mila
rst
andi
ng.
Con
tribu
tions
toan
dac
crua
lsin
resp
ecto
fsta
ffre
tirem
entb
enef
itsan
dot
herb
enef
itpl
ans
are
mad
ein
acco
rdan
cew
ithth
eac
tuar
ialv
alua
tions
/ter
ms
ofth
eco
ntrib
utio
npl
an.R
emun
erat
ion
toth
e ex
ecut
ives
/ of
ficer
s is
det
erm
ined
in a
ccor
danc
e w
ith th
e te
rms
of th
eir a
ppoi
ntm
ent.
Othe
r rela
ted
parti
esDi
rect
ors
Key
man
age-
men
t pe
rson
nel
Subs
idiar
iesAs
socia
tes
June
30,
202
1 (U
n-Au
dite
d)D
ecem
ber 3
1, 2
020
(Aud
ited)
Dire
ctor
s
Key
man
age-
men
t pe
rson
nel
Det
ails
of t
rans
actio
ns w
ith re
late
d pa
rties
dur
ing
the
perio
d / y
ear,
othe
r tha
n th
ose
whi
ch h
ave
been
dis
clos
ed e
lsew
here
in th
ese
unco
nsol
idat
ed c
onde
nsed
inte
rim fi
nanc
ial s
tate
men
ts, a
re a
s fo
llow
s:
Subs
idiar
iesPa
rent
Pare
ntOt
her r
elate
d pa
rties
27
NO
TE
S T
O A
ND
FO
RM
ING
PA
RT
OF
TH
E U
NC
ON
SO
LID
AT
ED
CO
ND
EN
SE
D I
NT
ER
IM F
INA
NC
IAL
STA
TE
ME
NT
S
(UN
-AU
DIT
ED
FOR
TH
E SI
X M
ON
THS
END
ED J
UN
E 30
, 202
1

39Half Yearly Report 2021NO
TES
TO A
ND
FO
RM
ING
PAR
T O
F TH
E U
NC
ON
SOLI
DAT
ED C
ON
DEN
SED
INTE
RIM
FIN
ANC
IAL
STAT
EMEN
TS (U
N-A
UD
ITED
)FO
R T
HE
SIX
MO
NTH
S EN
DED
JU
NE
30, 2
021
Stat
emen
t of f
inan
cial
pos
ition
Oth
er A
sset
sIn
tere
st m
ark-
up a
ccru
ed-
-
-
2,
648
31,6
1738
,294
-
-
-
-
4,28
223
2,47
1R
ecei
vabl
e fro
m s
taff
retir
emen
t fun
d-
-
-
-
-
74
,054
-
-
-
-
-
24
,160
Adva
nces
, Dep
osits
& P
repa
ymen
ts-
-
-
-
-
-
-
-
-
-
-
63
,634
Prep
aid
insu
ranc
e-
-
-
-
28
3,32
2-
-
-
-
-
1,00
2-
D
ivid
end
Rec
eiva
ble
-
-
-
87,5
55-
-
-
-
-
-
-
10
4,21
5O
ther
rece
ivab
le-
-
-
12
,348
-
-
-
-
-
11
,983
-
30
,164
Prov
isio
n ag
ains
t oth
er a
sset
s-
-
-
-
-
-
-
-
-
-
-
30
,164
Prov
isio
n w
ritte
n of
f-
-
-
-
-
30
,164
-
-
-
-
-
-
Bor
row
ings
Ope
ning
bal
ance
-
-
-
1,59
8,32
3-
-
-
-
-
-
-
-
Bo
rrow
ings
dur
ing
the
perio
d / y
ear
-
-
-
1,63
9,98
3-
48
8,30
0-
-
-
1,
760,
102
-
1,
538,
000
Settl
ed d
urin
g th
e pe
riod
/ yea
r-
-
-
(2
,293
,056
)-
(2
88,3
00)
-
-
-
(161
,779
)-
(1,5
38,0
00)
Clo
sing
bal
ance
-
-
-
945,
250
-
200,
000
-
-
-
1,59
8,32
3-
-
Dep
osits
and
oth
er a
ccou
nts
Ope
ning
bal
ance
-
6,
431,
790
62,7
6128
1,01
62,
478,
432
16,5
11,0
19-
8,67
9,45
049
,368
211,
870
6,50
2,93
111
,346
,752
Rec
eive
d du
ring
the
perio
d / y
ear
100,
712
52,7
91,4
3744
4,94
110
,480
,245
72,0
92,1
4418
7,06
5,78
5-
29,4
15,7
691,
265,
710
15,7
08,6
4114
4,14
1,55
117
7,62
7,32
9W
ithdr
awn
durin
g th
e pe
riod
/ yea
r(7
9,49
6)(5
2,37
8,80
2)(4
61,3
14)
(10,
454,
718)
(72,
660,
872)
(187
,249
,989
)-
(31,
659,
519)
(1,1
92,3
77)
(15,
639,
495)
(148
,166
,050
)(1
72,4
69,6
03)
Tran
sfer
(out
) / in
- n
et-
-
-
-
-
-
-
(3
,910
)(5
9,94
0)-
-
6,54
1C
losi
ng b
alan
ce21
,216
6,84
4,42
546
,388
306,
543
1,90
9,70
416
,326
,815
-
6,
431,
790
62,7
6128
1,01
62,
478,
432
16,5
11,0
19
Oth
er L
iabi
litie
sIn
tere
st /
mar
k-up
pay
able
on
depo
sits
and
bo
rrow
ings
-
82
,400
-
36
5,48
028
4,59
0-
39,3
3521
01,
182
7,65
111
5,02
4Pa
yabl
e to
sta
ff re
tirem
ent f
und
-
-
-
-
-
131,
457
-
-
-
-
-
1,
122,
023
Div
iden
d Pa
yabl
e2,
526,
916
80,6
3386
2-
21
,844
389,
261
-
-
-
-
-
-
U
near
ned
inco
me
-
-
-
371
-
7,14
5-
-
-
1,
485
-
-
O
ther
Pay
able
-
-
-
-
23,1
07-
-
3,
900
-
-
22
,353
-
Con
tinge
ncie
s an
d C
omm
itmen
tsLe
tter o
f gua
rant
ee-
-
-
10
,862
-
-
-
-
-
11
,053
-
4,
360
Forw
ard
fore
ign
exch
ange
con
tract
s pu
rcha
se-
-
-
2,
447,
347
-
-
-
-
-
1,
777,
719
-
-
Fo
rwar
d fo
reig
n ex
chan
ge c
ontra
cts
sale
-
-
-
2,44
2,61
4-
-
-
-
-
1,75
8,17
8-
-
Asso
ciate
sOt
her r
elate
d pa
rties
June
30,
202
1 (U
n-Au
dite
d)
Dire
ctor
sKe
y man
age-
men
t pe
rson
nel
Subs
idiar
ies
Dec
embe
r 31,
202
0 (A
udite
d)
Pare
ntPa
rent
------
------
------
------
------
------
------
------
------
------
------
------
------
------
------
------
------
------
------
-----
(Rup
ees i
n '00
0) --
------
------
------
------
------
------
------
------
------
------
------
------
------
------
------
------
------
------
------
---
Key
man
age-
men
t pe
rson
nel
Subs
idiar
iesAs
socia
tes
Othe
r rela
ted
parti
esDi
rect
ors
28
NO
TE
S T
O A
ND
FO
RM
ING
PA
RT
OF
TH
E U
NC
ON
SO
LID
AT
ED
CO
ND
EN
SE
D I
NT
ER
IM F
INA
NC
IAL
STA
TE
ME
NT
S
(UN
-AU
DIT
ED
FOR
TH
E SI
X M
ON
THS
END
ED J
UN
E 30
, 202
1

40 United Bank Limited
NO
TES
TO A
ND
FO
RM
ING
PAR
T O
F TH
E U
NC
ON
SOLI
DAT
ED C
ON
DEN
SED
INTE
RIM
FIN
ANC
IAL
STAT
EMEN
TS (U
N-A
UD
ITED
)FO
R T
HE
SIX
MO
NTH
S EN
DED
JU
NE
30, 2
021
Prof
it an
d lo
ss a
ccou
nt
Inco
me
Mar
k-up
/ re
turn
/ in
tere
st e
arne
d-
-
6,74
72,
648
18,3
5238
3,93
9-
-
8,29
961
,733
25,5
9879
2,97
3C
omm
issi
on /
char
ges
reco
vere
d 22
224
1,06
475
815
,515
12,6
07-
461,
687
475
11,1
7010
,137
Div
iden
d in
com
e-
-
-
43
4,86
611
,841
71,0
79-
-
-
37
9,03
918
,472
139,
868
Net
gai
n on
sal
e of
sec
uriti
es-
78-
-
-
-
-
-
-
-
-
-
Oth
er in
com
e-
-
2,37
41,
114
-
10,7
18-
-
7,16
6-
-
9,21
5R
ever
sal o
f Pro
visi
on-
-
-
-
-
32
,703
-
-
-
-
152,
755
-
Switc
h re
venu
e-
-
-
-
-
11
9,79
6-
-
-
-
-
104,
302
Man
agem
ent f
ee-
-
-
7,
485
-
-
-
-
-
68
9-
-
Expe
nse
Mar
k-up
/ re
turn
/ in
tere
st p
aid
269
185,
727
224
921
48,6
6643
8,17
6-
99,9
4845
87,
489
277,
728
192,
264
Rem
uner
atio
n pa
id-
-
612,
851
-
-
-
-
-
467,
398
-
-
-
Po
st e
mpl
oym
ent b
enef
its-
-
13,1
63-
-
-
-
-
11
,376
-
-
-
N
on-e
xecu
tive
dire
ctor
s' fe
e an
d al
low
ance
s-
34,0
50-
-
-
-
-
49,7
49-
-
-
-
N
et c
harg
e fo
r def
ined
con
tribu
tion
plan
s-
-
-
-
-
19
7,05
9-
-
-
-
-
180,
145
Cha
rge
for d
efin
ed b
enef
it pl
ans
-
-
-
-
-
159,
695
-
-
-
-
-
16
7,44
2O
ther
exp
ense
s-
-
-
-
-
64
,497
-
-
-
-
-
21
,942
Cle
arin
g C
harg
es-
-
-
-
-
67
,645
-
-
-
-
-
64
,874
Sem
inar
and
Mem
bers
hip
fees
-
-
-
-
-
6,54
1-
-
-
-
-
1,29
8M
embe
rshi
p, S
ubsc
riptio
n , S
pons
orsh
ip
and
mai
nten
ance
cha
rges
-
-
-
-
-
39,8
27-
-
-
-
-
400
Cus
tody
Cha
rges
-
-
-
-
-
1,48
5-
-
-
-
-
2,18
9
Insu
ranc
e pr
emiu
m p
aid
-
-
-
-
462,
810
-
-
-
-
-
51
4,30
2-
In
sura
nce
clai
ms
settl
ed-
-
-
-
24
4,45
9-
-
-
-
-
183,
804
-
36.1
Dire
ctor
s
Key
man
age-
men
t pe
rson
nel
Subs
idiar
iesAs
socia
tes
------
------
------
------
------
------
------
------
------
------
------
------
------
------
------
------
------
------
------
-----
(Rup
ees i
n '00
0) --
------
------
------
------
------
------
------
------
------
------
------
------
------
------
------
------
------
------
------
---
Othe
r rela
ted
parti
esDi
rect
ors
Key m
anag
e-m
ent
pers
onne
lSu
bsid
iaries
Asso
ciate
sOt
her r
elate
d pa
rties
Asdi
sclo
sed
inno
te9.
8,w
ithre
fere
nce
toth
eor
derly
win
ding
upof
UBL
(Sw
itzer
land
)AG
,dur
ing
the
perio
den
ded
June
30,2
021,
UBL
–U
AEbr
anch
has
acqu
ired
certa
inex
posu
res
rela
ting
tobi
llsdi
scou
ntin
gfro
mU
BL(S
witz
erla
nd)A
G.T
hese
trans
actio
nsha
veno
tres
ulte
din
any
kind
ofex
posu
rebe
twee
nU
BL–
UAE
and
UBL
(Sw
itzer
land
)AG
and
are
henc
eno
tpre
sent
edin
the
abov
e di
sclo
sure
.
Pare
ntPa
rent
For t
he s
ix m
onth
s en
ded
June
30,
202
0 (U
n-au
dite
d)Fo
r the
six
mon
ths
ende
d Ju
ne 3
0, 2
021
(Un-
audi
ted)
29
NO
TE
S T
O A
ND
FO
RM
ING
PA
RT
OF
TH
E U
NC
ON
SO
LID
AT
ED
CO
ND
EN
SE
D I
NT
ER
IM F
INA
NC
IAL
STA
TE
ME
NT
S
(UN
-AU
DIT
ED
FOR
TH
E SI
X M
ON
THS
END
ED J
UN
E 30
, 202
1

41Half Yearly Report 2021
NOTES TO AND FORMING PART OF THE UNCONSOLIDATED CONDENSED INTERIM FINANCIAL STATEMENTS (UN-AUDITED)FOR THE SIX MONTHS ENDED JUNE 30, 2021
(Un-audited) (Audited)
37. CAPITAL ADEQUACY, LEVERAGE RATIO & LIQUIDITY REQUIREMENTS
Minimum Capital Requirement (MCR):Paid-up capital (net of losses) 12,241,797 12,241,797
Capital Adequacy Ratio (CAR):Eligible Common Equity Tier 1 (CET 1) Capital 125,379,088 126,860,060 Eligible Additional Tier 1 (ADT 1) Capital 9,834,387 9,934,770 Total Eligible Tier 1 Capital 135,213,475 136,794,830 Eligible Tier 2 Capital 44,289,520 45,102,462 Total Eligible Capital (Tier 1 + Tier 2) 179,502,995 181,897,292
Risk Weighted Assets (RWAs):Credit Risk 537,623,663 532,509,650 Market Risk 68,131,390 54,441,838 Operational Risk 157,614,605 157,614,605 Total 763,369,658 744,566,093
Common Equity Tier 1 Capital Adequacy Ratio 16.42% 17.04%Tier 1 Capital Adequacy Ratio 17.71% 18.37%Total Capital Adequacy Ratio 23.51% 24.43%
(Un-audited) (Audited)
Leverage Ratio (LR):Eligible Tier-1 Capital 135,213,475 136,794,830 Total Exposures 2,979,304,502 2,456,802,603 Leverage Ratio 4.54% 5.57%
Liquidity Coverage Ratio (LCR):Total High Quality Liquid Assets 1,055,220,404 1,035,616,032 Total Net Cash Outflow 317,503,108 324,975,005 Liquidity Coverage Ratio 332.35% 318.68%
Net Stable Funding Ratio (NSFR):Total Available Stable Funding 1,968,023,129 1,714,566,321 Total Required Stable Funding 864,803,727 770,865,635 Net Stable Funding Ratio 227.57% 222.42%
------- (Rupees in '000) -------
Furthermore, under the SBP’s Framework for Domestic Systemically Important Banks (D-SIBs) introduced vide BPRD CircularNo. 04 of 2019 dated April 13, 2019, UBL has been designated as a D-SIB. In line with this framework, the Bank is required tomeet the Higher Loss Absorbency (HLA) capital charge of 1.0%, in the form of Additional CET 1 capital, on a standalone aswell as consolidated level during 2020. As per SBP’s designation of D-SIBs for the year 2020, the HLA capital charge isrequired to be maintained by UBL is 1.0% and will remain effective till next D-SIB designation is announced by the State Bankof Pakistan.
December 31, 2020
June 30, 2021
December 31, 2020
June 30, 2021
------- (Rupees in '000) -------
The SBP through its BSD Circular No. 07 dated April 15, 2009 has prescribed the minimum paid-up capital (net ofaccumulated losses) for Banks to be raised to Rs.10,000 million by the year ending December 31, 2015. The paid-up capital ofthe Bank for the year ended June 30, 2021 stood at Rs.12,241.797 million (Dec 2020: Rs.12,241.797 million) and is incompliance with SBP requirements. Banks are also required to maintain a minimum Capital Adequacy Ratio (CAR) of 10.0%plus capital conservation buffer of 2.5% and High Loss Absorbency Requirement of 1.0% of the risk weighted exposures of theBank.
Under the current capital adequacy regulations, credit risk and market risk exposures are measured using the StandardizedApproach and operational risk is measured using the Basic Indicator Approach. Credit risk mitigants are applied against theBank’s exposures based on eligible collateral under comprehensive approach.
In order to dampen the effects of COVID-19, the State Bank of Pakistan under BPRD Circular Letter No. 12 of 2020 has givena regulatory relief and reduced the Capital Conservation Buffer (CCB) as prescribed vide BPRD Circular No. 6 of August 15,2013, for the time being, from its existing level of 2.5% to 1.5%, till further instructions.
Further, under Basel III instructions, Banks are also required to maintain a Common Equity Tier 1 (CET 1) ratio and Tier 1 ratioof 6.0% and 7.5%, respectively, as at December 31, 2020. The Bank is fully compliant with prescribed ratios as the Bank’sCAR is 23.5% whereas CET 1 and Tier 1 ratios stood at 16.4% and 17.7% respectively.
30
NOTES TO AND FORMING PART OF THE UNCONSOLIDATED CONDENSED INTERIM FINANCIAL STATEMENTS (UN-AUDITED)FOR THE SIX MONTHS ENDED JUNE 30, 2021

42 United Bank Limited
NOTES TO AND FORMING PART OF THE UNCONSOLIDATED CONDENSED INTERIM FINANCIAL STATEMENTS (UN-AUDITED)FOR THE SIX MONTHS ENDED JUNE 30, 2021
38. ISLAMIC BANKING BUSINESS
The statement of financial position of the Bank's Islamic Banking branches as at June 30, 2021 is as follows:
(Un-audited) (Audited)Note
ASSETSCash and balances with treasury banks 8,965,569 9,784,450 Balances with other banks 3,403,312 2,277,264 Due from financial institutions 38.1 - 19,959,132 Investments 38.2 68,539,121 62,729,601 Islamic financing and related assets 38.3 43,465,706 20,538,157 Fixed assets 935,504 984,416 Intangible assets 3,325 4,638 Due from Head Office 30,847,176 7,997,409 Other assets 1,641,476 716,619 Total Assets 157,801,189 124,991,686
LIABILITIESBills payable 1,359,112 2,487,519 Due to financial institutions 3,696,805 3,632,752 Deposits and other accounts 38.4 143,200,166 111,478,161 Due to Head Office - - Other liabilities 3,582,939 2,324,027
151,839,022 119,922,459 NET ASSETS 5,962,167 5,069,227
REPRESENTED BYIslamic Banking Fund 2,181,000 2,181,000 Deficit on revaluation of assets 79,348 (86,052) Accumulated profit 38.8 3,701,819 2,974,279
5,962,167 5,069,227
CONTINGENCIES AND COMMITMENTS 38.5
The profit and loss account of the Bank's Islamic Banking branches for the six months ended June 30 is as follows:
Note January - June 2021
January - June 2020
Profit / return earned 38.6 4,225,371 4,606,068 Profit / return expensed 38.7 (2,307,881) (2,598,812) Net profit / return 1,917,490 2,007,256
Other income Fee and Commission Income 138,573 102,446 Foreign Exchange Income 19,685 1,058 Loss on securities (285) (5,197) Other Income 11,967 7,406 Total Other Income 169,940 105,713
Total Income 2,087,430 2,112,969
Operating expenses (897,707) (882,422) Profit before provisions 1,189,723 1,230,547 (Reversal) / provisions and write-offs - net (2,966) 4,939 Profit before taxation 1,192,689 1,225,608 Taxation (465,149) (477,987) Profit after taxation 727,540 747,621
The Bank operates 100 (December 31, 2020: 100) Islamic Banking branches and 187 (December 31, 2020: 187) IslamicBanking windows.
--------- (Rupees in '000) ---------
--------- (Rupees in '000) ---------
December 31, 2020
June 30, 2021
-------(Un-audited)-------
31
NOTES TO AND FORMING PART OF THE UNCONSOLIDATED CONDENSED INTERIM FINANCIAL STATEMENTS (UN-AUDITED)FOR THE SIX MONTHS ENDED JUNE 30, 2021

43Half Yearly Report 2021
NOTES TO AND FORMING PART OF THE UNCONSOLIDATED CONDENSED INTERIM FINANCIAL STATEMENTS (UN-AUDITED)FOR THE SIX MONTHS ENDED JUNE 30, 2021
38.1 Due from Financial Institutions
Musharakah - - - 6,000,000 - 6,000,000Mudarabhah - - - 4,500,000 - 4,500,000
Bai Muajjal:with State Bank of Pakistan - - - 6,433,114 - 6,433,114with other Financial Institution - - - 3,026,018 - 3,026,018
- - - 19,959,132 - 19,959,132
38.2 Investments by segments
Federal Government Securities- Ijarah Sukuks 23,995,452 - 79,348 24,074,800 19,992,452 - (86,052) 19,906,400- Government of Pakistan Mudarabah Pool 1,138,873 - - 1,138,873 466,435 - - 466,435- Bai muajjal with Govt. of Pakistan 38.2.1 31,115,551 - - 31,115,551 29,569,648 - - 29,569,648
56,249,876 79,348 56,329,224 50,028,535 - (86,052) 49,942,483
Non Government Debt Securities - Listed 700,000 - - 700,000 450,000 - - 450,000 - Unlisted 11,509,897 - - 11,509,897 12,337,118 - - 12,337,118
12,209,897 - - 12,209,897 12,787,118 - - 12,787,118 Total Investments 68,459,773 - 79,348 68,539,121 62,815,653 - (86,052) 62,729,601
(Un-audited) (Audited)
38.2.1 Bai Muajjal with Government of Pakistan
Bai Muajjal Investment 33,031,000 33,031,000Less: Deferred Income (1,915,449) (3,461,352)Bai Muajjal Investment - net 31,115,551 29,569,648
38.3 Islamic financing and related assets
Ijarah 442,864 440,754Murabahah 446,893 272,766Musharakah 19,996,158 8,392,690Diminishing Musharakah 14,649,370 6,754,380Istisna 61,507 39,584Islamic Export Refinance scheme - Musharakah 2,839,544 2,989,544Advances against Islamic assets
Advances against Ijarah 24,271 77,190Advances for Diminishing Musharakah 2,953,290 410,595Advances for Murabahah 18,459 33,427Advances agaisnt Mera Pakistan Mera Ghar 77,788 459Advances against Islamic Temporary Economic Refinance Scheme 345,640 - Advances for Istisna Islamic Export Refiance Scheme 452,749 456,623Advances for Istisna 477,763 148,586
Inventory related to Islamic financing - Istisna 329,866 296,918Profit and other receivables against financings 468,886 336,219Gross Islamic financing and related assets 43,585,048 20,649,735
Less: Provision against Islamic financings- Specific (86,441) (90,927)- General (32,901) (20,651)
(119,342) (111,578)Islamic financing and related assets - net of provision 43,465,706 20,538,157
June 30, 2021 (Un-Audited) December 31, 2020 (Audited)
--------------------------------------------------------------- (Rupees in '000) ---------------------------------------------------------------
June 30, 2021 (Un-Audited) December 31, 2020 (Audited)
In Local Currency
In Foreign Currencies Total In Local
CurrencyIn Foreign Currencies Total
December 31, 2020
June 30, 2021
Provision for diminution Surplus Carrying
Value
Cost / Amortised
cost
Provision for diminution Deficit Carrying Value
----------------------------------------------------------------------------------------- (Rupees in '000) -----------------------------------------------------------------------------------------
Cost / Amortised
cost
------------------------------------- (Rupees in '000) -------------------------------------
32
NOTES TO AND FORMING PART OF THE UNCONSOLIDATED CONDENSED INTERIM FINANCIAL STATEMENTS (UN-AUDITED)FOR THE SIX MONTHS ENDED JUNE 30, 2021

44 United Bank Limited
NOTES TO AND FORMING PART OF THE UNCONSOLIDATED CONDENSED INTERIM FINANCIAL STATEMENTS (UN-AUDITED)FOR THE SIX MONTHS ENDED JUNE 30, 2021
(Un-audited) (Audited)
38.4 Deposits and other accounts
CustomersCurrent deposits 49,971,422 40,360,080Savings deposits 17,155,240 18,710,264Term deposits 13,005,500 5,662,065
80,132,162 64,732,409Financial Institutions Current deposits 7,041,091 2,046,933Savings deposits 25,720,413 22,697,263Term deposits 30,306,500 22,001,556
63,068,004 46,745,752143,200,166 111,478,161
38.4.1
(Un-audited) (Audited)
38.5 Contingencies and commitments
- Guarantees 52,598 111,454- Commitments 30,612,610 5,880,112
30,665,208 5,991,566
January - June 2021
January - June 2020
38.6 Profit / Return Earned on Financing, Investments and Placements
Financing 1,012,634 1,069,129Investments 2,921,467 2,648,665Placements 186,654 731,028Rental Income from Ijarah 104,616 157,246
4,225,371 4,606,068
38.7 Profit on Deposits and other Dues Expensed
Deposits and other accounts 2,229,517 2,519,427Due to Financial Institutions 31,075 21,114Return expense on leases 47,289 58,271
2,307,881 2,598,812
(Un-audited) (Audited)
38.8 Islamic Banking Business Unappropriated Profit
Opening Balance 2,974,279 1,407,7361,192,689 2,514,739
Taxation (465,149) (948,196)Closing Balance 3,701,819 2,974,279
June 30, 2021
December 31, 2020
------------------------------------- (Rupees in '000) -------------------------------------
Profit for the period / year
June 30, 2021
December 31, 2020
------------------------------------- (Rupees in '000) -------------------------------------
-------(Un-audited)-------
------------------------------------- (Rupees in '000) -------------------------------------
Deposits eligible to be covered under insurance arrangements amounting to Rs. 30,742.018 million (December 31, 2020:Rs. 31,125.997 million).
June 30, 2021
December 31, 2020
------------------------------------- (Rupees in '000) -------------------------------------
33
NOTES TO AND FORMING PART OF THE UNCONSOLIDATED CONDENSED INTERIM FINANCIAL STATEMENTS (UN-AUDITED)FOR THE SIX MONTHS ENDED JUNE 30, 2021

45Half Yearly Report 2021
NOTES TO AND FORMING PART OF THE UNCONSOLIDATED CONDENSED INTERIM FINANCIAL STATEMENTS (UN-AUDITED)FOR THE SIX MONTHS ENDED JUNE 30, 2021
38.9 Disclosures for profit and loss distribution and pool management
General Pool(s)
IERS Pool(s)
Treasury Pool(s)
Special Pool(s)
Equity Pool(s)
The risk characteristics of pools
The Bank operates general and special pools for deposits and inter-bank funds accepted / acquired under Mudarabah,Wakalah and Musharakah modes.
Under the General deposits pools, the Bank accepts funds on Mudarabah basis from depositors (Rab-ul-Maal) where theBank acts as Manager (Mudarib) and invests the funds in the Shariah Compliant modes of financing, investments andplacements. When utilising investing funds, the Bank prioritizes the funds received from depositors over the fundsgenerated from own sources after meeting the regulatory requirement relating to such deposits.
Specific pools are operated for funds acquired / accepted from the Corporate Customers, other banks and State Bank ofPakistan for liquidity management and Islamic Export Refinance to the Bank's customers respectively under theMusharakah/ Mudarabah / Wakalah modes.
For General Pools, the Bank allocates PKR financing to Corporate, SMEs and Consumer Finance customers in diversifiedsectors and avenues of the economy / business and Investments in Sovereign Guarantee Sukuk, Corporate Sukuk, BaiMuajjal with Government of Pakistan, are also done through General Pools. All remunerative deposits are tagged to thesegeneral pools and their funds generated from the depositors are invested on priority basis.
The IERS pool assets comprise of Sovereign Guarantee Sukuk, and financing to Corporate Customers and exporters asallowed under the applicable laws and regulations, and as such are exposed to lower credit risk. The Musharakah with SBPunder IERS is tagged to the IERS pool.
The Treasury pool assets generally comprise of Sovereign Guarantee Sukuk and financing under Diminishing Musharakah,Ijarah facility and the related liability of the Treasury pool comprise of Musharakah / Wakalah / Mudarabah from financialinstitutions. These pools are created to meet the liquidity requirements of the Holding company.
Separate pool(s) are created where the customers desire to invest in high yield assets. The rate of these pool(s) are higherthan the general pool depending on the assets. In case of loss in special pool, the loss will be borne by the special poolmembers. The net return on the pool is arrived at after deduction of direct costs from the gross return earned on the pool.From the net return, profit is paid to the Mudarib in the ratio of the Mudarib’s equity in the pool to the total pool. Thebalance represents the distributable profit.
All other assets including fixed assets, advance against financing and subsidized financing to Bank's employees are taggedto equity pool. To safeguard the interest of customers, all high risk investments are done through equity pool. The Holdingcompany as Mudarib in the general pools is responsible for financing costs / assets such as land, building, furniture,fixtures, computers and IT system from its own sources / equity.
During the period, the Bank has given General Hiba to the depositors in General and specific pool, keeping in view theprescribed guidelines of Pool Management provided by the SBP. However, Hiba is given at the sole discretion of the Bankwithout any contractual commitment with the depositors.
The Mudarib’s share on Deposits for the period ended June 30, 2021 is Rs.1,580.106 million (45.14% of distributable profitof Mudarabah Pool). of this, an amount of Rs.345.504 million (21.87% of Mudarib share) was distributed back to depositorsas Hiba. The rate of profit earned on average earning assets was 9.12% per annum and the rate of profit paid on averagedeposits was 5.90% per annum.
The risk characteristics of each pool mainly depends on the assets and liability profile of the pool. As per the Bank's policy,relatively low risk / secured financing transactions and assets are allocated to the pool. The Bank maintains General Pools,Special Pools, IERS pool and Equity pool. All pools are exposed to general credit risk, asset ownership risk and Profit raterisk of underlying assets involved.
34
NOTES TO AND FORMING PART OF THE UNCONSOLIDATED CONDENSED INTERIM FINANCIAL STATEMENTS (UN-AUDITED)FOR THE SIX MONTHS ENDED JUNE 30, 2021

46 United Bank Limited
NOTES TO AND FORMING PART OF THE UNCONSOLIDATED CONDENSED INTERIM FINANCIAL STATEMENTS (UN-AUDITED)FOR THE SIX MONTHS ENDED JUNE 30, 2021
The Parameters used for allocation of profit, expenses and provisions to the Pool
- The profit of each deposit pool is calculated on all the remunerative assets booked by utilising the funds from the pool.
-
- No expense of general or administrative nature is charged to the pools.
-
-
-
The Bank managed following pools during the period.
% % Rupees in '000 % % Rupees in '000ADMA Pools 6 Mudarbaha Monthly 7.17% 48.62% 22,917 6% 52.79% 12,099 Special Pools 60 Mudarbaha Monthly 8.51% 34.91% 391,978 6.73% 38.12% 149,437 IERS Pools 12 Musharkah Monthly 6.40% 84.19% 166,621 2.00% 0.00% - FCY Pools 6 Mudarbaha Monthly 1.75% 50.00% 788 1.06% 0.00% - General Pools 6 Mudarbaha Monthly 9.46% 50.00% 1,165,211 5.48% 15.79% 183,968
% % Rupees in '000 % % Rupees in '000ADMA Pools 6 Mudarabah Monthly 5.29% 50.00% 3,713 3% 16.55% 615 Special Pools 60 Mudarabah Monthly 12.45% 28.45% 355,547 9.94% 31.50% 112,006 IERS Pools 12 Musharkah Monthly 4.94% 86.89% 139,090 2.00% 0.00% - General Pools 6 Mudarabah Monthly 11.90% 50.00% 1,087,379 7.71% 29.62% 322,032
(Un-audited) (Audited)
38.10 Deployment of Mudarabah based deposits by class of business
Chemical and pharmaceuticals 2,484,304 2,230,052Agri business 20,437,489 8,745,482Textile 2,380,905 1,991,142Financial 3,952,240 13,335,120Food industries 307,494 318,037Plastic 299,229 299,263Individuals 6,847,823 1,981,422Production and Transmission of energy 18,742,631 13,496,129Government of Pakistan Securities 56,329,223 59,401,615Others 3,746,145 3,817,471
115,527,483 105,615,733
Profit of pool is calculated after deduction of expenses directly incurred in earning the income of such pool, the directlyrelated costs comprise of depreciation on ijarah assets, takaful premium, amortisation of premium on investment etc.
No provisions against any non-performing asset of the pool is passed on to the pool except on the actual loss / write-offof such non-performing asset.
For the six months period ended June 30, 2021 (Un-Audited)
No of Pools
Mudarib fee / Musharakah
share / Wakalah Fee
Average profit rate /
return distributed
Amount of Mudarib share
transferred through Hiba
Nature of Pool
Profit rate and weightages announce-
ment period
Average profit rate
earned
Profit Sharing ratio
Percentage of Mudarib share
transferred through Hiba
For the six months period ended June 30, 2020 (Un-Audited)
No of Pools
-------Rupees in '000-----
June 30, 2021
December 31, 2020
Nature of Pool
Percentage of Mudarib share
transferred through Hiba
Average profit rate /
return distributed
Amount of Mudarib share
transferred through Hiba
Profit rate and weightages announce-
ment period
Average profit rate
earned
Profit Sharing ratio
Mudarib fee / Musharakah
share / Wakalah Fee
The profit of the pool is shared between equity and Rab-ul-Maal of the pool on the basis of Musharakah at gross level(before charging of mudarib fee) as per the investment ratio of the equity.
The profit of the pool is shared among the members of the pool on pre-defined mechanism based on the weightagesannounced before the profit calculation period after charging of mudarib fee.
35
NOTES TO AND FORMING PART OF THE UNCONSOLIDATED CONDENSED INTERIM FINANCIAL STATEMENTS (UN-AUDITED)FOR THE SIX MONTHS ENDED JUNE 30, 2021

47Half Yearly Report 2021
Aameer KarachiwallaChief Financial Of�cer
Shazad G. DadaPresident &
Chief Executive Of�cer
Shazia Syed Director
Arshad Ahmad Mir Director
Sir Mohammed Anwar Pervez, OBE, HPkChairman
NOTES TO AND FORMING PART OF THE UNCONSOLIDATED CONDENSED INTERIM FINANCIAL STATEMENTS (UN-AUDITED)FOR THE SIX MONTHS ENDED JUNE 30, 2021
39. NON-ADJUSTING EVENT AFTER THE BALANCE SHEET DATE
40. GENERAL
40.1 Comparatives
40.2 Figures have been rounded off to the nearest thousand rupees unless otherwise stated.
41. DATE OF AUTHORISATION
Aameer Karachiwalla Shazad G. Dada Shazia Syed Arshad Ahmad Mir Sir Mohammed Anwar Pervez, OBE, HPk Chief Financial Officer President & Director Director Chairman Chief Executive Officer
Comparative information has been reclassified, rearranged or additionally incorporated in these unconsolidated condensedinterim financial statements for the purposes of better presentation.
These unconsolidated condensed interim financial statements were authorised for issue on August 06, 2021 by the Boardof Directors of the Bank.
The Board of Directors in its meeting held on August 06, 2021 has declared an interim cash dividend in respect of quarterended June 30, 2021 of Rs. 4.0 per share (June 30, 2020: Rs. nil per share). These unconsolidated condensed interimfinancial statements for the six months ended June 30, 2021 do not include the effect of these appropriations which will beaccounted for subsequent to the period end.
36
NOTES TO AND FORMING PART OF THE UNCONSOLIDATED CONDENSED INTERIM FINANCIAL STATEMENTS (UN-AUDITED)FOR THE SIX MONTHS ENDED JUNE 30, 2021


CONSOLIDATED CONDENSEDINTERIM FINANCIAL STATEMENTS
FOR THE SIX MONTHS ENDEDJUNE 30, 2021(UN-AUDITED)
49Half Yearly Report 2021

50 United Bank Limited
CONSOLIDATED CONDENSED INTERIM STATEMENT OF FINANCIAL POSITIONAS AT JUNE 30, 2021
(Un-audited) (Audited)June 30, December 31,
2021 2020
ASSETS
Cash and balances with treasury banks 6 254,633,806 258,139,459Balances with other banks 7 27,823,406 29,583,028Lendings to financial institutions 8 24,841,054 22,212,442Investments 9 1,483,817,074 1,167,803,512Advances 10 655,963,045 611,851,676Fixed assets 11 57,494,619 57,467,580Intangible assets 12 1,929,970 2,034,551Deferred tax assets 13 4,589,903 4,682,494Other assets 15 37,015,321 48,101,456
2,548,108,198 2,201,876,198 LIABILITIES
Bills payable 17 31,820,615 29,741,206Borrowings 18 271,806,301 131,827,185Deposits and other accounts 19 1,966,747,082 1,764,392,286Liabilities against assets subject to finance lease 20 13,041 15,957Subordinated debt 21 10,000,000 10,000,000Deferred tax liabilities 13 - - Other liabilities 22 62,899,704 58,267,678
2,343,286,743 1,994,244,312
NET ASSETS 204,821,455 207,631,886
REPRESENTED BY:Share capital 12,241,797 12,241,797Reserves 71,513,938 71,020,586Surplus on revaluation of assets 23 29,021,641 29,334,212Unappropriated profit 84,508,037 87,527,909Total equity attributable to the equity holders of the Bank 197,285,413 200,124,504
Non-controlling interest 7,536,042 7,507,382204,821,455 207,631,886
CONTINGENCIES AND COMMITMENTS 24
The annexed notes 1 to 43 form an integral part of these consolidated condensed interim financial statements.
Aameer Karachiwalla Shazad G. Dada Shazia Syed Arshad Ahmad Mir Sir Mohammed Anwar Pervez, OBE, HPkChief Financial Officer President & Director Director Chairman Chief Executive Officer
------------------------------------------ (Rupees in '000) ------------------------------------------
Note
Aameer KarachiwallaChief Financial Of�cer
Shazad G. DadaPresident &
Chief Executive Of�cer
Shazia Syed Director
Arshad Ahmad Mir Director
Sir Mohammed Anwar Pervez, OBE, HPkChairman
CONSOLIDATED CONDENSED INTERIM STATEMENT OF FINANCIAL POSITIONAS AT JUNE 30, 2021

51Half Yearly Report 2021
CONSOLIDATED CONDENSED INTERIM PROFIT AND LOSS ACCOUNT (UN-AUDITED)FOR THE SIX MONTHS ENDED JUNE 30, 2021
Note April - June 2021
April - June 2020
January - June 2021
January - June 2020
Mark-up / return / interest earned 26 36,873,518 44,068,763 69,804,068 88,442,946Mark-up / return / interest expensed 27 18,044,127 21,789,072 33,469,771 48,373,814Net mark-up / interest income 18,829,391 22,279,691 36,334,297 40,069,132
Non mark-up / interest incomeFee and commission income 28 3,651,729 2,642,479 7,121,063 6,152,592Dividend income 182,866 218,133 435,072 395,832Foreign exchange income 736,225 1,050,376 1,260,733 1,821,352Income / (loss) from derivatives 1,504 (2,234) 8,758 (13,508)Gain on securities - net 29 709,535 400,209 2,583,607 858,261Other income 30 58,722 314,350 186,607 488,949Total non mark-up / interest income 5,340,581 4,623,313 11,595,840 9,703,478Total income 24,169,972 26,903,004 47,930,137 49,772,610
Non mark-up / interest expensesOperating expenses 31 11,008,395 10,631,755 21,793,028 20,946,569Workers' Welfare Fund 273,358 283,511 521,852 502,933Other charges 32 14,947 (28,706) 39,494 152,333Total non mark-up / interest expenses 11,296,700 10,886,560 22,354,374 21,601,835
Share of profit of associates 72,784 191,665 224,786 44,129Profit before provisions 12,946,056 16,208,109 25,800,549 28,214,904(Reversals) / provisions and write-offs - net 33 (534,265) 6,251,277 (157,933) 9,952,594Profit before taxation from continuing operations 13,480,321 9,956,832 25,958,482 18,262,310
Taxation 34 6,127,353 4,125,432 11,019,580 7,525,752
Profit after taxation from continuing operations 7,352,968 5,831,400 14,938,902 10,736,558
Discontinued operations
Profit / (loss) from discontinued operations - net of tax 14 106,507 (16,776) 106,474 (10,271)
Profit after taxation 7,459,475 5,814,624 15,045,376 10,726,287
Attributable to:Equity holders of the Bank
from continuing operations 7,282,454 6,085,264 14,881,184 10,956,381 from discontinued operations 106,507 (16,776) 106,474 (10,271)
7,388,961 6,068,488 14,987,658 10,946,110Non-controlling interest 70,514 (253,864) 57,718 (219,823)
7,459,475 5,814,624 15,045,376 10,726,287
Earnings per share for profit from continuing operations attributable to the ordinary equity holders of the Bank
Basic and diluted 5.95 4.97 12.16 8.95
Earnings per share for profit attributable to the ordinary equity holders of the Bank
Basic and diluted 35 6.04 4.96 12.24 8.94
The annexed notes 1 to 43 form an integral part of these consolidated condensed interim financial statements.
Aameer Karachiwalla Shazad G. Dada Shazia Syed Arshad Ahmad Mir Sir Mohammed Anwar Pervez, OBE, HPkChief Financial Officer President & Director Director Chairman Chief Executive Officer
------------------------------------ (Rupees) ------------------------------------
------------------------------------ (Rupees in '000) ------------------------------------
Aameer KarachiwallaChief Financial Of�cer
Shazad G. DadaPresident &
Chief Executive Of�cer
Shazia Syed Director
Arshad Ahmad Mir Director
Sir Mohammed Anwar Pervez, OBE, HPkChairman
CONSOLIDATED CONDENSED INTERIM PROFIT AND LOSS ACCOUNT (UN-AUDITED)FOR THE SIX MONTHS ENDED JUNE 30, 2021

52 United Bank Limited
CONSOLIDATED CONDENSED INTERIM STATEMENT OF COMPREHENSIVE INCOME (UN-AUDITED)FOR THE SIX MONTHS ENDED JUNE 30, 2021
April - June 2021
April - June 2020
January - June 2021
January - June 2020
Profit after tax for the period attributable to:Equity holders of the Bank
from continuing operations 7,282,454 6,085,264 14,881,184 10,956,381 from discontinued operations 106,507 (16,776) 106,474 (10,271)
7,388,961 6,068,488 14,987,658 10,946,110 Non-controlling interest 70,514 (253,864) 57,718 (219,823)
7,459,475 5,814,624 15,045,376 10,726,287 Other comprehensive income
Items that may be reclassified to profit and loss account in subsequent periods
Effect of translation of net investment in foreign branches and subsidiariesEquity holders of the Bank 1,732,696 331,151 (1,014,132) 3,551,806 Non-controlling interest 200,456 (748,363) 98,623 83,099
1,933,152 (417,212) (915,509) 3,634,905 Movement in deficit on revaluation of investments - net of tax
Equity holders of the Bank 1,345,037 8,666,397 (203,998) 1,833,004 Non-controlling interest 5,983 698,613 (55,601) (65,869)
1,351,020 9,365,010 (259,599) 1,767,135 3,284,172 8,947,798 (1,175,108) 5,402,040
Items that will not be reclassified to profit and loss account in subsequent periods
Remeasurement loss of defined benefit obligations - net of tax - (835,581) - (1,355,438)
Movement in surplus on revaluation of fixed assets - net of taxEquity holders of the Bank (18,271) (60,788) (82,412) (70,034) Non-controlling interest (16,119) (49,697) (68,229) (58,631)
(34,390) (110,485) (150,641) (128,665)
Movement in surplus / (deficit) on revaluation of non-banking assets - net of tax 219 (920) 219 (921)
(34,171) (946,986) (150,422) (1,485,024)
Total comprehensive income for the period 10,709,476 13,815,436 13,719,846 14,643,303
Attributable to:Equity holders of the Bank
from continuing operations 10,342,135 14,185,523 13,580,861 14,914,798 from discontinued operations 106,507 (16,776) 106,474 (10,271)
10,448,642 14,168,747 13,687,335 14,904,527 Non-controlling interest 260,834 (353,311) 32,511 (261,224)
10,709,476 13,815,436 13,719,846 14,643,303
The annexed notes 1 to 43 form an integral part of these consolidated condensed interim financial statements.
Aameer Karachiwalla Shazad G. Dada Shazia Syed Arshad Ahmad Mir Sir Mohammed Anwar Pervez, OBE, HPkChief Financial Officer President & Director Director Chairman Chief Executive Officer
------------------------------------ (Rupees in '000) ------------------------------------
Aameer KarachiwallaChief Financial Of�cer
Shazad G. DadaPresident &
Chief Executive Of�cer
Shazia Syed Director
Arshad Ahmad Mir Director
Sir Mohammed Anwar Pervez, OBE, HPkChairman
CONSOLIDATED CONDENSED INTERIM STATEMENT OF COMPREHENSIVE INCOME (UN-AUDITED)FOR THE SIX MONTHS ENDED JUNE 30, 2021

53Half Yearly Report 2021
CONSOLIDATED CONDENSED INTERIM STATEMENT OF CHANGES IN EQUITY FOR THE SIX MONTHS ENDED JUNE 30, 2021
Balance as at December 31, 2019 (Audited) 12,241,797 3,000 33,288,783 33,384,629 189,482 27,184,005 31,071 77,335,249 183,658,016 7,213,855 190,871,871Total comprehensive income for the six months
ended June 30, 2020Profit after taxation for the six months
ended June 30, 2020 - - - - - - - 10,946,110 10,946,110 (219,823) 10,726,287Other comprehensive income - net of tax - - - 3,551,806 1,833,004 (70,034) (921) (1,355,438) 3,958,417 (41,401) 3,917,016Total comprehensive income for the six months
ended June 30, 2020 - - - 3,551,806 1,833,004 (70,034) (921) 9,590,672 14,904,527 (261,224) 14,643,303Ordinary dividend relating to non-controlling shareholders - - - - - - - - - (2,260) (2,260)Transfer from surplus on revaluation on disposal
to unappropriated profit - net of tax - - - - - (110,838) (13,897) 124,735 - - - Transfer from surplus on revaluation of fixed assets
to unappropriated profit - net of tax - - - - - (26,274) - 26,274 - - - Transfer to statutory reserve - - 1,159,938 - - - - (1,159,938) - - - Transactions with owners for the six months ended
June 30, 2020Final cash dividend - December 31, 2019 declared
subsequent to the year end at Rs. 4.0 per share - - - - - - - (4,896,719) (4,896,719) - (4,896,719)Interim cash dividend - March 31, 2020 declared
at Rs. 2.5 per share - - - - - - - (3,060,449) (3,060,449) - (3,060,449)Balance as at June 30, 2020 (Un-audited) 12,241,797 3,000 34,448,721 36,936,435 2,022,486 26,976,859 16,253 77,959,824 190,605,375 6,950,371 197,555,746Total comprehensive income for the six months
ended December 31, 2020Profit after taxation for the six months
ended December 31, 2020 - - - - - - - 9,991,808 9,991,808 70,439 10,062,247Other comprehensive income - net of tax - - - (1,318,227) 288,190 77,951 - 479,407 (472,679) 486,572 13,893Total comprehensive income for the six months
ended December 31, 2020 - - - (1,318,227) 288,190 77,951 - 10,471,215 9,519,129 557,011 10,076,140Transfer from surplus on revaluation on disposal
to unappropriated profit - net of tax - - - - - (5,508) (15,340) 20,848 - - - Transfer from surplus on revaluation of fixed assets
to unappropriated profit - net of tax - - - - - (26,679) - 26,679 - - - Transfer to statutory reserve - - 950,657 - - - - (950,657) - - - Transactions with owners for the six months
ended December 31, 2020Balance as at December 31, 2020 (Audited) 12,241,797 3,000 35,399,378 35,618,208 2,310,676 27,022,623 913 87,527,909 200,124,504 7,507,382 207,631,886Total comprehensive income for the six months
ended June 30, 2021Profit after taxation for the six months
ended June 30, 2021 - - - - - - - 14,987,658 14,987,658 57,718 15,045,376Other comprehensive income - net of tax - - - (1,014,132) (203,998) (82,412) 219 - (1,300,323) (25,207) (1,325,530)Total comprehensive income for the six months
ended June 30, 2021 - - - (1,014,132) (203,998) (82,412) 219 14,987,658 13,687,335 32,511 13,719,846Ordinary dividend relating to non-controlling shareholders - - - - - - - - - (3,851) (3,851)Transfer from surplus on revaluation on disposal to
unappropriated profit - net of tax - - - - - (2,641) - 2,641 - - - Transfer from surplus on revaluation of fixed assets
to unappropriated profit - net of tax - - - - - (23,739) - 23,739 - - - Transfer to statutory reserve - - 1,507,484 - - - - (1,507,484) - - - Transactions with owners for the six months ended
June 30, 2021Final cash dividend - December 31, 2020 declared
subsequent to the year end at Rs. 9.5 per share - - - - - - - (11,629,707) (11,629,707) - (11,629,707)Interim cash dividend - March 31, 2021 declared
at Rs. 4.0 per share - - - - - - - (4,896,719) (4,896,719) - (4,896,719)Balance as at June 30, 2021 (Un-audited) 12,241,797 3,000 36,906,862 34,604,076 2,106,678 26,913,831 1,132 84,508,037 197,285,413 7,536,042 204,821,455
The annexed notes 1 to 43 form an integral part of these consolidated condensed interim financial statements.
Aameer Karachiwalla Shazad G. Dada Shazia Syed Arshad Ahmad Mir Sir Mohammed Anwar Pervez, OBE, HPkChief Financial Officer President & Director Director Chairman Chief Executive Officer
---------------------------------------------------------------------------------------- (Rupees in '000) ----------------------------------------------------------------------------------------
Attributable to equity shareholders of the BankNon-
controlling Interest
TotalShare Capital
General reserve
Statutory reserve
Capital reserve - Exchange translation
Unappro-priated profit Sub total
Investments Fixed Assets
Non Banking Assets
Surplus / (Deficit) on revaluation of
Aameer KarachiwallaChief Financial Of�cer
Shazad G. DadaPresident &
Chief Executive Of�cer
Shazia Syed Director
Arshad Ahmad Mir Director
Sir Mohammed Anwar Pervez, OBE, HPkChairman
CONSOLIDATED CONDENSED INTERIM STATEMENT OF CHANGES IN EQUITYFOR THE SIX MONTHS ENDED JUNE 30, 2021

54 United Bank Limited
CONSOLIDATED CONDENSED INTERIM CASH FLOW STATEMENT (UN-AUDITED)FOR THE SIX MONTHS ENDED JUNE 30, 2021
January - June 2021
January - June 2020
CASH FLOW FROM OPERATING ACTIVITIESProfit before taxation including discontinued operations 26,101,479 18,251,089Less: Dividend income (435,072) (395,832)
Share of profit of associates (224,786) (44,129) 25,441,621 17,811,128
Adjustments:Depreciation on fixed assets 1,443,566 1,410,119 Depreciation on Islamic financing against leased assets (Ijarah) 84,917 124,174 Depreciation on right-of-use assets 924,501 977,682 Amortisation 420,674 418,805 Workers' Welfare Fund 521,852 502,933 Provision for retirement benefits 363,183 587,684 Provision for compensated absences 86,226 99,118 Provision against loans and advances - net 458,384 9,329,874 (Reversal) / provision for diminution in value of investments - net (833,915) 86,153 (Reversal) / provision against off balance sheet items (330,661) 214,965 Interest expense on lease liability against right-of-use assets 474,784 584,330 Gain on sale of fixed assets - net (4,298) (47,109) Gain on sale of ijarah assets - net (3,222) (548) Gain on sale of non-banking asset - (223,054)Bad debts written off directly 62,944 39,487 Unrealised gain on revaluation of investments classified as held for trading (5,006) (14,504) Other provisions / write-offs 485,315 282,115
4,149,244 14,372,224 29,590,865 32,183,352
(Increase) / decrease in operating assetsLendings to financial institutions (2,628,612) 8,856,822 Held for trading securities (62,052,548) 62,512,826 Advances (44,735,979) 37,100,744 Other assets (excluding advance taxation) 4,772,253 2,984,398
(104,644,886) 111,454,790 Increase in operating liabilitiesBills payable 2,079,409 4,298,168 Borrowings 139,979,116 (6,803,391) Deposits and other accounts 202,354,796 134,869,427 Other liabilities (excluding current taxation) 2,567,152 (12,299,630)
346,980,473 120,064,574 271,926,452 263,702,716
Payments on account of staff retirement benefits (1,625,581) (1,437,990) Income taxes paid (4,994,029) (1,312,720) Net cash flow generated from operating activities 265,306,842 260,952,006
CASH FLOW FROM INVESTING ACTIVITIESNet investments in available for sale securities (196,220,533) (268,965,808) Net investments in held to maturity securities (56,726,000) 28,091,919 Net investments in associates (216,560) 502,479 Dividend income received 545,593 433,287 Investment in fixed assets and intangible assets (2,115,852) (1,700,152) Sale proceeds from disposal of fixed assets 105,319 163,871Sale proceeds from disposal of ijarah assets 21,587 952 Exchange differences on translation of net investment in
foreign branches and subsidiaries attributable to:- Equity holders of the Bank (1,014,132) 3,551,806 - Non-controlling interest 98,623 83,099
Net cash flow used in investing activities (255,521,955) (237,838,547)
CASH FLOW FROM FINANCING ACTIVITIESLease obligations 2,916 (239) Payment of lease liability against right-of-use assets (1,195,507) (1,006,745) Dividends paid to:
- Equity holders of the Bank (13,853,720) (6,494,483) - Non-controlling interest (3,851) (2,260)
Net cash flow used in financing activities (15,050,162) (7,503,727)
Decrease in cash and cash equivalents during the period (5,265,275) 15,609,732
Cash and cash equivalents at the beginning of the period 287,722,487 286,329,378
Cash and cash equivalents at the end of the period 282,457,212 301,939,110
The annexed notes 1 to 43 form an integral part of these consolidated condensed interim financial statements.
Aameer Karachiwalla Shazad G. Dada Shazia Syed Arshad Ahmad Mir Sir Mohammed Anwar Pervez, OBE, HPkChief Financial Officer President & Director Director Chairman Chief Executive Officer
----------- (Rupees in '000) -----------
Aameer KarachiwallaChief Financial Of�cer
Shazad G. DadaPresident &
Chief Executive Of�cer
Shazia Syed Director
Arshad Ahmad Mir Director
Sir Mohammed Anwar Pervez, OBE, HPkChairman
CONSOLIDATED CONDENSED INTERIM CASH FLOW STATEMENT (UN-AUDITED)FOR THE SIX MONTHS ENDED JUNE 30, 2021

55Half Yearly Report 2021
NOTES TO THE CONSOLIDATED CONDENSED INTERIM FINANCIAL STATEMENTS (UN-AUDITED)FOR THE SIX MONTHS ENDED JUNE 30, 2021
1. STATUS AND NATURE OF BUSINESS
The Group consists of:
Holding Company- United Bank Limited ("the Bank")
Subsidiary Companies- United National Bank Limited, United Kingdom ("UBL UK") - 55% holding- UBL (Switzerland) AG, Switzerland ("USAG") - 100% holding- UBL Bank (Tanzania) Limited, Tanzania ("UBTL") - 100% holding- United Executors and Trustees Company Limited, Pakistan ("UET") - 100% holding- UBL Fund Managers Limited, Pakistan ("UBL FM") - 98.87% holding- Al Ameen Financial Services (Private) Limited ("AFSL") - 98.87% effective holding
2. BASIS OF PRESENTATION
The shareholders of the Bank have approved the decision to voluntarily and orderly wind up UBL (Switzerland) AG, a whollyowned subsidiary of the Bank in the Extra Ordinary General Meeting (EOGM) of shareholders held on August 06, 2021. Thisdecision is in line with the Bank’s strategy to exit from non-core markets. The winding up is subject to fulfilment of relevant legaland regulatory requirements both in Pakistan and Switzerland.
The Group is engaged in commercial banking, asset management, investment advisory and investments business. UnitedBank Limited ("the Bank") is a banking company incorporated in Pakistan and is engaged in commercial banking and relatedservices. The Bank's registered office and principal office are situated at UBL Building, Jinnah Avenue, Blue Area, Islamabadand at UBL Head Office, I. I. Chundrigar Road, Karachi respectively. The Bank operates 1,348 (December 31, 2020: 1,356)branches inside Pakistan including 100 (December 31, 2020: 100) Islamic Banking branches and 2 (December 31, 2020: 2)branches in Export Processing Zones. The Bank also operates 13 (December 31, 2020: 14) branches outside Pakistan.
The Bank's ordinary shares are listed on Pakistan Stock Exchange. Its Global Depository Receipts (GDRs) are on the list of theUK Listing Authority and the London Stock Exchange Professional Securities Market. These GDRs are also eligible for tradingon the International Order Book System of the London Stock Exchange. Further, the GDRs constitute an offering in the UnitedStates only to qualified institutional buyers in reliance on Rule 144A under the US Securities Act of 1933 and an offeringoutside the United States in reliance on Regulation S.
Non-controlling interest represents National Bank of Pakistan's 45% share in the net asset value of UBL UK and 1.13% sharesheld by past and present employees of UBL FM in the net asset value of UBL FM.
In accordance with the directives of the Federal Government regarding the shifting of the banking system to Islamic modes,SBP has issued various circulars from time to time. Permissible forms of trade-related modes of financing includes purchase ofgoods by banks from customers and immediate resale to them at appropriate mark-up in price on deferred payment basis. Thepurchase and resale arising under these arrangements are not reflected in these consolidated financial statements as such, but are restricted to the amount of facility actually utilised and the appropriate portion of mark-up thereon. However, the IslamicBanking branches of the Bank have complied with the requirements set out under the Islamic Financial Accounting Standards(IFAS), issued by the Institute of Chartered Accountants of Pakistan (ICAP) as are notified under the provisions of CompaniesAct, 2017.
Key financial figures of the Islamic Banking branches are disclosed in note 40 to these consolidated condensed interimfinancial statements.
These consolidated financial statements have been prepared in conformity with the format of financial statements prescribedby the State Bank of Pakistan (SBP) vide BPRD Circular Letter No. 5 dated March 22, 2019.
The shareholders of the Bank, in their annual general meeting held on March 27, 2020, resolved to wind up “United Executorsand Trustees Company Limited”, a wholly owned subsidiary of the Bank. Accordingly, a special resolution was passed onMarch 19, 2021 by the shareholders of “United Executors and Trustees Company Limited” to appoint liquidators and voluntarilywind up the company. The liquidators will conclude the process of voluntary winding-up as per the requirements of applicablelaws and regulations.
The Bank was a subsidiary of Bestway (Holdings) Limited which is a wholly owned subsidiary of Bestway Group Limitedincorporated in United Kingdom.
The aforementioned transfer of shareholding did not have any effect on the ultimate beneficial ownership of the Bank.
During the period, an internal reorganization exercise was undertaken by the Bestway Group by virtue of which Bestway(Holdings) Limited has transferred its entire shareholding of 51.6 percent in the Bank to a new Company “Bestway InternationalHoldings Limited” (BIHL) on March 19, 2021. BIHL is a wholly owned subsidiary of the newly incorporated Bestway GroupLimited (BGL). Both BIHL and BGL have been incorporated in Guernsey.
7
NOTES TO THE CONSOLIDATED CONDENSED INTERIM FINANCIAL STATEMENTS (UN-AUDITED)FOR THE SIX MONTHS ENDED JUNE 30, 2021

56 United Bank Limited
NOTES TO THE CONSOLIDATED CONDENSED INTERIM FINANCIAL STATEMENTS (UN-AUDITED)FOR THE SIX MONTHS ENDED JUNE 30, 2021
3. STATEMENT OF COMPLIANCE
3.1
-
-
- Provisions of and directives issued under the Banking Companies Ordinance, 1962;- Provisions of and directives issued under the Companies Act, 2017; and-
3.2
3.3
3.4
3.5 Standards, interpretations and amendments to approved accounting standards that are effective in the current period
3.6 Standards, interpretations and amendments to approved accounting standards that are not yet effective
4. SIGNIFICANT ACCOUNTING POLICIES AND FINANCIAL RISK MANAGEMENT
4.1
4.2 The financial risk management objectives and policies adopted by the Group are consistent with those disclosed in theconsolidated financial statements for the year ended December 31, 2020.
The accounting policies adopted in the preparation of these consolidated condensed interim financial statements are consistentwith those applied in the preparation of the consolidated financial statements of the Group for the year ended December 31,2020.
There are certain other new amendments that are mandatory for the Bank's accounting periods beginning on or after January1, 2022, but are considered not to be relevant or will not have any significant effect on the Bank's operations and are, therefore,not detailed in these unconsolidated financial statements.
IFRS 9 has been applicable in several overseas jurisdictions from January 1, 2018. Accordingly, the requirements of thisstandard are incorporated in the Group’s consolidated financial statements for the jurisdictions where IFRS 9 has beenadopted. As per the SBP's BPRD Circular Letter no. 24 dated July 05, 2021, the implementation of IFRS 9 to banks in Pakistanhas been deferred to accounting periods beginning on or after January 1, 2022. Meanwhile, the banks are required to submitIFRS 9 compatiable pro forma financial statements for year ending December 31, 2021 and perform parallel run of IFRS 9 onquarterly basis. Further, the SBP will provide a timeline by December 2021 for absorption of "Expected Credit Loss" (ECL), forCapital Adequacy Ratio (CAR) purposes, after assessment / evaluation of pro forma financial statements.
These consolidated condensed interim financial statements of the Group have been prepared in accordance with theaccounting and reporting standards as applicable in Pakistan. These comprise of:
Interim Financial Reporting Standards (IFRSs) issued by the International Accounting Standards Board (IASB) as notifiedunder the Companies Act, 2017;Islamic Financial Accounting Standards (IFAS) issued by the Institute of Chartered Accountants of Pakistan as arenotified under the Companies Act, 2017;
Wherever the requirements of the Banking Companies Ordinance, 1962, the Companies Act, 2017 or the directives issued bythe SBP and the SECP differ with the requirements of IFRS or IFAS, the requirements of the Banking Companies Ordinance,1962, the Companies Act, 2017 and the said directives prevail.
The SBP vide BSD Circular Letter No. 10, dated August 26, 2002, has deferred the applicability of International AccountingStandard 39, Financial Instruments: Recognition and Measurement and International Accounting Standard 40, InvestmentProperty for banking companies till further instructions. Moreover, SBP vide BPRD Circular No. 4, dated February 25, 2015,has deferred the applicability of Islamic Financial Accounting Standards (IFAS) 3, Profit and Loss Sharing on Deposits. Further,according to the notification of the SECP issued vide SRO 411(I)/2008 dated April 28, 2008, International Financial ReportingStandard (IFRS) 7, Financial Instruments: Disclosures has not been made applicable for banks. Accordingly, the requirementsof these standards have not been considered in the preparation of these consolidated condensed interim financial statements.However, investments have been classified and valued in accordance with the requirements of various circulars issued by theSBP.
Directives issued by the State Bank of Pakistan (SBP) and the Securities and Exchange Commission of Pakistan (SECP).
SECP vide its notification SRO 633 (I)/2014 dated July 10, 2014, adopted IFRS 10 effective from the periods starting from 30June 2014. However, vide its notification SRO 56 (I)/2016 dated January 28, 2016, it has been notified that the requirements ofIFRS 10 and section 228 of the Companies Act, 2017 will not be applicable with respect to the investment in mutual fundsestablished under Trust structure.
The disclosures made in these consolidated condensed interim financial statements have been limited based on a formatprescribed by the SBP vide BPRD Circular Letter No. 5 dated March 22, 2019, and IAS 34, Interim Financial Reporting. Theydo not include all the disclosures required for annual financial statements, and these consolidated condensed interim financialstatements should be read in conjunction with the consolidated financial statements of the Group for the year ended December31, 2020.
There are certain amendments to existing accounting and reporting standards that have become applicable to the Bank foraccounting periods beginning on or after January 1, 2021. These are either considered to not be relevant or do not have anysignificant impact on these unconsolidated financial statements.
8
NOTES TO THE CONSOLIDATED CONDENSED INTERIM FINANCIAL STATEMENTS (UN-AUDITED)FOR THE SIX MONTHS ENDED JUNE 30, 2021

57Half Yearly Report 2021
NOTES TO THE CONSOLIDATED CONDENSED INTERIM FINANCIAL STATEMENTS (UN-AUDITED)FOR THE SIX MONTHS ENDED JUNE 30, 2021
5.
5.1
5.2 Critical accounting estimates and judgements
(Un-audited) (Audited)June 30, December 31,
6. CASH AND BALANCES WITH TREASURY BANKS 2021 2020
In handLocal currency 17,617,717 20,776,101Foreign currencies 7,666,726 12,160,057
25,284,443 32,936,158With State Bank of Pakistan in
Local currency current accounts 72,133,793 75,604,954Foreign currency current accounts 4,531,712 4,420,727Foreign currency deposit accounts 8,123,863 7,767,517
84,789,368 87,793,198With other central banks in
Foreign currency current accounts 36,470,411 36,040,406Foreign currency deposit accounts 8,085,347 6,869,307
44,555,758 42,909,713With National Bank of Pakistan in local currency current accounts 96,326,585 92,628,531Prize Bonds 3,677,652 1,871,859
254,633,806 258,139,4597. BALANCES WITH OTHER BANKS
In PakistanIn current accounts 17 - In deposit accounts 3,001,068 2,015,383
3,001,085 2,015,383 Outside Pakistan
In current accounts 14,024,173 19,102,946 In deposit accounts 10,798,148 8,464,699
24,822,321 27,567,645 27,823,406 29,583,028
8. LENDINGS TO FINANCIAL INSTITUTIONS
Call / clean money lending 97,854 10,624,519 Repurchase agreement lendings (Reverse Repo) 21,734,325 - Bai Muajjal receivable
- with State Bank of Pakistan - 6,433,114 - with other financial institutions - 3,026,018
Other lendings to financial institutions 3,008,875 2,128,791 24,841,054 22,212,442
------- (Rupees in '000) -------
These consolidated condensed interim financial statements have been prepared under the historical cost convention exceptthat certain operating fixed assets / non-banking assets acquired in satisfaction of claims have been stated at revaluedamounts, certain investments and derivative financial instruments have been stated at fair value and net obligations in respectof defined benefit schemes are carried at their present values.
The preparation of these consolidated condensed interim financial statements in conformity with the accounting and reportingstandards requires management to make judgments, estimates and assumptions that affect the reported amounts of assetsand liabilities and income and expenses. It also requires management to exercise judgment in the application of its accountingpolicies. The estimates and assumptions are based on historical experience and various other factors that are believed to bereasonable under the circumstances. These estimates and assumptions are reviewed on an ongoing basis. Revisions toaccounting estimates are recognised in the period in which the estimate is revised if the revision affects only that period, or inthe period of revision and future periods if the revision affects both current and future periods.
The significant judgments made by management in applying its accounting policies and the key sources of estimationuncertainty were the same as those applied to the consolidated financial statements of the Group for the year ended December31, 2020.
BASIS OF MEASUREMENT
9
NOTES TO THE CONSOLIDATED CONDENSED INTERIM FINANCIAL STATEMENTS (UN-AUDITED)FOR THE SIX MONTHS ENDED JUNE 30, 2021

58 United Bank Limited
NOTES TO THE CONSOLIDATED CONDENSED INTERIM FINANCIAL STATEMENTS (UN-AUDITED)FOR THE SIX MONTHS ENDED JUNE 30, 2021
9. INVESTMENTS
9.1 Investments by type
Held for trading securitiesMarket Treasury Bills 65,066,792 - 5,006 65,071,798 3,009,238 - 228 3,009,466
Available for sale securitiesMarket Treasury Bills 568,391,131 - 245,214 568,636,345 341,885,979 - 238,363 342,124,342Pakistan Investment Bonds - fixed 43,914,994 - (77,655) 43,837,339 76,334,054 - 333,950 76,668,004Pakistan Investment Bonds - floaters 365,457,101 - (1,286,525) 364,170,576 340,678,646 - (2,569,332) 338,109,314Government of Pakistan Eurobonds 25,325,313 (290,271) 969,230 26,004,272 25,519,619 (105,010) 1,226,132 26,640,741Government of Pakistan Sukuk 25,602,301 (2,332) 91,324 25,691,293 24,873,538 (8,713) (48,193) 24,816,632Government of Pakistan Mudarabah Pool 1,138,873 - - 1,138,873 466,435 - - 466,435Corporate Sukuks 1,220,000 - - 1,220,000 1,220,000 - - 1,220,000Ordinary shares of listed companies 13,918,677 (4,887,512) 3,294,757 12,325,922 13,345,156 (5,479,476) 2,517,580 10,383,260Preference shares 36,667 - - 36,667 36,667 - - 36,667Ordinary shares of unlisted companies 790,495 (52,989) 16 737,522 808,294 (134,392) 36 673,938Investment in REIT 458,590 - 834 459,424 458,590 - (16,676) 441,914Investment in Mutual Fund 250,000 - (28,115) 221,885 250,000 - (21,482) 228,518Term Finance Certificates 782,335 (161,996) - 620,339 662,335 (162,033) - 500,302Foreign bonds - sovereign 60,403,670 (942,560) 128,876 59,589,986 81,369,066 (1,401,942) 1,742,758 81,709,882Foreign bonds - others 3,569,379 (18,307) 65,968 3,617,040 7,256,300 (24,002) 271,352 7,503,650
1,111,259,526 (6,355,967) 3,403,924 1,108,307,483 915,164,679 (7,315,568) 3,674,488 911,523,599Held to maturity securitiesMarket Treasury Bills 2,302,818 - - 2,302,818 2,696,727 - - 2,696,727Pakistan Investment Bonds - fixed 164,631,960 - - 164,631,960 160,738,122 - - 160,738,122Pakistan Investment Bonds - floaters 42,574,919 - - 42,574,919 - - - - Government of Pakistan Eurobonds 10,634,132 (127,403) - 10,506,729 10,706,182 (45,483) - 10,660,699Government of Pakistan Sukuk 1,277,907 (3,823) - 1,274,084 1,296,245 (3,374) - 1,292,871Bai Muajjal with Government of Pakistan 40.2.1 31,115,551 - - 31,115,551 29,569,648 - - 29,569,648Term Finance Certificates 7,084,206 (69,951) - 7,014,255 4,516,483 (69,951) - 4,446,532Corporate Sukuks 11,429,759 (50,934) - 11,378,825 12,022,820 (57,846) - 11,964,974Participation Term Certificates 437 (437) - - 437 (437) - - Debentures 2,266 (2,266) - - 2,266 (2,266) - - Corporate bonds 1,059,404 (14,421) - 1,044,983 - - - - Foreign bonds - sovereign 30,555,468 (577,390) - 29,978,078 25,058,739 (646,731) - 24,412,008Foreign bonds - others 1,941,765 (17,816) - 1,923,949 1,261,784 (23,219) - 1,238,565CDC SAARC Fund 342 - - 342 347 - - 347
304,610,934 (864,441) - 303,746,493 247,869,800 (849,307) - 247,020,493AssociatesUBL Liquidity Plus Fund 947,881 - - 947,881 1,837,605 - - 1,837,605United Growth and Income Fund 100,284 - - 100,284 - - - - UBL Stock Advantage Fund 110,626 - - 110,626 107,282 - - 107,282UBL Financial Sector Fund 321,823 - - 321,823 225,640 - - 225,640UBL Cash Fund 800,528 - - 800,528 - - - - UBL Exchange Traded Fund 24,099 - - 24,099 21,374 - - 21,374UBL Special Savings Fund II 100,266 - - 100,266 101,850 - - 101,850Al Ameen Islamic Energy Fund 124,005 - - 124,005 92,471 - - 92,471Al Ameen Shariah Stock Fund 161,775 - - 161,775 - - - - UBL Insurers Limited 515,476 - - 515,476 499,948 - - 499,948Khushhali Bank Limited 9.2 3,484,537 - - 3,484,537 3,363,784 - - 3,363,784
6,691,300 - - 6,691,300 6,249,954 - - 6,249,954Total Investments 1,487,628,552 (7,220,408) 3,408,930 1,483,817,074 1,172,293,671 (8,164,875) 3,674,716 1,167,803,512
9.2 This represents the Bank's subscription towards the paid-up capital of Khushhali Bank Limited. Pursuant to section 10 ofthe Khushhali Bank Ordinance, 2000 strategic investors including the Bank cannot sell or transfer their investment before aperiod of five years that has expired on October 10, 2005. Thereafter, such sale / transfer would be subject to the priorapproval of the SBP. However these shares are still appearing as frozen as no approval has been obtained by the Bank tounfreeze these shares.
Carrying Value
-------------------------------------------------------------------------- (Rupees in '000) --------------------------------------------------------------------------
(Un-audited) (Audited)
NoteCost /
Amortised cost
Provision for
diminution
Surplus / (Deficit)
Carrying Value
Cost / Amortised
cost
Provision for
diminution
Surplus / (Deficit)
June 30, 2021 December 31, 2020
10
NOTES TO THE CONSOLIDATED CONDENSED INTERIM FINANCIAL STATEMENTS (UN-AUDITED)FOR THE SIX MONTHS ENDED JUNE 30, 2021

59Half Yearly Report 2021
NOTES TO THE CONSOLIDATED CONDENSED INTERIM FINANCIAL STATEMENTS (UN-AUDITED)FOR THE SIX MONTHS ENDED JUNE 30, 2021
(Un-audited) (Audited)June 30, December 31,
2021 20209.3 Investments given as collateral - at market value
Market Treasury Bills 43,952,534 59,846,168Pakistan Investment Bonds - Fixed 2,081,906 - Pakistan Investment Bonds - Floaters 120,696,000 -
166,730,440 59,846,168
9.4 Provision for diminution in value of investments
9.4.1 Opening balance 8,164,875 7,429,256Exchange adjustments (29,168) 58,788
Charge / (reversals)Charge for the period / year 282,804 1,389,189Reversals for the period / year (1,116,719) (562,394)
(833,915) 826,795Amount written off (81,384) (149,964)Closing balance 9.6 7,220,408 8,164,875
9.4.2 Particulars of provision against debt securities
Category of classification
DomesticLoss 285,584 285,584 292,496 292,496
Overseas Not past due but impaired 1,973,690 388,248 2,004,405 510,210
Total 2,259,274 673,832 2,296,901 802,706
9.5
9.6
10. ADVANCES
(Un-audited) (Audited) (Un-audited) (Audited) (Un-audited) (Audited)June 30, December 31, June 30, December 31, June 30, December 31,
2021 2020 2021 2020 2021 2020
Loans, cash credits, running finances, etc. 560,896,674 549,179,452 82,688,898 82,324,861 643,585,572 631,504,313
Islamic financings andrelated assets 43,489,775 20,542,257 95,273 107,478 43,585,048 20,649,735
Bills discounted and purchased 44,391,296 36,223,975 2,574,662 2,824,527 46,965,958 39,048,502
Advances - gross 648,777,745 605,945,684 85,358,833 85,256,866 734,136,578 691,202,550
Provision against advances 10.3- Specific - - (71,452,980) (72,036,997) (71,452,980) (72,036,997)- General (6,720,553) (7,313,877) - - (6,720,553) (7,313,877)
(6,720,553) (7,313,877) (71,452,980) (72,036,997) (78,173,533) (79,350,874)
Advances - net of provision 642,057,192 598,631,807 13,905,853 13,219,869 655,963,045 611,851,676
Provision against investments includes expected credit loss (ECL) under IFRS 9 amounting to Rs. 1,606.092 million(December 31, 2020: Rs. 1,748.301 million).
Performing Non-performing Total
---------------------------------------------------------- (Rupees in '000) ----------------------------------------------------------
Note
Note
------- (Rupees in '000) -------
(Un-audited) (Audited)June 30, 2021
--------------------------- (Rupees in '000) ---------------------------
December 31, 2020Non-
PerformingInvestments
ProvisionNon-
PerformingInvestments
Provision
The market value of securities classified as held-to-maturity as at June 30, 2021 amounted to Rs. 307,431.757 million(December 31, 2020: Rs. 252,280.321 million).
11
NOTES TO THE CONSOLIDATED CONDENSED INTERIM FINANCIAL STATEMENTS (UN-AUDITED)FOR THE SIX MONTHS ENDED JUNE 30, 2021

60 United Bank Limited
NOTES TO THE CONSOLIDATED CONDENSED INTERIM FINANCIAL STATEMENTS (UN-AUDITED)FOR THE SIX MONTHS ENDED JUNE 30, 2021
(Un-audited) (Audited)10.1 Particulars of advances - gross June 30, December 31,
2021 2020
10.1.1 In local currency 472,628,812 453,024,198In foreign currencies 261,507,766 238,178,352
734,136,578 691,202,550
10.2
Category of Classification Non- Performing
Loans Provision
Non- Performing
Loans Provision
DomesticOther Assets Especially Mentioned* 153,143 527 189,538 497 Substandard 2,525,259 624,336 2,690,171 662,589 Doubtful 685,672 341,615 1,599,695 798,209 Loss 24,398,551 23,318,137 24,259,582 23,164,558
27,762,625 24,284,615 28,738,986 24,625,853 Overseas Not past due but impaired** 4,090,173 1,993,065 5,820,717 2,681,378 Overdue by:
Upto 90 days 3,250,055 1,670,741 1,064,806 135,443 91 to 180 days 1,806,307 819,681 784,383 718,039 181 to 365 days 3,570,715 555,958 10,824,869 8,539,542 ˃ 365 days 44,878,958 42,128,920 38,023,105 35,336,742
57,596,208 47,168,365 56,517,880 47,411,144
Total 85,358,833 71,452,980 85,256,866 72,036,997
* The Other Assets Especially Mentioned category pertains to agricultural finance and advances to small enterprises.** Not past due but impaired category mainly represents restructured exposure.
10.3 Particulars of provision against advances
NoteSpecific General Total Specific General Total
Opening balance 72,036,997 7,313,877 79,350,874 63,887,915 3,618,520 67,506,435Exchange adjustments (582,098) (293,789) (875,887) 937,162 160,201 1,097,363
Charge / (reversals)Charge for the period / year 2,839,856 185,587 3,025,443 14,338,496 3,623,212 17,961,708Reversals for the period / year (1,847,543) (485,122) (2,332,665) (1,734,374) (88,056) (1,822,430)
33 992,313 (299,535) 692,778 12,604,122 3,535,156 16,139,278Amounts written off (994,232) - (994,232) (5,282,212) - (5,282,212)Amounts charged off - agriculture
financing - - - (80,974) - (80,974)Transfers out - net - - - (29,016) - (29,016)Closing balance 71,452,980 6,720,553 78,173,533 72,036,997 7,313,877 79,350,874
10.3.1
--------------------------- (Rupees in '000) ---------------------------
(Un-audited)
------------------------------------------------------------------ (Rupees in '000) ------------------------------------------------------------------
December 31, 2020June 30, 2021(Un-audited) (Audited)
June 30, 2021
------- (Rupees in '000) -------
(Audited)
General provision represents provision amounting to Rs. 344.124 million (December 31, 2020: Rs. 319.955 million)against consumer finance portfolio as required by the Prudential Regulations issued by the SBP and Rs. 6,376.429 million(December 31, 2020: Rs. 6,993.922 million) pertaining to overseas advances to meet the requirements of the regulatoryauthorities of the respective countries in which the overseas branches and subsidiaries operate.
December 31, 2020
Advances include Rs. 85,358.833 million (December 31, 2020: Rs. 85,256.866 million) which have been placed under non-performing status as detailed below:
12
NOTES TO THE CONSOLIDATED CONDENSED INTERIM FINANCIAL STATEMENTS (UN-AUDITED)FOR THE SIX MONTHS ENDED JUNE 30, 2021

61Half Yearly Report 2021
NOTES TO THE CONSOLIDATED CONDENSED INTERIM FINANCIAL STATEMENTS (UN-AUDITED)FOR THE SIX MONTHS ENDED JUNE 30, 2021
10.3.2
10.3.3
(Un-audited) (Audited)June 30, December 31,
2021 202011. FIXED ASSETS
Capital work-in-progress 11.1 748,125 447,893Property and equipments 50,015,552 50,155,993Right-of-use assets 6,730,942 6,863,694
57,494,619 57,467,58011.1 Capital work-in-progress
Civil works 360,692 270,445Equipment 387,433 177,448
748,125 447,893
11.2 Additions to fixed assets
The following additions have been made to fixed assets during the period:
Capital work-in-progress - net additions 311,977 60,650
Property and equipmentsLeasehold Improvement 203,685 182,986 Furniture and fixture 50,039 40,266 Electrical, office and computer equipments 917,539 490,618 Vehicles 110,016 -
1,281,279 713,870
Total 1,593,256 774,520
11.3 Disposals of fixed assets
The net book value of fixed assets disposed off during the period is as follows:
Leasehold Land & Building on leasehold land 4,726 110,838 Leasehold Improvement 91,808 1,352 Furniture and fixture 565 755 Electrical, office and computer equipments 976 1,713 Vehicles 2,946 422
101,021 115,080
11.4 Additions to right-of-use assets 1,355,664 888,093
11.5 Derecognition of right-of-use assets 522,246 477,022
(Un-audited)January - June 2021
January - June 2020
------- (Rupees in '000) -----
------- (Rupees in '000) -----
As a result of COVID-19, the SBP has allowed certain relaxations including deferment of principal payment, rescheduling /restructuring of principal and mark-up, extension and timeline of provisioning against trade bills while maintaining thecustomer status as "regular". These have been considered while determining the provisioning requirements on a timebased criteria.
The Bank has also availed FSV benefit of certain mortgaged properties held as collateral against non-performingadvances of overseas branches in accordance with the applicable regulation in the respective countries where thebranches operate. Had the benefit not been taken by the Bank, the specific provision against non-performing advanceswould had been higher by Rs. 3,338.496 million (December 31, 2020: Rs. 3,951.861 million) for the overseas branches.
The Bank has availed the benefit of Forced Sale Value (FSV) of certain mortgaged properties held as collateral againstnon-performing advances as allowed under BSD Circular No. 1 of 2011. Had the benefit under the said circular not beentaken by the Bank, the specific provision against non-performing advances would have been higher by Rs. 4.758 million(December 31, 2020: Rs. 18.337 million). The FSV benefit availed is not available for the distribution of cash or stockdividend to shareholders.
Note
13
NOTES TO THE CONSOLIDATED CONDENSED INTERIM FINANCIAL STATEMENTS (UN-AUDITED)FOR THE SIX MONTHS ENDED JUNE 30, 2021
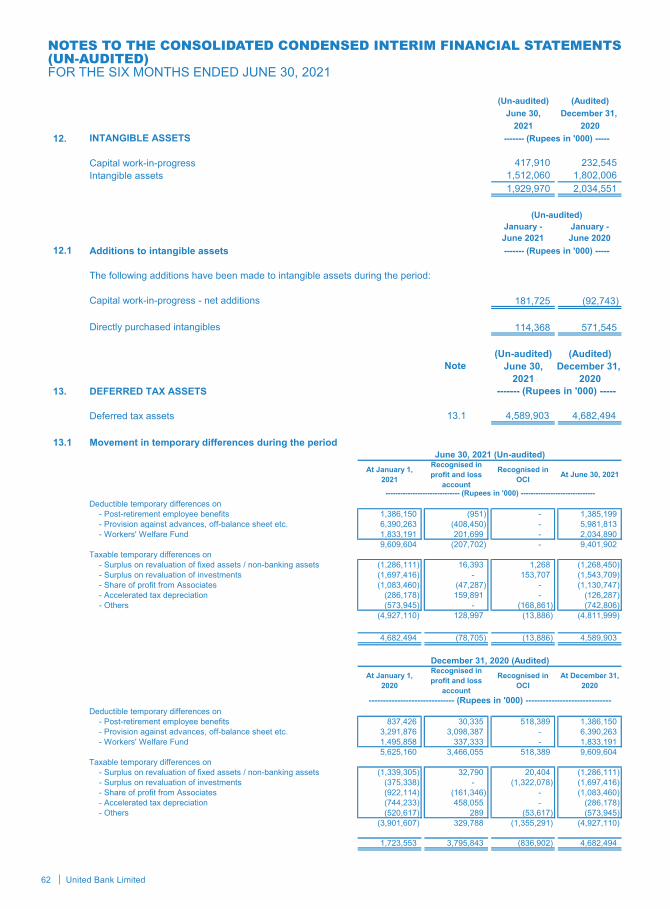
62 United Bank Limited
NOTES TO THE CONSOLIDATED CONDENSED INTERIM FINANCIAL STATEMENTS (UN-AUDITED)FOR THE SIX MONTHS ENDED JUNE 30, 2021
(Un-audited) (Audited)June 30, December 31,
2021 202012. INTANGIBLE ASSETS
Capital work-in-progress 417,910 232,545 Intangible assets 1,512,060 1,802,006
1,929,970 2,034,551
January - June 2021
January - June 2020
12.1 Additions to intangible assets
The following additions have been made to intangible assets during the period:
Capital work-in-progress - net additions 181,725 (92,743)
Directly purchased intangibles 114,368 571,545
(Un-audited) (Audited)June 30, December 31,
2021 202013. DEFERRED TAX ASSETS
Deferred tax assets 13.1 4,589,903 4,682,494
13.1 Movement in temporary differences during the period
At January 1, 2021
Recognised in profit and loss
account
Recognised in OCI At June 30, 2021
Deductible temporary differences on- Post-retirement employee benefits 1,386,150 (951) - 1,385,199 - Provision against advances, off-balance sheet etc. 6,390,263 (408,450) - 5,981,813 - Workers' Welfare Fund 1,833,191 201,699 - 2,034,890
9,609,604 (207,702) - 9,401,902 Taxable temporary differences on
- Surplus on revaluation of fixed assets / non-banking assets (1,286,111) 16,393 1,268 (1,268,450) - Surplus on revaluation of investments (1,697,416) - 153,707 (1,543,709) - Share of profit from Associates (1,083,460) (47,287) - (1,130,747) - Accelerated tax depreciation (286,178) 159,891 - (126,287) - Others (573,945) - (168,861) (742,806)
(4,927,110) 128,997 (13,886) (4,811,999)
4,682,494 (78,705) (13,886) 4,589,903
At January 1, 2020
Recognised in profit and loss
account
Recognised in OCI
At December 31, 2020
------------------------------ (Rupees in '000) ------------------------------Deductible temporary differences on
- Post-retirement employee benefits 837,426 30,335 518,389 1,386,150 - Provision against advances, off-balance sheet etc. 3,291,876 3,098,387 - 6,390,263 - Workers' Welfare Fund 1,495,858 337,333 - 1,833,191
5,625,160 3,466,055 518,389 9,609,604 Taxable temporary differences on
- Surplus on revaluation of fixed assets / non-banking assets (1,339,305) 32,790 20,404 (1,286,111) - Surplus on revaluation of investments (375,338) - (1,322,078) (1,697,416) - Share of profit from Associates (922,114) (161,346) - (1,083,460) - Accelerated tax depreciation (744,233) 458,055 - (286,178) - Others (520,617) 289 (53,617) (573,945)
(3,901,607) 329,788 (1,355,291) (4,927,110)
1,723,553 3,795,843 (836,902) 4,682,494
------------------------------ (Rupees in '000) ------------------------------
Note
------- (Rupees in '000) -----
(Un-audited)
------- (Rupees in '000) -----
------- (Rupees in '000) -----
June 30, 2021 (Un-audited)
December 31, 2020 (Audited)
14
NOTES TO THE CONSOLIDATED CONDENSED INTERIM FINANCIAL STATEMENTS (UN-AUDITED)FOR THE SIX MONTHS ENDED JUNE 30, 2021

63Half Yearly Report 2021
NOTES TO THE CONSOLIDATED CONDENSED INTERIM FINANCIAL STATEMENTS (UN-AUDITED)FOR THE SIX MONTHS ENDED JUNE 30, 202114. DISCONTINUED OPERATIONS
(Un-audited) (Audited)June 30, December 31,
2021 202014.1 Assets and liabilities under discontinued operations
Assets Cash and balances with treasury banks 9,264,946 - Balances with other banks 7,442,884 219,488 Lendings to financial institutions 3,008,875 - Investments 5,373,938 - Advances 207,654 - Fixed assets 26,692 - Other assets 131,243 -
25,456,232 219,488
LiabilitiesBorrowings 8,260,089 - Deposits and other accounts 10,617,641 - Other liabilities 170,990 11,575
19,048,720 11,575
14.2 Discontinued operations
Mark-up / return / interest earned 208,242 - Mark-up / return / interest expensed 73,896 - Net mark-up / interest income 134,346 -
Non mark-up / interest incomeFee, commission and brokerage income 333,675 - Foreign exchange income 198 - Other income - 124 Total non mark-up / interest income 333,872 124 Total income 468,219 124
Non mark-up / interest expensesOperating expenses 325,222 11,345 Total non mark-up / interest expenses 325,222 11,345
(Loss) / profit before taxation 142,997 (11,221)
Taxation 36,523 (950)
(Loss) / profit after taxation 106,474 (10,271)
UBL Bank (Tanzania) Limited ("UBTL") is a wholly owned subsidiary of United Bank Limited. UBTL sold materially all of itsassets and liabilities held as at October 31, 2019, including the loans and advances and deposit book to EXIM BankTanzania Limited ("Exim"), in line with the Asset and Liabilities Purchase Agreement signed on May 22, 2019. The controlof these assets and liabilities was transferred to Exim effective from November 1, 2019. The Banking operations of thesubsidiary ceased on November 1, 2019. UBTL is in process of winding up and voluntary liquidation.
The shareholders of the Bank have approved the decision to voluntarily and orderly wind up UBL (Switzerland) AG, awholly owned subsidiary of the Bank in the Extra Ordinary General Meeting (EOGM) of shareholders held on August 06,2021. This decision is in line with the Bank’s strategy to exit from non-core markets. The winding up is subject to fulfilmentof relevant legal and regulatory requirements both in Pakistan and Switzerland.
(Un-audited)
------- (Rupees in '000) -------
January - June 2021
January - June 2020
------- (Rupees in '000) -------
15
NOTES TO THE CONSOLIDATED CONDENSED INTERIM FINANCIAL STATEMENTS (UN-AUDITED)FOR THE SIX MONTHS ENDED JUNE 30, 2021

64 United Bank Limited
NOTES TO THE CONSOLIDATED CONDENSED INTERIM FINANCIAL STATEMENTS (UN-AUDITED)FOR THE SIX MONTHS ENDED JUNE 30, 2021
(Un-audited) (Audited)June 30, December 31,
2021 202015. OTHER ASSETS
Income / mark-up accrued in local currency - net of provision 21,186,730 21,075,329 Income / mark-up accrued in foreign currencies - net of provision 15.1 2,061,954 2,211,759 Advance taxation - net of provision for taxation 15.2 45,731 5,992,577 Receivable from staff retirement fund 74,054 24,160 Receivable from other banks against telegraphic transfers and demand drafts 22,359 110,689 Unrealised gain on forward foreign exchange contracts 1,206,838 3,347,603 Rebate receivable - net 307,859 631,410 Suspense accounts - 240,002 Stationery and stamps on hand 197,125 169,311 Non-banking assets acquired in satisfaction of claims 241,683 274,451 Advances, deposits, advance rent and other prepayments 2,927,651 1,475,598 Acceptances 5,708,132 10,505,651 Dividend receivable 107,453 217,974 Receviable against IBFT, ATM and other settlements - net 853,694 - Commission receivable - Branchless Banking 653,017 658,524 Receivable against fraud & forgery and looted notes 583,132 586,929 Others 2,089,986 2,010,832
38,267,398 49,532,799 Provision held against other assets 15.3 (1,214,070) (1,392,976) Other assets - net of provision 37,053,328 48,139,823 Deficit on revaluation of non-banking assets acquired in satisfaction
of claims (38,007) (38,367) Other assets - total 37,015,321 48,101,456
15.1
15.2
------- (Rupees in '000) -------
The income tax authorities have issued amended assessment orders for the tax years 2003 to 2020, and createdadditional tax demands (including disallowances of provisions made prior to Seventh Schedule) of Rs. 13,752 million(December 31, 2020: Rs.11,610 million), which have been fully paid as required under the law. The Bank has filedappeals before the various appellate forums against these amendments. Where the appellate authorities have allowedrelief on certain issues, the assessing authorities have filed appeals before higher appellate forums. Where the appellateauthorities have not allowed relief the Bank has filed appeals before higher appellate forums. The management of theBank is confident that the appeals will be decided in favor of the Bank.
The tax authorities have also carried out monitoring for Federal Excise Duty, Sales tax and withholding taxes coveringperiod from year ended 2005 to 2019. Consequently, various addbacks and demands were raised creating a total demandof Rs. 2,467 million (December 31, 2020: Rs. 1,274 million). The Bank has filed appeals against all such demands and isconfident that these would be decided in the favor of the Bank.
The Bank has received corrective tax assessment of Qatari Riyal (QAR) 1.0 million (Rs: 41.955 million) from the GeneralTax Authority (GTA) in respect of tax year 2004 with no supporting calculations from GTA. Management has requesteddetails for 2004 assessment from GTA, however, to date no response has been received. Management is confident thatthe matters will be decided in favour of the Bank and the possibility of any outcome against it is remote.
This includes unrealised mark-up held in suspense amounting to Rs. 14,852.074 million (December 31, 2020: Rs.13,639.898 million) kept against non-performing overseas advances / investment as per the requirements of theregulatory authorities of the respective countries in which the overseas branches operate.
The tax returns for Azad Kashmir (AK) and Gilgit Baltistan (GB) Branches have been filed upto the tax year 2020(accounting year 2019) under the provisions of section 120(1) read with section 114 of the Ordinance and in compliancewith the terms of the agreement between banks and the Azad Kashmir Council in May 2005. The returns filed areconsidered as deemed assessment orders under the law.
The tax return for Yemen branch has been filed upto the year ended December 31, 2019 and and for the UAE and Qatarbranches upto the year ended December 31, 2020, under the provisions of the laws prevailing in the respective countries,and are deemed as assessed unless opened for reassessment.
The Income Tax returns of the Bank have been filed up to the tax year 2020 (accounting year ended December 31, 2019)and were deemed to be assessed under section 120 of the Income Tax Ordinance, 2001 (Ordinance).
Note
16
NOTES TO THE CONSOLIDATED CONDENSED INTERIM FINANCIAL STATEMENTS (UN-AUDITED)FOR THE SIX MONTHS ENDED JUNE 30, 2021

65Half Yearly Report 2021
NOTES TO THE CONSOLIDATED CONDENSED INTERIM FINANCIAL STATEMENTS (UN-AUDITED)FOR THE SIX MONTHS ENDED JUNE 30, 2021
(Un-audited) (Audited)June 30, December 31,
2021 2020
15.3 Provision held against other assets
Advances, deposits, advance rent and other prepayments 54,108 84,272 Fraud & forgery and looted notes 604,364 626,435 Others 555,598 682,269
1,214,070 1,392,976
15.3.1 Movement of provision held against other assets
Opening balance 1,392,976 1,271,877Exchange adjustments (11,571) 655
Charge / (reversals)Charge for the period / year 26,768 249,664Reversals for the period / year (125,306) (94,809)
33 (98,538) 154,855Transfer (out) / in - net (38,613) 3,245Amounts written off (30,184) (37,656)Closing balance 1,214,070 1,392,976
16. CONTINGENT ASSETS
There were no contingent assets as at the statement of financial position date.
(Un-audited) (Audited)June 30, December 31,
2021 202017. BILLS PAYABLE
In Pakistan 30,886,817 28,820,012 Outside Pakistan 933,798 921,194
31,820,615 29,741,206
For the period from January 2015 to December 2016, KBL received two orders from Additional Commissioner InlandRevenue dated November 22, 2017, and December 6, 2017, for chargeability of super tax on total income instead ofbusiness income of KBL as defined under section 18 (2) of the Income Tax Ordinance, 2001. KBL preferred an appealagainst the alleged demand of Rs. 200.58 million which is pending adjudication before the Appellate Tribunal InlandRevenue.
Moreover, there are certain other contingencies in respect of non-payment / short payment of Federal Excise Duty (FED),sales tax and withholding tax which are being contested by KBL at various appellate forums. The management believesthat the outcome of the cases will be ultimately decided in the favour of KBL and hence, no provision has beenrecognised in respect of these contingencies in the consolidated financial statements.
------- (Rupees in '000) -------
The tax returns of USAG has been filed upto the accounting year ended December 31, 2020 and for UBL UK, UBL FMand UET upto the accounting year ended December 31, 2019, under the provisions of the laws prevailing in therespective countries and are deemed as assessed unless opened for reassessment by the tax authorities. Additionally,tax clearance has been issued for USAG till accounting year ended December 31, 2020, for UBL UK till the accountingyear ended December 31,2019 and for UBTL till October 31, 2019. There are no material tax contingencies in any of thesubsidiaries.
Tax Contingencies - Khushali Bank Limited (KBL) - Associate
Note
------- (Rupees in '000) -------
17
NOTES TO THE CONSOLIDATED CONDENSED INTERIM FINANCIAL STATEMENTS (UN-AUDITED)FOR THE SIX MONTHS ENDED JUNE 30, 2021

66 United Bank Limited
NOTES TO THE CONSOLIDATED CONDENSED INTERIM FINANCIAL STATEMENTS (UN-AUDITED)FOR THE SIX MONTHS ENDED JUNE 30, 2021
(Un-audited) (Audited)June 30, December 31,
2021 202018. BORROWINGS
Details of borrowings
SecuredBorrowings from the State Bank of Pakistan under:
Export refinance scheme 33,443,583 30,724,174Long term financing facility 21,272,946 22,243,644Refinance scheme for payment of wages and salaries 4,611,535 5,587,037Renewable energy scheme 239,851 146,985Temporary economic refinance scheme 3,996,989 307,540Other borrowings 1,227,577 863,235
64,792,481 59,872,615Repurchase agreement borrowings 176,345,450 59,835,819
241,137,931 119,708,434Unsecured Call borrowings 25,290,923 2,397,485Overdrawn nostro accounts 842,601 379,564Money market deals 4,534,846 9,341,702
30,668,370 12,118,751271,806,301 131,827,185
19. DEPOSITS AND OTHER ACCOUNTS
In Local Currency
In Foreign currencies Total In Local
CurrencyIn Foreign currencies Total
CustomersFixed deposits 165,704,035 206,749,785 372,453,820 171,340,589 214,773,170 386,113,759Saving deposits 612,040,337 50,484,493 662,524,830 509,563,742 53,146,711 562,710,453Sundry deposits 24,630,724 1,623,559 26,254,283 5,022,037 2,173,583 7,195,620Margin deposits 3,891,316 1,915,409 5,806,725 3,833,926 3,194,969 7,028,895Current accounts - remunerative 1,978,906 4,635,461 6,614,367 1,387,144 6,911,630 8,298,774Current accounts - non-remunerative 629,793,467 131,495,307 761,288,774 549,038,483 134,295,247 683,333,730
1,438,038,785 396,904,014 1,834,942,799 1,240,185,921 414,495,310 1,654,681,231Financial Institutions
Current deposits 22,475,062 2,377,554 24,852,616 20,978,533 4,646,484 25,625,017Saving deposits 59,944,811 5,908,335 65,853,146 56,409,524 2,373,413 58,782,937Term deposits 40,850,400 248,121 41,098,521 25,207,956 95,145 25,303,101
123,270,273 8,534,010 131,804,283 102,596,013 7,115,042 109,711,0551,561,309,058 405,438,024 1,966,747,082 1,342,781,934 421,610,352 1,764,392,286
19.1
20. LIABILITIES AGAINST ASSETS SUBJECT TO FINANCE LEASE
Not later than one year 5,550 452 5,098 5,562 452 5,110 Later than one year and not
later than five years 8,058 115 7,943 11,132 285 10,847 13,608 567 13,041 16,694 737 15,957
---------------------------------------------- (Rupees in '000) -------------------------------------------------
Minimum lease
payments
Minimum lease
payments
Principal Outstanding
Finance charges for
future periods
Principal Outstanding
Finance charges for
future periods
June 30, 2021 (Un-audited)
June 30, 2021 (Un-audited) December 31, 2020 (Audited)
This includes deposits eligible to be covered under insurance arrangements in accordance with DPC Circular No. 04 dated June 22,2018, amounting to Rs. 1,048,412.550 million (December 31, 2020: Rs. 991,687.959 million).
---------------------------------------------- (Rupees in '000) -------------------------------------------------
December 31, 2020 (Audited)
------- (Rupees in '000) -------
18
NOTES TO THE CONSOLIDATED CONDENSED INTERIM FINANCIAL STATEMENTS (UN-AUDITED)FOR THE SIX MONTHS ENDED JUNE 30, 2021

67Half Yearly Report 2021
NOTES TO THE CONSOLIDATED CONDENSED INTERIM FINANCIAL STATEMENTS (UN-AUDITED)FOR THE SIX MONTHS ENDED JUNE 30, 2021
21. SUBORDINATED DEBT
Salient features of the ADT 1 issue are as follows:
Issue SizeIssue DateTenorRatingSecurityMark-up rateMark-up payment frequency
(Un-audited) (Audited)June 30, December 31,
2021 202022. OTHER LIABILITIES
Mark-up / return / interest payable in local currency 13,135,582 11,630,286 Mark-up / return / interest payable in foreign currencies 598,599 1,327,591 Accrued expenses 3,367,036 4,332,657 Branch adjustment account 134,380 105,228 Payable against purchase of securities 142,027 - Deferred income 930,685 882,954 Unearned commission and income on bills discounted 319,131 453,296 Provision against off-balance sheet obligations 22.1 727,320 1,076,530 Unrealised loss on forward foreign exchange contracts 1,586,365 3,376,994 Trading liabilities 9,603,973 - Payable to staff retirement fund 143,887 1,142,926 Deferred liabilities 3,842,158 3,969,397 Workers' Welfare Fund payable 5,074,250 4,752,294 Liabilities against IBFT, ATM and other settlements - net - 1,199,242 Insurance payable against consumer assets 657,347 615,405 Dividend payable 3,030,284 357,578 Acceptances 5,708,132 10,505,651 Suspense accounts 139,352 - Lease Liability under IFRS 16 7,996,545 7,950,494 Levies and taxes payable 3,486,318 2,671,007 Others 2,276,333 1,918,148
62,899,704 58,267,678
The Bank has issued fully paid up, rated, listed, perpetual, unsecured, subordinated, non-cumulative and contingentconvertible debt instruments in the nature of Term Finance Certificates (TFCs) under Section 66 of the Companies Act,2017 which qualify as Additional Tier I Capital as outlined by State Bank of Pakistan (SBP) under BPRD Circular No. 6dated August 15, 2013.
Rs. 10,000 million
“AA+” (Double A Plus) by VIS Credit Rating Company LimitedPerpetual (i.e. no fixed or final redemption date)
Unsecured
------- (Rupees in '000) -------
Loss absorbency clause
Call option
Lock-in clause
The TFCs shall carry mark-up at the rate of 3 Month KIBOR + 1.55%.Profit / Mark-up shall be payable quarterly in arrears, on a non-cumulative basis
The Bank may, at its sole discretion, call the TFCs, at any time after five years from theIssue Date subject to the prior approval of the SBP.
Note
Mark-up on the TFCs shall only be paid from the current year's earnings and if the Bank isfully compliant with SBP’s Minimum Capital Requirement (MCR), Capital Adequacy Ratio(CAR) and Liquidity Ratio (LR) requirements.
January 29, 2019
The TFCs shall, at the discretion of the SBP, be either permanently converted intoordinary shares or permanently written off (partially or in full) pursuant to the lossabsorbency clause as stipulated in the “Instructions for Basel III Implementation inPakistan” issued vide BPRD Circular No. 6 dated August 15, 2013.
19
NOTES TO THE CONSOLIDATED CONDENSED INTERIM FINANCIAL STATEMENTS (UN-AUDITED)FOR THE SIX MONTHS ENDED JUNE 30, 2021

68 United Bank Limited
NOTES TO THE CONSOLIDATED CONDENSED INTERIM FINANCIAL STATEMENTS (UN-AUDITED)FOR THE SIX MONTHS ENDED JUNE 30, 2021
(Un-audited) (Audited)June 30, December 31,
2021 202022.1 Provision against off-balance sheet obligations
Opening balance 1,076,530 632,785 Exchange adjustments (18,550) 11,996
Charge for the period / year 5,266 431,749 Reversals for the period / year (335,927) -
(330,661) 431,749 727,319 1,076,530
23. SURPLUS ON REVALUATION OF ASSETS
Surplus arising on revaluation of assets - net of taxFixed assets 23.1 26,913,831 27,022,623 Available for sale securities 23.2 2,109,652 2,282,110 Non-banking assets acquired in satisfaction of claims 1,132 913 Surplus arising on revaluation of assets of associates (2,974) 28,566
29,021,641 29,334,212 23.1 Surplus on revaluation of fixed assets
Surplus on revaluation of fixed assets as at January 1 29,975,515 30,165,526
Revaluation against fixed assets during the period (7,276) (250,405) Realised on disposal during the period / year (4,330) (162,824) Exchange adjustments (11,453) 310,216 Transferred to unappropriated profit in respect of incremental
depreciation charged during the period / year - net of deferred tax (23,739) (53,821) Related deferred tax liability on incremental depreciation charged
during the period / year (14,401) (33,177) (61,199) (190,011)
29,914,316 29,975,515 Less: Related deferred tax liabilityRevaluation as on January 1 1,285,528 1,319,440
Surplus realised on disposal of fixed assets during the period / year (1,689) (46,478) Surplus / (deficit) on revaluation against fixed assets during the period / year 134,411 (4,506) Exchange adjustments (2,499) 50,249 Incremental depreciation charged on related assets (14,401) (33,177)
115,822 (33,912)
1,401,350 1,285,528
28,512,966 28,689,987 Share of non-controlling interest (1,599,135) (1,667,364) Group's share 26,913,831 27,022,623
23.2 Surplus on revaluation of available for sale securities
Market Treasury Bills 245,214 238,363 Pakistan Investment Bonds - fixed (77,655) 333,950 Pakistan Investment Bonds - floaters (1,286,525) (2,569,332) Ordinary shares and mutual fund 3,266,658 2,496,134 REIT Investment 834 (16,676) Term Finance Certificates, Sukuks, other bonds etc. 91,324 (48,193) Foreign bonds 1,164,074 3,240,242
3,403,924 3,674,488 Related deferred tax liability (1,543,709) (1,697,416)
1,860,215 1,977,072 Share of non-controlling interest 249,437 305,038Group's share 2,109,652 2,282,110
------- (Rupees in '000) -------
Note
20
Clossing Balance
NOTES TO THE CONSOLIDATED CONDENSED INTERIM FINANCIAL STATEMENTS (UN-AUDITED)AS AT JUNE 30, 2021
NOTES TO THE CONSOLIDATED CONDENSED INTERIM FINANCIAL STATEMENTS (UN-AUDITED)FOR THE SIX MONTHS ENDED JUNE 30, 2021

69Half Yearly Report 2021
NOTES TO THE CONSOLIDATED CONDENSED INTERIM FINANCIAL STATEMENTS (UN-AUDITED)FOR THE SIX MONTHS ENDED JUNE 30, 2021
(Un-audited) (Audited)June 30, December 31,
2021 202024. CONTINGENCIES AND COMMITMENTS
- Guarantees 24.1 144,384,313 147,961,658- Commitments 24.2 987,123,236 970,991,372- Other contingent liabilities 24.3 15,872,320 15,554,510
1,147,379,869 1,134,507,54024.1 Guarantees
Financial guarantees 43,402,845 43,053,322Performance guarantees 100,959,670 104,908,336Other guarantees 21,798 -
144,384,313 147,961,65824.2 Commitments
Documentary credits and short-term trade-related transactions- letters of credit 212,411,922 160,344,833
Commitments in respect of:- forward foreign exchange contracts 24.2.2 645,580,045 683,065,647- forward Government securities transactions 24.2.3 707,328 - - derivatives - FX options 24.2.4 2,338,968 - - forward lending 24.2.5 122,591,515 124,510,935- operating leases 24.2.6 219,990 126,093
Commitments for acquisition of:- operating fixed assets 24.2.7 2,230,323 2,876,499- intangible assets 24.2.7 902,016 -
Others 141,129 67,365987,123,236 970,991,372
24.2.1 Commitments to extend credit
(Un-audited) (Audited)June 30, December 31,
2021 202024.2.2 Commitments in respect of forward foreign exchange contracts
Purchase 352,235,472 366,797,666Sale 293,344,574 316,267,981
24.2.3 Commitments in respect of forward Government securities transactions
Forward purchase of Government securities 707,328 - Forward sale of Government securities - -
24.2.4 Commitments in respect of derivatives
FX options - purchased 1,169,484 - FX options - sold 1,169,484 -
24.2.5 Commitments in respect of forward lending
Undrawn formal standby facilities, credit lines and other commitments to lend 24.2.5.1 73,417,460 66,651,116
Others 49,174,055 57,859,819122,591,515 124,510,935
------- (Rupees in '000) -------
------- (Rupees in '000) -------
The Group makes commitments to extend credit in the normal course of its business but these being revocablecommitments do not attract any significant penalty or expense if the facility is unilaterally withdrawn.
Note
Note
21
NOTES TO THE CONSOLIDATED CONDENSED INTERIM FINANCIAL STATEMENTS (UN-AUDITED)FOR THE SIX MONTHS ENDED JUNE 30, 2021
NOTES TO THE CONSOLIDATED CONDENSED INTERIM FINANCIAL STATEMENTS (UN-AUDITED)FOR THE SIX MONTHS ENDED JUNE 30, 2021

70 United Bank Limited
NOTES TO THE CONSOLIDATED CONDENSED INTERIM FINANCIAL STATEMENTS (UN-AUDITED)FOR THE SIX MONTHS ENDED JUNE 30, 2021
24.2.5.1
(Un-audited) (Audited)June 30, December 31,
2021 202024.2.6 Commitments in respect of operating leases
Not later than one year 158,617 58,443 Later than one year and not later than five years 33,373 37,620 Later than five years 28,000 30,030
219,990 126,093
24.2.7 Commitments in respect of capital expenditure 3,132,339 2,876,499
24.3 Other contingent liabilities
Claims against the Group not acknowledged as debts 24.3.1 11,783,017 11,465,207
24.3.1
24.3.2
24.3.3
24.4 For contingencies relating to taxation, refer note 15.2.
25. DERIVATIVE INSTRUMENTS
25.1 Product analysis
Counterparties
Total Hedging 1,169,484 - 707,328 (183) - - 1,876,812 (183)Market making 1,169,484 - - - - - 1,169,484 -
2,338,968 - 707,328 (183) - - 3,046,296 (183)
Counterparties
Total Hedging - - - - - - - - Market making - - - - - - - -
- - - - - - - -
Based on legal advice and / or internal assessments, management is confident that the matters will be decided in favourof the Group and the possibility of any outcome against the Group is remote and accordingly no provision has been madein these consolidated financial statements.
These mainly represent counter claims filed by the borrowers for restricting the Group from disposal of assets (such asmortgaged / pledged assets kept as security).
Notional principal
Mark to Market gain / (loss)
FX options
Notional principal
Mark to Market gain / (loss)
Notional principal
Mark to Market gain / (loss)
TotalForward sale contracts of Government securities
Notional principal
Mark to Market gain / (loss)
These represent commitments that are irrevocable because they cannot be withdrawn at the discretion of the Bankwithout the risk of incurring significant penalty or expense.
FX options Forward purchase contracts of Government securities
June 30, 2021 (Un-audited)
Notional principal
Mark to Market gain / (loss)
Notional principal
Mark to Market gain / (loss)
Notional principal
------- (Rupees in '000) -------
Punjab Revenue Authority issued show cause notice to UBL Fund Managers Limited requiring them to pay sales taxunder Punjab sales tax on Service Act 2012 on management fee earned in Punjab from May 22, 2013. The Company hasfiled a petition on July 8, 2015 in the High Court of Sindh. A favorable outcome of this petition is expected.
During 2016, penalties amounting to Rs. 4.089 billion were levied by the FE Adjudication Court of the State Bank ofPakistan relating to alleged contraventions of the requirements of foreign exchange regulations with respect to issuanceand certification of E-Forms by the Bank to certain customers (exporters) who failed to submit the export documents thereagainst. Consequently, foreign exchange on account of export proceeds have not been repatriated. The Bank maintainsthat it fully discharged its liability, in accordance with the law and has filed a civil suit in the High Court of Sindhchallenging the levy of the penalty. The High Court has granted a stay on action being taken against the Bank. Themanagement, based on the advice from legal counsel, is confident that the view of the Bank will prevail and the Bank willnot be exposed to any loss on this account.
Note
---------------------------------------------------------------------------- (Rupees in 000) ----------------------------------------------------------------------------
Total
Notional principal Mark to Market gain / (loss)
December 31, 2020 (Audited)Forward purchase contracts of
Government securitiesForward sale contracts of
Government securities
---------------------------------------------------------------------------- (Rupees in 000) ----------------------------------------------------------------------------
Mark to Market gain / (loss)
22
NOTES TO THE CONSOLIDATED CONDENSED INTERIM FINANCIAL STATEMENTS (UN-AUDITED)FOR THE SIX MONTHS ENDED JUNE 30, 2021

71Half Yearly Report 2021
NOTES TO THE CONSOLIDATED CONDENSED INTERIM FINANCIAL STATEMENTS (UN-AUDITED)FOR THE SIX MONTHS ENDED JUNE 30, 2021
January - June 2021
January - June 2020
26. MARK-UP / RETURN / INTEREST EARNED
On:Loans and advances 20,369,132 33,779,193 Investments 48,462,089 52,914,161 Lendings to financial institutions 722,797 1,412,262 Balances with banks 250,050 337,330
69,804,068 88,442,946
27. MARK-UP / RETURN / INTEREST EXPENSED
On:Deposits 26,569,996 35,983,195 Borrowings 4,382,104 9,064,368 Subordinated debt 441,847 652,061 Cost of foreign currency swaps against foreign currency deposits / borrowings 1,601,040 2,089,860 Lease liability against right-of-use assets 474,784 584,330
33,469,771 48,373,814
28. FEE AND COMMISSION INCOME
Branch banking customer fee 834,635 874,158 Consumer finance related fee 544,098 477,722 Card related fees (debit and credit cards) 1,138,268 1,058,037 Investment banking fee 343,216 85,319 Financial Institution rebate / commission 156,835 143,105 Corporate service charges / facility fee 376,681 193,585 Commission on trade 320,522 349,318 Commission on guarantees 275,578 357,132 Commission on cash management 461,703 373,443 Commission on remittances including home remittances - net 1,116,302 1,139,659 Commission on bancassurance 882,534 478,967 Commission on Benazir Income Support Program - 38,359 Management fee 388,188 345,344 Rent on lockers 95,652 93,817 Others 186,851 144,627
7,121,063 6,152,592
29. GAIN ON SECURITIES - NET
Realised 29.1 2,578,601 843,757 Unrealised - held for trading 5,006 14,504
2,583,607 858,261
29.1 Realised gain on:
Federal Government securities 808,119 350,660 Shares 298,863 (164,582)Foreign securities 1,471,185 661,293 Other securities 434 (3,614)
2,578,601 843,757
30. OTHER INCOME
Charges recovered 123,463 116,012 Rent on properties 38,958 26,158 Gain on sale of operating fixed assets - net 4,298 47,109 Gain on sale of Ijarah assets 3,222 548 Gain on sale of non banking assets - net - 223,054 Gain on trading liabilities - net 16,666 76,068
186,607 488,949
Note
------- (Rupees in '000) -------
(Un-audited)
23
9.1
NOTES TO THE CONSOLIDATED CONDENSED INTERIM FINANCIAL STATEMENTS (UN-AUDITED)FOR THE SIX MONTHS ENDED JUNE 30, 2021
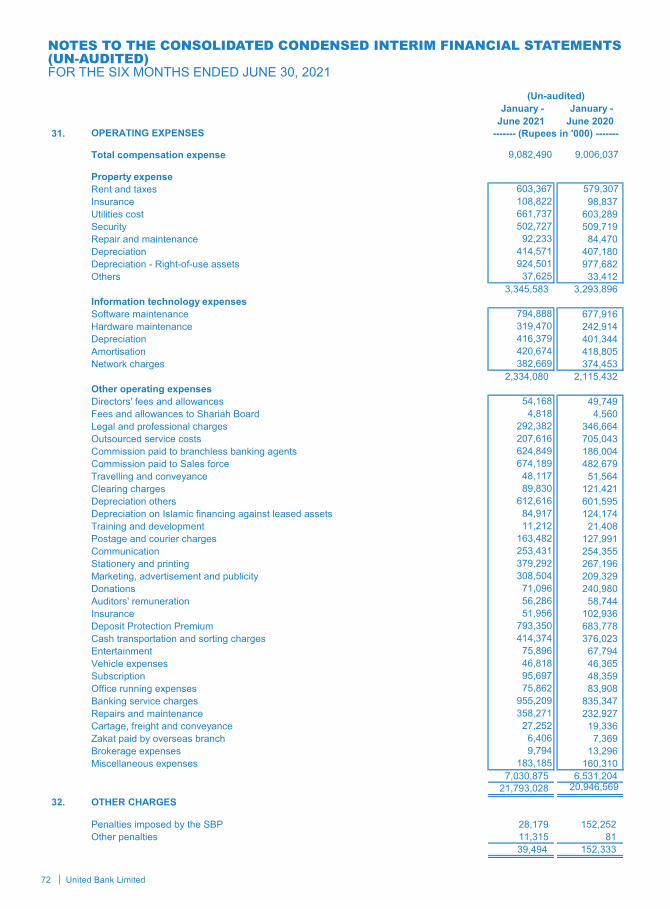
72 United Bank Limited
NOTES TO THE CONSOLIDATED CONDENSED INTERIM FINANCIAL STATEMENTS (UN-AUDITED)FOR THE SIX MONTHS ENDED JUNE 30, 2021
January - June 2021
January - June 2020
31. OPERATING EXPENSES
Total compensation expense 9,082,490 9,006,037
Property expenseRent and taxes 603,367 579,307 Insurance 108,822 98,837 Utilities cost 661,737 603,289 Security 502,727 509,719 Repair and maintenance 92,233 84,470 Depreciation 414,571 407,180 Depreciation - Right-of-use assets 924,501 977,682 Others 37,625 33,412
3,345,583 3,293,896 Information technology expensesSoftware maintenance 794,888 677,916 Hardware maintenance 319,470 242,914 Depreciation 416,379 401,344 Amortisation 420,674 418,805 Network charges 382,669 374,453
2,334,080 2,115,432 Other operating expensesDirectors' fees and allowances 54,168 49,749 Fees and allowances to Shariah Board 4,818 4,560 Legal and professional charges 292,382 346,664 Outsourced service costs 207,616 705,043 Commission paid to branchless banking agents 624,849 186,004 Commission paid to Sales force 674,189 482,679 Travelling and conveyance 48,117 51,564 Clearing charges 89,830 121,421 Depreciation others 612,616 601,595 Depreciation on Islamic financing against leased assets 84,917 124,174 Training and development 11,212 21,408 Postage and courier charges 163,482 127,991 Communication 253,431 254,355 Stationery and printing 379,292 267,196 Marketing, advertisement and publicity 308,504 209,329 Donations 71,096 240,980 Auditors' remuneration 56,286 58,744 Insurance 51,956 102,936 Deposit Protection Premium 793,350 683,778 Cash transportation and sorting charges 414,374 376,023 Entertainment 75,896 67,794 Vehicle expenses 46,818 46,365 Subscription 95,697 48,359 Office running expenses 75,862 83,908 Banking service charges 955,209 835,347 Repairs and maintenance 358,271 232,927 Cartage, freight and conveyance 27,252 19,336 Zakat paid by overseas branch 6,406 7,369 Brokerage expenses 9,794 13,296 Miscellaneous expenses 183,185 160,310
7,030,875 6,531,204 21,793,028 20,946,569
32. OTHER CHARGES
Penalties imposed by the SBP 28,179 152,252 Other penalties 11,315 81
39,494 152,333
------- (Rupees in '000) -------
(Un-audited)
24
NOTES TO THE CONSOLIDATED CONDENSED INTERIM FINANCIAL STATEMENTS (UN-AUDITED)FOR THE SIX MONTHS ENDED JUNE 30, 2021

73Half Yearly Report 2021
NOTES TO THE CONSOLIDATED CONDENSED INTERIM FINANCIAL STATEMENTS (UN-AUDITED)FOR THE SIX MONTHS ENDED JUNE 30, 2021
January - June 2021
January - June 2020
33. (REVERSALS) / PROVISIONS AND WRITE-OFFS - NET
Provision against loans and advances - net 10.3 692,778 9,607,327 (Reversals) / provision for diminution in value of investments - net 9.4 (833,915) 86,153 Bad debts written-off directly 62,944 39,487 (Reversals) / provision against other assets - net 15.3.1 (98,538) (65,845)(Reversals) / provision against off-balance sheet obligations 22.1 (330,661) 214,965 Recovery of written-off / charged-off bad debts (234,394) (277,453)Other provisions / write-offs 583,853 347,960
(157,933) 9,952,594
34. TAXATION
Current 11,129,891 10,276,888 Prior years (189,016) (5,968)Deferred 78,705 (2,745,168)
11,019,580 7,525,752
35. EARNINGS PER SHARE
Profit after tax attributable to equity shareholders of the Bank 14,987,658 10,946,110
Weighted average number of ordinary shares 1,224,179,687 1,224,179,687
Earnings per share - basic and diluted 12.24 8.94
35.1 There were no convertible dilutive potential ordinary shares outstanding as at June 30, 2021 and 2020.
36. FAIR VALUE OF FINANCIAL INSTRUMENTS
36.1
Level 1: Fair value measurements using quoted prices (unadjusted) in active markets for identical assets or liabilities.
Level 3: Fair value measurements using input for the asset or liability that are not based on observable market data (i.e.unobservable inputs).
Level 2: Fair value measurements using inputs other than quoted prices included within Level 1 that are observable forthe assets or liability, either directly (i.e. as prices) or indirectly (i.e. derived from prices).
The fair value of quoted securities other than those classified as held to maturity, is based on quoted market price.Quoted securities classified as held to maturity are carried at cost. The fair value of unquoted equity securities, other thaninvestments in associates, is determined on the basis of the break-up value of these investments as per their latestavailable audited financial statements.
The fair value of unquoted debt securities, fixed term loans, other assets, other liabilities, fixed term deposits andborrowings cannot be calculated with sufficient reliability due to the absence of a current and active market for theseassets and liabilities and reliable data regarding market rates for similar instruments.
In the opinion of the management, the fair value of the remaining financial assets and liabilities are not significantlydifferent from their carrying values since these are either short-term in nature or, in the case of customer loans anddeposits, are frequently repriced.
The Group measures fair values using the following fair value hierarchy that reflects the significance of the inputs used inmaking the measurements:
Note
----- (Number of shares) -----
------- (Rupees) -------
------- (Rupees in '000) -------
(Un-audited)
25
NOTES TO THE CONSOLIDATED CONDENSED INTERIM FINANCIAL STATEMENTS (UN-AUDITED)FOR THE SIX MONTHS ENDED JUNE 30, 2021

74 United Bank Limited
NOTES TO THE CONSOLIDATED CONDENSED INTERIM FINANCIAL STATEMENTS (UN-AUDITED)FOR THE SIX MONTHS ENDED JUNE 30, 2021
On-balance sheet financial instruments Level 1 Level 2 Level 3 Total Financial assets measured at fair value- Investments
Federal Government Securities (T-bills, PIBs, GoP Sukuks, Eurobonds, Modaraba Pool) 1,094,550,496 - 1,094,550,496 - 1,094,550,496
Foreign Bonds - sovereign 59,589,986 - 59,589,986 - 59,589,986Foreign Bonds - others 3,617,040 - 3,617,040 - 3,617,040Ordinary shares of listed companies 12,325,922 12,325,922 - - 12,325,922Mutual Fund 221,885 - 221,885 - 221,885Debt securities (TFCs, Corporate Sukuks) 1,840,339 - 1,840,339 - 1,840,339Investment in REIT 459,424 - 459,424 - 459,424
1,172,605,092 12,325,922 1,160,279,170 - 1,172,605,092Financial assets not measured at fair value- Investments
Federal Government Securities (PIBs, GoP Sukuks Eurobonds, Bai Muajjal) 250,103,243 - 252,292,272 - 252,292,272
Foreign Bonds - sovereign 32,280,896 - 33,456,448 - 33,456,448Foreign Bonds - others 1,923,949 - 1,999,967 - 1,999,967Debt securities (TFCs, Corporate Sukuks and others) 19,438,405 - 19,683,070 - 19,683,070
303,746,493 - 307,431,757 - 307,431,7571,476,351,585 12,325,922 1,467,710,927 - 1,480,036,849
Off-balance sheet financial instrumentsForward purchase and sale of foreign exchange contracts 645,580,046 - (379,527) - (379,527)FX options - purchased and sold (net) 2,338,968 - - - - Forward purchase of Government Securities 707,328 - (183) - (183)Forward sale of Government Securities - - - - -
Fair value of non-financial assetsFixed Assets 59,424,589 - - 59,424,589 59,424,589Non-banking assets acquired in satisfaction of claims 203,676 - - 203,676 203,676
59,628,265 - - 59,628,265 59,628,265
On-balance sheet financial instruments Level 1 Level 2 Level 3 Total Financial assets measured at fair value- Investments
Government Securities (T-bills, PIBs, GoP Sukuks Eurobonds, Modaraba Pool) 811,834,934 - 811,834,934 - 811,834,934
Foreign Bonds - sovereign 81,709,882 - 81,709,882 - 81,709,882Foreign Bonds - others 7,503,650 - 7,503,650 - 7,503,650Ordinary shares of listed companies 10,383,260 10,383,260 - - 10,383,260Mutual Fund 228,518 - 228,518 - 228,518Debt securities (TFCs, Corporate Sukuks) 1,720,302 - 1,720,302 - 1,720,302Investment in REIT 441,914 441,914 - - 441,914
913,822,460 10,825,174 902,997,286 - 913,822,460Financial assets not measured at fair value- Investments
Government Securities (T-bills, PIBs, GoP Sukuks Eurobonds, Bai Muajjal) 202,261,340 - 208,585,861 - 208,585,861
Foreign Bonds - sovereign 27,108,735 - 25,838,959 - 25,838,959Foreign Bonds - others 1,238,565 - 1,285,465 - 1,285,465Debt securities (TFCs, Corporate Sukuks and others) 16,411,853 - 16,570,036 - 16,570,036
247,020,493 - 252,280,321 - 252,280,3211,160,842,953 10,825,174 1,155,277,607 - 1,166,102,781
Off-balance sheet financial instrumentsForward purchase and sale of foreign exchange contracts 683,065,647 - (29,391) - (29,391)FX options - purchased and sold (net) - - - - - Forward purchase of Government Securities - - - - - Forward sale of Government Securities - - - - -
Fair value of non-financial assetsFixed Assets 42,299,453 - - 42,299,453 42,299,453Non-banking assets acquired in satisfaction of claims 236,084 - - 236,084 236,084
42,535,537 - - 42,535,537 42,535,537
June 30, 2021 (Un-audited)
The table below analyses financial instruments measured at the end of the reporting period by the level in the fair valuehierarchy into which the fair value measurement is categorised:
----------------------------------(Rupees in '000)---------------------------------
Carrying / Notional value
Fair value
----------------------------------(Rupees in '000)---------------------------------
December 31, 2020 (Audited)Carrying /
Notional valueFair value
26
NOTES TO THE CONSOLIDATED CONDENSED INTERIM FINANCIAL STATEMENTS (UN-AUDITED)FOR THE SIX MONTHS ENDED JUNE 30, 2021

75Half Yearly Report 2021
NOTES TO THE CONSOLIDATED CONDENSED INTERIM FINANCIAL STATEMENTS (UN-AUDITED)FOR THE SIX MONTHS ENDED JUNE 30, 2021
36.2
36.3 Valuation techniques used in determination of fair values within level 2 and level 3 are as follows.
Debt Securities
Derivatives
The fair valuation techniques include forward pricing and swap models using present value calculations.
37. SEGMENT INFORMATION
37.1 Segment details with respect to business activities
Profit and LossNet mark-up / return / profit 11,746,753 36,866,641 (18,942,711) 1,917,490 3,794,060 1,245,391 (293,327) 36,334,297Inter segment (expense) / revenue - net (9,699,132) (33,307,860) 39,935,709 - - - 3,071,283 - Non mark-up / return / interest income 1,582,025 1,705,321 4,521,379 169,940 2,871,976 601,348 368,637 11,820,626Total income 3,629,646 5,264,102 25,514,377 2,087,430 6,666,036 1,846,739 3,146,593 48,154,923
Segment direct expenses 599,967 314,245 13,045,262 897,707 2,332,203 1,598,879 3,566,111 22,354,374Inter segment expense allocation 252,943 40,337 3,048,057 - 307,437 - (3,648,774) - Total expenses 852,910 354,582 16,093,319 897,707 2,639,640 1,598,879 (82,663) 22,354,374(Reversals) / provisions and write-offs - net (132,311) (591,454) (407,642) (2,966) 1,031,493 (70,537) 15,484 (157,933)Profit before tax from continuing operations 2,909,047 5,500,974 9,828,700 1,192,689 2,994,903 318,397 3,213,772 25,958,482
Profit and LossNet mark-up / return / profit 23,018,771 36,409,262 (26,043,876) 2,007,256 4,050,078 948,676 (321,035) 40,069,132Inter segment (expense) / revenue - net (18,418,839) (34,105,391) 48,931,336 - - - 3,592,894 - Non mark-up / return / interest income 1,023,820 1,800,720 3,565,942 105,713 1,181,587 1,156,537 913,288 9,747,607Total income / (loss) 5,623,752 4,104,591 26,453,402 2,112,969 5,231,665 2,105,213 4,185,147 49,816,739
Segment direct expenses 579,258 243,183 11,993,902 882,422 2,754,969 1,788,171 3,359,930 21,601,835Inter segment expense allocation 190,466 34,880 2,307,653 - 255,361 - (2,788,360) - Total expenses 769,724 278,063 14,301,555 882,422 3,010,330 1,788,171 571,570 21,601,835(Reversals) / provisions and write-offs - net 88,065 155,374 856,191 4,939 8,310,916 522,773 14,336 9,952,594Profit / (loss) before tax from continuing operations 4,765,963 3,671,154 11,295,656 1,225,608 (6,089,581) (205,731) 3,599,241 18,262,310
Fixed assets and non-banking assets acquired in satisfaction of claims
------------------------------------------------------------------------------------------------ (Rupees in '000) ------------------------------------------------------------------------------------------------
------------------------------------------------------------------------------------------------ (Rupees in '000) ------------------------------------------------------------------------------------------------
For the six months ended June 30, 2020 (Un-audited)
Corporate / Commercial
BankingTreasury Branch
BankingIslamic
Banking
Land, buildings and non-banking assets acquired in satisfaction of claims are revalued on a periodic basis usingprofessional valuers. The valuation is based on their assessment of the market value of the assets. The effect ofchanges in the unobservable inputs used in the valuations cannot be determined with certainty. Accordingly, a qualitativedisclosure of sensitivity has not been presented in these consolidated condensed interim financial statements.
Certain categories of fixed assets (land and buildings) and non-banking assets acquired in satisfaction of claims arecarried at revalued amounts (level 3 measurement) determined by professional valuers based on their assessment of themarket values as disclosed in note 11 and note 15.
The fair value of Federal Government securities is determined using the prices / rates available on Mutual FundsAssociation of Pakistan (MUFAP) and the fair value of other corporate and foreign Government securities is determinedusing the rates from Reuters / Bloomberg.
International branch
operationsSubsidiaries Others Total
For the six months ended June 30, 2021 (Un-audited)
Corporate / Commercial
BankingTreasury Branch
BankingIslamic
Banking
International branch
operationsSubsidiaries Others Total
27
NOTES TO THE CONSOLIDATED CONDENSED INTERIM FINANCIAL STATEMENTS (UN-AUDITED)FOR THE SIX MONTHS ENDED JUNE 30, 2021

76 United Bank Limited
NOTES TO THE CONSOLIDATED CONDENSED INTERIM FINANCIAL STATEMENTS (UN-AUDITED)FOR THE SIX MONTHS ENDED JUNE 30, 2021
Balance SheetCash and bank balances 9,515 79,563,460 119,688,958 12,368,881 50,358,112 19,680,568 787,718 282,457,212Investments 7,503,061 1,262,799,248 - 68,539,121 113,080,763 27,152,206 4,742,675 1,483,817,074Net inter segment lending - - 1,325,910,472 30,847,176 - - 85,877,346 1,442,634,994Lendings to financial institutions - 21,734,325 - - - 3,106,729 - 24,841,054Advances - performing 357,454,663 16,939 43,424,603 43,456,874 95,822,270 95,707,935 6,173,908 642,057,192Advances - non-performing 2,907,797 - 547,032 8,832 7,413,073 3,014,770 14,349 13,905,853Others 9,497,782 16,100,463 15,152,668 2,580,305 11,385,322 6,416,920 39,896,353 101,029,813Total assets 377,372,818 1,380,214,435 1,504,723,733 157,801,189 278,059,540 155,079,128 137,492,349 3,990,743,192
Borrowings 55,761,710 179,699,106 4,559,481 3,696,805 19,049,768 9,039,431 - 271,806,301Subordinated debt - - - - - - 10,000,000 10,000,000Deposits and other accounts 48,779,096 134,986 1,450,188,109 143,200,166 206,909,896 117,221,324 313,505 1,966,747,082Net inter segment borrowing 257,031,378 1,184,593,196 - - 1,010,420 - - 1,442,634,994Others 13,969,542 11,201,953 45,315,747 4,942,051 4,693,096 1,818,164 12,792,807 94,733,360Total liabilities 375,541,726 1,375,629,241 1,500,063,337 151,839,022 231,663,180 128,078,919 23,106,312 3,785,921,737Equity 1,831,092 4,585,194 4,660,396 5,962,167 46,396,360 27,000,209 114,386,037 204,821,455Total equity and liabilities 377,372,818 1,380,214,435 1,504,723,733 157,801,189 278,059,540 155,079,128 137,492,349 3,990,743,192
Contingencies and Commitments 365,216,743 198,404,512 29,959,047 30,665,208 464,452,076 56,219,050 2,463,233 1,147,379,869
Balance SheetCash and bank balances 5,833 81,844,130 121,154,769 12,061,714 47,378,919 24,477,950 799,172 287,722,487Investments 4,803,162 932,393,450 - 62,729,601 123,251,328 40,068,180 4,557,791 1,167,803,512Net inter segment lending - - 1,139,940,361 7,997,409 - - 77,017,055 1,224,954,825Lendings to financial institutions - - - 19,959,132 - 2,253,310 - 22,212,442Advances - performing 360,426,353 - 41,532,652 20,521,606 89,119,069 80,220,386 6,811,741 598,631,807Advances - non-performing 3,287,884 - 802,173 16,551 7,754,943 1,351,794 6,524 13,219,869Others 14,416,544 16,648,272 14,968,909 1,705,673 13,301,659 7,426,167 43,818,857 112,286,081Total assets 382,939,776 1,030,885,852 1,318,398,864 124,991,686 280,805,918 155,797,787 133,011,140 3,426,831,023
Borrowings 51,240,762 58,593,525 4,600,487 3,632,752 9,321,566 4,438,093 - 131,827,185Subordinated debt - - - - - - 10,000,000 10,000,000Deposits and other accounts 50,351,838 132,797 1,257,558,195 111,478,161 220,015,338 124,607,281 248,676 1,764,392,286Net inter segment borrowing 263,282,545 960,917,205 - - 755,075 - - 1,224,954,825Others 13,412,717 3,328,909 47,513,400 4,811,546 6,305,922 1,728,707 10,923,640 88,024,841Total liabilities 378,287,862 1,022,972,436 1,309,672,082 119,922,459 236,397,901 130,774,081 21,172,316 3,219,199,137Equity 4,651,914 7,913,416 8,726,782 5,069,227 44,408,017 25,023,706 111,838,824 207,631,886Total equity and liabilities 382,939,776 1,030,885,852 1,318,398,864 124,991,686 280,805,918 155,797,787 133,011,140 3,426,831,023
Contingencies and Commitments 354,762,782 278,633,736 13,182,354 377,425 398,498,687 86,347,176 2,705,380 1,134,507,540
38. RELATED PARTY TRANSACTIONS
As at June 30, 2021 (Un-audited)Corporate / Commercial
BankingTreasury Branch
BankingIslamic
Banking
International branch
operationsSubsidiaries Others Total
Details of transactions with related parties during the period / year, other than those which have been disclosedelsewhere in these consolidated condensed interim financial statements, are as follows:
------------------------------------------------------------------------------------------------ (Rupees in '000) ------------------------------------------------------------------------------------------------
As at December 31, 2020 (Audited)Corporate / Commercial
BankingTreasury Branch
BankingIslamic
Banking
International branch
operations
The Group has related party transactions with its associates, employee benefit plans and its Directors and KeyManagement Personnel (including their associates).
The Group enters into transactions with related parties in the ordinary course of business and on substantially the sameterms as for comparable transactions with person of similar standing. Contributions to and accruals in respect of staffretirement benefits and other benefit plans are made in accordance with the actuarial valuations / terms of thecontribution plan. Remuneration to the executives / officers is determined in accordance with the terms of theirappointment.
Subsidiaries Others Total
------------------------------------------------------------------------------------------------ (Rupees in '000) ------------------------------------------------------------------------------------------------
28
NOTES TO THE CONSOLIDATED CONDENSED INTERIM FINANCIAL STATEMENTS (UN-AUDITED)FOR THE SIX MONTHS ENDED JUNE 30, 2021
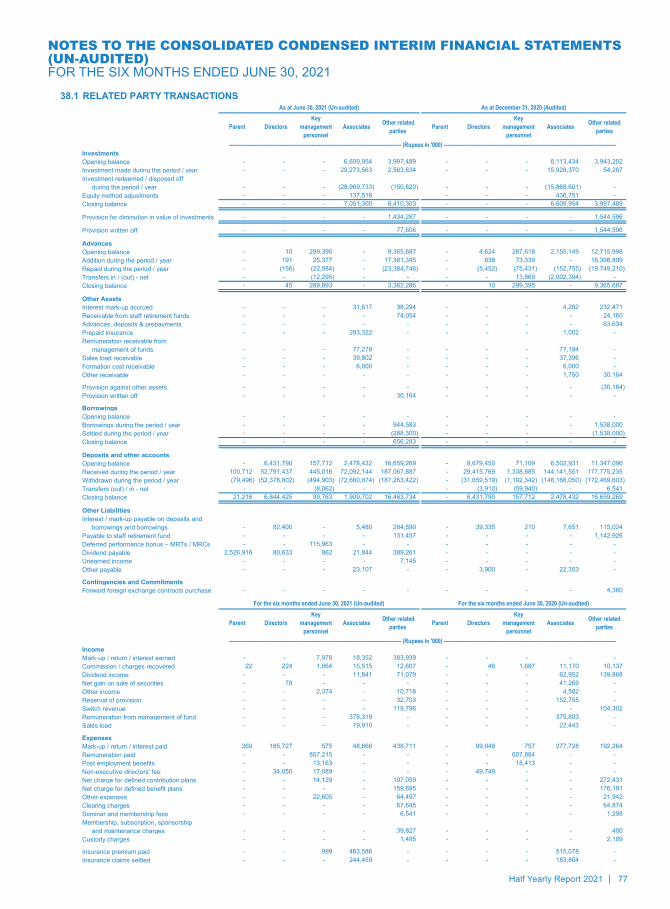
77Half Yearly Report 2021
NOTES TO THE CONSOLIDATED CONDENSED INTERIM FINANCIAL STATEMENTS (UN-AUDITED)FOR THE SIX MONTHS ENDED JUNE 30, 202138.1 RELATED PARTY TRANSACTIONS
Parent DirectorsKey
management personnel
Associates Other related parties Parent Directors
Key management
personnelAssociates Other related
parties
InvestmentsOpening balance - - - 6,609,954 3,997,489 - - - 6,113,434 3,943,202Investment made during the period / year - - - 29,273,563 2,563,634 - - - 15,928,370 54,287Investment redeemed / disposed off
during the period / year - - - (28,969,733) (150,820) - - - (15,868,601) - Equity method adjustments - - - 137,516 - - - 436,751 - Closing balance - - - 7,051,300 6,410,303 - - - 6,609,954 3,997,489
Provision for diminution in value of investments - - - - 1,434,287 - - - - 1,544,596
Provision written off - - - - 77,606 - - - - 1,544,596
Advances Opening balance - 10 299,395 - 9,365,687 - 4,624 287,618 2,155,149 12,715,998Addition during the period / year - 191 25,377 - 17,381,345 - 838 73,339 - 16,398,899Repaid during the period / year - (156) (22,584) - (23,384,746) - (5,452) (75,431) (152,755) (19,749,210)Transfers in / (out) - net - - (12,295) - - - - 13,869 (2,002,394) - Closing balance - 45 289,893 - 3,362,286 - 10 299,395 - 9,365,687
Other AssetsInterest mark-up accrued - - - 31,617 38,294 - - - 4,282 232,471Receivable from staff retirement funds - - - - 74,054 - - - - 24,160Advances, deposits & prepayments - - - - - - - - - 63,634Prepaid insurance - - - 283,322 - - - - 1,002 - Remuneration receivable from
management of funds - - - 77,278 - - - - 77,194 - Sales load receivable - - - 39,802 - - - - 37,396 - Formation cost receivable - - - 6,000 - - - - 6,000 - Other receivable - - - - - - - - 1,750 30,164
Provision against other assets - - - - - - - - - (30,164)Provision written off - - - - 30,164 - - - - -
BorrowingsOpening balance - - - - - - - - - - Borrowings during the period / year - - - - 944,583 - - - - 1,538,000Settled during the period / year - - - - (288,300) - - - - (1,538,000)Closing balance - - - - 656,283 - - - - -
Deposits and other accountsOpening balance - 6,431,790 157,712 2,478,432 16,659,269 - 8,679,450 71,109 6,502,931 11,347,096Received during the period / year 100,712 52,791,437 445,016 72,092,144 187,067,887 - 29,415,769 1,338,885 144,141,551 177,775,235Withdrawn during the period / year (79,496) (52,378,802) (494,903) (72,660,874) (187,263,422) - (31,659,519) (1,192,342) (148,166,050) (172,469,603)Transfers (out) / in - net - - (8,062) - - - (3,910) (59,940) - 6,541Closing balance 21,216 6,844,425 99,763 1,909,702 16,463,734 - 6,431,790 157,712 2,478,432 16,659,269
Other LiabilitiesInterest / mark-up payable on deposits and
borrowings and borrowings - 82,400 - 5,480 284,590 - 39,335 210 7,651 115,024Payable to staff retirement fund - - - - 131,457 - - - - 1,142,926Deferred performance bonus – MRTs / MRCs - - 115,963 - - - - - - - Dividend payable 2,526,916 80,633 862 21,844 389,261 - - - - - Unearned income - - - - 7,145 - - - - - Other payable - - - 23,107 - - 3,900 - 22,353 -
Contingencies and CommitmentsForward foreign exchange contracts purchase - - - - - - - - - 4,360
Parent DirectorsKey
management personnel
Associates Other related parties Parent Directors
Key management
personnelAssociates Other related
parties
IncomeMark-up / return / interest earned - - 7,978 18,352 383,939 - - - - - Commission / charges recovered 22 224 1,064 15,515 12,607 - 46 1,687 11,170 10,137Dividend income - - - 11,841 71,079 - - - 62,952 139,868Net gain on sale of securities - 78 - - - - - - 41,269 - Other income - - 2,374 - 10,718 - - - 4,582 - Reserval of provision - - - - 32,703 - - - 152,755 - Switch revenue - - - - 119,796 - - - - 104,302Remuneration from management of fund - - - 378,319 - - - - 375,803 - Sales load - - - 19,910 - - - - 22,443 -
ExpensesMark-up / return / interest paid 269 185,727 575 48,666 438,711 - 99,948 757 277,728 192,264Remuneration paid - - 857,215 - - - - 607,884 - - Post employment benefits - - 13,163 - - - - 18,413 - - Non-executive directors' fee - 34,050 17,089 - - - 49,749 - - - Net charge for defined contribution plans - - 14,129 - 197,059 - - - - 272,431Net charge for defined benefit plans - - - - 159,695 - - - - 176,191Other expenses - - 22,605 - 64,497 - - - - 21,942Clearing charges - - - - 67,645 - - - - 64,874Seminar and membership fees - - - - 6,541 - - - - 1,298Membership, subscription, sponsorship
and maintenance charges - - - - 39,827 - - - - 400Custody charges - - - - 1,485 - - - - 2,189- Insurance premium paid - - 999 463,586 - - - - 515,078 - Insurance claims settled - - - 244,459 - - - - 183,804 -
------------------------------------------------------------------------------------------------------ (Rupees in '000) ------------------------------------------------------------------------------------------------------
As at December 31, 2020 (Audited)As at June 30, 2021 (Un-audited)
For the six months ended June 30, 2020 (Un-audited)For the six months ended June 30, 2021 (Un-audited)
------------------------------------------------------------------------------------------------------ (Rupees in '000) ------------------------------------------------------------------------------------------------------
29
NOTES TO THE CONSOLIDATED CONDENSED INTERIM FINANCIAL STATEMENTS (UN-AUDITED)FOR THE SIX MONTHS ENDED JUNE 30, 2021

78 United Bank Limited
NOTES TO THE CONSOLIDATED CONDENSED INTERIM FINANCIAL STATEMENTS (UN-AUDITED)FOR THE SIX MONTHS ENDED JUNE 30, 2021
39. CAPITAL ADEQUACY, LEVERAGE RATIO AND LIQUIDITY REQUIREMENTS (Un-audited) (Audited)June 30, December 31,
2021 2020
Minimum Capital Requirement (MCR):Paid-up capital (net of losses) 12,241,797 12,241,797
Capital Adequacy Ratio (CAR):Eligible Common Equity Tier 1 (CET 1) Capital 136,189,095 137,040,359Eligible Additional Tier 1 (ADT 1) Capital 10,731,032 10,735,774Total Eligible Tier 1 Capital 146,920,127 147,776,133Eligible Tier 2 Capital 47,173,383 47,926,723Total Eligible Capital (Tier 1 + Tier 2) 194,093,510 195,702,856
Risk Weighted Assets (RWAs):Credit Risk 665,263,845 642,342,717Market Risk 88,999,057 73,650,146Operational Risk 164,656,143 164,656,143Total 918,919,045 880,649,006
Common Equity Tier 1 Capital Adequacy Ratio 14.82% 15.56%Tier 1 Capital Adequacy Ratio 15.99% 16.78%Total Capital Adequacy Ratio 21.12% 22.22%
(Un-audited) (Audited) June 30, December 31,
2021 2020
Leverage Ratio (LR):Eligible Tier-1 Capital 146,920,127 147,776,133Total Exposures 3,157,950,540 2,639,232,164Leverage Ratio 4.65% 5.60%
Liquidity Coverage Ratio (LCR):Total High Quality Liquid Assets 1,055,220,404 1,035,616,032Total Net Cash Outflow 317,503,108 324,975,005Liquidity Coverage Ratio 332.35% 318.68%
Net Stable Funding Ratio (NSFR):Total Available Stable Funding 1,968,023,129 1,714,566,321Total Required Stable Funding 864,803,727 770,865,635Net Stable Funding Ratio 227.57% 222.42%
------- (Rupees in '000) -------
The SBP through its BSD Circular No. 07 dated April 15, 2009 has prescribed the minimum paid-up capital (net ofaccumulated losses) for Banks to be raised to Rs. 10,000 million by the year ending December 31, 2015. The paid-upcapital of the Bank for the period ended June 30, 2021, stood at Rs.12,241.797 million (December 31, 2020:Rs.12,241.797 million) and is in compliance with SBP requirements. Banks are also required to maintain a minimumCapital Adequacy Ratio (CAR) of 10.0% plus Capital Conservation Buffer (CCB) of 2.5%. and High Loss AbsorbencyRequirement of 1.0% of the risk weighted exposures of the Bank.
Under the current capital adequacy regulations, credit risk and market risk exposures are measured using theStandardised Approach and operational risk is measured using the Basic Indicator Approach. Credit risk mitigants arealso applied against the Bank’s exposures based on eligible collateral under comprehensive approach.
------- (Rupees in '000) -------
In order to dampen the effects of COVID-19, SBP via BPRD Circular Letter No. 12 of 2020 has given a regulatory reliefand reduced the Capital Conservation Buffer (CCB) as prescribed vide BPRD Circular No. 6 of August 15, 2013, for thetime being, from its existing level of 2.5% to 1.5%, till further instructions.
Further, under Basel III instructions, Banks are also required to maintain a Common Equity Tier 1 (CET 1) ratio and Tier 1ratio of 6.0% and 7.5%, respectively, as at June 30, 2021. The Bank is fully compliant with prescribed ratios as the Bank’sCAR is 21.12% whereas the CET 1 and Tier 1 ratios stand at 14.82% and 15.99% respectively.
30
NOTES TO THE CONSOLIDATED CONDENSED INTERIM FINANCIAL STATEMENTS (UN-AUDITED)FOR THE SIX MONTHS ENDED JUNE 30, 2021

79Half Yearly Report 2021
NOTES TO THE CONSOLIDATED CONDENSED INTERIM FINANCIAL STATEMENTS (UN-AUDITED)FOR THE SIX MONTHS ENDED JUNE 30, 2021
40. ISLAMIC BANKING BUSINESS
(Un-audited) (Audited)June 30, December 31,
2021 2020
ASSETSCash and balances with treasury banks 8,965,569 9,784,450 Balances with other banks 3,403,312 2,277,264 Due from financial institutions 40.1 - 19,959,132 Investments 40.2 68,539,121 62,729,601 Islamic financing and related assets - net 40.3 43,465,706 20,538,157 Fixed assets 935,504 984,416 Intangible assets 3,325 4,638 Due from Head Office 30,847,176 7,997,409 Other assets 1,641,476 716,619 Total Assets 157,801,189 124,991,686
LIABILITIESBills payable 1,359,112 2,487,519 Due to financial institutions 3,696,805 3,632,752 Deposits and other accounts 40.4 143,200,166 111,478,161 Due to Head Office - - Other liabilities 3,582,939 2,324,027
151,839,022 119,922,459 NET ASSETS 5,962,167 5,069,227
REPRESENTED BYIslamic Banking Fund 2,181,000 2,181,000 Deficit on revaluation of assets 79,348 (86,052) Accumulated profit 40.8 3,701,819 2,974,279
5,962,167 5,069,227
CONTINGENCIES AND COMMITMENTS 40.5
The profit and loss account of the Bank's Islamic Banking branches for the six months ended June 30, is as follows:
January - June 2021
January - June 2020
Profit / return earned 40.6 4,225,371 4,606,068 Profit / return expensed 40.7 (2,307,881) (2,598,812) Net profit / return 1,917,490 2,007,256
Other income Fee and commission income 138,573 102,446 Foreign exchange income 19,685 1,058 Loss on securities - net (285) (5,197) Other Income 11,967 7,406 Total other income 169,940 105,713
Total income 2,087,430 2,112,969 Other operating expenses (897,707) (882,422)
Profit before provisions 1,189,723 1,230,547 (Reversals) / provisions and write-offs - net (2,966) 4,939 Profit before taxation 1,192,689 1,225,608 Taxation (465,149) (477,987) Profit after taxation 727,540 747,621
--------- (Rupees in '000) ---------
The Bank operates 100 (December 31, 2020: 100) Islamic Banking branches and 187 (December 31, 2020: 187) IslamicBanking windows.
--------- (Rupees in '000) ---------
(Un-audited)
Note
31
NOTES TO THE CONSOLIDATED CONDENSED INTERIM FINANCIAL STATEMENTS (UN-AUDITED)FOR THE SIX MONTHS ENDED JUNE 30, 2021

80 United Bank Limited
NOTES TO THE CONSOLIDATED CONDENSED INTERIM FINANCIAL STATEMENTS (UN-AUDITED)FOR THE SIX MONTHS ENDED JUNE 30, 2021
40.1 Due from Financial Institutions
Musharakah - - - 6,000,000 - 6,000,000Mudarabhah - - - 4,500,000 - 4,500,000
Bai Muajjal receivablefrom State Bank of Pakistan - - - 6,433,114 - 6,433,114from other Financial Institutions - - - 3,026,018 - 3,026,018
- - - 19,959,132 - 19,959,132
40.2 Investments by segments
Note
Federal Government Securities- Ijarah Sukuks 23,995,452 - 79,348 24,074,800 19,992,452 - (86,052) 19,906,400- Government of Pakistan Mudarabhah Pool 1,138,873 - - 1,138,873 466,435 - - 466,435- Bai Muajjal with Govt. of Pakistan 40.2.1 31,115,551 - - 31,115,551 29,569,648 - - 29,569,648
56,249,876 - 79,348 56,329,224 50,028,535 - (86,052) 49,942,483
Non Government Debt Securities - Listed 700,000 - - 700,000 450,000 - - 450,000 - Unlisted 11,509,897 - - 11,509,897 12,337,118 - - 12,337,118
12,209,897 - - 12,209,897 12,787,118 - - 12,787,118Total Investments 68,459,773 - 79,348 68,539,121 62,815,653 - (86,052) 62,729,601
(Un-audited) (Audited)June 30, December
2021 202040.2.1 Bai Muajjal with Government of Pakistan
Bai Muajjal Investment 33,031,000 33,031,000Less: Deferred Income (1,915,449) (3,461,352)Bai Muajjal Investment - net 31,115,551 29,569,648
40.3 Islamic financing and related assets
Ijarah 442,864 440,754 Murabahah 446,893 272,766 Musharakah 19,996,158 8,392,690 Diminishing Musharakah 14,649,370 6,754,380 Istisna 61,507 39,584 Islamic Export Refinance scheme - Musharakah 2,839,544 2,989,544 Advances against Islamic assets
Advances against Ijarah 24,271 77,190 Advances for Diminishing Musharakah 2,953,290 410,595 Advances for Murabahah 18,459 33,427 Advances against Mera Pakistan Mera Ghar 77,788 459 Advances against Islamic Temporary Economic Refinance Scheme 345,640Advances for Istisna Islamic Export Refiance Scheme 452,749 456,623 Advances for Istisna 477,763 148,586
Inventory related to Islamic financing Istisna 329,866 296,918
Profit and other receivables against financings 468,886 336,219Gross Islamic financing and related assets 43,585,048 20,649,735
Less: Provision against Islamic financing- Specific (86,441) (90,927)- General (32,901) (20,651)
(119,342) (111,578)Islamic financing and related assets - net of provision 43,465,706 20,538,157
June 30, 2021 (Un-audited)In Local
CurrencyIn Foreign Currencies Total In Local
Currency TotalIn Foreign Currencies
December 31, 2020 (Audited)
--------------------------------------------------------------- (Rupees in '000) ---------------------------------------------------------------
------------------------------------- (Rupees in '000) -------------------------------------
----------------------------------------------------------------------------------------- (Rupees in '000) -----------------------------------------------------------------------------------------
Surplus / (Deficit)
Carrying Value
June 30, 2021 (Un-audited) Cost /
Amortised cost
Provision for diminution
Surplus / (Deficit)
Carrying Value
Cost / Amortised
cost
Provision for diminution
December 31, 2020 (Audited)
32
NOTES TO THE CONSOLIDATED CONDENSED INTERIM FINANCIAL STATEMENTS (UN-AUDITED)FOR THE SIX MONTHS ENDED JUNE 30, 2021

81Half Yearly Report 2021
NOTES TO THE CONSOLIDATED CONDENSED INTERIM FINANCIAL STATEMENTS (UN-AUDITED)FOR THE SIX MONTHS ENDED JUNE 30, 2021
40.4 Deposits and other accounts (Un-audited) (Audited)June 30, December 31,
2021 2020
CustomersCurrent deposits 49,971,422 40,360,080Saving deposits 17,155,240 18,710,264Term deposits 13,005,500 5,662,065
80,132,162 64,732,409Financial Institutions Current deposits 7,041,091 2,046,933Saving deposits 25,720,413 22,697,263Term deposits 30,306,500 22,001,556
63,068,004 46,745,752143,200,166 111,478,161
40.4.1
(Un-audited) (Audited)June 30, December 31,
2021 202040.5 Contingencies and commitments
- Guarantees 52,598 111,454- Commitments 30,612,610 5,880,112
30,665,208 5,991,566
January - June 2021
January - June 2020
40.6 Profit / Return earned on Financing, Investments and Placements
Profit earned on:Financing 1,012,634 1,069,129Investments 2,921,467 2,648,665Placements 186,654 731,028Rental Income from Ijarah 104,616 157,246
4,225,371 4,606,068
40.7 Profit on Deposits and other Dues Expensed
Deposits and other accounts 2,229,517 2,519,427Due to Financial Institutions 31,075 21,114Return expense on leases 47,289 58,271
2,307,881 2,598,812
(Un-audited) (Audited)June 30, December 31,
40.8 Islamic Banking Business Unappropriated Profit 2021 2020
Opening balance 2,974,279 1,407,7361,192,689 2,514,739
Taxation (465,149) (948,196)Closing balance 3,701,819 2,974,279
Profit for the period / year
------------------------------------- (Rupees in '000) -------------------------------------
------------------------------------- (Rupees in '000) -------------------------------------
(Un-audited)
------------------------------------- (Rupees in '000) -------------------------------------
This includes deposits eligible to be covered under insurance arrangements amounting to Rs. 30,742.018 million(December 31, 2020: Rs. 31,125.997 million).
------------------------------------- (Rupees in '000) -------------------------------------
33
NOTES TO THE CONSOLIDATED CONDENSED INTERIM FINANCIAL STATEMENTS (UN-AUDITED)FOR THE SIX MONTHS ENDED JUNE 30, 2021

82 United Bank Limited
NOTES TO THE CONSOLIDATED CONDENSED INTERIM FINANCIAL STATEMENTS (UN-AUDITED)FOR THE SIX MONTHS ENDED JUNE 30, 2021
40.9 Disclosures for profit and loss distribution and pool management
General Pool(s)
IERS Pool(s)
Treasury Pool(s)
Special Pool(s)
Equity Pool(s)
The Mudarib’s share on Deposits for the period ended June 30, 2021 is Rs.1,580.106 million (45.14% of distributableprofit of Mudarabah Pool). of this, an amount of Rs. 345.504 million (21.87% of Mudarib share) was distributed back todepositors as Hiba. The rate of profit earned on average earning assets was 9.12% per annum and the rate of profitpaid on average deposits was 5.90% per annum.
The Bank operates general and special pools for deposits and inter-bank funds accepted / acquired under Mudarabah,Wakalah and Musharakah modes.
Under the General deposits pools, the Bank accepts funds on Mudarabah basis from depositors (Rab-ul-Maal) wherethe Bank acts as Manager (Mudarib) and invests the funds in the Shariah Compliant modes of financing, investmentsand placements. When utilising investing funds, the Bank prioritizes the funds received from depositors over the fundsgenerated from own sources after meeting the regulatory requirement relating to such deposits.
During the period, the Bank has given General Hiba to the depositors in General and specific pool, keeping in view theprescribed guidelines of Pool Management provided by the SBP. However, Hiba is given at the sole discretion of theBank without any contractual commitment with the depositors.
For General Pools, the Bank allocates PKR financing to Corporate, SMEs and Consumer Finance customers indiversified sectors and avenues of the economy / business and Investments in Sovereign Guarantee Sukuk, CorporateSukuk, Bai Muajjal with Government of Pakistan, are also done through General Pools. All remunerative deposits aretagged to these general pools and their funds generated from the depositors are invested on priority basis.
The IERS pool assets comprise of Sovereign Guarantee Sukuk, and financing to Corporate Customers and exportersas allowed under the applicable laws and regulations, and as such are exposed to lower credit risk. The Musharakahwith SBP under IERS is tagged to the IERS pool.
The Treasury pool assets generally comprise of Sovereign Guarantee Sukuk and financing under diminishingMusharakah, Ijarah facility and the related liability of the Treasury pool comprise of Musharakah / Wakalah / Mudarabahfrom financial institutions. These pools are created to meet the liquidity requirements of the Holding company.
Separate pool(s) are created where the customers desire to invest in high yield assets. These pool(s) rates are higherthan the general pool depending on the assets. In case of loss in special pool, the loss will be borne by the special poolmembers. The net return on the pool is arrived at after deduction of direct costs from the gross return earned on thepool. From the net return, profit is paid to the Mudarib in the ratio of the Mudarib’s equity in the pool to the total pool.The balance represents the distributable profit.
All other assets including fixed assets, advance against financing and subsidized financing to Bank's employees aretagged to equity pool. To safeguard the interest of customers, all high risk investments are done through equity pool.The Holding company as Mudarib in the general pools is responsible for financing costs / assets such as land, building,furniture, fixtures, computers and IT system from its own sources / equity.
Specific pools are operated for funds acquired / accepted from the Corporate Customers, other banks and State Bankof Pakistan for liquidity management and Islamic Export Refinance to the Bank's customers respectively under theMusharakah/ Mudarabah / Wakalah modes.
34
NOTES TO THE CONSOLIDATED CONDENSED INTERIM FINANCIAL STATEMENTS (UN-AUDITED)FOR THE SIX MONTHS ENDED JUNE 30, 2021

83Half Yearly Report 2021
NOTES TO THE CONSOLIDATED CONDENSED INTERIM FINANCIAL STATEMENTS (UN-AUDITED)FOR THE SIX MONTHS ENDED JUNE 30, 2021
The risk characteristics of pools
The Parameters used for allocation of profit, expenses and provisions to the Pool
- The profit of each deposit pool is calculated on all the remunerative assets booked by utilising the funds from the pool.
-
-
-
-
-
The Bank managed following pools during the period.
% % Rupees in '000 % % Rupees in '000
ADMA Pools 6 Mudarabah Monthly 7.17% 48.62% 22,917 6% 52.79% 12,099 Special Pools 60 Mudarabah Monthly 8.51% 34.91% 391,978 6.73% 38.12% 149,437 IERS Pools 12 Musharakah Monthly 6.40% 84.19% 166,621 2.00% 0.00% - FCY Pools 6 Mudarabah Monthly 1.75% 50.00% 788 1.06% 0.00% - General Pools 6 Mudarabah Monthly 9.46% 50.00% 1,165,211 5.48% 15.79% 183,968
% % Rupees in '000 % % Rupees in '000
ADMA Pools 6 Mudarabah Monthly 5.29% 50.00% 3,713 3.08% 16.55% 615Special Pools 60 Mudarabah Monthly 12.45% 28.45% 355,547 9.94% 31.50% 112,006IERS Pools 12 Musharakah Monthly 4.94% 86.89% 139,090 2.00% 0.00% - General Pools 6 Mudarabah Monthly 11.90% 50.00% 1,087,379 7.71% 29.62% 322,032
No expense of general or administrative nature is charged to the pools.
The risk characteristics of each pool mainly depends on the assets and liability profile of the pool. As per the Bank's policy,relatively low risk / secured financing transactions and assets are allocated to the pool. The Bank maintains General Pools,Special Pools, IERS pool and Equity pool. All pools are exposed to general credit risk, asset ownership risk and Profit rate riskof underlying assets involved.
Profit of pool is calculated after deduction of expenses directly incurred in earning the income of such pool, the directlyrelated costs comprise of depreciation on Ijarah assets, takaful premium, amortisation of premium on investment etc.
Amount of Mudarib share transferred
through Hiba
For the six months ended June 30, 2020 (Un-audited)
Mudarib fee / Musharakah
share / Wakalah Fee
No of Pools
Nature of Pool
Profit rate and
weightages announce-
ment period
Average profit rate
earned
Profit Sharing ratio
No provisions against any non-performing asset of the pool is passed on to the pool except on the actual loss / write-off ofsuch non-performing asset.
The profit of the pool is shared between equity and Rab-ul-Maal of the pool on the basis of Musharakah at gross level(before charging of mudarib fee) as per the investment ratio of the equity.
The profit of the pool is shared among the members of the pool on pre-defined mechanism based on the weightagesannounced before the profit calculation period after charging of mudarib fee.
Average profit rate /
return distributed
Percentage of Mudarib share
transferred through Hiba
Amount of Mudarib share transferred
through Hiba
For the six months ended June 30, 2021 (Un-audited)
Average profit rate /
return distributed
Percentage of Mudarib share
transferred through Hiba
Mudarib fee / Musharakah
share / Wakalah Fee
No of Pools
Nature of Pool
Profit rate and
weightages announce-
ment period
Average profit rate
earned
Profit Sharing ratio
35
NOTES TO THE CONSOLIDATED CONDENSED INTERIM FINANCIAL STATEMENTS (UN-AUDITED)FOR THE SIX MONTHS ENDED JUNE 30, 2021

84 United Bank Limited
NOTES TO THE CONSOLIDATED CONDENSED INTERIM FINANCIAL STATEMENTS (UN-AUDITED)FOR THE SIX MONTHS ENDED JUNE 30, 2021
(Un-audited) (Audited)June 30, December 31,
2021 2020
40.10 Deployment of Mudarabah based deposits by class of business
Chemical and pharmaceuticals 2,484,304 2,230,052Agri business 20,437,489 8,745,482Textile 2,380,905 1,991,142Financial 3,952,240 13,335,120Food industries 307,494 318,037Plastic 299,229 299,263Individuals 6,847,823 1,981,422Production and transmission of energy 18,742,631 13,496,129Government of Pakistan securities 56,329,223 59,401,615Others 3,746,145 3,817,471
115,527,483 105,615,733
41. NON-ADJUSTING EVENT AFTER THE BALANCE SHEET DATE
42. GENERAL
42.1 Comparatives
42.2 Figures have been rounded off to the nearest thousand rupees unless otherwise stated.
43. DATE OF AUTHORISATION
Aameer Karachiwalla Shazad G. Dada Shazia Syed Arshad Ahmad Mir Sir Mohammed Anwar Pervez, OBE, HPkChief Financial Officer President & Director Director Chairman Chief Executive Officer
Comparative information has been reclassified, rearranged or additionally incorporated in these consolidated condensedinterim financial statements for the purposes of better presentation.
These consolidated condensed interim financial statements were authorised for issue on August 06, 2021, by the Board ofDirectors of the Bank.
The Board of Directors in its meeting held on August 06, 2021, has declared an interim cash dividend in respect of the quarterended June 30, 2021 of Rs. 4.0 per share (June 30, 2020: Rs. Nil per share). These consolidated condensed interim financialstatements for the six months ended June 30, 2021 do not include the effect of these appropriations which will be accountedfor subsequent to the period end.
-------Rupees in '000-----
36
Aameer KarachiwallaChief Financial Of�cer
Shazad G. DadaPresident &
Chief Executive Of�cer
Shazia Syed Director
Arshad Ahmad Mir Director
Sir Mohammed Anwar Pervez, OBE, HPkChairman
NOTES TO THE CONSOLIDATED CONDENSED INTERIM FINANCIAL STATEMENTS (UN-AUDITED)FOR THE SIX MONTHS ENDED JUNE 30, 2021

Aameer KarachiwallaChief Financial Of�cer
Shazad G. DadaPresident &
Chief Executive Of�cer
Shazia Syed Director
Arshad Ahmad Mir Director
Sir Mohammed Anwar Pervez, OBE, HPkChairmanAameer Karachiwalla
Chief Financial Of�cerShazad G. Dada
President & Chief Executive Of�cer
Shazia Syed Director
Arshad Ahmad Mir Director
Sir Mohammed Anwar Pervez, OBE, HPkChairman
85Half Yearly Report 2021
(Future Outlook)
(Acknowledgements)
2021 6

86 United Bank Limited
47.421 (KSE-100) 100 2021
82020
9.0 2021 112020 19.8 2021 3 2020 850 2021 6 2020
9.32021 9.22020
(UBL International)
(OPEC)
(Sovereign Debt Securities)
re-alignment
2020 1.5 2020 1.3 2021 644 2021 1.2 2021 1.8 757 Sovereign 15 2020
19.1 2021 30 5.5 2021 38.1 2020
(Credit Rating)
(AAA/A-1+) VIS 2021 30
'AA+' (ADT-1)TFC Tier-1
(Award and Recognition)
" 2020 "
" "2020
2021 " " "

87Half Yearly Report 2021
633 408PIBs 209PIBs
(Capital Ratios) buffers
2019 D-SIB HLA D-SIB (HLA) CAR 1.5
1.0 502020
19 2021 30 1.5 2.5 CCB
HLA1.0 CAR 12.5
CET-11 11.0 12.5 24.42020 23.5CAR 2021 18.42020 17.72021 1
17.02020 16.42021
4 2021 30 2021 06
(Economy Review) 19 2020
2020 3.9 2021 (variants)
0.5
2021 1.2 9.7 2021 CPI
10.8 20 8.9
27 24.9 2021 90 2020
4.4 1.9 2021 25.3 2021 26.6 56.421
18.3
3.52021 1.52021
2021 30 157.54 1.4 2020
24.4 2021 18.92020 160

88 United Bank Limited
86.7
UBL Domestic 75 4582020 4792021
1.0 27.8 2021 28.7 2020 1.1 2021 1.12020
5.82021 6.32020
(UBL International) 2021 343.32020 344.62021
89.9 2020 52.0 2020 6.6
94.82021 FSV 86.32021 10.3.2 95.52020
(Cost Management)
2021 5 20.2 2021 3.2 2021 4 8.3
2021 8 20 2.1 2021 8 6.6
(Balance Sheet Managment) 1.85 13 2020 2.4 172020
1.6 162020 8.0 2020 8.3 2021 18 701 16 2020 7152021
2021 86.2 2021 85.22020 CASA 52020 1.3
53020 557 2021
52020 451 655 2021 212020 43
8 2020
29 2020 1.462021

89Half Yearly Report 2021
603 16 5.5 2020 3.4
60520 537 484 2020 436
9 19 13 355 31 2021 58
758 2020 15 644
26 1.2 2021
10 8.0 5.3 735 International Foreign Bond
(Non-Markup Income) 11.4 28 2021
19 2020 25
26 6.6 35 2021 2020
20 820 2021 12 841 2021
81 2020
1.18
84 883 2021 690 2020 1.1 2021
2021 343 2021 85 2020 24 462
881 2021 1.7 2020 1.2 2021 2.5 2021 11
676 2020 Capital gains
(Provisions and loan losses) 9.4 87 2021
1.6 82.12021 83.62020 2021 85.82020 12.92021 13.72020

90 United Bank Limited
. 2021 30
(Performance Overview) 25.9 37 2021 30
12 2021 2021
2021 48.0 2020 ) 46.5 2021 39.1 2020 35.1
28 2020 11.4
20.2 5 2020 40 43
9.4 87
(Financial Highlights) 11.4 2020 15.0 2021
9.31 2020 12.25 32
12.24 2021 10.7 15.0 8.94
(Net Markup Income) 11 35.1 10 2021
3.9 Net Interest Margin 1.8 13.25 2019 5.0 2020
7.0 2021 11.0 2020 7.02020
CASA 20 1.4 85.1 CASA 19 195 1.2
290,000 85.5 2020 618 22 231,0002020
43 42 2020


UNITED BANK LIMITEDUBL Head OfficeI.I. Chundrigar Road, Karachi - 74000, Pakistan.UAN: 111-825-888 Website: www.ubldigital.com
HALF YEARLY REPORTJUNE 30, 2021 (UN-AUDITED)
In Touchwith Tomorrow