Embed Size (px)
Citation preview

In this report: Sustainable Manufacturing
Issue 40 • September 19, 2012
• Benefits and Challenges
• Technologies and Methods
• Policies, Programs and Standards
• Q&As with Hershey’s, Cabot Corporation

EL Insights | © 2012 Environmental Leader LLC. Single license EL PRO subscription can be used by one person. For multiple users, purchase an enterprise license by emailing [email protected] for information.
EL Insights: Sustainable Manufacturing
Sustainable Manufacturing at a Glance
Manufacturers are increasingly looking at the sustainability of their operations as a way of cutting costs, raising their customer appeal, and improving their environmental profile. Sustainable manufacturing encompasses just about every environmental impact area, from energy consumption, output of greenhouse and other gases, water consumption and wastewater outputs to waste, recycling and even land use. Sustainable manufacturing also involves lowering the emissions of substances that can be harmful to employees, customers, the public and the environment at large. Manufacturers’ sphere of influence is vast, starting with the individual machines and systems on the factory floor, to the factory buildings themselves, expanding outward to the entire product lifecycle, from resource extraction to disposal.
This issue of EL Insights will look at the steps manufacturers are taking to lower the impact of their manufacturing equipment and processes, especially energy use, emissions and water use. Many previous EL Insights issues are also relevant to factory buildings; these include issues 7 (Energy-Efficient Lighting), 16 (Energy-Efficient HVAC), 21 (Waste to Energy), 22 (Stationary Fuel Cells), 26 (On-Site Wind), 27 (On-Site Solar), 30 (Green and Cool Roofs) and 39 (Building Management Systems). These topics will not be covered in depth here. In addition, for a look at the lifecycle impact of manufactured products – that is, effects outside the factory gate – readers should refer to EL Insights issue 29, Green Product Design, and for more on water use, they should see EL Insights issue 23, Water Reuse and Recycling. All are available at http://www.environmentalleader.com/insights/.
Key indicators
There are almost as many sets of sustainable manufacturing indicators as there are companies. But there are some core indicators that are common, and are essential to measuring the sustainability of a company’s operations.

EL Insights | © 2012 Environmental Leader LLC. Single license EL PRO subscription can be used by one person. For multiple users, purchase an enterprise license by emailing [email protected] for information.
The OECD provides a helpful rubric, dividing sustainable manufacturing indicators into three categories: inputs, operations, and products.
Inputs: This includes intensity of restricted substances; recycled/reused content; and non-renewable materials intensity. Cutting non-renewable materials intensity can have a variety of environmental benefits, since materials may be scarce, be ecologically damaging to extract, require high amounts of energy for extraction and may have adverse effects on health and the environment.
Operations: This includes water intensity, energy intensity, renewable proportion of energy, greenhouse gas intensity, residuals intensity (a measure of wastes generation), air releases intensity, water releases intensity and proportion of natural land (how much land occupied by the company is “natural cover”).
Products: This includes recycled/reused content, recyclability, renewable materials content, non-renewable materials intensity, restricted substances content, energy consumption intensity and greenhouse gas emissions intensity.
Beyond these key metrics, another that companies may want to consider is the factory’s output of noise and odor, which can affect local residents.
Processes and systems
Some of the most energy- and water-intensive industrial processes include:
Industrial reactions and separations: These are used widely in the chemical and energy industries, and include advanced water removal, gas separation, and hybrid distillation.1
1 US Department of Energy, Industrial Technologies Program. Energy-Intensive Processes Portfolio: Addressing Key Energy Challenges Across U.S. Industry. March 2011. http://www1.eere.energy.gov/industry/intensiveprocesses/pdfs/eip_report.pdf

EL Insights | © 2012 Environmental Leader LLC. Single license EL PRO subscription can be used by one person. For multiple users, purchase an enterprise license by emailing [email protected] for information.
High-temperature processing: These are processes that alter materials’ physical and chemical properties to achieve product specifications. Such processes are used in the glass, aluminum, steel and metal casting industries, among others, and include heat treatment, surface treatment, melting and casting.2
Cleaning and rinsing: Many industries have found they can greatly reduce their water consumption by cutting the amount of water used for cleaning processes, or by re-using water before or after the cleaning step. Chemicals are also frequently used for cleaning, often in large quantities. The rinse and cleaning of semiconductor materials, for example, is often conducted with a large cushion of safety that creates an unnecessary waste of chemicals, water and energy, according to the SRC Engineering Research Center for Environmentally Benign Semiconductor Manufacturing at the University of Arizona. The center has responded by using real-time monitoring of water semiconductors’ surfaces, delivering 30 percent energy and water savings in the rinse and cleaning stage.3
Specific types of equipment that can profitably be targeted for energy and water efficiency include:
Boilers: These provide both hot water and steam. Steam has a variety of uses in industry, such as heating raw materials, generating electricity, powering equipment and heating buildings. Over 70 percent of US manufacturing boilers can be found in the industries of chemicals, petroleum refining, forest products and food processing.4 According to The Carbon Trust, heating and hot water account for over a
2 US Department of Energy, Industrial Technologies Program. Energy-Intensive Processes Portfolio: Addressing Key Energy Challenges Across U.S. Industry. March 2011. http://www1.eere.energy.gov/industry/intensiveprocesses/pdfs/eip_report.pdf
3 http://www.environmentalleader.com/2012/07/24/semiconductor-manufacturing-can-cut-water-energy-by-30/
4 Energetics and E3M for DOE Industrial Technologies Program. Energy Use, Loss and Opportunities Analysis: US Manufacturing and Mining. December 2004. http://www1.eere.energy.gov/library/asset_handler.aspx?src=http://www.eere.energy.gov/industry/intensiveprocesses/pdfs/energy_use_loss_opportunities_analysis.pdf&id=4524

EL Insights | © 2012 Environmental Leader LLC. Single license EL PRO subscription can be used by one person. For multiple users, purchase an enterprise license by emailing [email protected] for information.
third of energy consumption for UK organizations – and up to 60 percent of carbon emissions from some hot water-intensive industrial processes. However, heating costs can be reduced by up to 30 percent by implementing measures such as insulation, maintenance, and optimized stop and start controls. Simply by insulating boilers, pipework and valves in their hot water systems – particularly on older systems – organizations can save up to 10 percent of the boiler energy input. The establishment and upkeep of a regular maintenance plan is also a good way to improve efficiency and decrease energy costs. Poor maintenance can reduce boiler performance by up to 10 percent.
Air compressors: The Carbon Trust says that compressed air can be up to 30 percent of a facility’s energy use, with frequent users of compressed air including companies in aircraft and auto manufacturing, cement, ceramics, chemicals, electronics, engineering, food and drink, foundries, glass, insulation materials, minerals, paper and board, pharmaceuticals, power generation, rubber and plastics, steel, textiles, tobacco and water treatment. Of the total energy supplied to a compressor, as little as 8 to 10 percent is converted to usable energy at point of use, making it a very inefficient and expensive way of transferring energy. The Carbon Trust says businesses in the U.K. could save up to £110 million a year ($173 million) by taking simple actions, at little or no cost, to improve compressed air systems and processes.5
Other motor-driven systems: These include pumps, fans, conveyor belts, mixers, grinders, refrigerators, and materials handling and processing equipment. Motor-driven systems make up 13 percent of total energy end-use in US manufacturing and mining, but only 45 percent of this energy is actually delivered to the needed processes, and the rest is lost due to inefficiencies.6
5 http://www.environmentalleader.com/2012/01/27/compressed-air-improvements-could-save-business-173m/ , citing The Carbon Trust, The Compressed Air Overview Guide, January 2012. http://www.carbontrust.com/media/20267/ctv050_compressed_air.pdf
6 Energetics and E3M for DOE Industrial Technologies Program, Energy Use, Loss and Opportunities Analysis: US Manufacturing and Mining. December 2004. http://www1.eere.energy.gov/library/asset_handler.aspx?src=http://www.eere.energy.gov/industry/intensiveprocesses/pdfs/energy_use_loss_opportunities_analysis.pdf&id=4524

EL Insights | © 2012 Environmental Leader LLC. Single license EL PRO subscription can be used by one person. For multiple users, purchase an enterprise license by emailing [email protected] for information.
Technologies and methods
Some major approaches manufacturers can take to improve their sustainability are:
5,502
2,079 1,770
1,150 1,124 1,108 1,072 811 789 720
1,027
271 507 456 524 440 461 463 312 311
1,580
960 793
249 243 238 193 102 160 144
Texas Louisiana California Indiana Ohio Illinois Pennsylvania Kentucky Alabama Georgia
Top States by Industrial Energy Consumption, 2009 (trillion BTU)
Total Industrial Energy Consumption Electricity Use Natural Gas Use
Source: Department of Energy, Advanced Manufacturing Office

EL Insights | © 2012 Environmental Leader LLC. Single license EL PRO subscription can be used by one person. For multiple users, purchase an enterprise license by emailing [email protected] for information.
Eliminate wasteful operation: One of the first steps many plants take towards improving efficiency is to turn off equipment when it is not in use. For example, steel company ArcelorMittal’s specialty rolling mill plant in Conshohocken, Pa., implemented automated systems that idle electrical machinery during production delays, which along with other efficiency moves saved the plant more than $200,000 a year off its energy bills.7
Consolidation: Toyota found major improvements by merging production lines and eliminating some process steps. This relies on developing new technology that is better able to transform material, in fewer steps. In another example, Mazak Machine Tool Company in Japan improved its crankshaft prototype production operation by reducing the needed machines from 13 to 1, cutting processing time from 2800 hours to just eight hours.8
Optimize system operation and timing: A system of machines can be optimized so the power load is better balanced across individual machine cycles, avoiding peak demand. Proper sequencing of processes, optimizing tool paths and careful consideration of process speeds can also minimize resource use.9
Improve controls: In one example at a manufacturer of common-alloy aluminum sheet from recycled metal, GE says it was able to increase yields, improve quality and find material savings of 120 feet per coil – or $200,000 – by replacing existing Siltrol+ power bridges to DC-2000 controls and upgrading a GE
7 http://www.environmentalleader.com/2010/03/29/arcelormittal-saves-200000-annually-by-idling-machinery-during-production-delays/
8 http://www.environmentalleader.com/2010/12/14/leveraging-manufacturing-for-a-sustainable-world/
9 http://www.environmentalleader.com/2009/11/09/greening-the-factory-floor/

EL Insights | © 2012 Environmental Leader LLC. Single license EL PRO subscription can be used by one person. For multiple users, purchase an enterprise license by emailing [email protected] for information.
Directomatic II analog control to a GE Innovation controller. The project found payback on its $750,000 investment within six months.10
Waste heat minimization and recovery: All energy that escapes from machinery as heat is wasted energy, since it is not being used to create products. But by recovering this heat, companies can realize significant savings. At Rapid-Line, a metal fabrication and tooling company, excess heat from paint-line ovens eliminated the need for furnace heating of the plant in cold weather.11
Combined heat and power: CHP systems are all-in-one installations that burn or otherwise process a fuel to create electricity, and capture the waste heat to provide heating and cooling. The US has 82 GW of CHP, with about 87 percent of that in manufacturing facilities, where it provides power and steam to the chemical, paper, refining, food processing, metals manufacturing and other sectors.12
Eliminate product losses: These can occur at many steps in the product lifecycle, and reducing such occurrences can help a company to cut waste as well as carbon emissions. At Stonyfield Farm, a proprietary carbon footprinting tool developed by parent company Danone and SAP now allows the yogurt company to measure manufacturing losses in not only dollars but carbon.13
10 GE Energy, Case Study: Aluminum Manufacturer Productivity Increase, 2008. http://www.geindustrial.com/publibrary/checkout/Case%20Studies%7CGEA-16092%7Cgeneric#search=%20aluminum%20manufacturer%20productivity%
11 Organisation for Economic Co-Operation and Development, OECD Sustainable Manufacturing Toolkit: Seven Steps to Environmental Excellence – Start-Up Guide. 2011. http://www.oecd.org/innovation/green/toolkit/48704993.pdf
12 DOE and EPA, Combined Heat and Power: A Clean Energy Solution. August 2012. http://www1.eere.energy.gov/manufacturing/distributedenergy/pdfs/chp_clean_energy_solution.pdf
13 http://www.environmentalleader.com/2012/09/11/exclusive-stonyfield-farm-footprints-150-products-across-entire-lifecycle/

EL Insights | © 2012 Environmental Leader LLC. Single license EL PRO subscription can be used by one person. For multiple users, purchase an enterprise license by emailing [email protected] for information.
Water recycling and reuse: Cooling systems are some of the biggest users of reclaimed water.14 Other uses include first washdowns of floors and containers and making up raw material slurries.
Machine tool redesign: At the most nitty-gritty end, companies can re-design machine tools – such as hydraulics and spindles – to be more thermally stable and reduce energy use, and to be re-manufactured at end of life.15
Vendors and products
The energy management market for industrial applications is fragmented, comprising full service providers, hardware vendors, software companies, energy service companies and power engineering consultants. Nearly all offer software, either on its own or bundled with other products and services.16
But Pike Research projects that the specialist software companies will have a harder time gaining market share than the full service providers, engineering companies and ESCOs. These companies are familiar with the industrial marketplace and already have a reasonable client base. Hardware vendors will also likely do well, as will certification companies and standards consultants.17
Benefits and Challenges
Benefits
14 EL Insights issue 23, Water Reuse & Recycling. June 2011. http://www.environmentalleader.com/insights/water-reuse-recycling-insights/
15 http://www.environmentalleader.com/2009/11/09/greening-the-factory-floor/
16 Pike Research, Energy Management Systems for Industrial Markets. Q4 2011. http://www.pikeresearch.com/research/energy-management-systems-for-industrial-markets
17 Ibid.

EL Insights | © 2012 Environmental Leader LLC. Single license EL PRO subscription can be used by one person. For multiple users, purchase an enterprise license by emailing [email protected] for information.
Cost savings: For many manufacturers, sustainability efforts are motivated by cost savings – foremost among them, those from lowered energy use. But many other environmental initiatives – such as reductions in material inputs, cuts in water use and wastewater output, and cuts in solid waste output – can reduce costs for a company. Minimizing the use of harmful substances can save companies money on handling, storage and treatment, as well as reduce compliance burdens. Reprocessng end-of-life materials increases the value of material inputs.18
18 Organisation for Economic Co-Operation and Development, OECD Sustainable Manufacturing Toolkit: Seven Steps to Environmental Excellence – Start-Up Guide. 2011. http://www.oecd.org/innovation/green/toolkit/48704993.pdf
51,300
30,000
21,900 20,500 17,000 17,000 15,300 14,400 14,100 13,100
California Texas Idaho Florida Illinois New York Colorado North Carolina
Nebraska Michigan
Top States by Industrial Self-Supplied Water Withdrawals, 2005 (in thousand acre-feet per year)
Source: US Geological Service
EL Insights | © 2012 Environmental Leader LLC. Single license EL PRO subscription can be used by one person. For multiple users, purchase an enterprise license by emailing [email protected] for information.
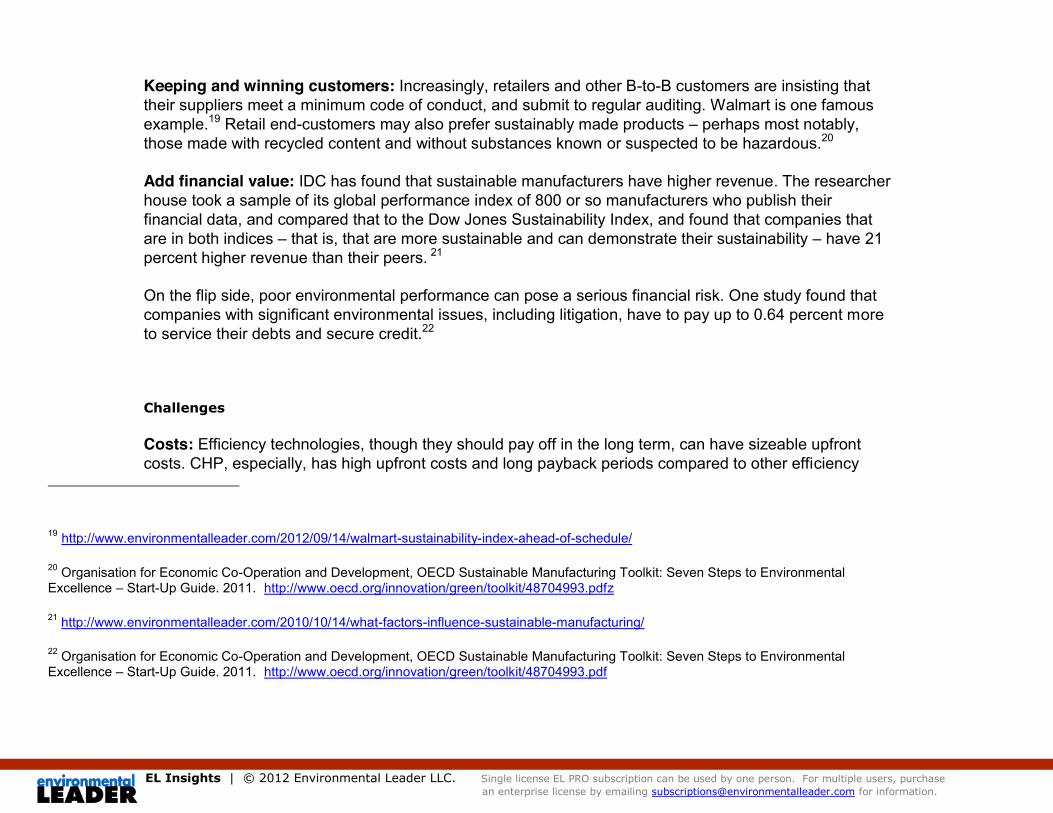
Keeping and winning customers: Increasingly, retailers and other B-to-B customers are insisting that their suppliers meet a minimum code of conduct, and submit to regular auditing. Walmart is one famous example.19 Retail end-customers may also prefer sustainably made products – perhaps most notably, those made with recycled content and without substances known or suspected to be hazardous.20
Add financial value: IDC has found that sustainable manufacturers have higher revenue. The researcher house took a sample of its global performance index of 800 or so manufacturers who publish their financial data, and compared that to the Dow Jones Sustainability Index, and found that companies that are in both indices – that is, that are more sustainable and can demonstrate their sustainability – have 21 percent higher revenue than their peers. 21
On the flip side, poor environmental performance can pose a serious financial risk. One study found that companies with significant environmental issues, including litigation, have to pay up to 0.64 percent more to service their debts and secure credit.22
Challenges
Costs: Efficiency technologies, though they should pay off in the long term, can have sizeable upfront costs. CHP, especially, has high upfront costs and long payback periods compared to other efficiency
19 http://www.environmentalleader.com/2012/09/14/walmart-sustainability-index-ahead-of-schedule/
20 Organisation for Economic Co-Operation and Development, OECD Sustainable Manufacturing Toolkit: Seven Steps to Environmental Excellence – Start-Up Guide. 2011. http://www.oecd.org/innovation/green/toolkit/48704993.pdfz
21 http://www.environmentalleader.com/2010/10/14/what-factors-influence-sustainable-manufacturing/
22 Organisation for Economic Co-Operation and Development, OECD Sustainable Manufacturing Toolkit: Seven Steps to Environmental Excellence – Start-Up Guide. 2011. http://www.oecd.org/innovation/green/toolkit/48704993.pdf

EL Insights | © 2012 Environmental Leader LLC. Single license EL PRO subscription can be used by one person. For multiple users, purchase an enterprise license by emailing [email protected] for information.
technologies. Stakeholders have projected that potential CHP projects have payback periods from 1.5 to 12 years, with four to six years most typical.23 Water treatment systems can also be expensive to install.
Utility barriers: While utility-led energy efficiency programs have been some of the biggest investors in energy efficiency (see Policies and Programs), such programs are far from universal. The major barrier keeping utilities from investing in such programs is that they do not treat energy efficiency as a true resource, but as more of a philanthropic gesture with marginal resource benefits. The common utility business model, also encourages utilities to sell more electricity – but state regulations can overcome this to help utilities run cost-effective efficiency programs. Regulators and utilities also argue that such programs push up customer rates, though studies show that utility customers make this money back in the long term.24
Market barriers: Certain market structures and conditions, such as fragmented supply chains, can keep energy efficiency from being an appealing investment.25 The low combined cost of grid-provided power and heat reduces the attractiveness of CHP in some US states.26
Policies and Programs
At its most basic level, sustainability in manufacturing is about compliance. Relevant regulations include those stemming from the Clean Air and Clean Water acts. These include the EPA’s still-emerging
23 ACEEE, Challenges Facing Combined Heat and Power Today: A State-by-State Assessment. September 2011. http://aceee.org/research-report/ie111
24 ACEEE, Opportunity Knocks: Examining Low-Ranking States in Energy Efficiency. May 2012. http://www.aceee.org/research-report/e126
25 ACEEE, The Long-Term Energy Efficiency Potential: What the Evidence Suggests. January 2012. http://aceee.org/research-report/e121
26 ACEEE, Opportunity Knocks: Examining Low-Ranking States in Energy Efficiency. May 2012. http://www.aceee.org/research-report/e126

EL Insights | © 2012 Environmental Leader LLC. Single license EL PRO subscription can be used by one person. For multiple users, purchase an enterprise license by emailing [email protected] for information.
regulations on greenhouse gases.27 Thousands of US facilities also must submit data to the EPA’s Toxics Release Inventory, detailing how they manage chemical releases and disposal.28
But according to the American Council for an Energy-Efficient Economy, US energy efficiency policies are significantly behind those of many competitor nations. Most of the countries that ACEEE examined have national energy savings goals, but the US does not. Instead, energy efficiency resource standards (EERS) have emerged in 25 states, requiring utilities to run efficiency programs that achieve a certain
27 http://www.environmentalleader.com/2012/07/05/epa-maintains-ghg-thresholds-focus-on-larger-polluters/
28 http://www.epa.gov/tri/

EL Insights | © 2012 Environmental Leader LLC. Single license EL PRO subscription can be used by one person. For multiple users, purchase an enterprise license by emailing [email protected] for information.
amount of energy savings. These policies are set to achieve savings of about five to six percent of total US electricity sales. 29
The US also lacks national policies requiring energy audits and mandating the use of on-site experts at manufacturing plants. 30 But the US does many policies and programs that can encourage investment in sustainability projects, taking companies beyond mere compliance. The country has tax incentives for
29 American Council for an Energy-Efficient Economy. ACEEE 2012 International Energy Efficiency Scorecard. http://aceee.org/research-report/e12a
30 Ibid.
$10.66 $9.99 $9.96
$8.98
$7.33
$6.26 $6.10 $5.81 $5.27 $5.10
Oregon Idaho New York Rhode Island
Wash. Mass. Maine New Hampshire
Tennessee Penn.
Highest State Industrial Energy Efficiency Program Spending Per Capita, 2010 ($)
Source: American Council for an Energy-Efficient Economy

EL Insights | © 2012 Environmental Leader LLC. Single license EL PRO subscription can be used by one person. For multiple users, purchase an enterprise license by emailing [email protected] for information.
commercial buildings and equipment, and the Department of Energy administers two loan guarantee programs that finance high-risk technologies. 31
Other relevant federal programs include:
Industrial Technologies Program (http://www1.eere.energy.gov/industry): As well as investing in high-risk R&D, this Department of Energy program conducts on-site energy efficiency assessments and publishes best practice information.
Manufacturing Extension Partnership (http://www.mep.nist.gov/): This program of the Department of Commerce and National Institute of Standards and Technology provides technical assistance and environmental assessment.
Green Suppliers Network (www.gsn.gov): This collaboration among the Manufacturing Extension Partnership, the EPA and industry engages the small and medium-sized suppliers of large manufacturers in technical reviews to improve processes and minimize waste.32
And in August 2012, president Obama put combined heat and power on the national agenda with an executive order setting a target of 40 GW of new CHP by the end of 2020. He directed agencies to hold ongoing regional workshops with information about best practice, policies and investment models, and directed the EPA, along with the Departments of Energy, Commerce and Agriculture, to coordinate actions at the federal level while providing policy and technical assistance to states to promote investments in industrial energy efficiency. According to the White House, the order will accelerate
31 American Council for an Energy-Efficient Economy. ACEEE 2012 International Energy Efficiency Scorecard. http://aceee.org/research-report/e12a
32http://trade.gov/competitiveness/sustainablemanufacturing/USG_PRS_Sustainable_Business.asp

EL Insights | © 2012 Environmental Leader LLC. Single license EL PRO subscription can be used by one person. For multiple users, purchase an enterprise license by emailing [email protected] for information.
efficiency investments, saving manufacturers at least $100 billion in energy costs over the next decade, and will create $40-80 billion of new capital investment in American manufacturing facilities.33
At the state level, California has a goal of 4 GW of new CHP generation in the state by 2020, from a 1990 baseline.34
Standards and Certifications
A myriad of voluntary standards and certification programs are applicable to sustainable manufacturing. A few of the most relevant are listed below.
ISO 50001: The International Organization for Standardization released this standard for energy management systems in June 2011. ISO 50001 is designed for all types and sizes of organizations, and is designed to integrate with other management standards, especially ISO 14001 on environmental management and ISO 9001 on quality management.35
UL Sustainability Quotient: UL Environment created this system of auditable standards in 2011 to assess, rate and certify sustainability at the enterprise level. The first such standard is UL 880: Sustainability for Manufacturing Organizations. UL has released an online tool to help companies determine whether they can meet prerequisite and core indicators within the UL 880 standard’s five
33 http://www.environmentalleader.com/2012/08/31/obama-sets-national-chp-target/
34 http://www.environmentalleader.com/2012/08/23/houwelings-installs-10-6-mw-chp-capturing-carbon-for-fertilizer/
35 http://www.environmentalleader.com/2011/06/15/iso-50001-energy-management-standard-published/

EL Insights | © 2012 Environmental Leader LLC. Single license EL PRO subscription can be used by one person. For multiple users, purchase an enterprise license by emailing [email protected] for information.
assessment areas – governance, environment, customers and supply chain, workforce and community engagement, and human rights.36
Better Buildings, Better Plants Program: Partners in this program, run through the DOE’s Advanced Manufacturing Office, commit to reduce energy intensity by 25 percent over 10 years. Any manufacturer can join – 114 have so far - and partners receive help analyzing data, identifying improvements, identifying finance and so on. In addition, 10 manufacturers have become Challenge Partners, committing to share their strategies and actions to help other companies replicate their success.37 These companies are 3M, Alcoa, Briggs and Stratton, Cummins Inc., GE, Legrand, Nissan North America, Saint-Gobain, Schneider Electric and J.R. Simplot. Partners in the overall program have already realized at least $80 million in cost savings, with their actions expected to save about $1 billion cumulatively by 2020, the DOE says.38
Latest Developments in Sustainable Manufacturing
US and Global Markets
The US is behind some other major economies in terms of the efficiency of its manufacturing. The ACEEE scored 11 countries and the European Union on their industrial efficiency, and the US came sixth with 14
36 http://www.environmentalleader.com/2012/05/04/free-online-tool-helps-manufacturers-assess-sustainability-efforts/
37 http://www1.eere.energy.gov/manufacturing/tech_deployment/betterplants/
38 http://www.environmentalleader.com/2012/08/31/obama-sets-national-chp-target/

EL Insights | © 2012 Environmental Leader LLC. Single license EL PRO subscription can be used by one person. For multiple users, purchase an enterprise license by emailing [email protected] for information.
points out of 24, behind the UK, Italy, France, Japan and Germany but ahead of Australia, the EU, Brazil, Russia, China and Canada.
1.00
0.00 0.00
1.10
0.00 0.00 0.00
1.21
0.00 0.00 0.00
1.15
0.00 0.00 0.00
1.07
0.00 0.00 0.00
0.97
1.00 1.04 1.08
1.14 1.21
1.27 1.38
1.47 1.54
1.61 1.55 1.56 1.58 1.63
1.69 1.74 1.80
1.71
1.48 1.57
1.00
1.03 1.05
1.10
1.14 1.16 1.23
1.24
1.28 1.30 1.24
1.24
1.25 1.28 1.33 1.36
1.41 1.35
1.17 1.24
Manufacturing Total Energy Consumption and Output Levels, 1991-2010
Consumption FRB Index BEA Index
Source: Energy Information Administration
(EIA energy consumption index, Federal Reserve Board production index and Bureau of Economic Analysis Shipping Index, all indexed to 1991)

EL Insights | © 2012 Environmental Leader LLC. Single license EL PRO subscription can be used by one person. For multiple users, purchase an enterprise license by emailing [email protected] for information.
Excluding policy and just looking at industrial efficiency performance, the US does better. Australia, Brazil, and Canada all have energy intensities higher than that of the US, and the intensities in China and Russia are more than twice that of the US. 39
Looking at change over time, energy intensity in the US industrial sector declined from 5.68 Btu per dollar in 2000 to 3.65 Btu per dollar in 2009. ACEEE says that overall the figures suggest that the US industrial sector as a whole is making efficiency improvements.
The Energy Information Administration suggests a more mixed picture. Comparing manufacturing energy consumption to indices of manufacturing output (see chart, previous page), one finds a 14 percent decrease in energy intensity between 2002 and 2006. But from 2006 to 2010, energy intensity increased by a net two percent. However, the EIA says some of this increase could be attributable to a change in the country’s industrial mix – that is, energy-intensive sectors growing at a faster rate than their less-intensive cousins.40
US energy efficiency spending per capita (across all sectors, not just industrial) is at its highest level in decades – but is still far below that of Australia, Japan, Germany and the European Union as a whole. And per capita spending in China is more than twice that of the United States. Much recent efficiency spending in the US came from the Department of Energy and the passage of the 2009 economic stimulus package. But the utility sector has been as important, if not more so, doubling its energy efficiency spending between 2006 and 2009.41
39 American Council for an Energy-Efficient Economy. ACEEE 2012 International Energy Efficiency Scorecard. http://aceee.org/research-report/e12a
40 http://www.eia.gov/consumption/reports/early_estimates.cfm
41 American Council for an Energy-Efficient Economy. ACEEE 2012 International Energy Efficiency Scorecard. http://aceee.org/research-report/e12a
EL Insights | © 2012 Environmental Leader LLC. Single license EL PRO subscription can be used by one person. For multiple users, purchase an enterprise license by emailing [email protected] for information.
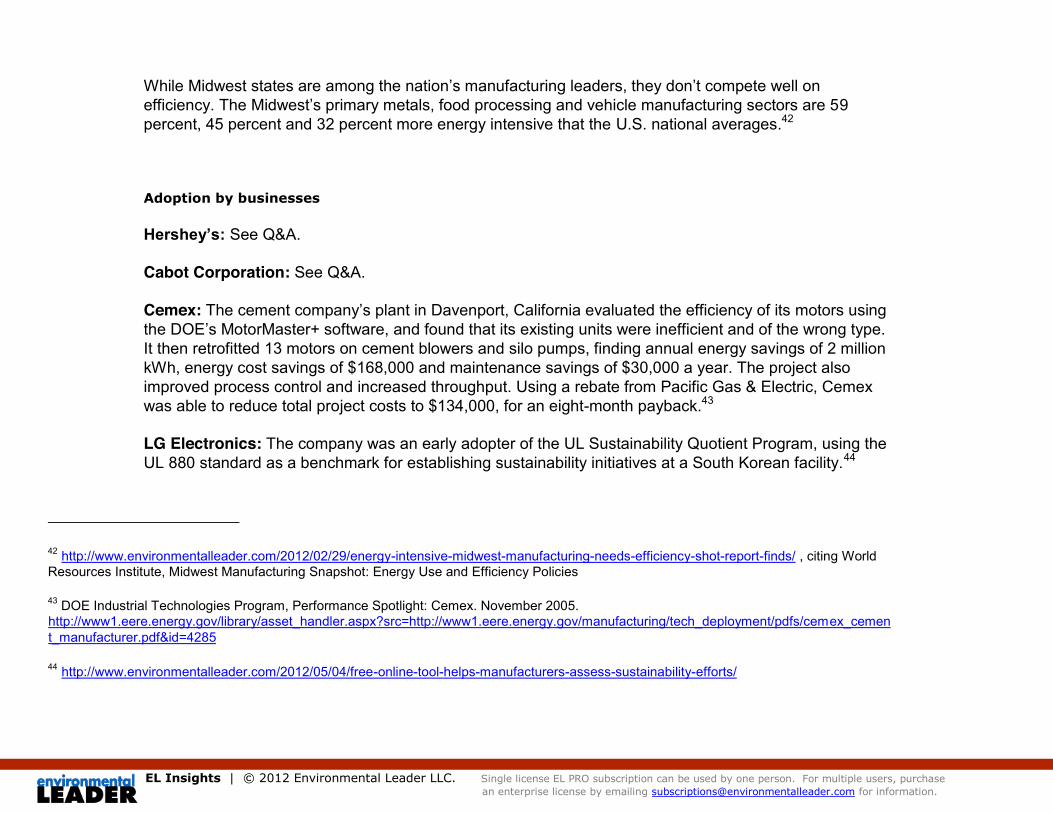
While Midwest states are among the nation’s manufacturing leaders, they don’t compete well on efficiency. The Midwest’s primary metals, food processing and vehicle manufacturing sectors are 59 percent, 45 percent and 32 percent more energy intensive that the U.S. national averages.42
Adoption by businesses
Hershey’s: See Q&A.
Cabot Corporation: See Q&A.
Cemex: The cement company’s plant in Davenport, California evaluated the efficiency of its motors using the DOE’s MotorMaster+ software, and found that its existing units were inefficient and of the wrong type. It then retrofitted 13 motors on cement blowers and silo pumps, finding annual energy savings of 2 million kWh, energy cost savings of $168,000 and maintenance savings of $30,000 a year. The project also improved process control and increased throughput. Using a rebate from Pacific Gas & Electric, Cemex was able to reduce total project costs to $134,000, for an eight-month payback.43
LG Electronics: The company was an early adopter of the UL Sustainability Quotient Program, using the UL 880 standard as a benchmark for establishing sustainability initiatives at a South Korean facility.44
42 http://www.environmentalleader.com/2012/02/29/energy-intensive-midwest-manufacturing-needs-efficiency-shot-report-finds/ , citing World Resources Institute, Midwest Manufacturing Snapshot: Energy Use and Efficiency Policies
43 DOE Industrial Technologies Program, Performance Spotlight: Cemex. November 2005. http://www1.eere.energy.gov/library/asset_handler.aspx?src=http://www1.eere.energy.gov/manufacturing/tech_deployment/pdfs/cemex_cement_manufacturer.pdf&id=4285
44 http://www.environmentalleader.com/2012/05/04/free-online-tool-helps-manufacturers-assess-sustainability-efforts/

EL Insights | © 2012 Environmental Leader LLC. Single license EL PRO subscription can be used by one person. For multiple users, purchase an enterprise license by emailing [email protected] for information.
Saint-Gobain: The building products company implemented a large compressed air retrofit project at a Washington plant that led to savings of 39 percent, and at a Massachusetts site, Saint-Gobain has committed to a compressed air project expected to deliver savings of 15 percent.45
3M: The chemical and materials company established a capital set-aside program for energy efficiency projects that were not funded through its normal process. So far the program has funded over 44 projects, and in 2011, 3M implemented 136 energy efficiency projects, achieving a 1.7 percent decline in total energy intensity.46
Volvo Group: Since 2004, the auto manufacturer has focused on energy reduction in its production processes, and has reduced its energy consumption by 46 percent per unit produced. Measures such as controlled lighting and ventilation, turning off equipment from idle running and replacing old machinery have helped the company achieve this, Volvo says.47
Society of Chemical Manufacturers and Affiliates: Member companies’ reported toxic releases fell from 2,340,870 pounds in 2007 to 1,585,400 pounds in 2010, a 32 percent reduction. For the average SOCMA member, the TRI water release data shows a decreasing trend from 1,220 pounds in 2007 to 1,040 pounds in 2010. SOCMA says land releases dropped from 6,359 pounds in 2007 to 1,318 pounds in 2009, a 79 percent fall. However, land releases showed what SOCMA calls a “slight” increase, from 2009 to 2010, which SOCMA did not quantify.48
45 http://www4.eere.energy.gov/challenge/partners/better-buildings-better-plants/saint-gobain-corporation
46 http://www4.eere.energy.gov/challenge/partners/better-buildings-better-plants/3m
47 http://www.environmentalleader.com/2012/04/02/volvo-sustainability-report-hazardous-waste-up-14-energy-use-7-but-sales-up-17/
48 http://www.environmentalleader.com/2012/04/26/chemical-maunfacturers-cut-toxic-releases-32/

EL Insights | © 2012 Environmental Leader LLC. Single license EL PRO subscription can be used by one person. For multiple users, purchase an enterprise license by emailing [email protected] for information.
0
50
100
150
200
250
300
Energy-Related Carbon Dioxide Emissions by Manufacturing Sector Reference case, 2009-2035 (mmtCO2e)
Refining
Bulk Chemicals
Balance of Manufacturing
Food Products
Iron & Steel
Paper Products
Transportation Equipment
Cement & Lime
Computers & Electronics
Plastics
Fabricated Metal Products
Machinery
Aluminum
Glass
Wood Products
Electrical Equipment
Sources: 2009 and 2010 emissions and emission factors: U.S. Energy Information Administration (EIA), Monthly Energy Review, October 2011, DOE/EIA-0035(2011/10) (Washington, DC, October 2011). Projections: EIA, AEO2012 National Energy Modeling System. Notes: By convention, the direct emissions from biogenic energy sources are excluded from energy-related CO2 emissions. The release of carbon from these sources is assumed to be balanced by the uptake of carbon when the feedstock is grown, resulting in zero net emissions over some period of time. Totals may not equal sum of components due to independent rounding. Data for 2009 and 2010 are model results and may differ slightly from official EIA data reports.
EL Insights | © 2012 Environmental Leader LLC. Single license EL PRO subscription can be used by one person. For multiple users, purchase an enterprise license by emailing [email protected] for information.
The Future of Sustainable Manufacturing
Projections
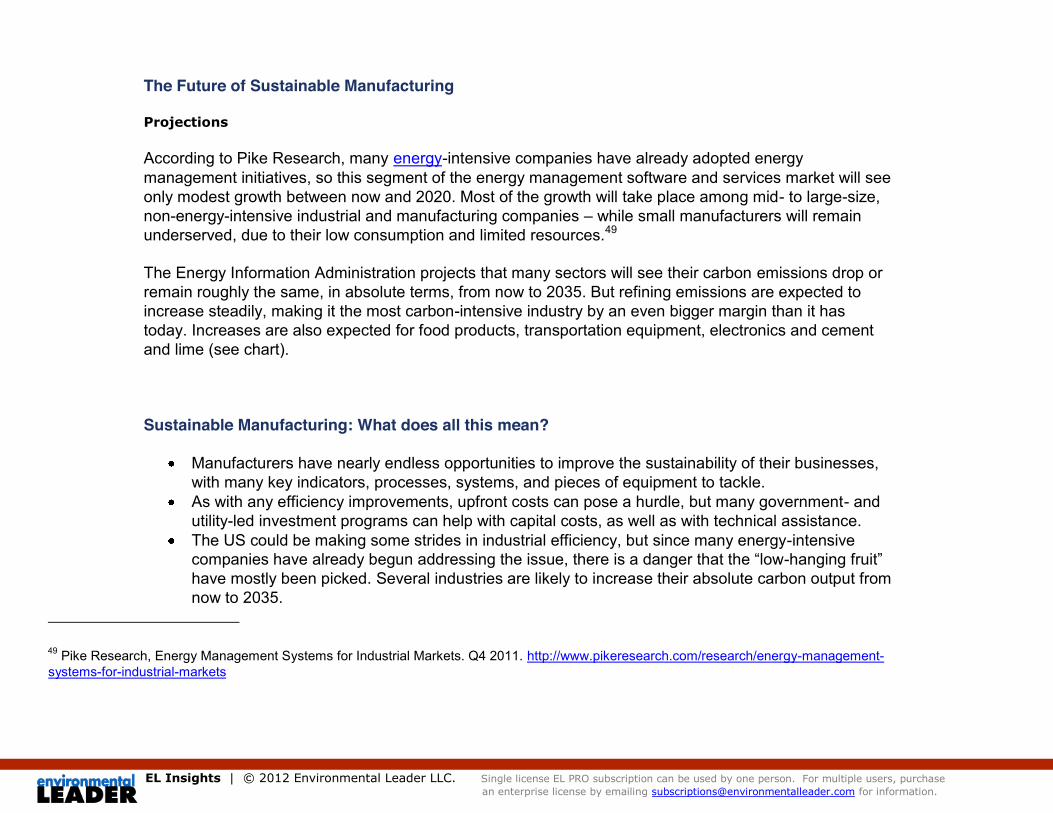
According to Pike Research, many energy-intensive companies have already adopted energy management initiatives, so this segment of the energy management software and services market will see only modest growth between now and 2020. Most of the growth will take place among mid- to large-size, non-energy-intensive industrial and manufacturing companies – while small manufacturers will remain underserved, due to their low consumption and limited resources.49
The Energy Information Administration projects that many sectors will see their carbon emissions drop or remain roughly the same, in absolute terms, from now to 2035. But refining emissions are expected to increase steadily, making it the most carbon-intensive industry by an even bigger margin than it has today. Increases are also expected for food products, transportation equipment, electronics and cement and lime (see chart).
Sustainable Manufacturing: What does all this mean?
Manufacturers have nearly endless opportunities to improve the sustainability of their businesses, with many key indicators, processes, systems, and pieces of equipment to tackle.
As with any efficiency improvements, upfront costs can pose a hurdle, but many government- and utility-led investment programs can help with capital costs, as well as with technical assistance.
The US could be making some strides in industrial efficiency, but since many energy-intensive companies have already begun addressing the issue, there is a danger that the “low-hanging fruit” have mostly been picked. Several industries are likely to increase their absolute carbon output from now to 2035.
49 Pike Research, Energy Management Systems for Industrial Markets. Q4 2011. http://www.pikeresearch.com/research/energy-management-systems-for-industrial-markets

EL Insights | © 2012 Environmental Leader LLC. Single license EL PRO subscription can be used by one person. For multiple users, purchase an enterprise license by emailing [email protected] for information.
Q&A
Diane Alwine, Director of Environmental Affairs, Hershey’s
What has Hershey's done to improve the energy efficiency of its manufacturing equipment and processes?
Conducted energy audits and implemented energy efficient improvements where possible: compressed air, boiler economizers, boiler efficiency, and motor replacements.
What do you do to improve the water efficiency of your manufacturing?
Reuse of cooling water and condenser economizers.
How else have you lowered the environmental impact of your manufacturing?
We also use alternative energy sources such as biogas from WWTP as a fuel source for boilers and solar. We have reduced waste in our operations through improved waste management and recycling. We convert waste from our production processes to electricity. And we have reduced materials, weight and fuel use in our logistics operations.
What have the benefits been? - please quantify in terms of kWh saved, $ saved, gallons of water saved, etc.
Together, Hershey’s environmental initiatives saved approximately $21 million in 2011. This includes: reducing waste in our operations; using alternative energy sources such as solar and biogas; converting waste from our production processes to electricity; and reducing materials, weight and fuel use in our logistics operations.
How much have these initiatives cost you?
We have not published a total cost for these various initiatives.
EL Insights | © 2012 Environmental Leader LLC. Single license EL PRO subscription can be used by one person. For multiple users, purchase an enterprise license by emailing [email protected] for information.
What has the return on investment / payback period been?
Four to six years.
Martin O’Neill, Senior Vice President, Safety, Health and Environmental Affairs at Cabot Corporation
What has Cabot done to improve the energy efficiency of its manufacturing equipment and processes?
Cabot has a long history of continuous improvement of our manufacturing operations, which focuses on all inputs to the process and aims at increasing productivity and reducing emissions and waste. Energy efficiency has always been an important part of this effort. Reduced energy input translates to less CO2 emissions from our production processes and energy suppliers.
Cabot has conducted a comprehensive survey of its energy usage and utility spend across the entire system of global operating facilities. We have established consistent tracking of energy purchases and developed a global metric to measure utility and energy intensity against manufacturing output.
Several administrative and engineering yield improvement measures were identified and implemented in order to "debottleneck" our processes, thereby increasing product output and decreasing emissions.
Have you taken steps to improve the efficiency of any of the following: compressed air systems, cooling towers and systems, cleaning systems, motors and drives? If so, what did you do to improve these systems?
We have conducted comprehensive energy audits at select facilities and taken the learnings from those evaluations to implement consistent standards for future installations that are centered on energy efficiency. Over time, as renovation or updating projects are undertaken, we look for opportunities to

EL Insights | © 2012 Environmental Leader LLC. Single license EL PRO subscription can be used by one person. For multiple users, purchase an enterprise license by emailing [email protected] for information.
install more energy efficient equipment that will ultimately lower our total costs of ownership and reduce energy consumption.
We have also aggressively pursued valuable energy recovery projects over the last 10 years that are revenue generating and reduce total indirect emissions in the long run.
What do you do to improve the water efficiency of your manufacturing?
We recognize that water plays a critical role in our operations. As such, we embarked on the development of a strategic Water Management Plan. This plan will help us assess water issues in the communities where we operate and also aid in identifying reduction and recycling opportunities to improve our efficient use of water.
Starting with a comprehensive assessment of water usage and the geographic risks of our global manufacturing footprint as it relates to water, we have identified operating practices that can improve our water footprint in the near- and long-term and will have the possibility of dramatically reducing water usage at our manufacturing plants. We began this process over 3 years ago with a commitment to fully understand our water usage at our manufacturing plants. We are currently in the midst of reviewing our water balance at our facilities and looking for opportunities to reuse and recycle water to reduce the use of fresh water supplies. This process has been useful in providing a baseline of information that will be integrated into our new plant or unit construction standards for future expansions.
One example of our proactive water management is in our facility in Tuscola, Illinois, where we make fumed silica. We replaced a 2-unit operation with a single recirculating water system. The wastewater from the system is now recycled and reused. As a result, an estimated 9.7 million gallons of water saved each year and a reduction in hazardous waste generation.
How else have you lowered the environmental impact of your manufacturing?
Several years ago we began a focused effort on understanding what process level changes we could make to decrease our environmental emissions specific to NOx, SOx and Greenhouse gases (GHG). Cabot is also making significant investments in research and development activities specifically

EL Insights | © 2012 Environmental Leader LLC. Single license EL PRO subscription can be used by one person. For multiple users, purchase an enterprise license by emailing [email protected] for information.
focused on decreasing the Company’s GHG emissions. In addition, Cabot is also making similar investments in research and development activities focused on meaningful improvements in the energy efficiency of our operations.
In our largest business of reinforcement materials, we have advanced several technology developments that have the potential to significantly reduce our GHG intensity. This is not only good for the environment, it is also good for our bottom-line. We are greatly improving our efficiency in terms of total energy input and lowering our GHG emissions intensity. With regards to NOx and SOx, we continue to develop solutions for back-end controls and at the same time we are looking to optimize unit operations and feedstocks to lower our overall footprint. We recently retro-fitted our Carbon Black Manufacturing facility in Shanghai with state of the art energy recovery and pollution controls.
This has been a long-standing commitment by Cabot. We have a history of developing solutions for emission controls. In the past 10 years, we’ve focused intensely on our emissions profile. We have set goals to reduce our greenhouse gas emissions intensity. We are committed to reducing this intensity by 20% from our 2005 levels, by the year 2020. We’re also committed to improving our energy efficiency by 10% over the same period. In 2011, we reduced our GHG intensity by 6% since 2005.
Cabot is also active in trade and industry groups and engaged in positive discussions around the role of regulation, as well as industry, in achieving global reductions in CO2 over time and mitigating the negative impacts of climate changes.
What have been the biggest challenges in implementing these initiatives?
The biggest challenges that we have faced in implementing these initiatives have been:
Retro-fitting older facilities in a cost effective manner to ensure that we get the full benefit of newer technology
Modifying and proving existing technology solutions for our emission control needs Developing an appropriate rate and pace for capital investments in concert with emerging and
ever-changing regulatory pressures around the globe/

EL Insights | © 2012 Environmental Leader LLC. Single license EL PRO subscription can be used by one person. For multiple users, purchase an enterprise license by emailing [email protected] for information.
What have the benefits been? - please quantify in terms of kWh saved, $ saved, gallons of water saved, etc.
We are dedicated to putting our best technology wherever it is needed. Some of our recent investments include:
A focus of our efficiency improvement efforts continues to be investment in energy centers at carbon black manufacturing facilities. These energy centers, fueled by waste tail gases, produce steam and/or electricity for our operations, our industrial neighbors, and the surrounding community. These energy centers typically produce a 15-20% IRR. While this technology has been utilized for decades, we are continuing to improve on our existing technology. For example, in our carbon black plant in Maua, Brazil, we installed a new boiler that resulted not only in mitigation of NOx emissions (reduced to 41% of expected total emissions), but also reduced total CO2 emissions for Cabot and a neighboring facility that we supply with steam.
Given one of our most significant products is elemental carbon, carbon emissions means lost product for us. It’s imperative to our business and bottom-line to ensure better yield and energy efficiency to minimize product and money loss. We have proactively identified and implemented several yield and energy efficiency improvement measures in order to create more efficient processes, thereby reducing raw material costs, increasing product output and decreasing emissions. In 2011, we announced our intention to invest a total of $50 million over a three-year period in these proprietary process technologies which will have an average IRR of about 35%.
How much have these initiatives cost you? What has the return on investment / payback period been?
Cabot has been investing in waste energy recovery for the last 15 years. To help meet our goals, we have committed to investing $400 million through 2020. The investments will be primarily focused on improving Cabot's energy consumption and product yields, which will also provide attractive returns to Cabot in the form of reduced energy costs. In fiscal year 2011, we invested over $35 million on environmentally related capital projects to improve efficiency, maintain regulatory compliance and reduce emissions.