Embed Size (px)
Citation preview

Dear reader,
Our industry has been quite active in the lastmonths. Nevertheless, the overall situation ofshipping and shipbuilding remains challenging.But some segments show significant promise.They include the offshore industry and theneed of improved, innovative and more effi-cient technical solutions concerning ship effi-ciency to lower cost and to reduce emissions.
A main driver on environmentally friendly solu-tions is the IMO decision to include the EnergyEfficiency Design Index (EEDI) and the ShipEnergy Efficiency Management Plan (SEEMP) inAnnex VI of the MARPOL convention.
Even if a general trend in the design objectivescan be recognized, each project still is uniqueand the selection of the specific numericaltool and the necessary model tests should bemade in close cooperation with our hydrody-namic experts.
Green Ships, EEDI, Ship Noise and Ship Trans-port in the Arctic were also the primarytopics of the 26th International Towing TankConference ITTC.
Among others, a specialist committee hasbeen formed to tackle tasks related toperformance of ships in service covering thewhole life cycle of the ships and take intoaccount all EEDI developments. The noisecommittee has been tasked with digging intoidentification of noise sources that impactmarine life. The ice committee shall addressall questions related to transport in icecovered waters. HSVA experts are membersof these three committees to testify theongoing commitment of HSVA to all environ-mental issues related to shipping.
In the next months there will be severalchances to meet our experts to discuss allyour questions related to ship and offshorehydrodynamics. Events will be the meeting ofthe German Society of Naval Architects STGand the MARINTEC’11 in China. I hope tomeet you there.
Juergen FrieschManaging Director
IN THIS ISSUE:
• Setting Energy Effiency
TARGETS for Ships
• “Multiple-Point” Hull Form
Optimisation for Containerships
• Analysis of Breaking through
Sea Ice Ridges to develop a
Prediction Method
• High Speed Cavitation Tunnel
Modernized
• Recent Developments of Model
Testing and Computations in the
Seakeeping Department
Visit us in the
German Pavilion
Hall W4,
Booth No. 4C11-9
Numerical propulsion test

Setting Energy Efficiency TARGETS for Ships
� by Jochen Marzi, Hannes Renzsch and Scott Gatchell
Energy efficiency and environmental con si-derations are today’s driving forces for both,ship operators to reduce costs and becomegreener and for ship builders to achieve a
competitive edge. Economic pressure andinternational legislation require a sensitiveuse of energy resources and a reduction ofthe associated emissions. The EU fundedTARGETS (Targeted Advanced Research forGlobal Efficiency of Transportation Shipping– www.targets-project.eu) project provides
substantial improvements to overall shipenergy efficiency by adopting a holisticapproach covering the most importantenergy consumers as well as energy genera-tion/transformation including unconventio-nal sources. The TARGETS concept is explai-ned in the figure below.
Structured into five Work Packages theproject analyses the hydrodynamic influen-ces of resistance and propulsion and explo-res the potential use of alternative energysources. Accompanied by thorough energyaudits performed on a number of ships,these feed the overall dynamic energymodel which will in turn form the basis forholistic simulation and optimisation ofenergy consumption on board a ship. Ship resistance is the prime cause of energy
consumption on board a cargo vessel. Up to50 % of the useful energy is spent to over-come the calm water contributions to theoverall resistance, i.e. pressure and viscousparts, adding another 15 % for environmentaleffects such as added resistance in a seawayand wind effects on the ship superstructure. With propeller efficiency usually being up to70%, this adds another 30 % of losses due tohydrodynamic reasons which in totalaccounts for more than 90 % of the energy
used on board standard cargo vessels.Although it must be noted that for othertype of vessels, e.g. PAX or ferries, thebalance is shifted very much towards otherconsumers, the last IMO Green House GasStudy clearly indicates that the bulk of allseaborne CO2 emissions (> 70 %) stems fromcargo vessels. Any significant reduction toship emissions will hence rely on improve-ments in this sector. Based on our superiorknowledge of resistance characteristics and
Newswave 2
Fig. 1: TARGETS Concept

Newswave 3
propulsive efficiency HSVA is ideally placedin the TARGETS project to lead the deve-lopments for hydrodynamic improvementsand provide the fundamental inputs forenergy consumption to the overall dynamicenergy simulation system which is beingdeveloped in the project. Fig 2. indicates the“hydrodynamic contribution” to the com -plete dynamic energy model of TARGETS.
Starting from classic calm water hullformoptimisations based on potential flowmethods, using HSVA’s standard freesurface panel code ν-SHALLO, overallshape parameters and the bulb form can beoptimised for wave resistance. Fig. 3 indica-tes the performance gains which can beobtained for a bulb optimisation of a smal-ler container vessel for a given designspeed. Due to the speed advantage, panelcodes lend themselves to large numbers ofinvestigations and allow addressing differentoperational conditions including speed anddraft variations. Optimising hullforms forvarying operational conditions is an impor-tant contribution to the increase of overallenergy efficiency of maritime transporta-tion today, as fewer ships tend to sail atdesign conditions only. Optimising trim inpartially loaded conditions can yield signifi-cant savings as has been described in earliereditions of NewsWave already.
Although panel codes give a good insight intooverall resistance characteristics and can beused to determine and optimise principal hullparameters, the overall accuracy of suchpredictions is usually not sufficient to base afull power prognosis on these results. Asdetails such as breaking waves, the influenceof viscosity on the pressure resistance and inparticular the stern flow topology can eitheronly be approximated or not accounted forat all, further analysis is required to obtaintangible information on ship resistance.
Fig. 2: TARGETS hydrodynamic model as part of the overall Dynamic Energy Model
Fig. 3: Bulbous bow optimisation and respective resistance gains for a small container vessel

Newswave 4
Recent advances in full scale wave resi-stance predictions using the in-house RANScode FreSCo+ allow performing even morerealistic free surface computations whilstdelivering also the ship resistance withintowing tank quality. The following figureindicates the differences between freesurface predictions performed with a panelcode (bottom) and FreSCo+ (top). Thedetail shows the particular formation of arooster tail behind the stern which is notappropriately captured by the panelmethod. Due to significant speed-ups ob tai-ned for full scale free surface predictionsthese find their way into routine work atHSVA today.
Besides pure resistance issues, the interac-tion between ship hull and propeller largelydetermines the overall propulsive efficiencyof a vessel. Having established the conceptof the numerical propulsion test in FreSCo+
already more than a year ago, the next stepis to embed the RANS-BEM linked propul-sion simulation into the adjoint solverpresented in the previous issue of News-Wave. This concept now allows analyses ofthe effect of form variations on differentobjective functions, e.g. resistance, wakequality etc. from predictions which areperformed taking the effect of the runningpropeller into account. Based on the diffe-rent objective functions implemented in thecode so far, even compound formulationsaccounting for more than a single objectivecan be used. The following figure showsform sensitivities computed for the aft bodyof a container ship with active propulsion(left) and the axial velocity field in thepropeller plane (right).
Fig. 4: Comparison of predicted wave pattern for a Car Carrier - panel code (bottom) vs. RANS (top) and detail of the stern flow from RANS prediction
Fig. 5: Sensitivities computed for a container ship with active propulsion

Newswave 5
Added resistance in a seaway is the secondlargest contribution to the hydrodynamicpart of the ship’s resistance. While potentialflow methods, strip theory of panel codes,provided reasonable conclusions for relati-vely slender ship forms in moderate wavesin the past, new ways are pursued inTARGETS in that RANS based predictionsare made for a range of hullforms coveringmodern container vessels as well as bluntship forms such as tankers and bulk carriersalso in more extreme seaways. The follo-wing example indicates instances from atime series computed for a container vessel(L = 230 [m], v = 22 [kts]) in extreme headseas with a wave length of 2*L and a waveheight of 7.7 [m].
The variation of the longitudinal forces(=added resistance) for these extremeconditions are shown in the graph below.Added resistance for these conditions is asmuch as 40 % higher than the calm waterresistance. Although the case is a ratherunrealistic example of ship operationalconditions it shows that the methods arecapable of predicting the effects of addedresistance well beyond the limits of presentdays’ typical seakeeping analysis codes.
Based on the modules described above,further amended with additional elementsfor viscous resistance and aerodynamic dragin the future, TARGETS develops acomplete simulation environment forhydrodynamic influences to feed the globaldynamic energy model of a ship. This willallow placement of the influence of hydro-dynamic factors such as resistance ofpropulsive efficiency into the context ofoverall energy consumption on board a shipand further to simulate and optimise energyconsumption for a wide range of operatio-nal conditions already at the design stage ofa new vessel.
Fig. 6: Time instances of ship motion in severe head seas
Fig. 7: Time series of added resistance

Newswave 6
� by Uwe Hollenbach and Grete Ernst
These days model basins face a high demand forhull form optimisation by means of numericalcalculations as well as model tests. Like in theyears around 2008, tank facilities are fullybooked so that next available slots can be offe-red to our customers in approximately sixmonths time the earliest. What is the reason forthis high demand for hydrodynamic services?
Since last autumn the number of containership projects on the market has been pickedup significantly. Customers from Korea,Taiwan and China are developing numerousnewbuilding projects. These projects canroughly be divided into three different sizesof container ships: for one the “old” Panmaxsize with capacities between 3,500 TEU and4,800 TEU, however, now coming with alarger breadth (typically 37.4 m) and withlower speed requirements (around 21 knots).Secondly “new” Panmax sized vessels around9,000 TEU and as third various projects ofvery large containerships with capacitiesbetween 12,500 TEU and 16,000 TEU.
Common design features of all new projectsare the - compared to the past - lower speedrequirements and the corresponding higherblock coefficient of the designs. Some shipowners still require an optimisation followingthe “single-point” optimisation philosophy,where the hull is optimised for just one singlespeed-draught condition. But the demand fora “multiple-point” optimisation is constantlyincreasing to make the designs more flexiblefor future services. The draught and speedrange chosen as design con straints in thesecases base on past experience with operationprofiles and future expectations for the inten-ded service of the ship and may differ fromshipping company to shipping company. Still,some general conclusions can be drawn fromthese developments.
The “single-point” optimisation of pastprojects typically result in pronouncedbulbous bows and wide flat transom sterns.When operating such designs on largerdraughts than the design draught the largewetted area of the submerged transom sternhas been shown to worsen the performancesignificantly. On smaller draughts than thedesign draught and operating at lowerspeeds the pronounced bulbous bow gene-rates unfavourable wave systems, which also
results in a reduction of performance. It caneven be observed that the power require-ment on smaller draughts is higher than onthe design draught, although the vessel hasmuch less displacement in this condition.
The “multiple-point” optimisation for adraught and speed range typically results in amuch less pronounced bulbous bow, finerentrance angles and less bow flare in the forebody and a more v-shaped transom stern to
“Multiple-Point” Hull Form Optimisation of Containerships
Fig. 2: Moderate bulbous bow resultingfrom a “multiple-point” optimisation
Fig. 1: Pronounced bulbous bow as resultof a “single-point” optimisation
Fig. 3: Numerical self-propulsion test, calculated coefficients cp (pressure - left) and cf (friction - right)

Newswave
fit the various sailing conditions. Dependingon the probability distribution of draughtsand speeds the bulb designs are less promi-nent to ensure a proper flow around it alsofor the lowest draught condition and thetransom sterns are arranged in a way tocompromise the specified draught range.Thereby, compared to “single-point” optimi-sed hull forms gains in performance for thewhole draught and speed range have reachedat the end of the optimisation process.
Serve as a typical example can a 9,000 TEUcontainer ship, which is currently being deve-loped for a German ship owner. The coope-ration started well in advance of the modeltests with a study varying the main dimen-sions - namely length, breadth, draught andblock coefficient - to find the most economi-cal combination of these parameters forgiven speed and capacity requirements.When starting the hull form design itself theship owner provided a draught and speedrange with corresponding probabilities in thefuture operation profile which had to betaken into account in addition to designdraught and design speed during the optimi-sation process. The operational draught andspeed range was based on the evaluation ofnoon reports of the existing vessels of theship owners’ fleet, combined with his expec-tations for future services of the new vesselsand can be seen in Table1.
For this project three competing hull formdesigns have been developed. One by theship yard itself; the other two have beendeveloped by order of the ship ownerrespectively at HSVA. Although optimisedwithin the same constraints, the three desi-gns that have been derived differ quite signi-ficantly in terms of bulbous bow design andtransom stern design.
The different hull form designs have beentested at HSVA’s tank facilities just recentlythis year throughout the whole speed-draught range defined for the optimisation
and again the moderate bulbous bow designhas been proven to be the most favourablefor the defined operation profile.
During design stage numerical propulsiontests have been performed by means ofRANSE codes for all three hull forms. Theresults of these have shown good correla-tion with the model tests and, therefore,the RANSE analysis has been proven to be areliable tool in comparing competing hullform designs. Results of the RANSE calcula-tions for the three hulls can be seen in Figures 3 and 4.
7
Fig. 4: Wave elevation and pressure distribution of the three competing hull form designs
Table 1: Design constraints for a 9,000 TEUcontainer vessel for a German ship owner
Design speed 21 knots
Design draught 12.5 m
Scantling draught 14.0 m
Operational speed range 15.5 knots to 20 knots
Operational draught range 10.5 m to 13.5 m

Newswave 8
� by Daniela Ehle
Within the research project IRO (Ice Forecastand Route Optimization) the process of a shipbreaking through sea ice ridges was analysed.The major interest was to determine thebehavior of resistance and ship’s velocityduring the break through.
IRO: At least nine month of the year Arcticshipping has to deal with varying ice conditi-ons like level ice in sheltered sea bays, pack iceand sea ice ridges with up to twenty meterkeel depth. With respect to this challengingenvironment even the strongest nuclearicebreakers lose their optimal maneuverabi-lity leading to passive drifting with the sea ice.Due to this, the overall aim of the researchproject is to develop a tool for nautical staffby providing support for navigation in icecovered seas. Therefore model tests wereperformed to improve the accuracy of velo-city prediction in deformed ice. The resultswere analysed to determine the averagedvelocity during the ridge breaking.
SEA ICE RIDGES: Sea ice ridges are one ofthe most difficult obstacles for ice navigation.Depending on their age and formationprocess, sea ice ridges can be found in manydifferent sizes, consolidations and shapes.
A sea ice ridge is a line or a wall of broken iceforced up by pressure. This pressure resultsfrom a combination of different environ-mental factors, mainly from wind and currentinduced stresses.
BREAKING THROUGH SEA ICERIDGES: Ships can break through sea iceridges either continuously or by ramming. Inboth cases the ship impacts a sea ice ridgeat a certain penetration velocity. Withencountering the ridge, the ship’s resistanceincreases significantly so that its velocitydecreases. If the ship can maintain progress,in general with a low velocity of advance, itpasses the ridge in one run otherwise itgets stuck and has to overcome the sea iceridge in several rams. After passing throughthe ice ridge the ship accelerates again untilit accomplishes a higher velocity in thesurrounding level ice.
RIDGE RAMMING TESTS: Six ridgeramming tests were performed in HSVA’slarge ice model basin. Two ship models withdifferent main dimensions and ice breakingcapabilities were tested. The tests wereperformed with a free running model,whereupon the model thrusters wereremote controlled. In all cases the model wassailing ahead.
RESULTS: The ice resistance could bedetermined as a function of the ship’s charac-teristics, especially of the bow shape, the ridgegeometry and the penetration velocity. It isvery much depending on the ship model’sposition relative to the ice ridge. When theship’s fore shoulder advances to the point ofmaximum keel depth the ice resistancereaches its maximum. By means of thrust andkinetic energy the ship is able to overcomethis resistance. Due to this a good combina-tion of thrust and kinetic energy can signifi-cantly improve the ridge breaking capability.
Moreover it turned out that the ice resistancecharacteristics are independent of ridge size,number of necessary rams to transit the ridgeand particular ship data. For this reason it is
Analysis of Breaking through Sea Ice Ridgesto develop a Prediction Method
TestRun
ModelNo.
Averaged Pene-tration Velocity
[m/s]
KeelDepth[m]
1010 1 3.10 12.9
1020 1 2.45 12.9
2010 1 3.28 15.5
2020 1 4.70 15.7
3010 2 2.39 7.6
3020 2 4.52 13.4
Fig. 1: Sea ice ridge by Salvesen (1990)

Newswave 9
possible to develop a general ice resistancedistribution over the width of the ridge (Fig. 4).In doing so different ridge breaking processescan be compared with each other.With the ice resistance distribution the targetparameter - the average transit velocity - couldbe analysed. The velocity during the ridge brea-king strongly depends on the ship’s penetra-tion velocity. For a given ship with a certainpropulsion power and ice-breaking capabilityan optimum penetration velocity exists. Itsvalue is the maximum possible velocity in levelice which is either limited by the availablethrust or by the strength of the hull. In prac-tice another limitation of the thrust is given bythe event of extraction. Due to the ice modeltests a typical curve shape of the ship’s average
transit velocity as a function of distance couldbe outlined (Fig. 5). Thereby distance meansthe position of the midship frame.
As an overall result a general method topredict the ship’s average transit velocity couldbe established. The method takes into accountthe ship’s hull shape and its power. The relevantship and ridge parameters were defined as themethod’s input quantities. The method is basedon a query which compares the ship’s kineticenergy to the difference of resistance andthrust integrated over the time. By means ofthis the average penetration distance (perram) can be determined. Moreover the aver-age penetration time (per ram) can be dedu-ced from the curve shape of the velocity as a
function of distance. Finally the calculation ofthe average transit velocity is possible.
The results from the ridge ramming modeltests can be regarded as a pre-condition foran efficient ice route optimization. They will beembedded in a tool for the determination ofthe average velocity in varying ice conditions.Thereby the overall average transit velocityfor a certain route will be calculated stepwiseby summing up the average velocities in diffe-rent ice types along the route. The averagevelocity in sea ice ridges can be includeddirectly by using the characteristic behaviourof the model test results. Using this tool willallow to find the most efficient route throughice covered waters.
Fig. 2: Ship model breaks through model ice ridge Fig. 3: Center profile of model ice ridge in full scale
Fig. 4: Ice resistance distribution Fig. 5: Transit velocity

� by Christian Johannsen
Indeed, it is "the old boy" among HSVA´s cavi-tation tunnels. But with its fabulous waterspeed of almost 20 meters per second thelarge conventional cavitation tunnel is still aninteresting toy for our customers as well asfor our engineers. After fifty years of faithfuloperation it was time now to renew thewhole electric control system of this tunnel.
Since HYKAT, HSVA´s famous Hydrodyna-mics and Cavitation Tunnel started to operatewith complete ship models inside its test
section, the old large conventional tunnel hasbeen suffering from a somewhat shadowyexis tence. The latter tunnel is a Kempf &Remmers K 16 type cavitation tunnel with aclosed circular test section of 750 mm diame-ter and a fabulous top speed of 19.5 m/s(Fig. 1). Corresponding to this high speed thetunnel is equipped with two strong dynamo-meters of 130 kW and 30 kW respectively,one driving the model propeller fromupstream, one from downstream. The tunnelwas built in the early sixties of last centuryand up to year 2010 its electric installationswere exactly of this age!
In 2010 and 2011 the control systems of allthree main tunnel components have beenreplaced in two stages by Siemens type state-of-the-art equipment. The water pump, themain dynamometer as well as the inclinedshaft dynamometer are now controlled byjust one movable and handy size controlpanel. All auxiliary drives as well as the star-ter system are controlled automatically. Notonly the ease of use but especially the relia-bility of the facility have been improveddramatically. Since then the tunnel is backinto the light to be used for various kinds ofnon-standard purposes.
High Speed Cavitation Tunnel Modernized
Newswave 10
Fig. 1: The Large Conventional Cavitation Tunnel
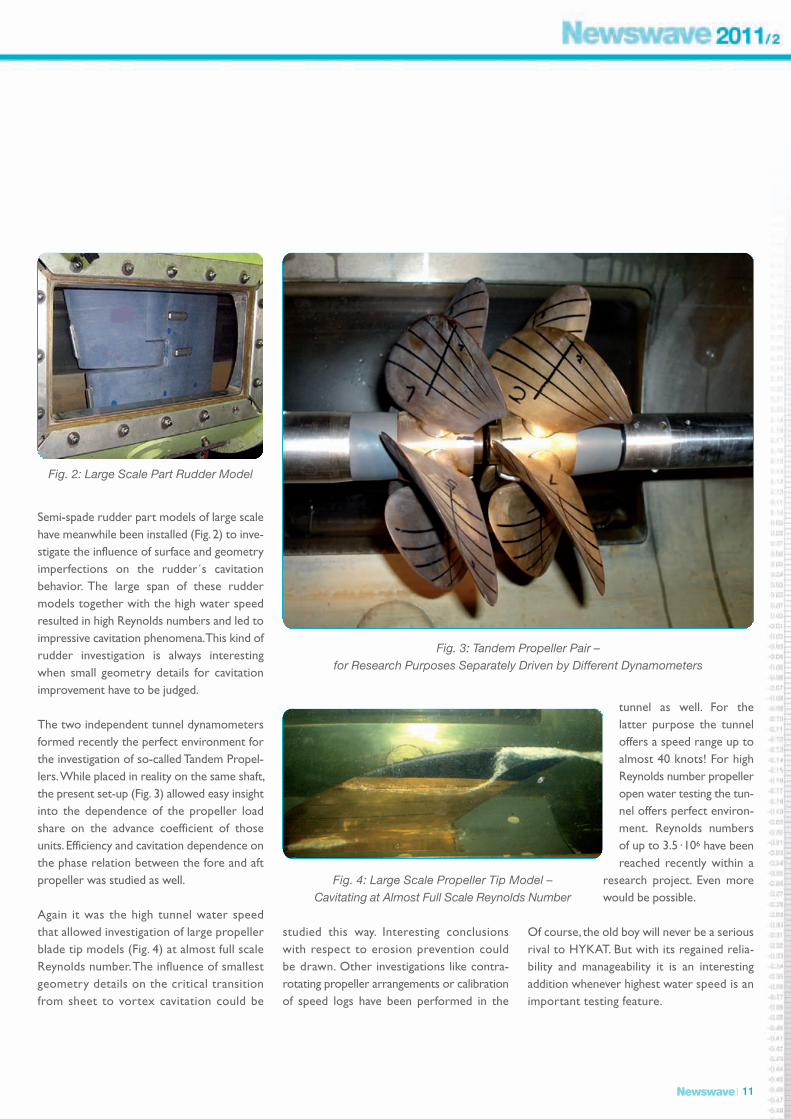
Semi-spade rudder part models of large scalehave meanwhile been installed (Fig. 2) to inve-stigate the influence of surface and geometryimperfections on the rudder´s cavitationbehavior. The large span of these ruddermodels together with the high water speedresulted in high Reynolds numbers and led toimpressive cavitation phenomena. This kind ofrudder investigation is always interestingwhen small geometry details for cavitationimprovement have to be judged.
The two independent tunnel dynamometersformed recently the perfect environment forthe investigation of so-called Tandem Propel-lers. While placed in reality on the same shaft,the present set-up (Fig. 3) allowed easy insightinto the dependence of the propeller loadshare on the advance coefficient of thoseunits. Efficiency and cavitation dependence onthe phase relation between the fore and aftpropeller was studied as well.
Again it was the high tunnel water speedthat allowed investigation of large propellerblade tip models (Fig. 4) at almost full scaleReynolds number. The influence of smallestgeometry details on the critical transitionfrom sheet to vortex cavitation could be
studied this way. Interesting conclusionswith respect to erosion prevention couldbe drawn. Other investigations like contra-rotating propeller arrangements or calibrationof speed logs have been performed in the
tunnel as well. For thelatter purpose the tunneloffers a speed range up toalmost 40 knots! For highReynolds number propelleropen water testing the tun-nel offers perfect environ-ment. Reynolds numbersof up to 3.5 ·106 have beenreached recently within a
research project. Even morewould be possible.
Of course, the old boy will never be a seriousrival to HYKAT. But with its regained relia- bility and manageability it is an interestingaddition whenever highest water speed is animportant testing feature.
Newswave 11
Fig. 2: Large Scale Part Rudder Model
Fig. 4: Large Scale Propeller Tip Model – Cavitating at Almost Full Scale Reynolds Number
Fig. 3: Tandem Propeller Pair – for Research Purposes Separately Driven by Different Dynamometers

Newswave 12
� by Katja Jacobsen and Peter Soukup
Due to new standards and increasing require-ments on safety as well as economic aspectsof ships in seaways it is essential for modernmodel basins to be prepared for changingdemands. With new testing facilities togetherwith improvements in and developments ofnumerical seakeeping codes HSVA signifi-cantly enlarges its scope of investigations onseagoing ships and offshore structures at zeroand at forward speeds.
With the new Side Wave Generator (SWG)HSVA improves its seakeeping test facilitiesdramatically. With the aim to acquire newmarkets and thus new orders HSVAextends as first model basin worldwide itstowing tank with a new computer control-led Side Wave Generator in order to inve-stigate seagoing ships in beam and obliquesea scenarios.
The new Side Wave Generator is a snake typewave generator consisting of 80 flaps eachhaving the width of 0.5m (Figurte 1). Each flapis controlled individually and therefore arbitrarywaves and sea states can be generated:
• Regular waves
• Multichromatic waves with limited number of frequencies
• Irregular long-crested seaways(JONSWAP, PM, TMA and user-defined spectra)
• Selected subseries of irregular sea states satisfying given parameters (e.g. steepness)
• Irregular short-crested sea states
• User-defined wave trains
• The above described waves and seawayscan be generated within angles from 20°to 160° with respect to ship course, thusenabling investigations in beam and in obli-que sea states.
• Together with the existing wave genera-tor, which can generate long-crestedwaves in the longitudinal tank direction,the combination of wind seas and swellcan be simulated.
The Side Wave Generator is mounted inthe middle of the long side of the LargeTowing Tank. This gives the advantage thatthe acceleration and deceleration phases ofthe ship model can take place outside of theactual measuring region. Thus the wholelength of the Side Wave Generator can enti-rely be exploited for the measurements.This enables the efficient investigation ofvessels also in beam and oblique seas atnonzero speeds.
Recent Developments of Model Testing andComputations in the Seakeeping Department
12
Fig. 1: Flaps of the snake type Side Wave Generator generating oblique waves

Newswave 1313
The first tests for wave performanceshowed very promising results (Figure 2).The spectral shape of an irregular long-crested seaway with a significant waveheight of 0.25m and a peak period of 2s wasmet with less than 3 percent of deviation.The straightness of oblique waves of 135°heading was tested with 3 wave probes alig-ned in this direction. The result was convin-cing: Absolutely no phase shift was measu-red (Figure 2 bottom).
Figure 3 shows the results for the heave,pitch, and roll motion of the freely runningmodel in oblique irregular long-crested seasgained from a model test with the SWGtogether with computed results.
Figure 4 shows a typical scenario of a contai-ner ship in high stern quartering short-crested irregular seas, whereas in Figure 5 asemisubmersible in severe long-crestedbeam seas is presented. Both examplesdemonstrate nicely the capability of the newside wave generator and show the highlyrealistic environment conditions which cannow be realized in the towing tank.
Besides standard ship models also offshorestructures like semisubmersibles and pipe-layers, as well as special ship types from fastmonohulls to small waterplane area twin hullcatamarans and surface effect ships can nowbe investigated in arbitrary, highly realisticwave scenarios.
Of frequent interest regarding the overalllinear motion performance of ships andoffshore structures is the determination ofthe Response Amplitude Operators (RAO).In former times the RAOs were determi-ned by performing tests in regular waves,which is a fairly time consuming procedure.Alternatively, HSVA uses the transient wavepacket technique to determine the RAOs.By exploiting the dispersion characteristic
Fig. 2: Results of an irregular long-crested seaway and an oblique regular wave

of water waves the components of a spec-trum are arranged so that a transient wavetrain is generated, which includes wavecomponents over a wide range of frequen-cies. Thus with the wave packet technique alarge range of wave frequencies can berealised within one single test of shortduration. In addition no unwanted reflec-tions from the tank wall have to be consi-dered, nearly no statistical spreading ofresults and very good resolution of theRAOs in the frequency domain is obtained.In Figure 6 the Response Amplitude Opera-tors resulting from one single test run perwave heading are shown.
Progress, however, has not only been made inthe model testing, but also in numerical compu-tations. The program ROLLSS, which is veryfast in simulation of parametric rolling, is beingused more and more frequently at HSVA.While the heave, pitch, sway and yaw motionsare computed by a linear strip method, and thesurge motion by a simple nonlinear approach,the roll motion is computed nonlinearly in thetime domain using the righting lever curves ofstatic stability in waves. This approach is assimple as effective. The computation time for afull scale simulation in the time domain is veryshort. Thus a large number of simulations canbe done within a short time. This makes it
Newswave 14
Fig. 3: Model in Side Wave Generator with results for heave, roll and pitch motions compared to results from
numerical calculation
Fig. 4: Container Ship in Severe Stern Quartering Short Crested Seas
Fig. 5: Semi-Submersible Floating Platform in Severe Long Crested Beam Seas
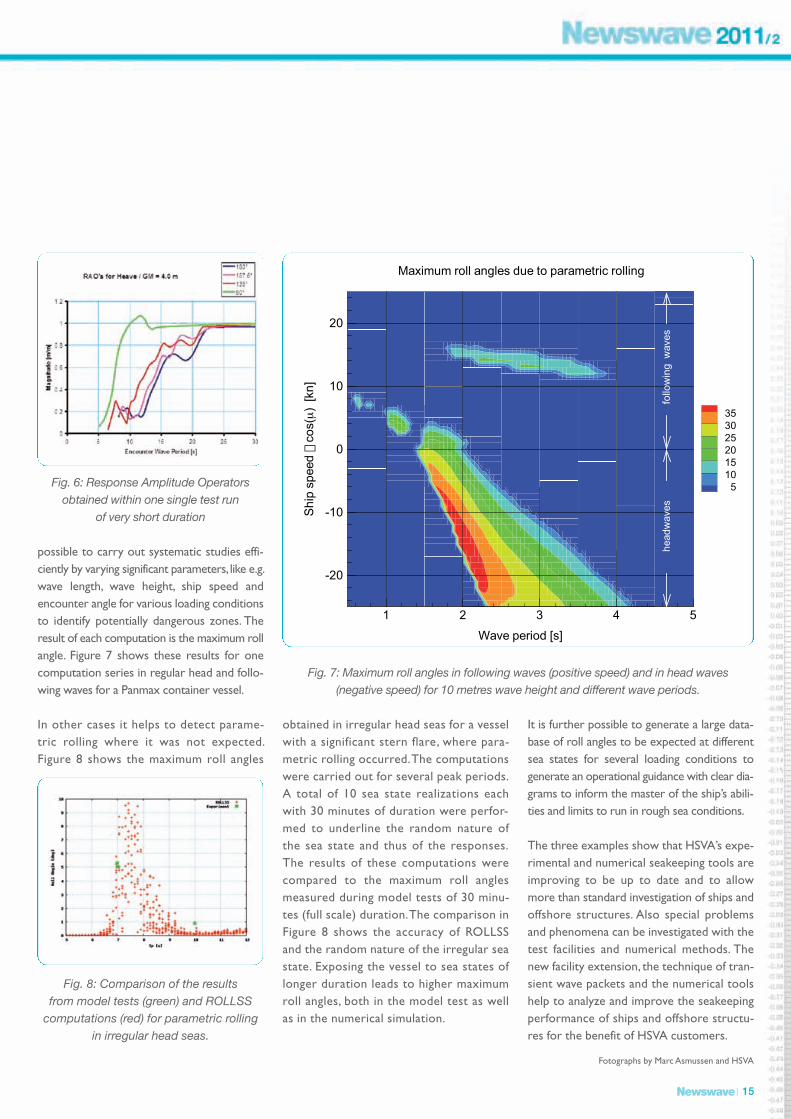
possible to carry out systematic studies effi-ciently by varying significant parameters, like e.g.wave length, wave height, ship speed andencounter angle for various loading conditionsto identify potentially dangerous zones. Theresult of each computation is the maximum rollangle. Figure 7 shows these results for onecomputation series in regular head and follo-wing waves for a Panmax container vessel.
In other cases it helps to detect parame-tric rolling where it was not expected.Figure 8 shows the maximum roll angles
obtained in irregular head seas for a vesselwith a significant stern flare, where para-metric rolling occurred. The computationswere carried out for several peak periods.A total of 10 sea state realizations eachwith 30 minutes of duration were perfor-med to underline the random nature ofthe sea state and thus of the responses.The results of these computations werecompared to the maximum roll anglesmeasured during model tests of 30 minu-tes (full scale) duration. The comparison inFigure 8 shows the accuracy of ROLLSSand the random nature of the irregular seastate. Exposing the vessel to sea states oflonger duration leads to higher maximumroll angles, both in the model test as wellas in the numerical simulation.
It is further possible to generate a large data-base of roll angles to be expected at differentsea states for several loading conditions togenerate an operational guidance with clear dia -grams to inform the master of the ship’s abili-ties and limits to run in rough sea conditions.
The three examples show that HSVA’s expe-rimental and numerical seakeeping tools areimproving to be up to date and to allowmore than standard investigation of ships andoffshore structures. Also special problemsand phenomena can be investigated with thetest facilities and numerical methods. Thenew facility extension, the technique of tran-sient wave packets and the numerical toolshelp to analyze and improve the seakeepingperformance of ships and offshore structu-res for the benefit of HSVA customers.
Fotographs by Marc Asmussen and HSVA
Newswave 15
Fig. 6: Response Amplitude Operatorsobtained within one single test run
of very short duration
Fig. 7: Maximum roll angles in following waves (positive speed) and in head waves (negative speed) for 10 metres wave height and different wave periods.
Fig. 8: Comparison of the results from model tests (green) and ROLLSS
computations (red) for parametric rollingin irregular head seas.
Wave period [s]
Shipspeed�cos(μ)[kn]
1 2 3 4 5
-20
-10
0
10
20
3530252015105
Maximum roll angles due to parametric rolling
headwaves
followingwaves

Member of staff
Hamburg Ship Model Basin • Bramfelder Straße 164 • D-22305 Hamburg
Phone: +49 - 40 - 69 203 0 • Fax: +49 - 40 - 69 203 345 • Email: [email protected] • Web: www.hsva.de
ww
w.e
nvi
se.c
om
Grete Ernst joined the CFD department ofHSVA in November 2008 where she hasbeen involved in different CFD relatedresearch projects. Since July 2011 she ismember of the project management teamof HSVA’s resistance and propulsiondepartment. In her position as projectmanager she is in charge of performing andevaluating model tests for customers fromEurope as well as Asia. She will be thecontact person for customers currentlymanaged by Mrs. Jutta Zerbst who is goinginto retirement by the end of this year.
Grete Ernst studied Naval Architecture andOcean Engineering at Technical University ofBerlin and University of Newcastle uponTyne. In 2008 her diploma thesis has beenrewarded with the WHC Nicholas Prize bythe Royal Institution of Naval Architects.
Grete Ernst takes much pleasure in offshoresailing – her numerous long distance sailingtrips took her along most parts of the Euro-pean cost, across the Atlantic Ocean andeven as far as the Pacific Ocean. None theless she enjoys strolling around the head-lands south of Hamburg with her horse.
Shanghai New International Expo Centre, Pundong, Shanghai, China
MARINTEC CHINA 201129 November – 2 December 2011
Visit us in the German Pavilion at Marintec China 2011:Hall W4, Booth No. 4C11-9
© P
ictu
re: P
yzho
u @
Wik
iped
ia