Embed Size (px)
Citation preview
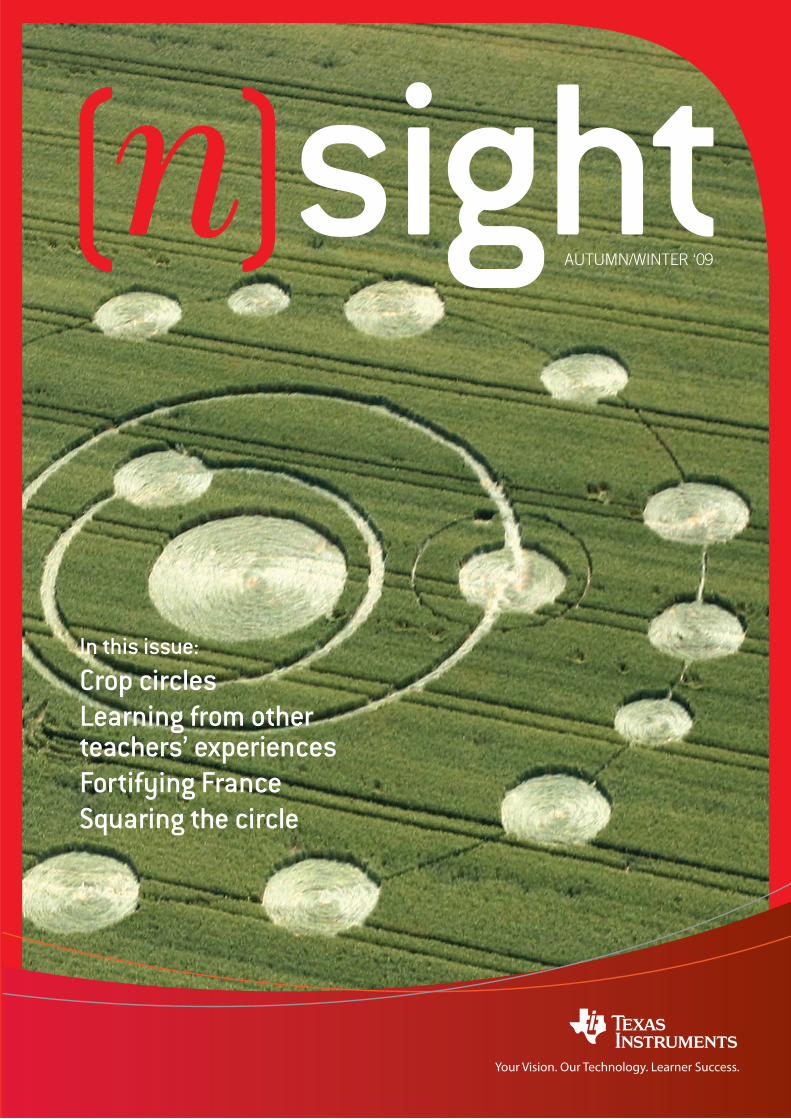
AUTUMN/WINTER ‘09
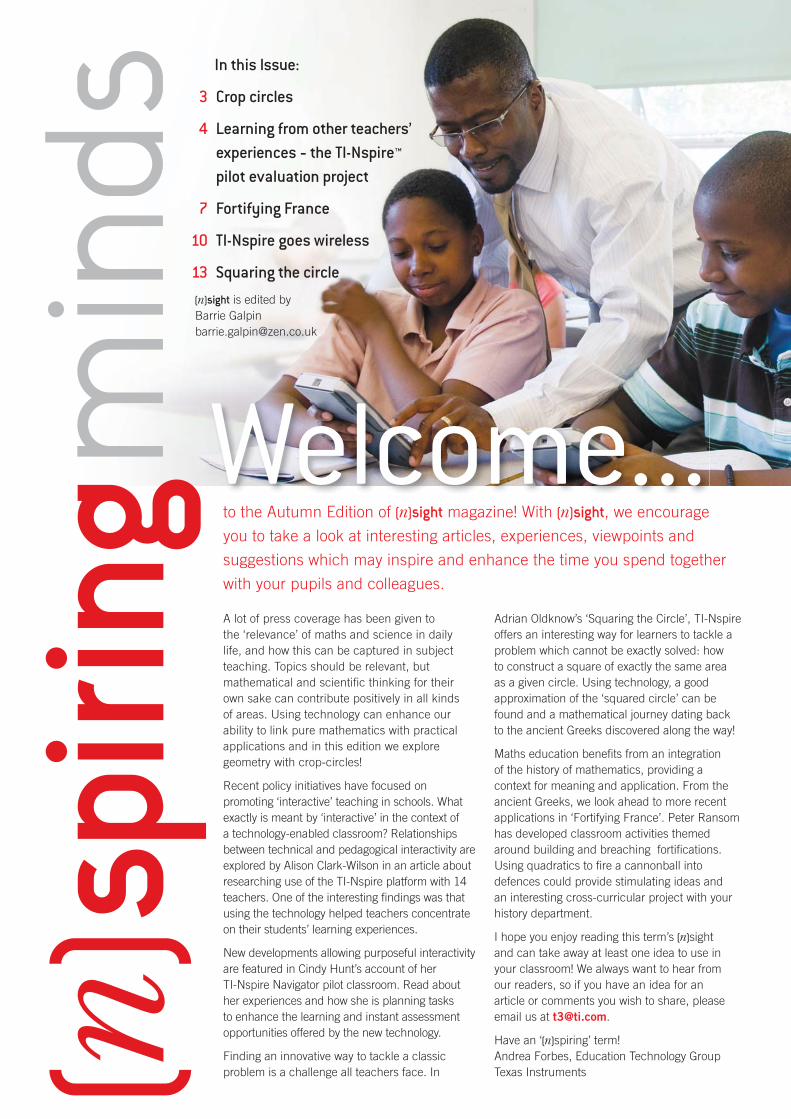
In this issue:
Crop circles Learning from other teachers’ experiencesFortifying FranceSquaring the circle
Welcome...to the Autumn Edition of *sight magazine! With *sight, we encourage
you to take a look at interesting articles, experiences, viewpoints and
suggestions which may inspire and enhance the time you spend together
with your pupils and colleagues.
In this Issue:
3 Crop circles
4 Learning from other teachers’ experiences - the TI-Nspire™ pilot evaluation project
7 Fortifying France
10 TI-Nspire goes wireless
13 Squaring the circle
A lot of press coverage has been given to
the ‘relevance’ of maths and science in daily
life, and how this can be captured in subject
teaching. Topics should be relevant, but
mathematical and scientifi c thinking for their
own sake can contribute positively in all kinds
of areas. Using technology can enhance our
ability to link pure mathematics with practical
applications and in this edition we explore
geometry with crop-circles!
Recent policy initiatives have focused on
promoting ‘interactive’ teaching in schools. What
exactly is meant by ‘interactive’ in the context of
a technology-enabled classroom? Relationships
between technical and pedagogical interactivity are
explored by Alison Clark-Wilson in an article about
researching use of the TI-Nspire platform with 14
teachers. One of the interesting fi ndings was that
using the technology helped teachers concentrate
on their students’ learning experiences.
New developments allowing purposeful interactivity
are featured in Cindy Hunt’s account of her
TI-Nspire Navigator pilot classroom. Read about
her experiences and how she is planning tasks
to enhance the learning and instant assessment
opportunities offered by the new technology.
Finding an innovative way to tackle a classic
problem is a challenge all teachers face. In
Adrian Oldknow’s ‘Squaring the Circle’, TI-Nspire
offers an interesting way for learners to tackle a
problem which cannot be exactly solved: how
to construct a square of exactly the same area
as a given circle. Using technology, a good
approximation of the ‘squared circle’ can be
found and a mathematical journey dating back
to the ancient Greeks discovered along the way!
Maths education benefi ts from an integration
of the history of mathematics, providing a
context for meaning and application. From the
ancient Greeks, we look ahead to more recent
applications in ‘Fortifying France’. Peter Ransom
has developed classroom activities themed
around building and breaching fortifi cations.
Using quadratics to fi re a cannonball into
defences could provide stimulating ideas and
an interesting cross-curricular project with your
history department.
I hope you enjoy reading this term’s *sight
and can take away at least one idea to use in
your classroom! We always want to hear from
our readers, so if you have an idea for an
article or comments you wish to share, please
email us at [email protected].
Have an ‘*spiring’ term!
Andrea Forbes, Education Technology Group
Texas Instruments
*sight is edited by
Barrie Galpin
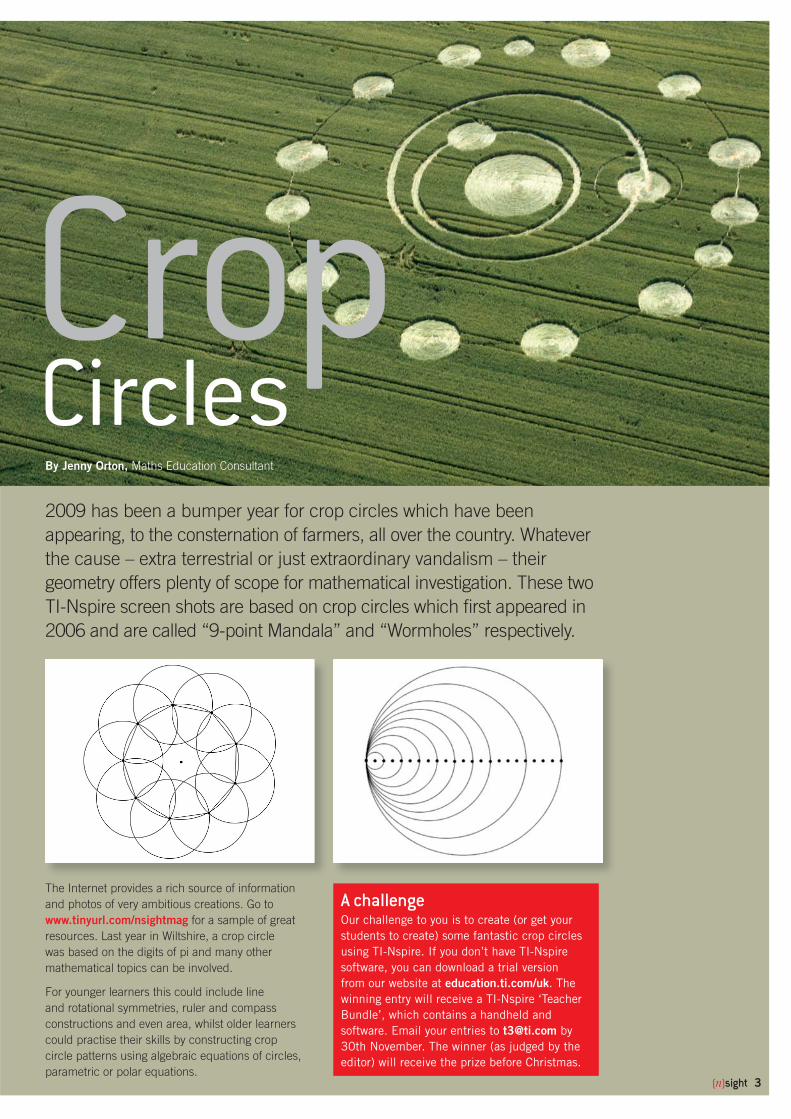
2009 has been a bumper year for crop circles which have been
appearing, to the consternation of farmers, all over the country. Whatever
the cause – extra terrestrial or just extraordinary vandalism – their
geometry offers plenty of scope for mathematical investigation. These two
TI-Nspire screen shots are based on crop circles which fi rst appeared in
2006 and are called “9-point Mandala” and “Wormholes” respectively.
The Internet provides a rich source of information
and photos of very ambitious creations. Go to
www.tinyurl.com/nsightmag for a sample of great
resources. Last year in Wiltshire, a crop circle
was based on the digits of pi and many other
mathematical topics can be involved.
For younger learners this could include line
and rotational symmetries, ruler and compass
constructions and even area, whilst older learners
could practise their skills by constructing crop
circle patterns using algebraic equations of circles,
parametric or polar equations.
CirclesCrop
By Jenny Orton, Maths Education Consultant
A challengeOur challenge to you is to create (or get your
students to create) some fantastic crop circles
using TI-Nspire. If you don’t have TI-Nspire
software, you can download a trial version
from our website at education.ti.com/uk. The
winning entry will receive a TI-Nspire ‘Teacher
Bundle’, which contains a handheld and
software. Email your entries to [email protected] by
30th November. The winner (as judged by the
editor) will receive the prize before Christmas.
*sight 3
Between September 2007 and April 2008 fourteen teachers were
involved in a project entitled ‘Evaluating TI-Nspire in Secondary
Mathematics Classrooms’. Getting started with a completely new
technology can be a lonely process, but knowing that some of your
frustrations are experienced (and overcome) by other teachers and
fi nding out about their successes can provide inspiration and ideas.
In this article the project’s director, Alison Clark-Wilson, describes how
using the technology helped teachers concentrate on their students’
learning experiences, illustrating the point by describing a particularly
innovative lesson idea developed by one of the project teachers.
The New National Curriculum for secondary
mathematics is challenging those of us in England
and Wales to consider thinking less about our own
teaching and more about the experiences of our
students as they actually learn mathematics. The
teachers involved in the TI-Nspire Evaluation Pilot
were able to consider these recommendations
alongside the introduction of the TI-Nspire handheld
and software in their classrooms.
When planning lessons, having decided on the
curriculum content, a common starting point is
to think fi rst about what I as teacher am going
to say and do to enable to students to learn the
mathematical concept or skills. During the project,
we strove to turn this around slightly, focussing our
thinking on what the students were going to do
and say to enable them to engage deeply in the
concept or skills in a way that allowed them
develop their own mathematical understandings.
The following activity is a good example of how
this worked in practice.
Rebecca Davey, who at the time of the project
taught at St Andrews CE Boys School Worthing,
had already identifi ed the main objective of her
lesson with her able Year 10 boys. She wanted
them to be able to recognise and generate the
equations of lines perpendicular or parallel to
straight lines such as y = 2x – 3.
The students, who were working on TI-Nspire
handhelds, began with a new TI-Nspire document
and inserted a blank Graphs & Geometry page.
Rebecca showed the students how to enter a linear
function and asked the students to all generate
the line y = x by entering the function f1(x) = x.
She then asked them to come up with a second
line, perpendicular to this one. From prior knowledge,
they suggested y = -x and entered this as a second
function, f2(x) = -x.
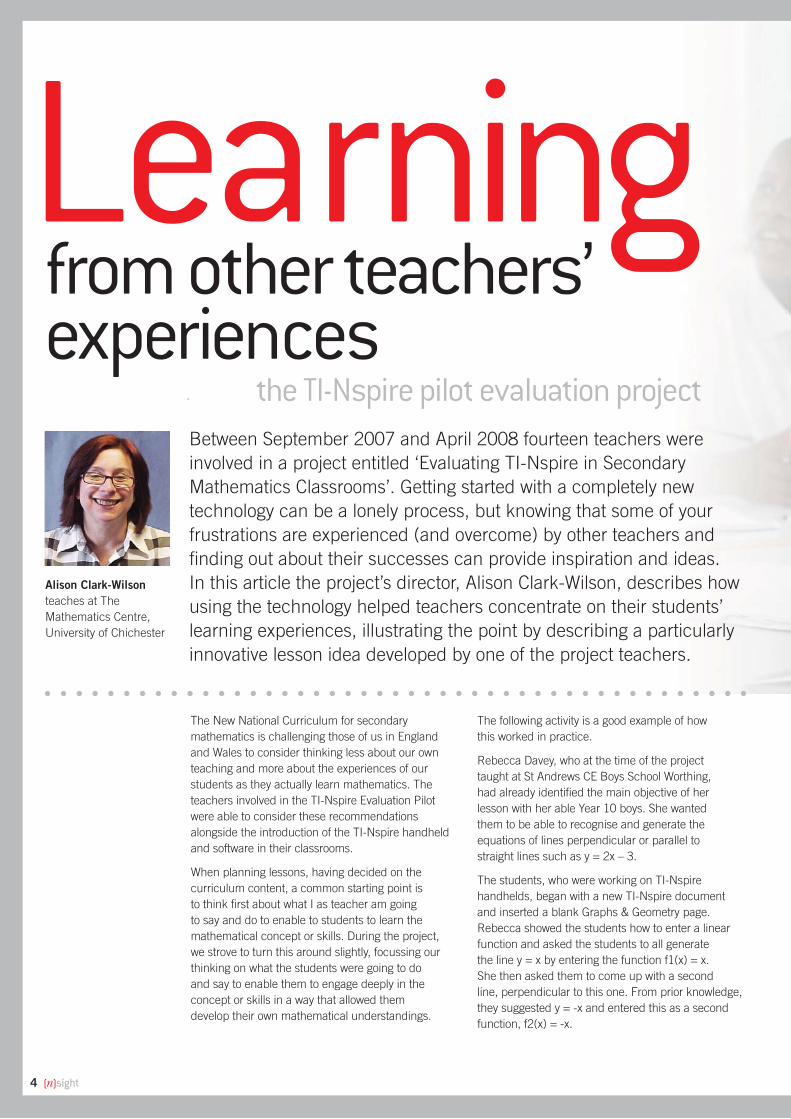
Alison Clark-Wilson
teaches at The
Mathematics Centre,
University of Chichester
Learningfrom other teachers’ experiences
the TI-Nspire pilot evaluation project
4 *sight
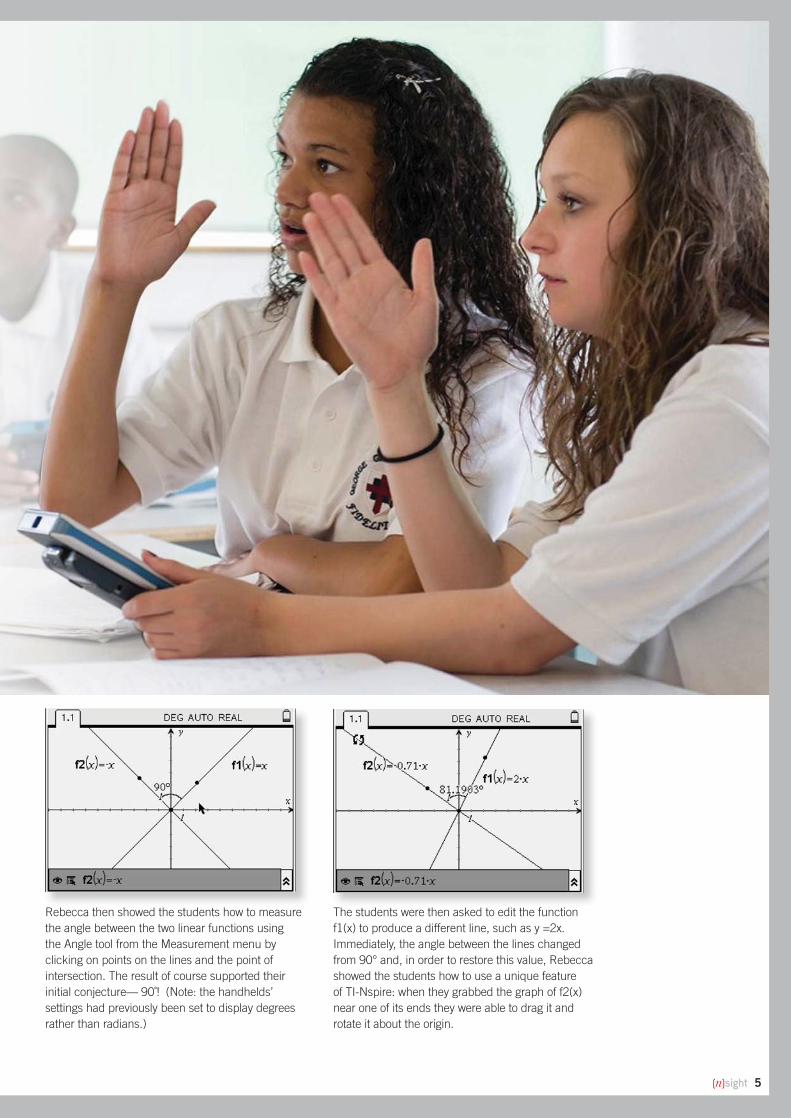
Rebecca then showed the students how to measure
the angle between the two linear functions using
the Angle tool from the Measurement menu by
clicking on points on the lines and the point of
intersection. The result of course supported their
initial conjecture–– 90˚! (Note: the handhelds’
settings had previously been set to display degrees
rather than radians.)
The students were then asked to edit the function
f1(x) to produce a different line, such as y =2x.
Immediately, the angle between the lines changed
from 90° and, in order to restore this value, Rebecca
showed the students how to use a unique feature
of TI-Nspire: when they grabbed the graph of f2(x)
near one of its ends they were able to drag it and
rotate it about the origin.
*sight 5
As the angle between the lines had already been
defi ned and measured, there was instant feedback
about the angle between the two lines and the
students were quickly able to identify the function
so that the two lines were again perpendicular.
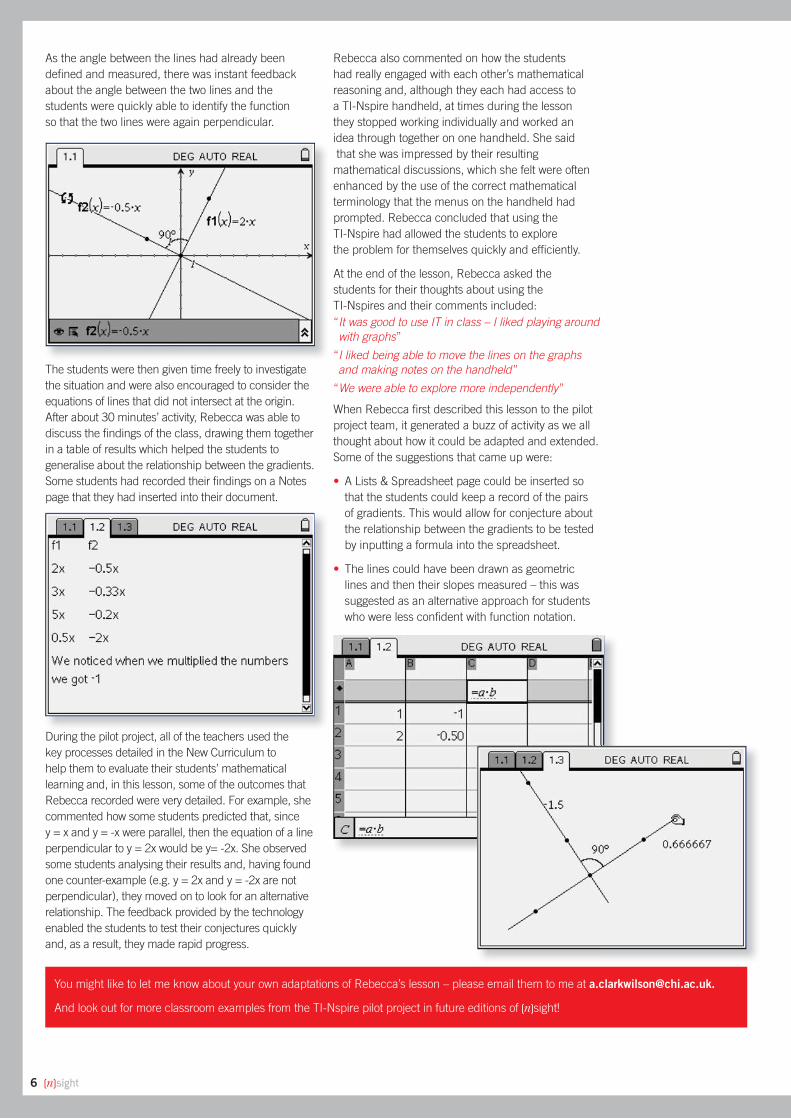
The students were then given time freely to investigate
the situation and were also encouraged to consider the
equations of lines that did not intersect at the origin.
After about 30 minutes’ activity, Rebecca was able to
discuss the fi ndings of the class, drawing them together
in a table of results which helped the students to
generalise about the relationship between the gradients.
Some students had recorded their fi ndings on a Notes
page that they had inserted into their document.
During the pilot project, all of the teachers used the
key processes detailed in the New Curriculum to
help them to evaluate their students’ mathematical
learning and, in this lesson, some of the outcomes that
Rebecca recorded were very detailed. For example, she
commented how some students predicted that, since
y = x and y = -x were parallel, then the equation of a line
perpendicular to y = 2x would be y= -2x. She observed
some students analysing their results and, having found
one counter-example (e.g. y = 2x and y = -2x are not
perpendicular), they moved on to look for an alternative
relationship. The feedback provided by the technology
enabled the students to test their conjectures quickly
and, as a result, they made rapid progress.
Rebecca also commented on how the students
had really engaged with each other’s mathematical
reasoning and, although they each had access to
a TI-Nspire handheld, at times during the lesson
they stopped working individually and worked an
idea through together on one handheld. She said
that she was impressed by their resulting
mathematical discussions, which she felt were often
enhanced by the use of the correct mathematical
terminology that the menus on the handheld had
prompted. Rebecca concluded that using the
TI-Nspire had allowed the students to explore
the problem for themselves quickly and effi ciently.
At the end of the lesson, Rebecca asked the
students for their thoughts about using the
TI-Nspires and their comments included:
“ It was good to use IT in class – I liked playing around with graphs”
“ I liked being able to move the lines on the graphs and making notes on the handheld”
“We were able to explore more independently”
When Rebecca fi rst described this lesson to the pilot
project team, it generated a buzz of activity as we all
thought about how it could be adapted and extended.
Some of the suggestions that came up were:
• A Lists & Spreadsheet page could be inserted so
that the students could keep a record of the pairs
of gradients. This would allow for conjecture about
the relationship between the gradients to be tested
by inputting a formula into the spreadsheet.
• The lines could have been drawn as geometric
lines and then their slopes measured – this was
suggested as an alternative approach for students
who were less confi dent with function notation.
You might like to let me know about your own adaptations of Rebecca’s lesson – please email them to me at [email protected].
And look out for more classroom examples from the TI-Nspire pilot project in future editions of *sight!
6 *sight
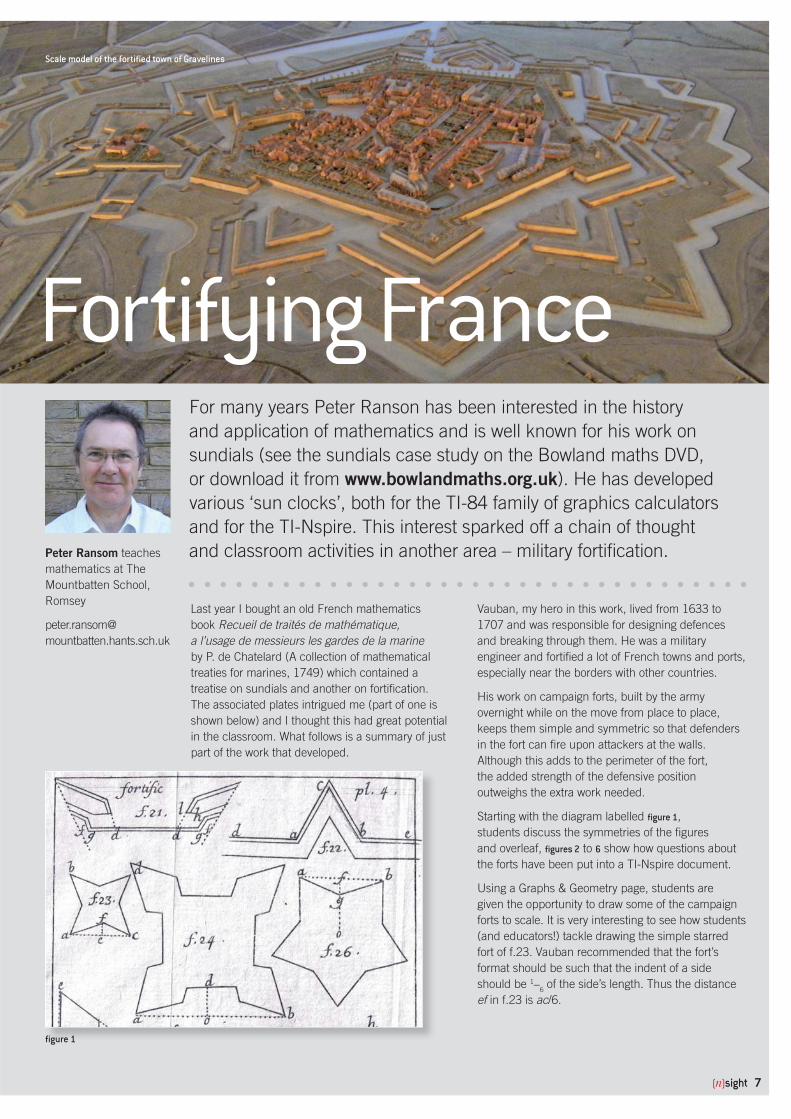
For many years Peter Ranson has been interested in the history
and application of mathematics and is well known for his work on
sundials (see the sundials case study on the Bowland maths DVD,
or download it from www.bowlandmaths.org.uk). He has developed
various ‘sun clocks’, both for the TI-84 family of graphics calculators
and for the TI-Nspire. This interest sparked off a chain of thought
and classroom activities in another area – military fortifi cation.
Fortifying France
Peter Ransom teaches
mathematics at The
Mountbatten School,
Romsey
peter.ransom@
mountbatten.hants.sch.uk
Last year I bought an old French mathematics
book Recueil de traités de mathématique,
a l’usage de messieurs les gardes de la marine
by P. de Chatelard (A collection of mathematical
treaties for marines, 1749) which contained a
treatise on sundials and another on fortifi cation.
The associated plates intrigued me (part of one is
shown below) and I thought this had great potential
in the classroom. What follows is a summary of just
part of the work that developed.
Scale model of the fortifi ed town of Gravelines
Vauban, my hero in this work, lived from 1633 to
1707 and was responsible for designing defences
and breaking through them. He was a military
engineer and fortifi ed a lot of French towns and ports,
especially near the borders with other countries.
His work on campaign forts, built by the army
overnight while on the move from place to place,
keeps them simple and symmetric so that defenders
in the fort can fi re upon attackers at the walls.
Although this adds to the perimeter of the fort,
the added strength of the defensive position
outweighs the extra work needed.
Starting with the diagram labelled fi gure 1,
students discuss the symmetries of the fi gures
and overleaf, fi gures 2 to 6 show how questions about
the forts have been put into a TI-Nspire document.
Using a Graphs & Geometry page, students are
given the opportunity to draw some of the campaign
forts to scale. It is very interesting to see how students
(and educators!) tackle drawing the simple starred
fort of f.23. Vauban recommended that the fort’s
format should be such that the indent of a side
should be 1–6 of the side’s length. Thus the distance
ef in f.23 is ac/6.
fi gure 1
*sight 7
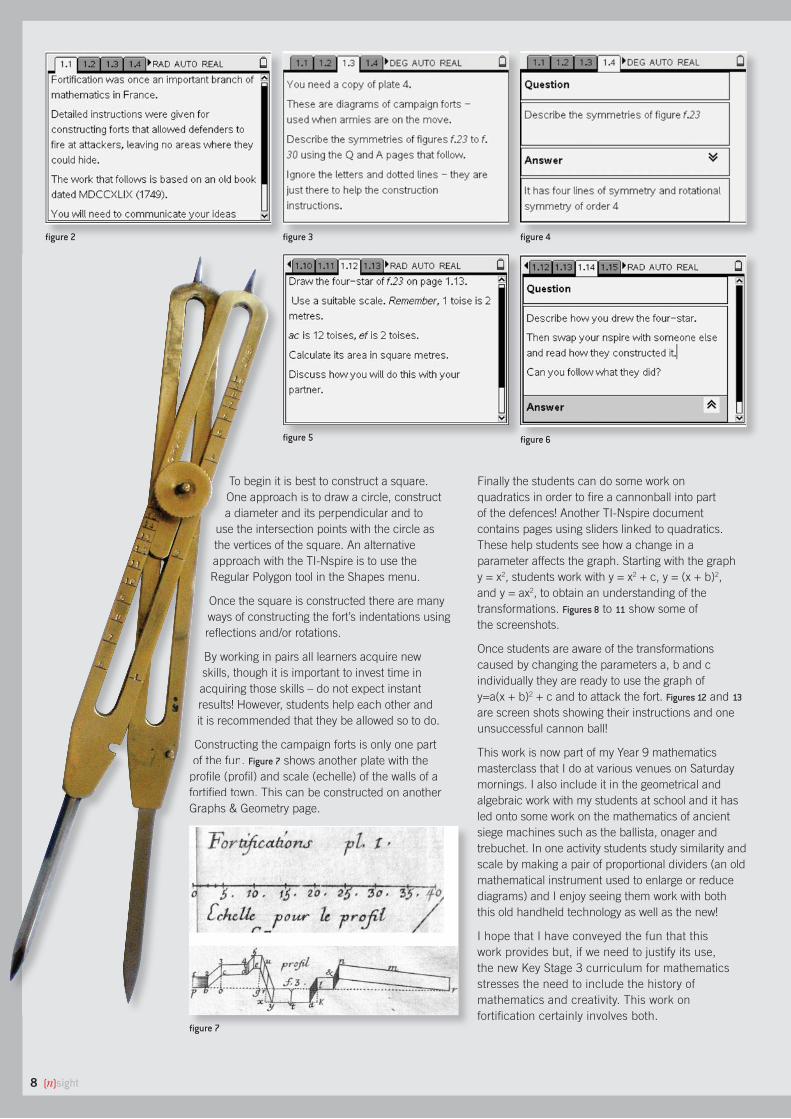
To begin it is best to construct a square.
One approach is to draw a circle, construct
a diameter and its perpendicular and to
use the intersection points with the circle as
the vertices of the square. An alternative
approach with the TI-Nspire is to use the
Regular Polygon tool in the Shapes menu.
Once the square is constructed there are many
ways of constructing the fort’s indentations using
refl ections and/or rotations.
By working in pairs all learners acquire new
skills, though it is important to invest time in
acquiring those skills – do not expect instant
results! However, students help each other and
it is recommended that they be allowed so to do.
Constructing the campaign forts is only one part
of the fun. Figure 7 shows another plate with the
profi le (profi l) and scale (echelle) of the walls of a
fortifi ed town. This can be constructed on another
Graphs & Geometry page.
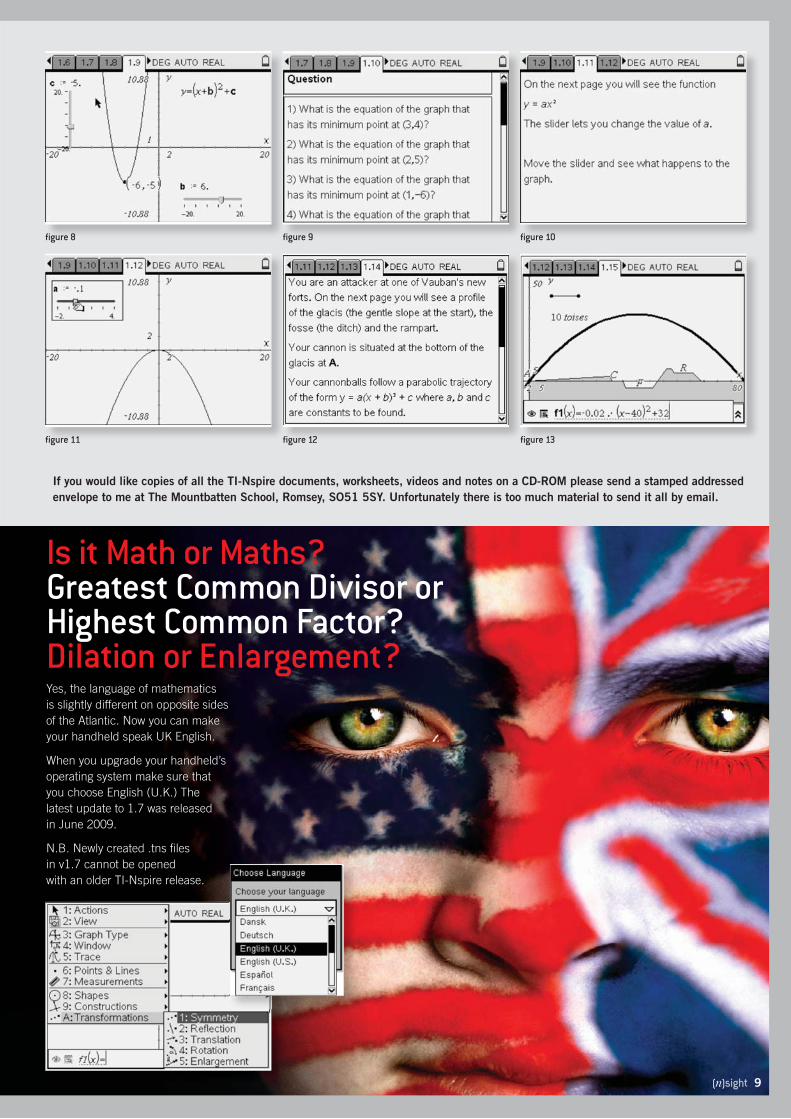
Finally the students can do some work on
quadratics in order to fi re a cannonball into part
of the defences! Another TI-Nspire document
contains pages using sliders linked to quadratics.
These help students see how a change in a
parameter affects the graph. Starting with the graph
y = x2, students work with y = x2 + c, y = (x + b)2,
and y = ax2, to obtain an understanding of the
transformations. Figures 8 to 11 show some of
the screenshots.
Once students are aware of the transformations
caused by changing the parameters a, b and c
individually they are ready to use the graph of
y=a(x + b)2 + c and to attack the fort. Figures 12 and 13
are screen shots showing their instructions and one
unsuccessful cannon ball!
This work is now part of my Year 9 mathematics
masterclass that I do at various venues on Saturday
mornings. I also include it in the geometrical and
algebraic work with my students at school and it has
led onto some work on the mathematics of ancient
siege machines such as the ballista, onager and
trebuchet. In one activity students study similarity and
scale by making a pair of proportional dividers (an old
mathematical instrument used to enlarge or reduce
diagrams) and I enjoy seeing them work with both
this old handheld technology as well as the new!
I hope that I have conveyed the fun that this
work provides but, if we need to justify its use,
the new Key Stage 3 curriculum for mathematics
stresses the need to include the history of
mathematics and creativity. This work on
fortifi cation certainly involves both.
fi gure 2
fi gure 5
fi gure 4
fi gure 6
fi gure 3
fi gure 7
8 *sight
To begin it
One approa
a diameter
use the inters
the vertices of
approach with
Regular Polygo
Once the squa
ways of constru
refl ections and/
By working in p
skills, though it
acquiring those s
results! However,
it is recommende
Constructing the
of the fun. Figure 7
profi le (profi l) and
fortifi ed town. This
Graphs & Geometr
fi gure 11
fi gure 8
fi gure 12
fi gure 9
fi gure 13
fi gure 10
If you would like copies of all the TI-Nspire documents, worksheets, videos and notes on a CD-ROM please send a stamped addressed
envelope to me at The Mountbatten School, Romsey, SO51 5SY. Unfortunately there is too much material to send it all by email.
Is it Math or Maths? Greatest Common Divisor or Highest Common Factor? Dilation or Enlargement? Yes, the language of mathematics
is slightly different on opposite sides
of the Atlantic. Now you can make
your handheld speak UK English.
When you upgrade your handheld’s
operating system make sure that
you choose English (U.K.) The
latest update to 1.7 was released
in June 2009.
N.B. Newly created .tns fi les
in v1.7 cannot be opened
with an older TI-Nspire release.
*sight 9
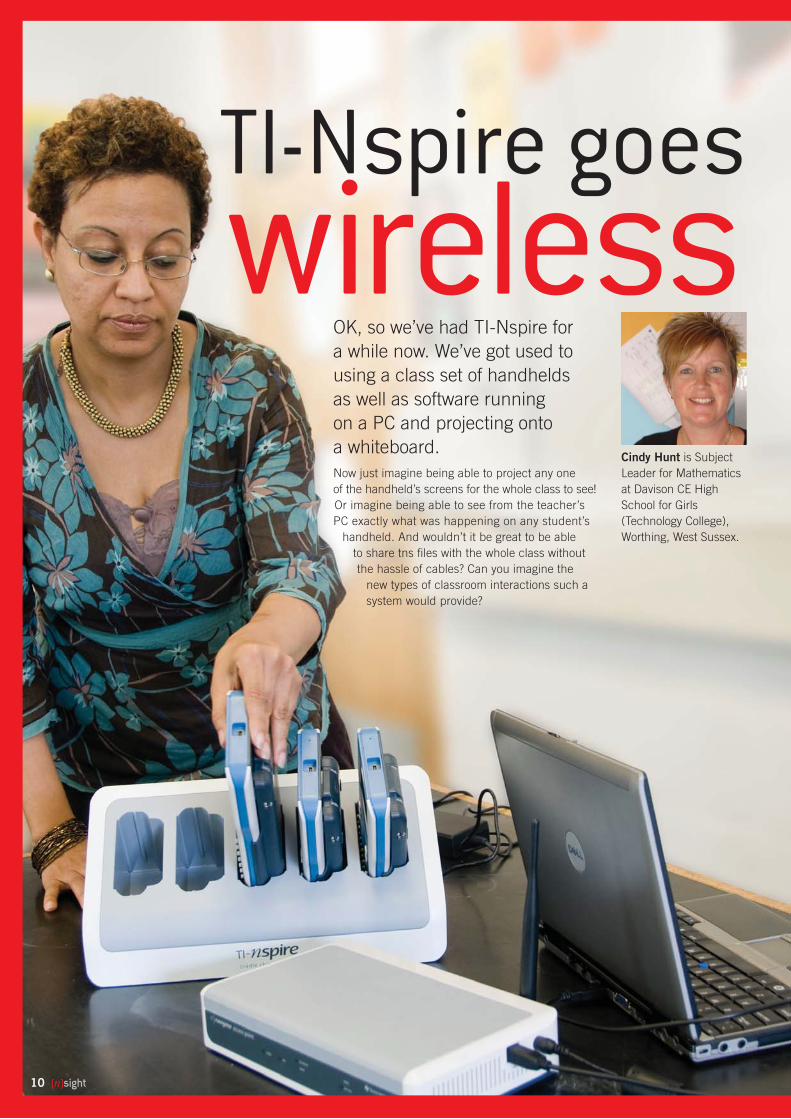
OK, so we’ve had TI-Nspire for
a while now. We’ve got used to
using a class set of handhelds
as well as software running
on a PC and projecting onto
a whiteboard.
Now just imagine being able to project any one
of the handheld’s screens for the whole class to see!
Or imagine being able to see from the teacher’s
PC exactly what was happening on any student’s
handheld. And wouldn’t it be great to be able
to share tns fi les with the whole class without
the hassle of cables? Can you imagine the
new types of classroom interactions such a
system would provide?
TI-Nspire goes
Cindy Hunt is Subject
Leader for Mathematics
at Davison CE High
School for Girls
(Technology College),
Worthing, West Sussex.
wireless
10 *sight
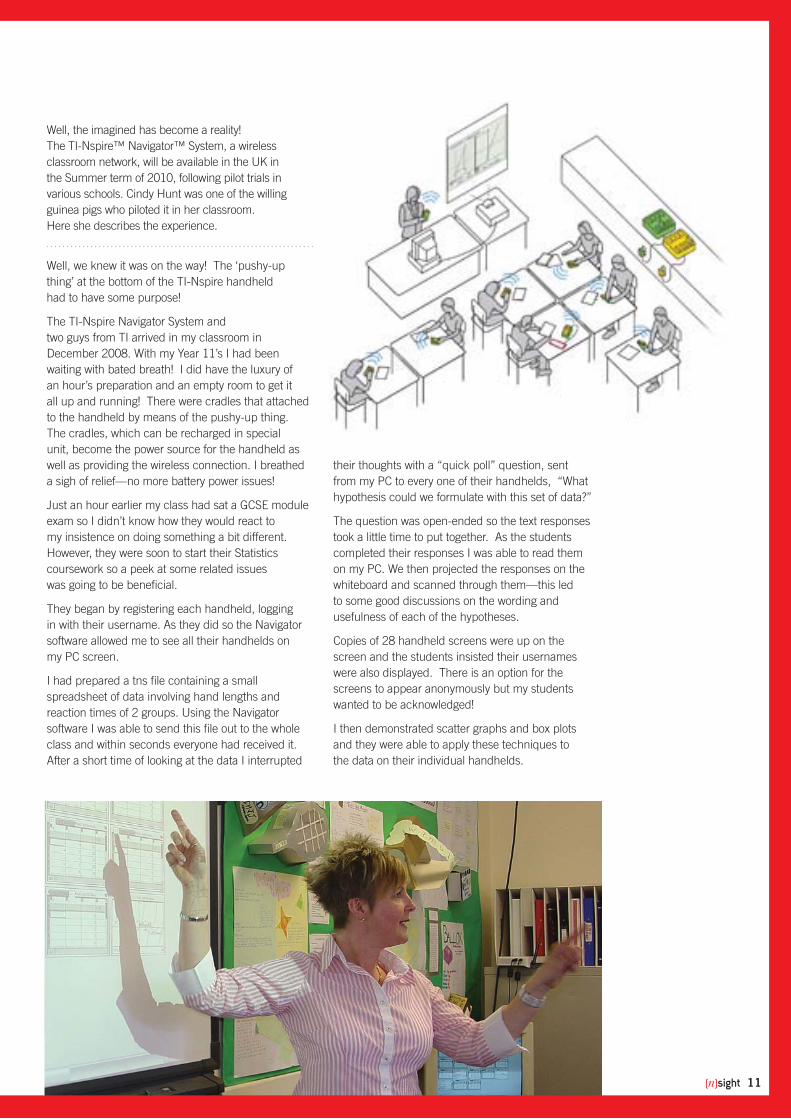
Well, the imagined has become a reality!
The TI-Nspire™ Navigator™ System, a wireless
classroom network, will be available in the UK in
the Summer term of 2010, following pilot trials in
various schools. Cindy Hunt was one of the willing
guinea pigs who piloted it in her classroom.
Here she describes the experience.
Well, we knew it was on the way! The ‘pushy-up
thing’ at the bottom of the TI-Nspire handheld
had to have some purpose!
The TI-Nspire Navigator System and
two guys from TI arrived in my classroom in
December 2008. With my Year 11’s I had been
waiting with bated breath! I did have the luxury of
an hour’s preparation and an empty room to get it
all up and running! There were cradles that attached
to the handheld by means of the pushy-up thing.
The cradles, which can be recharged in special
unit, become the power source for the handheld as
well as providing the wireless connection. I breathed
a sigh of relief––no more battery power issues!
Just an hour earlier my class had sat a GCSE module
exam so I didn’t know how they would react to
my insistence on doing something a bit different.
However, they were soon to start their Statistics
coursework so a peek at some related issues
was going to be benefi cial.
They began by registering each handheld, logging
in with their username. As they did so the Navigator
software allowed me to see all their handhelds on
my PC screen.
I had prepared a tns fi le containing a small
spreadsheet of data involving hand lengths and
reaction times of 2 groups. Using the Navigator
software I was able to send this fi le out to the whole
class and within seconds everyone had received it.
After a short time of looking at the data I interrupted
their thoughts with a “quick poll” question, sent
from my PC to every one of their handhelds, “What
hypothesis could we formulate with this set of data?”
The question was open-ended so the text responses
took a little time to put together. As the students
completed their responses I was able to read them
on my PC. We then projected the responses on the
whiteboard and scanned through them––this led
to some good discussions on the wording and
usefulness of each of the hypotheses.
Copies of 28 handheld screens were up on the
screen and the students insisted their usernames
were also displayed. There is an option for the
screens to appear anonymously but my students
wanted to be acknowledged!
I then demonstrated scatter graphs and box plots
and they were able to apply these techniques to
the data on their individual handhelds.
*sight 11
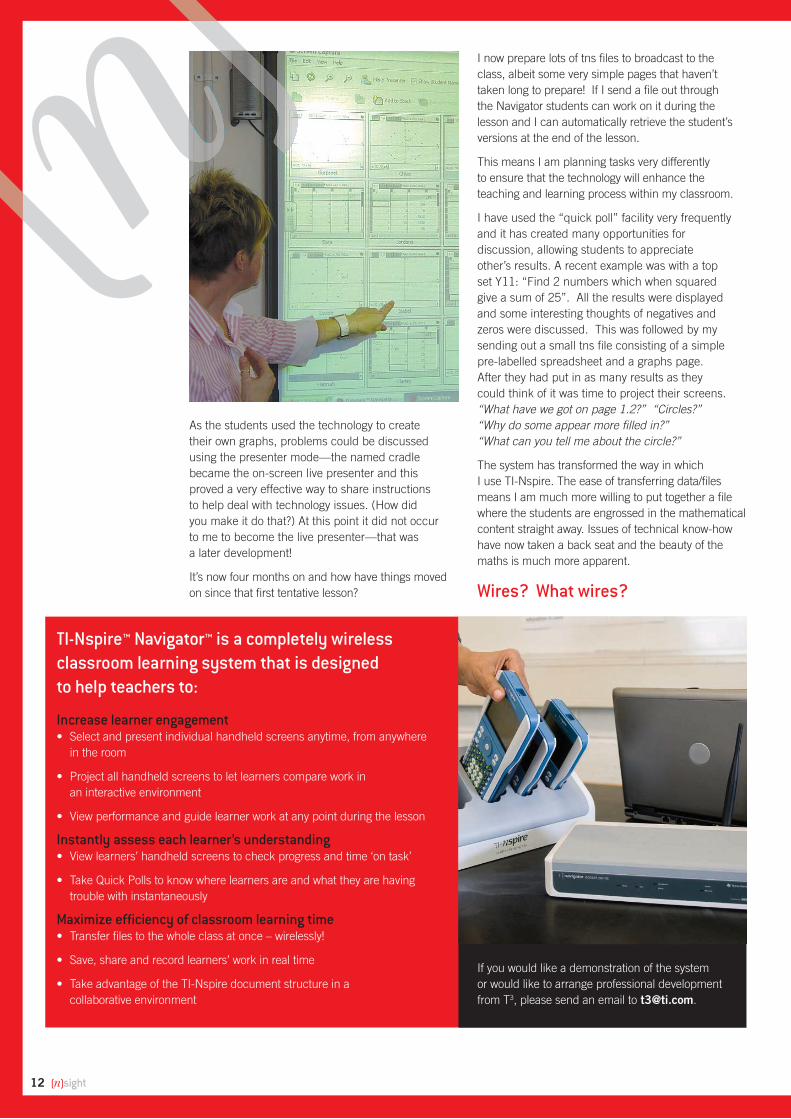
As the students used the technology to create
their own graphs, problems could be discussed
using the presenter mode––the named cradle
became the on-screen live presenter and this
proved a very effective way to share instructions
to help deal with technology issues. (How did
you make it do that?) At this point it did not occur
to me to become the live presenter––that was
a later development!
It’s now four months on and how have things moved
on since that fi rst tentative lesson?
TI-Nspire™ Navigator™ is a completely wireless classroom learning system that is designed to help teachers to:
Increase learner engagement• Select and present individual handheld screens anytime, from anywhere
in the room
• Project all handheld screens to let learners compare work in
an interactive environment
• View performance and guide learner work at any point during the lesson
Instantly assess each learner’s understanding• View learners’ handheld screens to check progress and time ‘on task’
• Take Quick Polls to know where learners are and what they are having
trouble with instantaneously
Maximize effi ciency of classroom learning time• Transfer fi les to the whole class at once – wirelessly!
• Save, share and record learners’ work in real time
• Take advantage of the TI-Nspire document structure in a
collaborative environment
I now prepare lots of tns fi les to broadcast to the
class, albeit some very simple pages that haven’t
taken long to prepare! If I send a fi le out through
the Navigator students can work on it during the
lesson and I can automatically retrieve the student’s
versions at the end of the lesson.
This means I am planning tasks very differently
to ensure that the technology will enhance the
teaching and learning process within my classroom.
I have used the “quick poll” facility very frequently
and it has created many opportunities for
discussion, allowing students to appreciate
other’s results. A recent example was with a top
set Y11: “Find 2 numbers which when squared
give a sum of 25”. All the results were displayed
and some interesting thoughts of negatives and
zeros were discussed. This was followed by my
sending out a small tns fi le consisting of a simple
pre-labelled spreadsheet and a graphs page.
After they had put in as many results as they
could think of it was time to project their screens.
“What have we got on page 1.2?” “Circles?”
“Why do some appear more fi lled in?”
“What can you tell me about the circle?”
The system has transformed the way in which
I use TI-Nspire. The ease of transferring data/fi les
means I am much more willing to put together a fi le
where the students are engrossed in the mathematical
content straight away. Issues of technical know-how
have now taken a back seat and the beauty of the
maths is much more apparent.
Wires? What wires?
If you would like a demonstration of the system
or would like to arrange professional development
from T3, please send an email to [email protected].
12 *sight
In this article Adrian Oldknow describes how the
classic geometry problem of “squaring the circle”
can be approached using TI-Nspire. In the fi rst part of
the article he shows how to fi nd a good approximation
to the squared circle, leading directly to an approximation
for π. Another approximation technique for calculating the
area of a circle is then explored.
A geometry problem studied by the ancient Greeks
was how to construct a square of exactly the
same area as a given circle. Nowadays we know
that this is an impossible task. However, it is a
myth that the Greek geometers only used abstract
methods. Archimedes, in particular, was a very
practical person, and he worked out many very good
approximate methods. In order to test whether the
area of one shape was greater or less than another
he would make accurate drawings, cut them out
from the same material and use a pair of balances
to compare their weights, and hence their areas.
Nowadays we can use computer software to calculate
areas for us, at least approximately. We can fi nd a good
approximation to the squared circle and the coloured
picture above gives the basic idea. In that diagram,
the green circle lies snugly within the largest square
shown, and the smallest square fi ts snugly inside the
circle. So there must be a square between these two
squares which has area equal to that of the circle. The
regions coloured red are the bits of the square that
are not inside the circle, and those coloured yellow are
the bits of the circle that are not inside the square. So
our aim is to adjust the middle sized square to make
the red and yellow areas as equal as possible. We can
then use the square to approximate π.
Below is an outline method for setting this up on
the TI-Nspire handheld. The named points are for
reference in this article but there is no need to enter
them on the screen unless you wish to do so.
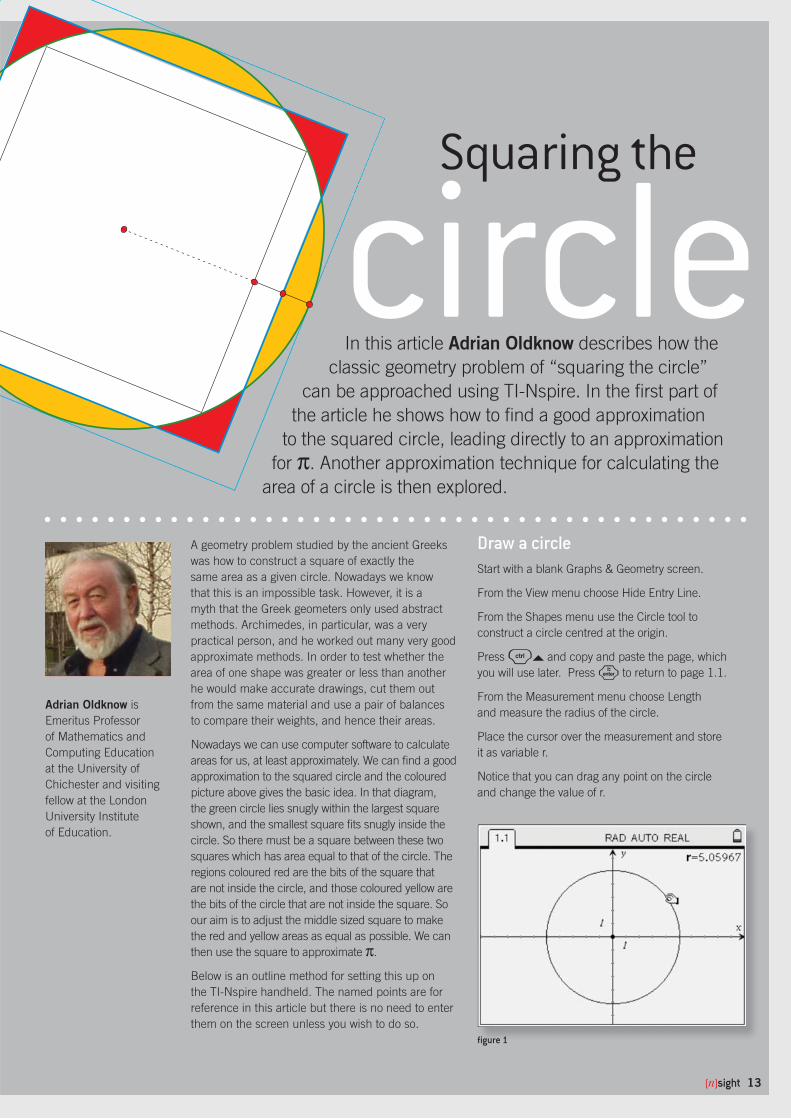
Draw a circleStart with a blank Graphs & Geometry screen.
From the View menu choose Hide Entry Line.
From the Shapes menu use the Circle tool to
construct a circle centred at the origin.
Press /` and copy and paste the page, which
you will use later. Press · to return to page 1.1.
From the Measurement menu choose Length
and measure the radius of the circle.
Place the cursor over the measurement and store
it as variable r.
Notice that you can drag any point on the circle
and change the value of r.
Adrian Oldknow is
Emeritus Professor
of Mathematics and
Computing Education
at the University of
Chichester and visiting
fellow at the London
University Institute
of Education.
Squaring the
circle
fi gure 1
*sight 13
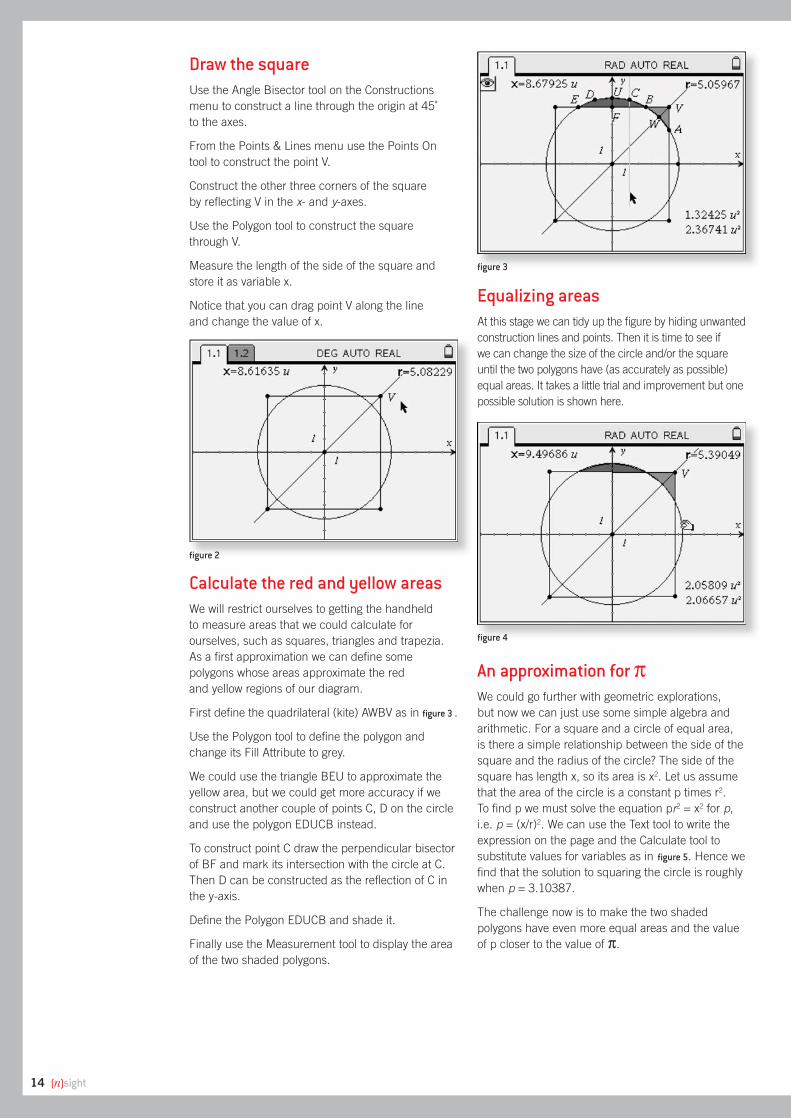
Draw the squareUse the Angle Bisector tool on the Constructions
menu to construct a line through the origin at 45˚
to the axes.
From the Points & Lines menu use the Points On
tool to construct the point V.
Construct the other three corners of the square
by refl ecting V in the x- and y-axes.
Use the Polygon tool to construct the square
through V.
Measure the length of the side of the square and
store it as variable x.
Notice that you can drag point V along the line
and change the value of x.
Equalizing areasAt this stage we can tidy up the fi gure by hiding unwanted
construction lines and points. Then it is time to see if
we can change the size of the circle and/or the square
until the two polygons have (as accurately as possible)
equal areas. It takes a little trial and improvement but one
possible solution is shown here.
Calculate the red and yellow areasWe will restrict ourselves to getting the handheld
to measure areas that we could calculate for
ourselves, such as squares, triangles and trapezia.
As a fi rst approximation we can defi ne some
polygons whose areas approximate the red
and yellow regions of our diagram.
First defi ne the quadrilateral (kite) AWBV as in fi gure 3 .
Use the Polygon tool to defi ne the polygon and
change its Fill Attribute to grey.
We could use the triangle BEU to approximate the
yellow area, but we could get more accuracy if we
construct another couple of points C, D on the circle
and use the polygon EDUCB instead.
To construct point C draw the perpendicular bisector
of BF and mark its intersection with the circle at C.
Then D can be constructed as the refl ection of C in
the y-axis.
Defi ne the Polygon EDUCB and shade it.
Finally use the Measurement tool to display the area
of the two shaded polygons.
An approximation for πWe could go further with geometric explorations,
but now we can just use some simple algebra and
arithmetic. For a square and a circle of equal area,
is there a simple relationship between the side of the
square and the radius of the circle? The side of the
square has length x, so its area is x2. Let us assume
that the area of the circle is a constant p times r2.
To fi nd p we must solve the equation pr2 = x2 for p,
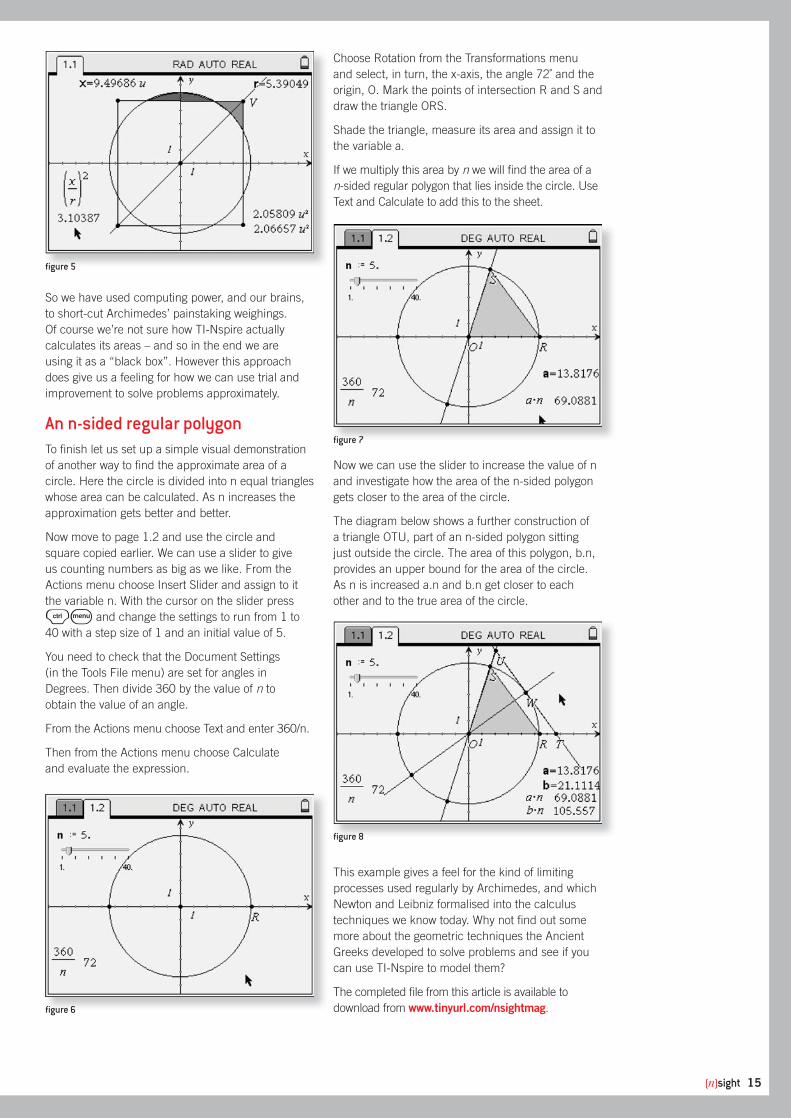
i.e. p = (x/r)2. We can use the Text tool to write the
expression on the page and the Calculate tool to
substitute values for variables as in fi gure 5. Hence we
fi nd that the solution to squaring the circle is roughly
when p = 3.10387.
The challenge now is to make the two shaded
polygons have even more equal areas and the value
of p closer to the value of π.
fi gure 2
fi gure 3
fi gure 4
14 *sight
So we have used computing power, and our brains,
to short-cut Archimedes’ painstaking weighings.
Of course we’re not sure how TI-Nspire actually
calculates its areas – and so in the end we are
using it as a “black box”. However this approach
does give us a feeling for how we can use trial and
improvement to solve problems approximately.
An n-sided regular polygonTo fi nish let us set up a simple visual demonstration
of another way to fi nd the approximate area of a
circle. Here the circle is divided into n equal triangles
whose area can be calculated. As n increases the
approximation gets better and better.
Now move to page 1.2 and use the circle and
square copied earlier. We can use a slider to give
us counting numbers as big as we like. From the
Actions menu choose Insert Slider and assign to it
the variable n. With the cursor on the slider press
/b and change the settings to run from 1 to
40 with a step size of 1 and an initial value of 5.
You need to check that the Document Settings
(in the Tools File menu) are set for angles in
Degrees. Then divide 360 by the value of n to
obtain the value of an angle.
From the Actions menu choose Text and enter 360/n.
Then from the Actions menu choose Calculate
and evaluate the expression.
Now we can use the slider to increase the value of n
and investigate how the area of the n-sided polygon
gets closer to the area of the circle.
The diagram below shows a further construction of
a triangle OTU, part of an n-sided polygon sitting
just outside the circle. The area of this polygon, b.n,
provides an upper bound for the area of the circle.
As n is increased a.n and b.n get closer to each
other and to the true area of the circle.
This example gives a feel for the kind of limiting
processes used regularly by Archimedes, and which
Newton and Leibniz formalised into the calculus
techniques we know today. Why not fi nd out some
more about the geometric techniques the Ancient
Greeks developed to solve problems and see if you
can use TI-Nspire to model them?
The completed fi le from this article is available to
download from www.tinyurl.com/nsightmag.
Choose Rotation from the Transformations menu
and select, in turn, the x-axis, the angle 72˚ and the
origin, O. Mark the points of intersection R and S and
draw the triangle ORS.
Shade the triangle, measure its area and assign it to
the variable a.
If we multiply this area by n we will fi nd the area of a
n-sided regular polygon that lies inside the circle. Use
Text and Calculate to add this to the sheet.
fi gure 5
fi gure 6
fi gure 7
fi gure 8
*sight 15
You can’t tell this book by its cover!
What TI technology is available?Our range of technology for schools
includes software and handheld
devices designed specifi cally for
education, classroom networking tools,
graphics calculators and a variety of
sensors and probes for data logging
activities (to meet the STEM agenda).
Our software is designed to integrate
with existing classroom projection
systems to enhance the learning and
teaching experience.
• TI-Nspire™ – the award-winning
handheld and software ICT
platform for maths and science
with additional options:
• Teacher Edition Software - includes
an emulator of the TI-Nspire handheld
and enhanced functionality
• TI-Nspire Navigator™ System - the
wireless classroom network for TI-Nspire
• TI Connect-to-Class™ - document and
fi le sharing for TI-Nspire handhelds
• The TI-84 Plus™ and TI-83 Plus™
family of graphics calculators
• TI-SmartView™ - the software emulator
of the TI-84 Plus graphics calculator
• CBL 2™, CBR 2™, EasyTemp™ and
EasyData™ with support for more than
30 probes and sensors.
• Cabri Junior and a host of other APPS
available on the TI-84 handheld device
• TI-Nspire CAS, TI-89 Titanium and
Voyage™ 200, our CAS (Computer
Algebra Software) solutions.
TI Technology Loan – to support evaluation of our technology
and your CPD activities.
Using our free loan service, you can fi nd
out more about how TI technology can
enhance your pupils’ learning. It’s an ideal
way for you to get TI products for teacher
workshops and in-service training or to
borrow individual handhelds for class
evaluation. Loans are available for up
to three weeks.
What services do we offer?
T3 (Teachers Teaching with Technology™)T3 has delivered professional development
for mathematics and science teachers since
1992. T3 trainers are practising teachers
with experience and depth of knowledge
in subject teaching and learning who
aim to promote the appropriate use of
technology in the classroom by providing
CPD that helps teachers to develop effective
practices through pedagogy and technical
confi dence. The courses they run place
the emphasis on sharing good use of ICT
in the classroom. T3 offers opportunities
for teachers to get together with others
to explore teaching and learning with
TI Technology.
In addition to offering a range of CPD
opportunities, T3 members also support
research and pilot projects, author books
and create and share a wide range of
activities on topics for secondary level and
above. T3 is an international organisation and
sponsorship from Texas Instruments enables
T3 to deliver free courses and materials.
For further details, including dates and
venues, please visit www.tcubed.org.uk or
email [email protected].
Volume Purchase Programme– free TI technology for volume purchases
through our educational suppliers.
With every purchase of a TI-Nspire
handheld device or graphics calculator,
you could obtain free TI technology –
from as little as purchases of 20 devices.
For more information, visit education.ti.com/uk
All handheld devices available in Europe are manufactured under ISO 9000 certifi cation. Cabri Log II is a trademark of Université Joseph Fourier. All trademarks are the property of their respective owners. Texas Instruments reserves the right to make changes to products, specifi cations, services and programs without notice. Whilst Texas Instruments and its agents try to ensure the validity of comments and statements in this publication, no liability will be accepted under any circumstances for inaccuracy of content, or articles or claims made by contributors. The opinion published herein are not necessarily those of Texas Instruments.
©2009 Texas Instruments
Available from Chartwell-Yorke
(www.cymaths.co.uk), £29.
You know that new technology has
really arrived when book publishers start
producing support materials – remember
all the books devoted to learning
mathematics with the TI-83 and TI-84
calculators? The US publisher Key
Curriculum Press seems to be fi rst off the
mark for the TI-Nspire with a collection
of 30 activities consisting of handouts,
teacher notes and tns documents. The title,
“Exploring Algebra 1”, may turn off some
UK teachers but this would be a shame
because the content of this book is certainly
not exclusive to the US curriculum.
There are some really interesting ideas
here that could be very useful in UK
classrooms. Many of the activities start
with data collected from the real world
and help students analyse it using the
TI-Nspire’s powerful graphing and statistics
facilities. Some of these data sets can
be collected by students themselves
(e.g. pencil rolling, pulse rates, paper
folding). Others are provided in the tns fi les
(e.g. high-jump records, life expectancies
and geographical data).
However, actually using the student
handouts as they stand may present
problems, because it was written for the
2007 version of TI-Nspire. Since then
commands and menus have changed,
so that some of the instructions are no
longer valid. There are also some contexts
(e.g. proportion of military veterans in
various States) and use of language
(e.g. “you still had to eyeball the slope”)
that do not transfer readily to this side of
the Atlantic. Nevertheless there are some
great ideas that you could use to create
your own handouts.


![Crop Circles[1]](https://img.dokumen.tips/doc/110x75/5559a793d8b42a5b2a8b4d0e/crop-circles1.jpg)