Embed Size (px)
Citation preview

IN THEIROWN RIGHT
THE ALAN GUTTMACHER INSTITUTE
ADDRESSING THE SEXUAL AND REPRODUCTIVE HEALTH NEEDS OF AMERICAN MEN

ADDRESSING THE SEXUAL AND REPRODUCTIVE HEALTH NEEDS
OF AMERICAN MEN
IN THEIR OWN RIGHT
THE ALAN GUTTMACHER INSTITUTE

ACKNOWLEDGMENTS
The successful completion of this report, In Their
Own Right: Addressing the Sexual and Reproductive
Health Needs of American Men, has hinged upon
the efforts of many staff of The Alan Guttmacher
Institute (AGI), as well as the assistance and
research findings of a large number of individuals
and organizations outside of AGI. Susheela Singh,
director of research, and Akinrinola Bankole,
senior research associate, oversaw the develop-
ment of this report. Akinrinola Bankole, Lawrence
B. Finer, assistant director of research, and Rachel
Jones and David J. Landry, senior research associ-
ates, conducted analyses and prepared initial
reports on findings. Erin Carbone, research associ-
ate, provided research support throughout the proj-
ect; Suzette Audam provided data processing sup-
port; and Lori Gerstein, Michele Norris and
Ednesha Saulsbury provided research assistance.
The assistance and advice of other AGI staff
were invaluable: Sara Seims, Jacqueline E.
Darroch, Cory L. Richards, Beth Fredrick, Marc
Levin and Jennifer Nadeau helped to shape the
report and intensively reviewed drafts.
Deirdre Wulf, independent consultant, wrote
the report, which was edited by Dore Hollander,
assistant director for special publications. Patricia
Donovan, director of publications, coordinated the
publication of the report. Kathleen Randall,
Michael Greelish and Judith Rothman were
responsible for production. Kaylynn Chiarello
provided editorial assistance.
AGI is indebted to the following colleagues,
who participated in the expert advisory meeting or
reviewed an earlier draft of this report: Christine
Bachrach, Demographic and Behavioral Sciences
Branch, National Institutes of Health/National
Institute of Child Health and Human
Development; Peter Bearman, Columbia
University; Robert Becker, Planned Parenthood of
New York City; David Bell, Community Health and
Education Program, Columbia University; Claire
Brindis, Center for Reproductive Health Policy
Research, University of California, San Francisco;
Sarah Brown, The National Campaign to Prevent
Teen Pregnancy; Larry Bumpass, University of
Wisconsin–Madison; Sam Clark, Program for
Appropriate Technology in Health; Mark Cohan,
University of Florida; Barbara Cohen, Office of
Population Affairs, Department of Health and
Human Services; Margaret Greene, Population
Action International; Wade Horn, National
Fatherhood Initiative; Ivan Juzang, MEE
(Motivational Educational Entertainment)
Productions; Michael Kimmel, State University of
New York, Stony Brook; Laura Duberstein
Lindberg, Urban Institute; William Marsiglio,
University of Florida; Robert Michael, University
of Chicago; Jennifer Morgan, University of
Pennsylvania; Nadine Peacock, University of
Illinois School of Public Health; Joseph Pleck,
University of Illinois at Urbana–Champaign; Peter
Purdy, U.S. Committee for the United Nations
Population Fund; Michael Resnick, University of
Minnesota–Twin Cities; John Rich, Boston Public
Health Commission; Hector Sanchez-Flores,
University of California, San Francisco; Koray
Tanfer, Battelle Center for Public Health Research
and Evaluation; Elizabeth Thomson, University of
Wisconsin–Madison; Mary Nell Wegner,
EngenderHealth; and Brian Wilcox, Center on
Children, Families and the Law, University of
Nebraska–Lincoln.
We want to thank The Bill & Melinda Gates
Foundation for generously supporting this
investigation. Its support will also make it possible
for AGI to extend this research beyond the United
States to explore issues related to the sexual and
reproductive health needs of men worldwide.

Executive Summary 4
Chapter 1 The Importance and Implications of Men’s Sexual and Reproductive Behavior 6
Chapter 2 Men 15–19: Initiating Sexual Relationships 14
Chapter 3 Men 20–29: Settling Down 26
Chapter 4 Men 30–49: Forming Families 38
Chapter 5 Sexually Transmitted Diseases andCondom Use 50
Chapter 6 Sexual and Reproductive Health Information and Services for Men 58
Chapter 7 Summing Up 68
References and Notes 74
Appendix: State-Level Measures 80
Tables 82
TABLE OFCONTENTS

EXECUTIVE SUMMARY
In Their Own Right The Alan Guttmacher Institute
Summ
ary
45
Chapter 1: The Importance and Implications ofMen’s Sexual and Reproductive Behavior
In recent years, awareness has grown of the need to
address the sexual and reproductive behaviors and health
of men. This recognition reflects the advent of HIV and
the critical role of condom use in preventing sexually
transmitted diseases (STDs), concerns about the role of
men in teenage pregnancies and births, and the failure
of many divorced and unmarried fathers to fulfill their
parental responsibilities. The result has been programs’
efforts to bring men—particularly the partners of women
clients—into the existing reproductive health system.
Still, the sexual and reproductive health needs of
men in their own right—as individuals and not simply as
women’s partners—have been largely ignored. The fami-
ly planning, public health and contraceptive research
communities have learned to regard and treat women as
individuals, not just wives and mothers. It is time to do
the same for men: to recognize that their reproductive
health is, above all, about their own well-being and their
ability to engage in healthy, fulfilling sexual relationships.
In Their Own Right: Addressing the Sexual and
Reproductive Health Needs of American Men aims to
take some initial steps in that direction by providing an
overview of some fundamental patterns in men’s sexual
and reproductive lives, and their implications for policy
and programs. It focuses on men 15–49 years old,
because during these years, men typically pass the main
sexual and reproductive milestones, from the initiation
of sexual activity to marriage and fatherhood. And it
underscores both gaps in what is known and obstacles
to serving men effectively. This summary presents some
of the report’s key findings.
Chapter 2: Men 15–19: Initiating Sexual Relationships
Adolescence—the transition between childhood and
adulthood—is a time of promise for most young men, a
stage at which they want to discover and establish an
identity independent of their family. And often, the
heart of discovering who they are involves young men’s
exploration of romantic and sexual relationships.
However, there is great variation in when and how safely
teenage men experience the transition to sexual activity.
Fewer than one-quarter of American men are sexually
experienced by age 15, but nine in 10 have intercourse
before their 20th birthday.
Poor and minority youth initiate intercourse some-
what earlier than more affluent and white teenagers.
Slightly more than two in 10 sexually experienced
men have had only one partner by their late teens, and
about three in 10 have had six or more.
Sexual activity in adolescence is often sporadic, and
many relationships do not last very long.
Most men use a condom the first time they have
intercourse, but condom use subsequently declines and
reliance on female methods increases.
Very few adolescent men are married, and only 3%
are fathers. Only 7% of births each year involve teenage
men.
Six in 10 pregnancies involving teenage fathers end
in a birth; four in 10 end in an abortion. Thirteen per-
cent of abortions each year involve teenage men.
Chapter 3: Men 20–29: Settling Down
In their 20s, many men first establish an independent
place in society. Often, they have completed their educa-
tion, started working full-time and set up their own
households, frequently in the context of marriage or a
cohabiting relationship. Nevertheless, many have not yet
assumed responsibility for families of their own.
Twenty-seven percent of men in their early 20s are
married or cohabiting, but this proportion doubles by
the late 20s.
Black men are much less likely than white or
Hispanic men to marry in their 20s, and poor black men
are half as likely as better-off black men to do so.
Condom use is more common among men not in a
union than among those who are cohabiting or married. It
is therefore not surprising that men in their early 20s are
more likely than those in their late 20s to use condoms.
One-quarter of men have fathered a child by age 25,
and one-half have done so by age 30. Minority men
and those with the lowest incomes and least education
are the most likely to become fathers in their 20s.

Men in their 20s account for about half of births and
half of abortions in the United States each year.
Roughly eight in 10 births involving men in their
early 20s, and half of those involving men in their late
20s, are nonmarital.
Chapter 4: Men 30–49: Forming Families
Most men in the 30s and 40s have married and
become fathers. However, because of separation,
divorce, nonmarital childbearing and children’s starting
to leave home, some men who have had children are
not living with them.
Seven in 10 men in their 30s and eight in 10 of
those in their 40s are married or living with a woman.
In their 30s and 40s, poor men are the least likely to
be married and the most likely to be separated or
divorced.
During their 30s and 40s, men’s use of condoms for
contraception declines, and their reliance on male and
female sterilization grows.
By age 49, the average man has had about two chil-
dren. In addition, many men are fathers to stepchildren,
adopted children or foster children.
Men in their 30s and 40s account for 44% of births
and 34% of abortions each year. The number of men
who father children after age 49 is very small.
Eleven percent of men in their 30s have biological
children but do not live with them.
Chapter 5: Sexually Transmitted Diseases andCondom Use
The personal, societal and economic costs of STDs are
enormous and growing. The spread of these diseases is
determined partly by the level of infection within a com-
munity, the ability of infected individuals to obtain
treatment and the prevailing patterns of sexual behavior.
Eight in 10 adults living with AIDS in the United
States are men. More than one in 10 men who had
AIDS diagnosed in 1999 were exposed to HIV through
heterosexual activity.
Reported rates of chlamydia and gonorrhea reach
500–600 per 100,000 men in their early 20s, levels that
are much higher than those of men in their 30s or older.
Compared with white and Hispanic men, black men
have twice as high a level of infection with herpes, and
probably have several times the rates of bacterial STDs.
Nine in 10 men have heard of HIV, AIDS, gonorrhea
and syphilis, but far fewer know about genital warts and
are aware that chlamydia can infect men. Men’s knowl-
edge of effective measures for preventing STDs is sketchy.
Half of men who use condoms do so for birth control,
not STD protection.
Chapter 6: Sexual and Reproductive Health Informationand Services for Men
From adolescence on, most men need information and
counseling about sexual and reproductive matters, and
they need somewhere reliable to go for related educa-
tion and health care.
There is no commonly agreed upon definition of sex-
ual and reproductive health care for men, and many
barriers impede the provision of such care.
Obstacles to care include the tendency of many men
not to seek regular, routine checkups; the fact that
health insurance often does not cover the services men
need; and the high proportions of men—particularly
poor men—who do not have health insurance.
Few health professionals are specifically trained to
provide men with sexual and reproductive health educa-
tion and services.
The older men get, the more likely they are to need
medical sexual and reproductive health services rather
than information.
At all ages, sexually active men, particularly those
who do not use a condom and have multiple partners,
need regular screening for STDs.
Chapter 7: Summing Up
It is essential to recognize the sexual and reproductive
health care needs of American men and to increase
their access to services addressing those needs, includ-
ing counseling, educational and medical services.
Movement toward a more holistic and broad-based
approach to sexual and reproductive health care for men
should enhance their well-being, equip them to make
responsible decisions, result in lower levels of STDs and
unintended childbearing, and help make men better
fathers. Thus, what is increasingly seen as good for men
in their own right should turn out to be just as good for
women—to the benefit of men and women as individu-
als, couples, families and society as a whole.

In Their Own Right The Alan Guttmacher Institute
Chapter 1
67
Chapter 1
The Importance and Implications of Men’s Sexual and Reproductive Behavior

“The sexual and reproductive health needs of men in their own right, asindividuals, have been largely ignored.”
Although sex and reproduction involve both men
and women, until recently, women’s health care
needs in these areas received by far the greater
share of attention. The reasons for this imbalance
are obvious and largely understandable. Only
women become pregnant and bear children, and
safe pregnancies and the healthiest possible out-
comes are essential to the well-being of women,
children and families. Equally important, the
advent of technologies and services that enable
women to plan pregnancies, and to experience the
pleasure of sexual intercourse without the fear of
unintended pregnancy, has been a historic and
liberating development in their lives.
Men have always been freer than women to
separate sexual pleasure from reproductive out-
comes, with relatively little attention to the conse-
quences of their behavior. In recent years, howev-
er, the sexual and reproductive roles of men have
received increased public scrutiny,1 as health pro-
fessionals and advocates concerned with women’s
sexual and reproductive health have become
aware of the need to address the behaviors and
health of their male partners as well.
In part, this recognition reflects the advent of
HIV and the growing awareness of the critical role
that men’s condom use plays in the prevention of
sexually transmitted diseases (STDs). It also may
reflect increased concerns about teenage pregnan-
cies and births, especially those involving older
men, and the failure of large numbers of divorced
and unmarried fathers to fulfill their child support
obligations and other parental responsibilities.
At the program level, efforts are under way to
bring men—particularly the partners of women
clients—into the existing family planning and
reproductive health care system by offering them
contraceptives, testing and treatment for STDs,
and other services. Supporters of this approach
reason that healthy and well-informed men are
the most likely to be responsible sexual partners
and good fathers.
Still, the sexual and reproductive health needs
of men in their own right, as individuals, have
been largely ignored. The family planning, public
health and contraceptive research communities
have finally learned to regard and treat women as
individuals, not just wives and mothers. It is time
to do the same for men. This report aims to take
some initial steps in that direction by providing an
overview of American men’s sexual and reproduc-
tive behavior, drawing out the health and program
implications of that information, and underscoring
both gaps in what is known and obstacles to serv-
ing men more effectively.
This kind of effort is long overdue for a number
of reasons. For decades in the United States, sex-
ual initiation has been taking place earlier, and
marriage later; the result is that young men (as
well as young women) have a lengthy period of
sexual activity before marriage. High divorce rates
have created large numbers of midlife bachelors,
many of whom are ill equipped to take up new
roles under social and sexual conditions that have
changed dramatically since they were adolescents.
Society now expects men to be more directly
involved in the care and upbringing of their
children than they were in the past, and men
themselves seem to welcome a more active role.
Yet more and more children are being born to
couples who are not married and who may not live
together. How men manage these challenges is
critical for their emotional and physical well-
being—and for the well-being of their partners
and families.
There Are Many Obstacles to AddressingMen’s Needs
Several stumbling blocks stand in the way of
addressing men’s needs:
Some observers continue to perceive men as
basically irresponsible, or to believe that involving
them in sexual and reproductive health programs
can achieve no useful end.

Some health care providers are reluctant to
offer services to men—because they lack interest,
because appropriately trained staff are not avail-
able, or because they are concerned that services
for men might divert resources from services for
women (especially poor women) and compromise
the quality and availability of care.
In a vicious circle, the lack of information on
male sexual and reproductive health needs and
inadequate medical training in this area have con-
tributed to significant gaps in financing for these
services.
Standards of reproductive health care have
been developed for women, but no consensus yet
exists as to what constitutes good sexual and
reproductive health care for men.
Men have fewer purely medical reproductive
health needs than women do, but historically,
family planning and reproductive health programs
have been overwhelmingly medical in nature.
Another perspective, however, is that investing
resources in providing information and services for
men need not jeopardize the availability of servic-
es for women. Addressing the sexual and repro-
ductive health needs of men in their own right
will ultimately benefit not just men, but also
women and families. What is more, men’s repro-
ductive health needs typically require less expen-
sive medical care than do women’s. And recogniz-
ing the importance for men of nonmedical care—
including information and counseling on topics
such as sexual pleasure and its relationship to
contraceptive use, and effective communication
and negotiation within relationships—promises to
broaden the scope of services available to women
as well as men. Rather than redirecting scarce
resources away from the provision of care to
women, addressing the sexual and reproductive
Men and women experience important sexual andreproductive events at similar ages.
CHART 1.1
SOURCE: TABLE 1.1, PAGE 82.
In Their Own Right The Alan Guttmacher Institute
Chapter 1
89
12.6
17.4
25.1
26.0
30.9
26.7
FIR
ST I
NTE
RC
OU
RSE
FIR
ST M
ARR
IAG
E
FIR
ST B
IRTH
INTE
ND
NO
MO
RE
CH
ILD
REN
MEN
ARC
HE
FIR
ST M
ARR
IAG
E
FIR
ST I
NTE
RC
OU
RSE
FIR
ST B
IRTH
INTE
ND
NO
MO
RE
CH
ILD
REN
SPER
MAR
CH
E14
.0
16.9
28.5
33.2
1 0 5 03 02 0 4 01 5 2 5 3 5 4 5AGE
M E N
W O M E N

needs of America’s men may well result in more
comprehensive care for women, as well as
stronger relationships among healthier partners.
Between Ages 15 and 49, Men Typically Experience a Number of Sexual and Reproductive Milestones
This report uses a life-stages framework to follow
the lives of U.S. men between the ages of 15 and
49—the years of greatest importance for men’s
sexual and reproductive behavior.2 During this 35-
year period, men experience puberty (marked by
the onset of sperm production), have intercourse
for the first time, marry for the first time, become
fathers and then see the end of childbearing
(Chart 1.1). Many men also experience separation,
divorce and remarriage during these years, and
some become widowed. At each stage, men are
likely to need specific types of information and, in
some cases, specialized kinds of health care.
By age 14, half of young men have entered
puberty. Are they prepared for this transition,
marking the end of childhood and the threshold
of adolescence? Shortly before their 17th birth-
day, half of men have experienced sexual inter-
course for the first time. Do they have the infor-
mation and guidance that will make this a safe
and pleasurable experience for themselves and
their partners? By age 27, half of American men
have married for the first time. Have they
acquired the communication skills necessary for a
strong relationship?
The timing of these last two transitions reveals
a crucial fact: Between first intercourse and first
marriage, the typical American man spends around
10 years being single but sexually active—making
this an extremely important period in terms of the
need for effective protection against STDs and
unwanted pregnancies and births.
By their 29th birthday, half of all U.S. men
have become fathers for the first time. Do these
men have the information and advice they need to
prepare them for this important role? By age 33,
five in 10 men say they do not want any more
children. Do they have the knowledge and servic-
es that will enable them to prevent further preg-
nancies for the rest of their sexually active lives?
Clearly, people rarely fit into frameworks. Men
may begin their sexual lives by age 15 or younger,
have children before they marry, never marry or
form new families well beyond their 40s.
Nevertheless, the life-stages framework provides a
structure that underscores the implications of
men’s changing sexual and reproductive lives for
their changing information and service needs.
Men’s Sexual and Reproductive Behavior IsInfluenced by Their Background
The pace and direction of men’s progression from
adolescence to adulthood are shaped—and some-
times limited—not just by their age or life stage,
but also by their racial and ethnic background
and their socioeconomic and marital status (see
box, page 10). American men are diverse in these
key respects (Chart 1.2, page 11).3
White men are much less likely than minority
men to be poor (Chart 1.3, page 12) and to have a
low level of education.4 As a result, the effects of
race and ethnicity in American society are often
difficult to disentangle from those of socioeconom-
ic status.5 This complicates any attempt to assess
how each factor is independently associated with
variations in men’s sexual and reproductive lives.
Further complicating our understanding of the role
of socioeconomic disadvantage in the sexual and
reproductive behaviors of differing racial and eth-
nic groups is the continuing existence of deep-
rooted forms of racial discrimination.
Men’s sexual and reproductive behavior is also
strongly affected by whether they are single,
cohabiting, married, divorced or separated.
Accordingly, union status is another factor used to
help describe variations in men’s sexual and
reproductive behaviors, although it may be associ-
ated with socioeconomic status.
Other factors, too, likely account for variations
in men’s sexual and reproductive attitudes and
behavior. Personal or community values and reli-
gious beliefs grounded in family or social group-
ings may play an influential role. Community val-
ues can be especially important in defining
acceptable patterns of behavior, or establishing
models of the kinds of relationships between men
In Their Own Right The Alan Guttmacher Institute
Chapter 1
1011
and women that are considered normal, respect-
able or worthy of emulation.
Indeed, numerous stereotypes of masculinity—
and of femininity—thrive in America, although
they may vary in different communities. Among
traits often considered typically masculine are
sexual prowess, physical strength, adventurous-
ness and stoicism. Less positively, men are often
accused of behaving insensitively in relationships,
of being sexual predators or being unwilling to
commit to long-term relationships, of resorting to
force when frustrated (see box on page 19) or of
being “deadbeat dads.” This report questions and
challenges many of those stereotypes.
The Report Follows Men from Adolescenceto Maturity
This report deals separately with men in three
successive age-groups: adolescents (15–19),
young adults (20–29) and mature adult men
(30–49). These age breakdowns do not exactly
coincide with the timing of the events shown in
Chart 1.1. But each represents at least one
important transition—to sexual initiation for most
men in adolescence, to cohabitation and marriage
for many men in their 20s, and to having and
raising children for the majority of men in their
30s and 40s. The choice of these age-groups is
also somewhat dictated by the specific age-groups
of men covered in the national surveys whose
findings form the basis for this report.
For issues not covered by surveys, the report
summarizes many other types of social science
research to help describe and explain the influ-
ences on men’s sexual and reproductive behavior.
Thus, it brings together for the first time data
obtained from a wide range of sources.
After examining the characteristics and behav-
iors of men in the selected age-groups (chapters
2–4), the report addresses issues that involve men
Marital and Union StatusData are presented on both current legal marital statusand current union status. When viewed according tomarital status, men are categorized as married;divorced, separated or widowed (often combined anddescribed as formerly married); or never-married. Unionstatus is a wider definition that also includes cohabita-tion, or living together; union status is obtained only bysome surveys. Cohabitation can overlap two of the mari-tal status categories, since cohabiting individuals canbe either never-married or formerly married.
Race and EthnicityGovernment agencies typically classify Americans intoone of five major racial and ethnic groups, each ofwhich encompasses quite diverse subgroups. Butbecause the sample sizes in national surveys are usual-ly not large enough to provide adequate representationof smaller groups, or of subgroups within categories,this report focuses only on the three largest groups:
non-Hispanic white, non-Hispanic black and Hispanic. In most analyses, men classified as Asian or PacificIslander or as Native American are combined with thewhite population.
Poverty StatusIn this report, men are classified as poor if their familyincome is less than 100% of the federal poverty level($16,450 for a family of four in 1998), low-income if it is100–199% of poverty, moderate-income if it is200–349% of poverty and better-off if it is 350% ofpoverty or higher. These categories were chosen for thefollowing reasons: The first two (comprising 10% and15% of American families, respectively) are often usedin determining eligibility of government benefits. Thesecond two (comprising 25% and 50% of families) allowa more detailed examination of the impact of incomethan would have been possible by combining them into asingle group.
CATEGORIZING MEN BY THEIR BACKGROUND CHARACTERISTICS

of all ages: STDs and condom use
(chapter 5); and the sexual and
reproductive health services men cur-
rently receive, as well as the services
that many experts believe they still
need (chapter 6). The report con-
cludes with a summary of the find-
ings and a discussion of their impli-
cations for policy and program efforts
and for future research (chapter 7).
While this report presents a mas-
sive amount of data, it does not pro-
vide a complete or definitive set of
findings; nor can it cover every impli-
cation for programs, public education
and future research. In addition, the
data have their limitations (see box,
page 13). The report does not address
the sexual and reproductive behavior
and health needs of three important
groups: men in prison and men who
live on military bases (both excluded
from national surveys, which typically
cover the civilian, noninstitutionalized
population), and men who have sex
with men (who are included in sur-
veys but not identified separately).
However, because the behavior of
incarcerated men and of men who
have sex with men has important
implications for sexual and reproduc-
tive health, some issues related to
these groups are discussed briefly on
pages 36 and 56, respectively.
This report is only a beginning. It
provides an exploratory overview of
some fundamental patterns in men’s
sexual and reproductive lives, and
their implications for policy and pro-
grams. Large gaps remain in what is
known, and much of the detailed and
in-depth information needed to bring
the outlines to life is still lacking. In
the meantime, however, it is not too
soon to consider and begin address-
ing the sexual and reproductive health
needs of men in their own right.
American men 15–49 have diverse socialand economic characteristics.
CHART 1.2
SOURCE: TABLE 1.2, PAGE 82.
6
1213
170
10
4644
P O O R
L O W - I N C O M E
M O D E R AT E -I N C O M E
B E T T E R - O F F
P O V E R T Y S T AT U S
M A R R I E D
S E P A R AT E D /D I V O R C E D /W I D O W E D
N E V E R - M A R R I E D
M A R I T A L S T AT U S
4
4631
31
M E N 1 8 - 1 9
10
49 16
25
6 8 . 9 M I L L I O N U . S . M E N 1 5 – 4 9
W H I T E
H I S P A N I C
B L A C K
A S I A N / P A C I F I CI S L A N D E R
R A C E / E T H N I C I T Y
N AT I V EA M E R I C A N

In the United States, race/ethnicity and poverty statusare closely related.
CHART 1.3
In Their Own Right The Alan Guttmacher Institute
Chapter 1
1213
57
612
25
4 8 . 3 M I L L I O N W H I T E M E N
27
20
30
23
8 . 8 M I L L I O N H I S P A N I C M E N
27
3517
21
8 . 4 M I L L I O N B L A C K M E N
29
3416
21
5 0 0 , 0 0 0 N AT I V E A M E R I C A N M E N
P O O R
L O W - I N C O M E
M O D E R AT E - I N C O M E
B E T T E R - O F F
P O V E R T Y S T AT U S , U . S . M E N 1 5 – 4 9
2 . 9 M I L L I O N A S I A N / P A C I F I C I S L A N D M E N
5115
24
10
SOURCE: TABLE 1.3, PAGE 82.

Principal Sources of InformationThe information presented in this report and in the state-level measures shown in the appendix (page 80) is derivedmainly from published reports of the following national surveys or unpublished tabulations by The Alan GuttmacherInstitute of the data files:
Current Population Survey (CPS): various years,1970–2000
National Survey of Families and Households (NSFH):1987–1988 (Wave 1) and 1992–1994 (Wave 2)
National Health and Social Life Survey (NHSLS): 1992National Survey of Adolescent Males (NSAM): 1995National Survey of Men (NSM): 1991National Ambulatory Medical Care Survey (NAMCS) and
National Hospital Ambulatory Medical Care Survey ofEmergency and Outpatient Departments (NHAMCS):1996–1998
National Survey of Family Growth (NSFG): 1995National Health and Nutrition Examination Survey
(NHANES): 1988–1994General Social Survey (GSS): various years, 1980–1998Survey of Inmates in State and Federal Correction
Facilities: 1997Survey of Inmates in Local Jails: 1996
Additional sources of information were published data fromthe Centers for Disease Control and Prevention (CDC),Bureau of the Census, Survey of Income and ProgramParticipation, and National Center for Health Statistics.
Data LimitationsThe data available on men’s sexual and reproductive healthare affected by certain limitations and data quality problems.
Men’s reporting on some aspects of their sexual behavior(for example, how early they initiated intercourse and theirnumber of sexual partners) may be overstated, but little evi-dence is available on the extent of overstatement. In addi-tion, men may use different strategies from women inreporting their number of partners (for example, approximat-ing and possibly rounding up). Furthermore, the sexual dou-ble standard may lead some men to exaggerate their numberof partners, while having the opposite influence on women.1
Some evidence illustrates that men (particularly those notliving with their children) underreport the number of chil-
dren they have fathered. For example, one study showsthat between one-third and one-half of men’s nonmaritalbirths and births within a previous marriage are not report-ed.2 Another finds that underrepresentation of men in thenational Panel Study of Income Dynamics accounted for asignificant proportion of men’s underreporting of their chil-dren, and that men’s nonreporting of their children fromprevious marriages was relatively low (around 15%).3
Because of these problems, this report draws on multiplesources for documenting the number of children men havefathered.
Patterns of contraceptive use reported by men and womenin different surveys differ for some understandable rea-sons. Men (and women) probably report their own use moreaccurately than they report their partner’s, and either part-ner may report use with an extramarital partner. In addi-tion, differences in the wording of questions across sur-veys can affect reporting.
The need to rely on multiple surveys resulted in unevencoverage and in some inconsistencies in the data present-ed, in terms of both substance and the periods for whichdata are available. For example, data on contraceptive usewere available for men 15–39 from two surveys (the 1995NSAM for men 15–19 and the 1991 NSM for men 20–39),but equivalent data are not available for men 40–49; formen in their 40s, only a measure of current condom usewas available, and only in the late 1990s, from the GSS.
Completeness of CoverageIn addition, the national surveys used here cover only thecivilian, noninstitutionalized population. Substantial num-bers of men are therefore omitted—in particular, men wholive on military bases and men who are in prison (each ofwhom account for 2% of men 15–49). The proportion omit-ted because they live on military bases is larger amongthose aged 18–29 (3%) than among those 30–49 (1%), andis somewhat larger among black men (2.4%) than amongall other racial and ethnic groups combined (1.5%). In thecase of the prison population, omission is larger for menaged 20–34 (3%) than for older men (2%), and larger forminority groups (7% of black men 15–49 and 3% ofHispanic men) than for white men (1%).
DATA SOURCES

Fewer than one-quarter of American menare sexually experienced by age 15, but ninein 10 have intercourse before their 20thbirthday.
Poor and minority youth initiate inter-course somewhat earlier than more affluentand white teenagers.
Slightly more than two in 10 sexuallyexperienced men have had only one partnerby their late teens, and about three in 10have had six or more.
Sexual activity in adolescence is oftensporadic, and many relationships do not lastvery long.
Most men use a condom the first time theyhave intercourse, but condom use subse-quently declines and reliance on femalemethods increases.
Very few adolescent men are married, andonly 3% are fathers. Only 7% of births eachyear involve teenage men.
Six in 10 pregnancies involving teenagefathers end in a birth; four in 10 end in anabortion. Thirteen percent of abortions eachyear involve teenage men.
Chapter 2
Men 15–19: Initiating SexualRelationships
In Their Own Right The Alan Guttmacher Institute
Chapter 2
1415
“The very heart of discovering who they are involves young men’s exploration ofromantic relationships, including the initiation of sexual relations.”
Adolescence—the transition between childhood
and adulthood—is a time of promise for most
young men. This is the period when many com-
plete high school, find jobs, leave home or begin
college. It is also a stage at which most young
men want to discover and establish an identity
independent of their family. And often, the very
heart of discovering who they are involves young
men’s exploration of romantic relationships,
including the initiation of sexual relations.
The promise and excitement of adolescence are
not equal for all young men. A young man’s ability
to pursue his dreams and shape his future
depends on the social and economic resources
available to him, his sense of himself, and
whether society views him as a potential asset or
burden to the community—all of which, in the
United States, may be related to his racial or eth-
nic background. Most of these same factors also
influence the degree to which he experiences the
transition to sexual activity safely.
In Adolescence, Men’s Lives Are DeterminedLargely by Their Family Background
Overall, two-thirds of 12–17-year-old men live
with two parents, and slightly fewer than one-third
live with one parent—overwhelmingly their moth-
er. The remainder live with another relative (pre-
dominantly their grandmother) or with someone
outside their family (Chart 2.1, page 16).1 Black
youth are far more likely than white and Hispanic
youngsters to live with their mother only (not
shown). Young people growing up in single-parent
or unstable families are at increased risk of
engaging in behaviors that may endanger their
physical and emotional health, such as excessive
alcohol or drug use, weapon carrying or fighting.2
Roughly one in seven men 18–24 have not
completed high school. Although the high school
completion rate has improved for both black and
white youth since the 1970s, it has not increased
for Hispanic youth; almost four in 10 Hispanic
young men have not graduated, compared with
two in 10 black and one in 10 white youth.3 The
employment and earnings prospects of young men
without a high school diploma are not promising,
given the decline in manufacturing jobs and the
growing demand for skilled workers in the U.S.
labor force.
One-third of teenage men are working and
going to school, and most of the rest are doing
one or the other (Chart 2.1). However, 5% are
doing neither, and this proportion rises to 12%
among those from poor families (not shown).4
One in three men aged 15–19 come from poor
or low-income families, one-quarter from moderate-
income families and the remainder from better-off
families. Poverty disproportionately affects minori-
ty teenagers: Thirty percent of Hispanic, 27% of
black and 9% of white men 15–19 are below the
official poverty level (not shown).5
A sizable proportion of adolescent men (one in
five) have no health insurance. Most men at this
age are covered by their parents’ plans, but since
18 is normally the cutoff age for inclusion in a
parental policy, older teenagers are slightly less
likely than those aged 15–17 to be covered (not
shown).6
Most Teenage Men Experiment Sexually
For the average American male, puberty starts
between the ages of 12 and 14, although some
males are in their late teens before signs become
evident.7 During puberty, boys usually develop
romantic and sexual interests in girls. Hanging out
in groups of friends of both sexes, especially away
from their parents, provides boys with a context in
which to explore and express these feelings. By
the time they are 17, 87% of young men say they
have had at least one romantic relationship.8
Roughly half of men 13–18 report that they
have ever masturbated.9 In surveys of male col-
lege students, 85–88% report having masturbat-
ed,10 but some researchers think that these pro-

Many adolescent men live with only one parent, are both going to school and working,come from poor or low-income families and have no health insurance.
CHART 2.1
In Their Own Right The Alan Guttmacher Institute
Chapter 2
1617
T W O P A R E N T S
M O T H E R O N LY
FAT H E R O N LY
O T H E R
66245
1825
15
L I V I N G A R R A N G E M E N T S *
P O V E R T Y S T AT U S
5
4633
P O O R
L O W - I N C O M E
M O D E R AT E - I N C O M E
B E T T E R - O F F
4220
67
1
H E A L T H I N S U R A N C E C O V E R A G E
M E D I C A I D
O T H E R G O V E R N M E N T
P R I VAT E
N O N E
12
1 0 . 2 M I L L I O N M E N 1 5 – 1 9
S C H O O L O N LY
S C H O O L A N D W O R K
W O R K O N LY
N O S C H O O L O R W O R K
S C H O O L / W O R K †
516
* B A S E D O N 1 2 – 1 7 - Y E A R - O L D S . † B A S E D O N 1 6 – 1 9 - Y E A R - O L D S .
SOURCE: TABLE 2.1, PAGE 82.

portions represent underestimates.11
In terms of noncoital activities between part-
ners, slightly more than half of 15–19-year-old
men in 1995 said they had been masturbated by
a female or had received oral sex. The proportion
does not differ by race or ethnicity, but is twice as
high among men aged 17–19 as among those
15–16; it is also significantly higher than the
level found in 1988.12
Among men aged 15–19 who have never had
vaginal intercourse, 67% report that they have
touched a woman’s breasts, 22% have been stim-
ulated to the point of orgasm, 18% have received
oral sex and 14% have given oral sex.13
Noncoital sexual practices among adolescents
might be on the rise in the United States, possibly
because of the increasing emphasis some conser-
vative groups place on abstaining from intercourse
until marriage, and because of young people’s
growing fear of AIDS and other sexually transmit-
ted diseases (STDs). According to anecdotal evi-
dence, some adolescents perceive noncoital sex as
“no big deal,” whereas many consider vaginal sex
“the real thing,” connoting true intimacy, and to
be reserved for a special relationship.14
Young men are more likely than young women
to equate some noncoital sexual experiences with
intercourse,15 which might help explain why
young men usually report having had more sexual
partners than young women do.16
The Timing of First Intercourse Variesfor Different Groups
Many adults believe that a very high proportion of
youth start having vaginal intercourse during their
early teens. This is not actually the case. About
one in five 15-year-olds have had intercourse with
a woman. However, around eight out of 10 young
men aged 19 have had intercourse at least
once—a proportion very similar to that of young
American women.17 Considerably higher propor-
tions of black than of white and Hispanic men
Most men begin sexual intercourse during their teenage years.CHART 2.2
SOURCE: TABLE 2.2, PAGE 83.
% W H O H AV E H A D I N T E R C O U R S E
B L A C K
H I S P A N I C
A L L
W H I T EC U R R E N T A G E
1 2 1 3 1 4 1 5 1 6 1 7 1 8 1 91 10
2 0
4 0
6 0
8 0
1 0 0

have intercourse in the early teenage years, but
the differential narrows by age 19 (Chart 2.2,
page 17).18 Interestingly, young men who have
had intercourse express a greater sense of control
over their lives than those who have not (the
reverse is true of young women).19
Young men from poor families are more likely
than those from better-off families to start their
sexual lives at a very early age: At age 15, 42%
and 23%, respectively, have had intercourse (not
shown). However, after age 17, the differentials
by poverty status are smaller than those by race
and ethnicity.20
One in five young men 15–19 (one in three if
they are poor, and one in eight if their mothers
have a college degree) say they first had inter-
course before they were 15.21 Reports from young
men that they first had intercourse when they were
14 or younger are perplexing and call for further
research. Who are their sexual partners? Is inter-
course at that age acceptable to both partners?
Might peer pressure or coercion ever be involved?
Some youth do experience coercion. While
fewer than 1% of men 18–49 report that their
first experience of intercourse was “forced,” 8%
say it was “not wanted,” though not forced.22
Five percent of males in grades 5–12 report hav-
ing been sexually abused, and half of these say
they told no one.23 In Massachusetts, 9% of male
high school students report that they have ever
had sexual contact against their will.24
Some young men probably exaggerate their sex-
ual accomplishments by claiming that they first
had intercourse earlier than they actually did, or
by reporting intercourse when only noncoital
activities took place. In fact, men of all ages tend
to overstate, and women to understate, the num-
ber of partners they have had.25 These patterns
are not surprising, given the widespread sexual
double standard still found in the United States
and most other societies.
Sexual initiation in adolescence is not a new
phenomenon among American men, although the
pace accelerated in the 1980s. In the 1970s,
about six in 10 men had had intercourse before
age 18. By 1988, this proportion had risen to
seven in 10.26 Between 1988 and 1995, the pro-
portion of teenage men with sexual experience
declined somewhat—but only among those who
were aged 15–17 (from 50% to 41%27) and
among white 15–19-year-olds (from 73% to
64%28). The drop is thought to be related to a
shift toward less-permissive attitudes about sex
(which is associated with growing religiosity) and
increased education about AIDS.29 However,
these influences do not appear to have affected
the behavior of black and Hispanic youth.
Adolescent men’s first partner typically is close
Many sexually experienced adolescent men have intercourse infrequently.TABLE 2a
SOURCE: REFERENCE 41.
In Their Own Right The Alan Guttmacher Institute
Chapter 2
1819
% WHO HAD INTERCOURSE, 1995
AGE EVER IN PAST IN PAST >10 TIMESYEAR* MONTH* IN PAST YEAR*
15–19 55 89 54 46
15–17 42 86 47 3618–19 75 91 61 56
*BASED ON THOSE WHO HAVE EVER HAD INTERCOURSE.

to their own age. About two-thirds of men 15–19
indicate that their first female partner was their
age or within one year of their age, and one in 10
report that she was two or more years younger.
But one in five young men—an unexpectedly high
proportion—say that their first sexual partner was
two or more years older.30
The Pace of Sexual Initiation Is Influenced byFamily and Community Characteristics
Many factors are related to the timing of young
men’s first intercourse. Sexually inexperienced
men 14–16 who do not expect to have inter-
course soon are characterized by different risk
behaviors, peer norms, parenting factors, and
school or religious involvement than their counter-
parts expecting to do so in the near future.31
Mothers’ educational level and attitudes toward
their children’s sexual behavior seem to play an
important role. Forty-four percent of 15–19-year-
old men whose mothers have a college degree
have ever had intercourse, compared with 60% of
those whose mothers did not complete high
school.32 If an adolescent thinks that his mother
disapproves strongly of young people’s having sex-
ual intercourse,33 or if there is a high level of
General violence and sexual violence against women aredirectly and indirectly related to men’s sexual andreproductive lives. Moreover, the context for sexual vio-lence is often domestic, and violence within the familyaffects many aspects of a couple’s sexual and child-bearing lives. While the focus here is on male violencedirected against women, it should be emphasized thatmales may also be the victims of sexual abuse, espe-cially in childhood and early youth (see page 18).
Male violence directed at women has complex roots,often involving social, cultural and event-related fac-tors.1 Sexual violence, in particular, is very difficult tomeasure accurately and is underreported in all parts ofthe world.2
In a 1996 survey sponsored jointly by the Centers forDisease Control and Prevention and the Department ofJustice, 15% of U.S. women 18 and older said they hadbeen raped, and 3% said they had been the victims ofattempted rape—for a total of 17.7 million women.Fifty-four percent of women who had been raped hadbeen younger than 18 at the time, and 22% had beenyounger than 12.3
Fifty-two percent of women 18 and older said theyhad ever been physically assaulted by men in otherways—they had been slapped, hit, pushed, shoved,
grabbed, hit with an object, beaten up, subjected toattempted chokings or drownings, kicked, bitten, orthreatened with a knife or a gun, or had had somethingthrown at them.4
About three-quarters of the men involved in rape orassault against women were intimates—current or for-mer husbands, cohabiting partners or boyfriends. Therest were friends or acquaintances, strangers and otherrelatives.5
White, black and Hispanic women have an equalchance of ever having been raped or assaulted.6
A survey in 14 states carried out in 1996–1997 foundthat 9% of women who had had a child in the previous2–6 months had been physically abused around the timeof their pregnancy. The probability was higher thanaverage for women whose pregnancies were mistimed(13%) or unwanted (15%), and for teenagers (19%),black women (14%), unmarried women (18%), Medicaidrecipients (21%) and women whose partners had notwanted the pregnancy (24%).7
Nine percent of women 15–24 whose first experienceof intercourse was before marriage reported in 1995that this experience was “forced.” Another 25% saidthat although the experience was voluntary, they hadnot actually wanted it to happen.8
MALE VIOLENCE AGAINST WOMEN

In Their Own Right The Alan Guttmacher Institute
Chapter 2
2021
connectedness between mother and child,34 first
sexual intercourse tends to be delayed.
Fathers’ attitudes can also be influential. Black
adolescents who believe that their fathers disap-
prove of teenage sex, whether or not they live with
their fathers, are more likely than others to delay
first intercourse.35 And young men from single-
parent families are more likely than those living
with two parents to begin their sexual careers at
an early age.36
Religious belief appears to influence the age at
which men first experience intercourse, but only
among younger adolescents. Young men 15–17
who say religion is not important in their lives are
slightly more likely than those for whom religion
is important to have had intercourse.37
Differences in the pace of sexual initiation by
racial and ethnic group have received a great deal
of attention from social scientists, but explana-
tions, particularly of the early sexual initiation of
black males, remain elusive.38 As we have seen,
minority youth are much more likely than white
youngsters to be disadvantaged in many areas of
their lives, and growing up in difficult economic
and family conditions affects not just young
men’s sexual behavior but other aspects of their
lives as well. Levels of risky behaviors of all kinds
(drug use, weapon carrying and fighting, as well
as early sexual intercourse) are disproportionately
high among minority adolescents, those living in
single-parent families and those from poor and
low-income families.39
There is insufficient knowledge to fully estab-
lish or understand the precise connections
between disadvantage and adolescent risk-taking.
However, much research shows that low income
CHART 2.3
SOURCE: TABLE 2.3, PAGE 83.
W H I T E
H I S P A N I C
B L A C K
M O D E R AT E - I N C O M E / B E T T E R - O F F
P O O R / L O W - I N C O M E
A L L
�
% O F S E X U A L LY E X P E R I E N C E D M E N 1 8 – 1 9
1
2 – 5
≥ 60 2 0 4 0 6 0 8 0 1 0 0
L I F E T I M E S E X U A LP A R T N E R S
By their late teenage years, just over two in 10 sexually experienced men have had only one partner, and almost three in 10have had six or more.

and the low expectations that often come from
growing up in poverty, difficulties in school, non-
intact families and the absence of strong parental
relationships all influence adolescents’ chances of
engaging in risky behavior.40
Sexual Relationships in AdolescenceAre Often Sporadic
Teenagers who have had intercourse do not neces-
sarily have sex frequently (Table 2a, page 18).
Nine in 10 young men who have ever had inter-
course did so at least once in the past year, but
only half did so in the past month.
Moreover, fewer than half of sexually
experienced men 15–19 (and about a
third of those 15–17) had intercourse
more than 10 times in the past year.
All sexually experienced adolescent
men tend to have intercourse more
frequently as they get older.41
Almost three in 10 sexually experi-
enced men 15–17 have had only one
lifetime partner, but two in 10 have
already had six or more. By age
18–19, the proportion who have had
only one lifetime partner declines to
just over two in 10, and the propor-
tion who have had six or more
increases to almost three in 10
(Chart 2.3). Hispanic and black men
aged 18–19 are less likely than their
white peers to have had only one
partner, and more likely to have had
six or more.42
Partly reflecting personal and
social factors that might contribute
to risk-taking in adolescence, an
association exists between alcohol
use and having multiple sexual part-
ners. Men aged 14–22 who in the
past 30 days have engaged in binge
drinking, ridden in a car with a
drunken driver or driven immediately
after drinking are more likely than
others to have had six or more part-
ners in the past year.43
Most of young men’s sexual relationships
appear to be sequential, not concurrent. Only
20% of sexually experienced teenage men report
having carried on more than one relationship at a
time in the previous year.44 Some of young men’s
sexual relationships probably last only a short
time, and some might be one-night stands.
Teenage Men Who Are Having Intercourse NeedProtection Against Unwanted Pregnancy and STDs
The pleasures of sexual relationships can be
reduced by the fear of two unwelcome outcomes:
Most adolescent men and their partners usecontraceptives, but their methodschange over time.
SOURCE: TABLE 2.4, PAGE 83.
M E T H O D
C O N D O M O N LY
W I T H D R AWA L F E M A L E M E T H O D S O N LY ‡
% O F M E N 1 5 – 1 9
0 2 0 1 0 04 0 6 0 8 0
C O N D O M P L U S O T H E R M E T H O D
*Based on those who are sexually experienced.†Based on those who have had intercourse in the past month.‡Pill, implant, injectable, IUD, female sterilization,
female condom, spermicide, douche, vaginal filmor periodic abstinence.
F I R S T I N T E R C O U R S E *
L A S T I N T E R C O U R S E †
CHART 2.4

unwanted pregnancy and infection with an STD.
For some adolescent men, the fear of pregnancy
is greater than the fear of STDs.45 The prevention
of either is somewhat problematic for young men
just starting to have intercourse. There are only
two highly effective male contraceptive methods
(the condom and vasectomy), and sterilization is
largely irrelevant for adolescents. And there is
only one method for men to use to avoid STD
infection (the condom). Regular and consistent
use of any method is complicated by the likeli-
hood that many teenage men will have
intercourse sporadically.
Nevertheless, at first intercourse, the
condom is far and away young men’s
favored choice. The first time adolescent
men have intercourse, 60% use a con-
dom by itself, 7% use a condom in com-
bination with a female method (dual
methods), 2% practice withdrawal and
4% rely on their partner’s method (Chart
2.4, page 21).46 One-quarter (27%)
have no protection of any kind. The very
high level of condom use at first inter-
course suggests that many young men
(and perhaps some women) anticipate
this event and have condoms on hand.
At adolescents’ most recent inter-
course, 40% used a condom by itself
and 2% practiced withdrawal, while
20% used dual methods and 18% relied
on female methods alone. The remaining
20% did not use any method. This
means that most current protection
among adolescent men involves male
contraceptive practice. About two-thirds
of dual-method use involves the pill, and
the remainder, another female method
(not shown).47
Poor and Hispanic Young Men Are theLeast Well-Protected
While contraceptive use is generally sim-
ilar among teenagers of varying charac-
teristics, some differences are evident.
At most recent intercourse, use of con-
doms (alone or in combination with other meth-
ods) was more common among men 15–17
(67%) than among older teenagers (55%), and it
was lower for men whose family income was low
(44%) than for those in families with higher
incomes (64–65%).48
Overall protection is very similar for white and
black youth, and somewhat higher among these
groups than among Hispanic youth. Use of the
condom alone is not much different among these
three groups, but Hispanic youth are by far the
In Their Own Right The Alan Guttmacher Institute
Chapter 2
2223
Very few teenage men become fathers.
SOURCE: TABLE 2.5, PAGE 83.
CHART 2.5
A L L
15–17
1 8 – 1 9
W H I T E
H I S P A N I C
B L A C K
L O W - I N C O M E
M O D E R AT E - I N C O M E
B E T T E R - O F F
P O O R
% O F M E N 1 5 – 1 9 W H O A R E FAT H E R S
0 2 4 6 8 10

least likely to use condoms in combination with
another method—7%, compared with 22% of
both white and black men.49
The drop in condom use after first intercourse
and the fact that this method is more commonly
used by younger than by older teenagers reflect a
commonly observed pattern of reduced condom
use with increased maturity and over time. Once
young couples settle into a relationship, condom
use declines.50 Presumably, in more stable rela-
tionships, the perceived need for STD protection
diminishes and the perceived need for effective
pregnancy protection rises.51 A young person who
asks a regular partner to use a condom might be
interpreted as lacking trust.52 In addition, couples
might come to prefer female methods because
they involve no interruption of lovemaking.
One in Five Sexually Active AdolescentMen Use No Method
The last time they had intercourse, 20% of men
15–19 did not use any contraceptive method, but
the proportion having unprotected intercourse is
notably higher than average among young men
with the lowest family incomes (37%) and
Hispanic young men (30%).53
At least some sexually active young men not
using a birth control method do not need contra-
ceptive protection because they and their partner
want to have a baby, or she is already pregnant.
However, the rest, who know that they do not
want a pregnancy, are at risk of just such an out-
come. But sexually active men are also at risk of
contracting and spreading an STD. The level of
this risk may be hard for young men to assess
because young people in sexual relationships do
not always disclose to each other details about
their sexual experiences, and many STDs have
few obvious symptoms. Nevertheless, any young
man who has had two or more sexual partners in
a short period of time should consider himself a
potential risk to his current partner. The fact that
four in 10 sexually experienced men 15–19 are
currently using no method or a method other than
the condom suggests that this message is not well
understood by all adolescents.
Seven percent of births and 13% of abortions involve men in their teens.CHART 2.6
SOURCE: TABLE 2.6, PAGE 83.
25
3 . 9 M I L L I O NT O T A L U . S . B I R T H S , 1 9 9 4
< 1 8
1 8 – 1 9
A L L O T H E R
M E N ' S A G E ATC O N C E P T I O N
85
1 . 4 M I L L I O NT O T A L U . S . A B O R T I O N S , 1 9 9 4
Regular and consistent use of any method iscomplicated by the likelihood that manyteenage men will have sex sporadically.

The Condom Is an Effective Method, but TeenageMen Often Do Not Know How to Use It Correctly
The condom is quite effective at preventing
pregnancy if compared with periodic abstinence,
spermicides or withdrawal; it is less effective,
however, than hormonal methods, the IUD or
sterilization. Fourteen percent of all U.S. women
relying on condoms experience an accidental
pregnancy in the first 12 months of use. However,
the rate among women aged 18–19 (18%) is
about half again the rate among 25–29-year-olds
(12%),54 which suggests that increased experi-
ence with the condom over time helps men use it
more effectively and that consistency of use rises
as men age.
Consistent and correct use of the condom
enhances its ability to prevent pregnancy and dis-
ease, but some adolescent men are poorly
informed about this method. Sexually experienced
men aged 15–19 say they get most of their infor-
mation about contraception from television
(91%), school (89%), their parents (47%), and
doctors or nurses (32%).55 Six in 10 men 15–19
say they were taught in school sexuality education
classes how to put on a condom.56 But one in 10
do not know that it is risky to wait until just
before ejaculation to put on the condom, and
about one in four do not know that they must
hold the condom as they withdraw after the sexu-
al act is over. One-third do not know that oil-
based lubricants can cause condoms to break.57
Most Teenage Men Do Not Want to Have a Child Right Now
Sixty-nine percent of men 15–19 say they would
be very upset to learn that their girlfriend was
pregnant. This reaction would be less common
among young men living in poor, run-down neigh-
borhoods (46%) than among those living in more
favorable conditions (57–77%).58 Only 4% of all
adolescent men say that getting someone preg-
nant would make them feel a lot like a man, and
60% say it would have no such effect.59
Almost all teenage men think their parents
would be upset if they made someone pregnant,
and two-thirds believe that their friends would be
upset. Younger teenagers and those from better-
off families are the most likely to report that their
parents would be upset. Black youth are the least
likely to anticipate disapproval from their friends:
Two-fifths would expect this response.60
Most teenage men want children in the future,
however. On average, teenage men say that 2.3
children is the ideal family size, although young
black and Hispanic men want slightly larger fami-
lies than white men.61 Among high school seniors
interviewed in 1992, 39% of young men, com-
pared with 49% of young women, said that having
children was “very important.”62
In Their Own Right The Alan Guttmacher Institute
Chapter 2
2425
TABLE 2b
SOURCE: REFERENCE 66.
AGE AT NO. OF % DISTRIBUTION, BY OUTCOMECONCEPTION PREGNANCIES, 1994*
BIRTHS ABORTIONS TOTAL
<20 466,000 59 41 100
<18 157,000 53 47 10018–19 309,000 63 37 100
*DOES NOT INCLUDE PREGNANCIES ENDING IN MISCARRIAGES.
Four in 10 pregnancies involving adolescent men are resolved by abortion.

Few Adolescent Men Are Involvedin a Pregnancy or Birth
Only 3% of men 15–19 have ever
fathered a child. The likelihood of
becoming a father during adoles-
cence is not very different by poverty
level or race (Chart 2.5, page 22).
However, the rate among 18–19-
year-olds (6%) is 10 times that
among men 15–17 (0.6%).63
Women younger than 18 are three
times as likely as men younger than
18 to become involved in a pregnan-
cy each year (86 versus 29 births per
1,000 in 1994).64 Only 7% of annu-
al U.S. births involve men younger
than 20 (Chart 2.6, page 23).65
Four in 10 Pregnancies InvolvingTeenage Men End in Abortion
Each year, nearly 470,000 women become preg-
nant by teenage men, almost all of whom are
unmarried. Four in 10 pregnancies involving
teenage men are resolved by abortion, and six in
10 end in a birth (Table 2b);66 the great majority
of these births involve unmarried men (Table 2c).
However, only 8% of the very few pregnancies
involving married teenage men end in abortion,
compared with 44% of those that involve unmar-
ried men.67 Of all women having abortions each
year in the United States, 13% had sexual part-
ners who were teenagers (Chart 2.6).68
Little is known about teenage men’s participa-
tion in their partners’ decision to end an
unplanned pregnancy. However, among women
younger than 18 attending abortion clinics in
1991, about one-third came with their boyfriend,
three-quarters said their boyfriend had been
involved in the abortion decision and one-fifth
said that their boyfriend was the most helpful per-
son in making the arrangements.69
Nonmarital births are most common amongadolescent men and men in their early 20s.
TABLE 2c
SOURCE: REFERENCE 67.
AGE AT % OF BIRTHSCONCEPTION THAT ARE
NONMARITAL, 1994
TOTAL 35
<20 87<18 9518–19 84
20–24 5625–29 2830–34 2035–39 15≥40 36

Twenty-seven percent of men in theirearly 20s are married or cohabiting, but thisproportion doubles by the late 20s.
Black men are much less likely than whiteor Hispanic men to marry in their 20s, andpoor black men are half as likely as better-off black men to do so.
Most men in their 20s have only one sexualpartner in the course of a year, but nearlyone-third have two or more.
Condom use is more common among mennot in a union than among those who arecohabiting or married. It is therefore notsurprising that men in their early 20s aremore likely than those in their late 20s to usecondoms.
One-quarter of men have fathered a childby age 25, and one-half have done so by age30. Minority men and those with the lowestincomes and least education are the mostlikely to become fathers in their 20s.
Men in their 20s account for about half ofbirths and half of abortions in the UnitedStates each year.
Roughly six in 10 births involving men intheir early 20s, and three in 10 of thoseinvolving men in their late 20s, arenonmarital.
Chapter 3
Men 20–29: Settling Down
In Their Own Right The Alan Guttmacher Institute
Chapter 3
2627

“Compared with their counterparts of a quarter of a century ago,men are now marrying later.”
The 20s are the years in which many men first
establish an independent place in society. During
their 20s, many men complete their education
and start working full-time. Most men this age are
no longer primarily dependent on their parents,
but many have not yet assumed responsibility for
families of their own. More so than at other ages,
men’s economic situation during this decade
influences, and is sometimes influenced by, their
sexual, marital and reproductive behavior. Both
incomes and some of these behaviors differ con-
siderably among racial and ethnic groups.
The 20s Mark Men’s Transition to IncreasedSelf-Reliance
Men in their 20s increasingly move away from
their parents’ home and start living independent-
ly—with a wife or partner, with other people or by
themselves. Roughly one in five men in their early
20s are married, and one in 10 are cohabiting.1
By the late 20s, the proportion married more than
doubles (Chart 3.1, page 28).2 But many young
men do not leave home, which suggests a mea-
sure of continuing dependency—probably because
some young men are still attending college, but
also partly because rents in many large cities are
so high. Forty-eight percent of men in their early
20s and 19% of those 25–29 still live with their
parents (not shown).3
During their 20s, men join the labor force in
large numbers. In all, 80% of men 20–24 and
92% of those 25–29 are in the labor force—that
is, currently employed (73% and 87%, respec-
tively) or seeking work (7% and 5%, respectively).
The proportion of men in the labor force who are
seeking but have not found work is 7% for white
and Hispanic men in their early 20s and 18% for
comparable black men. In the late 20s, about 4%
of white and Hispanic men and 8% of black men
in the labor force are looking for work.4
In their early 20s, two in 10 men are not in the
labor force at all, some because they are still full-
time students; by the late 20s, the proportion not
in the labor force drops to less than one in 10.
Sixty percent of men 20–24 are working and not
going to school, 19% are combining study and
work, 14% are studying but not working and 6%
are neither in the work force nor in school.
Hispanic men this age are the most likely to be
working only, while black men are the most likely
both to be in school only and to be neither work-
ing nor in school (not shown).5
First jobs frequently pay low wages, and many
do not offer health insurance coverage. Men’s
likelihood of having health insurance coverage is
at its lowest point when they are in their 20s:
Thirty-seven percent of those aged 20–24 and
31% of those 25–29 have no health insurance of
any kind.6
Between the early and late 20s, some men
obtain academic certificates and degrees, but
educational attainment varies widely by racial and
ethnic group. Hispanic men—many of whom are
recent immigrants who have not attended school
in the United States—start their adult lives with
the largest educational deficit.7
Men’s educational levels have a bearing on
their subsequent economic status. In 1996, the
median annual earnings of young men aged
25–34 who had not completed high school were
29% lower than those of their peers who had
done so. Furthermore, many minority men earn
less than white men with similar educational
qualifications.8
One-third of men in their early 20s are poor or
have low incomes, one in four have moderate
incomes and four in 10 are better-off. By the late
20s, the proportion in the two lowest income cat-
egories has declined slightly, while the proportion
who are better-off has risen. As is also true at
other ages, during the 20s, white men are less
likely to be in the two lowest income categories
(22%) than are black and Hispanic men (38%
and 52%, respectively).9

As men move through their 20s, they are increasingly likely to be married orcohabiting, employed, covered by health insurance and better-off economically.
CHART 3.1
SOURCE: TABLE 3.1, PAGE 84.
In Their Own Right The Alan Guttmacher Institute
Chapter 3
2829
20737
93
18
704238
137
1
57
5 1365
C U R R E N T LY E M P L O Y E D
S E E K I N G E M P L O Y M E N T
N O T I N L A B O R F O R C E
E M P L O Y M E N T S T AT U S8
875
37 31
40 20
2748
26
16P O V E R T Y S T AT U S
P O O R
L O W - I N C O M E
M O D E R AT E - I N C O M E
B E T T E R - O F F
13 10
9 . 2 M I L L I O N M E N 2 0 – 2 4 9 . 1 M I L L I O N M E N 2 5 – 2 9
H E A L T H I N S U R A N C E
C O V E R A G E
M E D I C A I D
O T H E R G O V E R N M E N T
P R I VAT E
N O N E
C U R R E N T LY M A R R I E D
C O H A B I T I N G
D I V O R C E D / S E P A R AT E D /W I D O W E D
N E V E R - M A R R I E D A N DN O T C O H A B I T I N G
U N I O N S T AT U S

Men Are Marrying Later Now Than TheyDid in the Past
Compared with their counterparts of a quarter of a
century ago, men are now marrying later. Fifty-one
percent of men in their 20s in 1976, but only
32% in 1999, were legally married.10 And among
those who have wed, the median age at marriage
rose from 22.8 in 1965 to 26.7 by 1998.11
Much of the delay in marriage can probably be
explained by men’s and women’s growing under-
standing of the importance of obtaining higher
education or job training before they marry, to
ensure being employable in today’s changing
economy. The postponement of marriage could
also reflect more caution among recent genera-
tions of men and women, many of whom have
seen their parents’ marriages end in divorce.12
Yet there does not seem to be any large-scale
rejection of the institution of marriage itself.
Three-quarters of both men and women think
marriage is important or somewhat important.
Black men are less interested in marriage than
white men, and Hispanic men are more interested
than either.13 One study finds that these dispari-
ties may stem partly from differences among
racial and ethnic groups in the anticipated bene-
fits of marriage (particularly, the expectation that
it will improve one’s sexual life), as well as the
anticipated disadvantages (notably, that it will
limit personal friendships outside marriage).14
Even as many men postpone formal marriage,
some live with a woman in informal, or cohabit-
ing, unions.15 Four million American households
include unmarried couples. In 1970, there was
one such household for every 100 households
with married couples; by 1996, the figure was
seven for every 100.16 About half of all men
25–44 have lived in a cohabiting relationship at
some point.17 Cohabitation is most common
among people in their 20s and low-income
groups, but approval of this type of union is high-
est among the most highly educated.18
The proportion of men who have ever cohabited
is much higher than the proportion currently liv-
ing with a woman, because cohabiting unions are
often of short duration—an average of 1.3
years.19 In one study of cohabiting couples, two
in 10 were still unmarried and living together
after 5–7 years; four in 10 had married, and four
in 10 had broken up.20
The Age at Which Men Settle Down DiffersWidely by Poverty Status
Men’s union status changes dramatically between
their early and late 20s. Seven in 10 men in their
early 20s are not yet married,21 but this proportion
drops to about four in 10 men in their late 20s.22
The pace of union formation varies considerably by
race and ethnicity. Six in 10 white men 25–29,
half of Hispanic men and one-third of black men
are married or cohabiting (Chart 3.2, page 30).23
Not only are black men overall less likely than
white and Hispanic men to marry in their 20s, but
poor black men are half as likely as better-off
black men to do so (one in 10 vs. two in 10—not
shown). The association between income and mar-
riage is in the opposite direction for Hispanic men:
Two in five poor men are married, compared with
one in four of those who are better-off. Among
white men, income has no association with the
likelihood of marrying.24 The direction of the rela-
tionship between poverty and being married is
complicated by the fact that marriage itself,
because it often brings two earners together in one
household, can help lift men out of poverty.
Among the many possible reasons suggested
for black men’s slower entry into marriage are
their difficulties in finding a first job and in mak-
ing the transition to subsequent better-paying
jobs25 (which reduce the number of “economical-
ly attractive” black men for black women to
marry26) and the decline of America’s heavy man-
ufacturing industries, which employed many non-
skilled black men in the 1950s and 1960s.27
Another factor is the reality that there are fewer
black men than black women in the ages when
marriage is most likely to occur,28 partly because
of high levels of incarceration among black men
in their 20s and 30s (see box on page 36). And
since black women in their 20s tend to have com-
pleted more years of education than black men

and to have very similar employment levels to
them,29 such women stand to gain less by marry-
ing. Hispanic men’s earlier entry into marriage
may reflect a cultural emphasis on strong familial
bonds30 and perhaps the Catholic upbringing of
most Hispanic men.
Most Men in Their 20s Are in a Sexual Relationship
All but 7% of men in their 20s have had sexual
intercourse, and all but 12% have been in a sexu-
al relationship in the past year (marital or other-
wise). Almost three in 10 young adult men knew
their current partner for more than a year before
having intercourse with her, and more than four in
10 knew her for more than a month; the remain-
ing three in 10 knew her for less than a month.31
The age of young men’s sexual partners is not
known, but about one-quarter of sexually active
men 22–26 have had intercourse with a woman
younger than 20 during the past year.32
Married and cohabiting men in their 20s are
more likely than sexually experienced single men
to have intercourse at least once a month (100%
vs. 76%). Their frequency of intercourse is greater
as well: Eighty-seven percent of these men, com-
pared with 49% of those who are not married or
cohabiting, have sex once a week or more.33 Most
men in their 20s find their current sexual rela-
Union status varies by race and ethnicity, especially in men’s late 20s.CHART 3.2
H I S P A N I C
B L A C K
H I S P A N I C
B L A C K
% O F M E N
A L L
A L L
M E N 2 0 – 2 4
0 2 0 4 0 6 0 8 0 1 0 0
W H I T E
W H I T E
M E N 2 5 – 2 9
U N I O N S T AT U S
C U R R E N T LY M A R R I E D
C O H A B I T I N G
D I V O R C E D / S E P A R AT E D /W I D O W E D
N E V E R - M A R R I E D A N DN O T C O H A B I T I N G
In Their Own Right The Alan Guttmacher Institute
Chapter 3
3031
SOURCE: TABLE 3.2, PAGE 84.

tionship physically satisfying (84%) and emotion-
ally satisfying (75%).
An individual’s satisfaction with a sexual rela-
tionship is influenced by factors other than the
frequency of sexual activity or the pleasure it
gives—emotional investment in the relationship
and its duration, for example. On these measures,
men in long-term sexual partnerships and men
living with their partner seem to have the advan-
tage over men involved in short-lived relationships
and men not living with their sexual partner. In
addition, men’s satisfaction with their sexual lives
appears to be a function of such considerations
as their age, their general state of happiness,
their attitudes toward extramarital sex or sex with-
out love, and whether they have sex predominant-
ly to express affection or to relieve tension.34
The Majority of Men in Their 20s Have HadOnly One Sexual Partner in the Past Year
Given that an average of 10 years separates the
first time men have intercourse from the first time
they marry, it is not surprising that many men
have multiple sexual partners before they settle
down. Only one in eight sexually experienced men
20–29 have had only one partner ever, and more
than half have had at least six.35
But the picture changes with regard to the
number of sexual partners in the past year (Chart
3.3). Some 65% of sexually experienced men in
their 20s have had a single partner in the past
year, 26% have had 2–5 partners, 5% have had
six or more, and 4% have had none. These pat-
terns are very different for currently married and
Two-thirds of all sexually experienced men in their 20s had one partnerin the past year, but this proportion varies among subgroups.
CHART 3.3
SOURCE: TABLE 3.3, PAGE 84.
2 0 – 2 4
2 5 – 2 9
C O H A B I T I N G
N E V E R - M A R R I E D
% O F S E X U A L LY E X P E R I E N C E D M E N 2 0 – 2 9
M A R R I E D
0
1
2 – 5
≥ 60 2 0 4 0 6 0 8 0 1 0 0
A L L
S E X U A L P A R T N E R SI N P A S T Y E A R
Note: The survey included too few divorced, separated or widowed men to permit separate measuresfor this group.

never-married men. Only 5% of married men have
had two or more partners in the past year, com-
pared with 45% of never-married men. Cohabiting
men are closer to never-married men in this
respect.36 (So few men in their 20s are divorced
or separated that the measurement of patterns
among this group is not possible.)
Men’s number of sexual partners in the past
year varies very little by poverty status, but differ-
ences emerge by race and ethnicity. Two percent
of Hispanic men, 4% of white men and 18% of
black men have had six or more partners in the
past year. Much of this differential can be attrib-
uted to the fact that black men in their 20s are
much less likely than whites and Hispanics to
be married.37
Most Sexually Active Men in Their 20s PracticeContraception
The decisions that individuals make about
whether to protect themselves against pregnancy
and sexually transmitted diseases (STDs) and
which method of protection to use depend largely
on their life situation. A man’s number of sexual
partners over a given period, his union status and
whether he and his partner want a pregnancy are
key considerations.
In both the early and the late 20s, more than
eight in 10 men who have had intercourse in the
past month are protected through either their own
or their partners’ contraceptive use (Chart 3.4).
About one-half of use among the younger group
involves male methods: Twenty-one percent of
Most sexually active men in their 20s or their partners use contraceptives.CHART 3.4
SOURCE: TABLE 3.4, PAGE 84.
A L L
M A R R I E D / C O H A B I T I N G
N O T I N A U N I O N
0 2 0 4 0 6 0 8 0 1 0 0
% O F S E X U A L LY A C T I V E M E N W H O U S E D A M E T H O D I N P A S T M O N T H
M E T H O D
A L L
M A R R I E D / C O H A B I T I N G
N O T I N A U N I O N
M E N 2 0 – 2 4
M E N 2 5 – 2 9
*Pill, implant, injectable, IUD, female sterilization, female condom, spermicide, douche, vaginal filmor periodic abstinence.
VA S E C T O M Y
C O N D O M O N LY
C O N D O M P L U SO T H E R M E T H O D
W I T H D R AWA L
F E M A L E M E T H O D S O N LY *
In Their Own Right The Alan Guttmacher Institute
Chapter 3
3233

these men use the condom alone, 18% the con-
dom plus another method and 4% withdrawal.38
As men move through their 20s, the first sign
of reliance on vasectomy begins to emerge,
although use of this method remains at a low
level. About seven in 10 men in both their early
and their late 20s rely on female methods, alone
or along with the condom.39
In their early 20s, sexually active men who are
not in a union are much more likely to use con-
doms—alone or with another method—than are
their married and cohabiting counterparts (50%
vs. 22%). They also are more likely to use female
methods, alone or with condoms (62% vs.
49%).40 The relatively high level of condom use
among men not in a union may reflect that they
are less likely than married and cohabiting men to
be involved in an exclusive sexual relationship, or
that they have been in a relationship for less time.
On the other hand, the low level of condom use
among married and cohabiting men may suggest
that a large majority consider themselves—many
with good reason—to be at low risk of acquiring
STDs. At the same time, the substantial propor-
tion of men not in a union who do not use con-
doms suggests that they also may believe them-
selves to be at low risk of contracting an infection.
At ages 20–24, condom use alone is more
common among low-income than among higher-
income men (21% vs. 15%) and among black
than among white men (29% vs. 20%). By ages
25–29, no race-based differences remain, but
poor men continue to be the most likely to use
only the condom.41
By their late 20s, 2% of sexually experienced
men have had a vasectomy, and 7% are in a sexu-
al relationship with a woman who has had a tubal
ligation. The proportion whose partner has been
sterilized is highest—23%—among poor men
(not shown).42
Men View Contraceptive Methods a LittleDifferently Than Women
Men and women in their 20s do not always have
the same opinions about the main purpose of
contraceptive practice, about methods’ ease of
use or about their effectiveness. In general,
women give priority to a method’s effectiveness in
preventing pregnancy, whereas men think that
STD protection is equally important. Considerably
higher proportions of men than of women believe
that the condom is effective in preventing preg-
nancy, and women are somewhat more likely than
men to believe this of the pill. Both men and
women consider ease of use and the need to plan
ahead more important features of a method than
whether it interferes with sexual pleasure. Four in
10 men aged 20–27 believe—erroneously—that
Forty-nine percent of births and 53% of abortions involve men in their 20s.CHART 3.5
SOURCE: TABLE 3.5, PAGE 85.
2 0 – 2 4
2 5 – 2 9
A L L O T H E R
21
28 24
29
3 . 9 M I L L I O NT O T A L U . S . B I R T H S , 1 9 9 4
1 . 4 M I L L I O NT O T A L U . S . A B O R T I O N S , 1 9 9 4
M E N ' S A G E AT
C O N C E P T I O N

In Their Own Right The Alan Guttmacher Institute
Chapter 3
3435
condom use involves health risks. At
the same time, only one-third of both
men and women consider the
method easy to use, and only one in
10 say that it does not interfere with
sexual pleasure.43
While men considering the use of
condoms or withdrawal have to weigh
such aspects of these methods as
their effect on spontaneity in love-
making, they do not have to measure
relative health benefits and disadvan-
tages in the same way that women
do before choosing many of their
methods. If male hormonal methods
are developed, these too may have
some benefits outside of their ability
to prevent pregnancies and some
side effects, and men will have to
weigh these factors in choosing the
method that is best for them.
During the Young Adult Years, Men Begin toAnticipate and Initiate Fatherhood
More than nine in 10 men aged 25–49 say they
want to have children, and their average ideal
family size is 2.5 children.44 Men at all ages
seem to believe that having children is one of
life’s greatest joys.45 However, in some studies,
men have identified more negative, and fewer
positive, consequences of having children than
have women.46
Men volunteer pretty much the same reasons
for wanting children as women do: The benefits—
personal, emotional and social—outweigh the eco-
nomic and personal costs; and having children
strengthens a marriage, ensures against loneliness
in old age and marks an important developmental
stage.47
However, as men are delaying marriage longer,
so are they delaying becoming fathers: Only 19%
of men who were 25–29 in 1993 had had their
first child in their early 20s, compared with 36%
of men who were aged 25–29 in the early
1970s.48 In addition to later marriage, such fac-
tors as the ability to support a child, the stress
and worry of raising children, being able to buy a
home and having time for a career undoubtedly
influence when men start having children.
Roughly half of all births each year in the
United States involve fathers who are in their 20s
(Chart 3.5, page 33).49 The rates of births among
men and among women are at their closest in the
late 20s (Table 3a),50 indicating that this is a
time when men and women are likely to be having
and caring for small children.
Before they are 25 years old, 26% of men have
had a child, and before they are 30, 50% have
become fathers (Chart 3.6). However, fatherhood
happens much earlier for certain groups of men,
particularly those who did not complete high
school. Among men without a high school diplo-
ma, half had at least one child before age 25,
and three-quarters before age 30. Poor and low-
income men, as well as those with moderate
incomes, begin fatherhood much sooner than bet-
ter-off men. And black and Hispanic men start
having children sooner than white men do.51
The links between poverty and fatherhood and
between education and fatherhood can work in
both directions. Having a child at a very young
age may prevent a man from completing his high
The ages at which men and women havechildren are slightly different.
SOURCE: REFERENCE 50.
AGE AT BIRTH BIRTHS PER 1,000, 1998
MEN WOMEN
10–14 0 115–19 22 5120–24 85 11125–29 113 11630–34 99 8735–39 54 3740–44 21 745–49 7 <150–54 3 0≥55 <1 0
TABLE 3a

school education, especially if he
works full-time to help support the
child. And starting work at a young
age without any qualifications tends
to keep a man in low-paying jobs. On
the other hand, young men who are
already poor or whose prospects are
unfavorable may feel that they have
little to lose by having a child.
Strikingly, only 26% of men with a
graduate degree have fathered a
child before the age of 30.52 Not
having the responsibility of father-
hood may have enabled them to earn
the degree, but it is also possible
that the desire to study and earn
a degree deterred them from
becoming fathers at a younger age.
The low earning power of the
least-educated American men has
potentially adverse implications for
their children. In 1997, 68% of men
25 and older with less than a high
school education were earning less
than $25,000 a year, compared with
37% of all men 25 and older.53
Apart from the adolescent years,
the early 20s see higher levels of
nonmarital childbearing than any
other age (Table 2c, page 25). In
1994, 56% of births involving men
20–24 were nonmarital; by ages
25–29 the proportion drops to
28%.54
Many Births Involving Men in Their20s Are Unintended
Although many men start having
children in their 20s, some young
adult men say those births were not
intended. Among men 25–29 whose
partners gave birth between 1988
and 1994, 34% said the child was
born earlier than intended, and 15%
reported that no time would have
been good. Twenty percent of all
SOURCE: TABLE 3.6, PAGE 85.
A L L
<HIGH SCHOOL
H I G H S C H O O L
W H I T E
H I S P A N I C
B L A C K
L O W - I N C O M E
M O D E R AT E - I N C O M E
B E T T E R - O F F
P O O R
% O F M E N 3 0 – 3 4
0 20 40 60 80 100
S O M E C O L L E G E
≥C O L L E G E
A G E AT F I R S T C H I L D ' S B I R T H
< 2 5 2 5 – 2 9
Men who are poor or low-income or have littleeducation are the most likely to have achild by their late 20s.
CHART 3.6

An estimated 1.4 million men 15–49 were in America’sprisons and jails—federal, state and local—in 1996.Some 33% of male prisoners 15–49 were white; 18%,Hispanic; 45%, black; and 3%, of other racial and eth-nic backgrounds. Thus, even though black and Hispanicmen make up only 25% of noninstitutionalized menaged 15–49, they account for 63% of the incarceratedpopulation in this age-group.1
Seven percent of all black men 15–49 were incarcerat-ed in 1996, compared with 3% of Hispanic and 1% ofwhite men in this age-group. Among black men, thisproportion was even higher (one in 10) at ages 20–39, atime when many men are becoming fathers or having asecond or third child.2 If current rates of first incarcer-ation are translated into lifetime prospects, black men’schances of going to state or federal prison sometime intheir lives (28%) are considerably higher than Hispanicmen’s (16%) and many times white men’s (4%).3
Criminal justice experts emphasize that profoundinequities in arrest rates and sentencing practices areone of the primary reasons for the grossly dispropor-tionate incarceration rates of black men. Even thoughblack men account for 15% of drug users in the UnitedStates, they represent 35% of those arrested for drugoffenses, 55% of those convicted of drug possessionand 74% of those incarcerated for possession.4
Fifty percent of Hispanic, 46% of black and 39% ofwhite inmates 15–49 are younger than 30. Many incar-cerated men have only a low level of education. Almostsix in 10 have not completed high school,5 comparedwith one in eight in the general male population.6 And36% had not been employed the month before theirarrest.7
Sexually Transmitted Diseases (STDs) AreMore Prevalent in Prisons Than Among theGeneral Population
Sexual health conditions in America’s jails are extremelypoor. Rape is common, and conditions conducive to thespread of HIV and other STDs are widespread. About0.4–0.5% of men in federal and state prisons in 1993were infected with HIV8— about six times the estimatedAIDS rate in the general male population that year(0.07%).9 And among young men entering state juvenilecorrection facilities in 1999, 4% nationwide (10% inNew Jersey and Maryland) had positive blood tests forchlamydia.10 By comparison, the reported chlamydiarate among all U.S. men 15–19 was 0.3%.11
Many Incarcerated Men Have ChildrenOn average, incarcerated men 18–49 have 1.5 children,and married prisoners have 2.6. Those aged 45–49 have2.5 children,12 whereas in the general population of menthat age, the average is 2.1.13 Thirty-six percent ofincarcerated men have no children, 23% have one, 18%have two and 23% have three or more.14
About 2.1 million American children have fathers inprison or jail at any given time. About one million chil-dren with imprisoned fathers are black, 421,000 areHispanic and 600,000 are white.15 An estimated 600,000poor U.S. men not in compliance with child support pay-ments are currently incarcerated.16 Imprisonment hasbeen characterized as “the most significant factor con-tributing to the . . . breakdown of African American fam-ilies” during the 1990s.17
In Their Own Right The Alan Guttmacher Institute
Chapter 3
3637
INCARCERATED MEN

men in their late 20s do not want any more
children.55
Men in their 20s are responsible for 53% of
the pregnancies that terminate in abortion each
year in the United States (Chart 3.5).56 About
one-third of pregnancies involving men aged
20–24 and one-quarter of those involving men in
their late 20s end in abortion (Table 3b).57
Women cite many reasons for having an abor-
tion, the most common of which are the need to
stop or postpone childbearing, economic difficul-
ties and problems in the relationship with the
father.58 Information about the life circumstances
of young adult men involved in a pregnancy termi-
nation, however, is lacking. Do the couple love
one another? Is the marriage or relationship sta-
ble? Does the man have a job, or health insur-
ance? Does he think that he makes enough money
to support a family? These are all questions to
which answers directly from men are needed.
One in three pregnancies involving men in their early 20s are resolved by abortion.TABLE 3b
SOURCE: REFERENCE 57.
AGE AT NO. OF % DISTRIBUTION, BY OUTCOMECONCEPTION PREGNANCIES,
1994* BIRTHS ABORTIONS TOTAL
20–24 1,214,000 67 33 10025–29 1,449,000 77 23 100
*DOES NOT INCLUDE PREGNANCIES ENDING IN MISCARRIAGES.

The great majority of adult men are married or living with a woman: seven in 10of those in their 30s and eight in 10 of thosein their 40s.
In their 30s and 40s, poor men are theleast likely to be married and the most likelyto be separated or divorced.
Four in 10 never-married men and five in 10 previously married men have two ormore partners in a given 12-month period,compared with one in 20 married men.
During their 30s and 40s, men’s use ofcondoms for contraception declines, and their reliance on male and female sterilization grows.
By age 49, the average man has had abouttwo children. In addition, many men arefathers to stepchildren, adopted children orfoster children.
Men in their 30s and 40s account for 44%of births and 34% of abortions each year. Thenumber of men who father children after age49 is very small.
Eleven percent of men in their 30s havebiological children but do not live with them,compared with only 4% of women.
Chapter 4
Men 30–49:Forming Families
In Their Own Right The Alan Guttmacher Institute
Chapter 4
3839

“High levels of divorce and remarriage among men in their 30s and 40s[contribute to] an increase in blended families and stepfamilies.”
Most men in the 30s and 40s, like most women,
are engaged in three major areas of their lives:
work, marriage and parenting. Very few men in
this age-group have not married or become
fathers. However, because of separation, divorce,
nonmarital childbearing and children’s starting to
leave home, some men who have had children are
not living with them.
Reflecting high employment levels among men
in their 30s and 40s, poverty levels are lower for
this than for any other age-group covered in this
report. Health insurance coverage is also at its
highest. However, wide racial and ethnic differen-
tials persist in income and health coverage.
Most Men in Their 30s and 40s Are Married andHave Moved Out of Poverty
Between 72% and 82% of men in their 30s and
40s are married or cohabiting, and 9–13% are
divorced or separated. In their 30s, 19% have
never married and are not cohabiting, but this
proportion drops to 5% among men in their 40s
(Chart 4.1, page 40).1
Some 7–8% of men in their 30s and 40s live
in poverty, lower proportions than among men in
their 20s. However, race-based differentials
remain: Seventeen percent of Hispanic men in
their 30s and 40s, 13% of black men, but only
5% of white men are poor (not shown). The pro-
portion of men who are better-off increases with
age, from 49% among men in their 30s to 58%
among those in their 40s.2
Almost nine in 10 men in their 30s and 40s
are employed, and 3% are looking for work. The
remainder are out of the labor force, mostly
because they are disabled. While 9% of all men
in their 40s and 4% of better-off men are dis-
abled, the proportion reaches 33% among poor
men this age (not shown).3
Most men in their 30s and 40s have health
insurance coverage—78% and 84%,
respectively.4 These levels of coverage are consis-
tent with men’s high employment levels in their
30s and 40s and, presumably, the fact that these
men are likely to be in jobs that provide health
insurance or to be able to afford private coverage.
Nevertheless, as will be shown in chapter 6, poor
men in their 30s and 40s continue to be dispro-
portionately without health insurance.
Earnings differentials by race and ethnicity
similar to those of men in their 20s persist among
men in their 30s and 40s (not shown), partly
because of differentials in the types of jobs that
men hold. Employed white men are more likely to
be in managerial and professional positions (30%)
than are working black and Hispanic men (16%
and 11%, respectively). They also are half as like-
ly to work in low-paying service or agricultural
jobs and much less likely to work in unskilled
manual jobs: More than half of employed
Hispanic and black men are in such jobs, com-
pared with three out of 10 white men.5 Higher
educational levels among white men explain
some, but not all, of these differences.
Union Status Varies with Men’s Income andBackground
In all, 71% of men aged 30–49 are married and
6% are cohabiting (bringing the total in a union
to 77%), 11% were formerly married and 12%
have never married (Chart 4.2, page 41).6 Most of
the rapid increase in marriage occurs in men’s
30s. Between men’s 20s and 30s, the proportion
legally married increases by 33 percentage points,
compared with only seven percentage points
between men’s 30s and 40s (not shown).7 In
part, this apparent slowing reflects that after the
20s, increasing proportions of men are marrying,
but increasing proportions are also separating or
divorcing.
Poor men are the least likely to be married
(60%), the most likely to be cohabiting (13%)
and the most likely to be divorced or separated
(18%). Marriage patterns among the three other

SOURCE: TABLE 4.1, PAGE 85.
In Their Own Right The Alan Guttmacher Institute
Chapter 4
4041
C U R R E N T LY M A R R I E D
C O H A B I T I N G
D I V O R C E D / S E P A R AT E D /W I D O W E D
N E V E R - M A R R I E D A N DN O T C O H A B I T I N G
79
19
65 78
4513
U N I O N S T AT U S
2 1 . 0 M I L L I O N M E N 3 0 – 3 9 2 0 . 5 M I L L I O N M E N 4 0 – 4 9
8
89
3C U R R E N T LY E M P L O Y E D
S E E K I N G E M P L O Y M E N T
N O T I N L A B O R F O R C E
E M P L O Y M E N T S T AT U S9
88
3
4916
2758 23
12 P O V E R T Y S T AT U S
P O O R
L O W - I N C O M E
M O D E R AT E - I N C O M E
B E T T E R - O F F
8 7
1
73
4 24
78
H E A L T H I N S U R A N C E
C O V E R A G E
M E D I C A I D
O T H E R G O V E R N M E N T
P R I VAT E
N O N E
22 16
CHART 4.1In their 30s and 40s, men are increasingly likely to be married and have at least amoderate income; the vast majority have a job and health insurance.

income groups are quite similar to the average.8
The racial and ethnic differentials in union sta-
tus seen among men in their 20s are also found
among more mature men. Six in 10 black men in
their 30s and 40s are married or cohabiting, com-
pared with about eight in 10 white and Hispanic
men. And the proportion of black men who are
divorced, separated or widowed is twice that of
white and Hispanic men.9
Only 23% of poor black men aged 30–39 are
married, compared with 51% of those with mod-
erate or higher family incomes. And in their 40s,
only 32% of poor black men, but 63% of those
who are better-off, are married.10 The very high
proportion of poor black men who are not married
and the fact that so many black men are poor are
major factors driving lower overall marriage rates
among black men.
For all men in their 30s and 40s, not being
poor seems to be linked to a higher likelihood of
being married.11 Better-off men are about half as
likely as poor men to be divorced or separated—
8% vs. 18%.12 Poverty apparently helps to foster
or exacerbate marital disharmony.
Divorce rates in the United States rose steeply
from the 1960s to the mid-1980s and then lev-
eled off.13 Still, anywhere from half to two-thirds
of future first marriages are expected to end in
divorce.14 The typical duration of the first mar-
riage for men who divorce is 8.1 years.15 Men
SOURCE: TABLE 4.2, PAGE 85.
% O F M E N 3 0 – 4 9
U N I O N S T AT U S
C U R R E N T LYM A R R I E D
C O H A B I T I N G
D I V O R C E D / S E P A R AT E D /W I D O W E D
N E V E R - M A R R I E DA N D N O T C O H A B I T I N G
A L L
B L A C K
W H I T E
P O O R
L O W - I N C O M E
H I S P A N I C
B E T T E R - O F F
M O D E R AT E - I N C O M E
0 2 0 4 0 6 0 8 0 1 0 0
CHART 4.2In their 30s and 40s, poor men and black men are the least likely to be married.
who end their first marriage typically do so in
their mid-30s. However, the majority of divorced
men and women—between two-thirds and three-
quarters—remarry.16 In almost one in four mar-
riages that took place in 1988, both the groom
and the bride had been married before; in an
equal proportion, one of the pair had been.17
Some remarriages end in divorce followed by
reentry into marriage. For men, second marriages
that also end in divorce typically last about six
years, while third or higher-order marriages last
less than five years.18
High levels of divorce and remarriage among
men in their 30s and 40s have important conse-
quences. One is an increase in the proportion of
blended families and stepfamilies. Another is that
18–28% of men in this age-group are not living
with a wife or partner, a situation that has impor-
tant implications for their patterns of sexual
behavior.
Most Men 30–49 Currently Have OnlyOne Sexual Partner
By the time they reach their 30s, only 2% of men
have never had vaginal intercourse; by their 40s,
this proportion drops below 1%. About one in
eight men 30–49 have had only one sexual part-
ner, but two in five have had 10 or more in their
lifetime.19
In terms of potential health risk, more germane
than a man’s lifetime number of sexual partners
is the number he has concurrently or over a brief
period of time. Among sexually experienced men
aged 30–49, an overwhelming majority (85%)
have had only one or no sexual partner in the past
year. However, differences by union status are
substantial: Ninety-four percent of married men in
their 30s and 40s, 86% of cohabiting men, 52%
of formerly married men and 57% of never-mar-
ried men have had only one or no sexual partner
in the past year (Chart 4.3). Poverty status has
little bearing on the number of sexual partners
men in this age-group have in a given year (not
shown).20
Because almost eight in 10 men in their 30s
and 40s are in a union, frequent sexual activity is
common. Roughly nine in 10 men in their 30s
had intercourse at least once in the past month.
Half (including six in 10 married and cohabiting
men, and four in 10 men not in a union) did so
1–3 times a week.21
Some sexual problems exist, however. About
one-third of men 18–59 report some kind of sexu-
al dysfunction. Increasing age is particularly asso-
ciated with erection problems and a diminished
desire for sex: Men in their 50s are three times as
likely as men 18–29 to experience these two
problems. By contrast, younger women are more
likely than older women to report having sexual
problems.22
The vast majority of men and women 30–49
say they have sex with their partner to express
love or affection (91%), and both men and
women appear to take the same high degree of
pleasure from their current sexual relationship.
However, men are somewhat less likely than
women to say that affairs outside of marriage are
always wrong (70% vs. 79%). And 32% of single
men, compared with 69% of single women 30–49
agree they would not have intercourse unless they
were in love. Men are also more likely to find the
idea of sex with a stranger or group sex appealing
(31% vs. 11%).23
As Men Mature, Their ContraceptivePatterns Change
There are no national data available on contracep-
tive use among men 40 and older, but information
is available for men in their 30s. Many men aged
30–39 need nonpermanent contraceptive meth-
ods, which make it possible for couples to space
and time pregnancies. But for those in their early
30s who first became fathers at an early age and
In Their Own Right The Alan Guttmacher Institute
Chapter 4
4243
By the time they reach their 30s, only2% of men have never had vaginalintercourse; by their 40s, this proportiondrops below 1%.

for most men in their late 30s (two-thirds of
whom have had all the children they want24), very
effective methods to prevent further pregnancies
become necessary. Many couples in this situation
decide that sterilization is a more reliable and
convenient, and probably less-expensive, method
of fertility control than the pill or the condom.
Among men aged 30–34 who have had inter-
course in the past month, 33% rely on nonperma-
nent female methods of contraception, 22% use
condoms (alone or with another method) and
17% are protected by their partner’s sterilization;
only 5% have had a vasectomy and 4% practice
withdrawal. The remaining 19% use no method.
Among men in their late 30s, reliance on vasecto-
my rises sharply (to 20%), and male and female
sterilization together are the leading contraceptive
method (44%), followed by other female methods
(21%) and the condom, alone or as part of dual
use (16%). (Levels of sterilization may even be
somewhat higher than shown, because a small
proportion of couples relying on this method also
use condoms. These have been counted primarily
as condom users.) Three percent of sexually
active men 35–39 practice withdrawal, and the
remaining 16% use no method to protect against
pregnancy (Chart 4.4, page 44).25
From the mid-1960s to the mid-1990s, steril-
ization rates increased rapidly in the United
States, particularly among women. The proportion
of married women 15–44 who have had a tubal
ligation went from 4% in 1965 to 24% in 1995;
the proportion of their male partners who have
had a vasectomy rose from 4% to 15% in the
CHART 4.3
SOURCE: TABLE 4.3, PAGE 86.
3 0 – 3 9
4 0 – 4 9
C O H A B I T I N G
D I V O R C E D / S E P A R AT E D / W I D O W E D
% O F S E X U A L LY E X P E R I E N C E D M E N 3 0 – 4 9
M A R R I E D
A L L
0
1
2 – 5
≥ 6
S E X U A L P A R T N E R SI N P A S T Y E A R
2 0 4 0 6 0 8 0 1 0 00
N E V E R - M A R R I E D A N D N O T C O H A B I T I N G
The great majority of men in their 30s and 40s, except for those not in union,have only one sexual partner in a given year.

same period.26 Among the conditions that might
contribute to women’s greater likelihood of being
sterilized are that women have more at stake than
men in wanting to avoid unwanted pregnancy;
some men lack interest in, and perhaps fear,
vasectomy; communication between partners
about sharing the responsibility for contraception
is sometimes inadequate; and women are increas-
ingly likely to decide on their own to seek steril-
ization.27
Whereas the poorest men are the least likely to
have had a vasectomy (5%, compared with 15%
of the better-off), the poorest women are the most
likely to have had a tubal ligation (41%, com-
pared with 19% of those in the highest-income
category). Among black and Hispanic couples—
who are more likely than their white counterparts
to be poor—it is overwhelmingly the woman who
becomes sterilized.28
Men’s Contraceptive Decisions Differ Widely by Union Status
In their early 30s, men who are not married or
cohabiting are about twice as likely to use con-
doms, alone or in combination with a female
method, as are men in a union (36% vs. 18%);
the same is true in their late 30s (32% vs. 15%).
And at ages 35–39, men not in a union are more
likely than married and cohabiting men to use any
method (91% vs. 83%), suggesting that they are
SOURCE: TABLE 4.4, PAGE 86.
A L L
M A R R I E D / C O H A B I T I N G
N O T I N A U N I O N
% O F S E X U A L LY A C T I V E M E N W H O U S E D A M E T H O D I N P A S T M O N T H
A L L
M A R R I E D / C O H A B I T I N G
N O T I N A U N I O N
*Pill, implant, injectable, IUD, female condom, spermicide, douche, vaginal film or periodic abstinence.NOTE: The survey included too few divorced, separated or widowed men to permit separate measures for this group.
0 2 0 4 0 6 0 8 0 1 0 0
M E N 3 5 – 3 9
M E N 3 0 – 3 4
M E T H O D
VA S E C T O M Y
C O N D O M O N LY
C O N D O M P L U S O T H E RM E T H O D
W I T H D R AWA L
F E M A L E S T E R I L I Z AT I O N
O T H E R F E M A L EM E T H O D S O N LY *
In Their Own Right The Alan Guttmacher Institute
Chapter 4
4445
Reliance on vasectomy increases rapidly in men’s late 30s, but femalemethods provide the greater part of overall protection.
CHART 4.4

more concerned about avoiding preg-
nancy (Chart 4.4).29
The relatively high proportion of
married and cohabiting men in their
late 30s not using any method
(17%) probably reflects that some of
these men or their partners are infer-
tile, and that some are having inter-
course with women who are pregnant
or trying to get pregnant. Among sex-
ually active women in their early
30s—the group most likely to be the
partners of men in their late 30s—
about 20% are not using a contra-
ceptive method, and these same rea-
sons account for two-thirds to three-
quarters of their nonuse.30 That still
leaves some nonusers (men and
women) at risk of an unintended
pregnancy—that is, fertile, not preg-
nant or wanting a pregnancy, and
using no method. Nearly half of
unintended pregnancies in the
United States (47%) occur among
couples who do not want a pregnan-
cy but are not using a contraceptive method.31
Most Men in Their 30s and 40s AreBuilding Families
In their 30s, one-third of men have no children,
but this proportion drops to 15% in men’s 40s. At
the same time, the proportion of men with three
or more children rises from 20% to 31% (Chart
4.5).32
By age 45–49, when future fathering is very
unlikely, men have had an average of 2.1 chil-
dren. The number is slightly higher than average
among poor and minority men, and slightly lower
among higher-income men. It is also somewhat
smaller than the average number of children men
report as their ideal—2.5.33
Men often say they have had fewer children
than the data for women suggest is the case.
Some men—particularly young and unmarried
men—tend to underreport, or fail to report, the
number of children they have had, especially if
they are not living with them.34 It is also possible
that some unmarried women who become preg-
nant and keep the child do not tell the father, or
that some men do not wish to acknowledge chil-
dren they have fathered outside of marriage or in
an earlier relationship.
Men in their 30s are responsible for an esti-
mated 1.5 million births each year; men in their
40s, for an estimated 213,000 births—almost as
many in total as men in their 20s. Forty-four per-
cent of infants born each year in the United
States were fathered by men 30 and older (Chart
4.6, page 46).35 Whereas women finish child-
bearing by the end of their 40s, a very small
number of men father children well after this age
(Table 3a, page 34).36
Some 15–20% of men in their 30s who father
children are not married to the child’s mother
(Table 2c, page 25).37 However, some of these
men are in a cohabiting relationship with her.
Overall, 8% of the 19.6 million American chil-
dren with unmarried parents are living with both
SOURCE: TABLE 4.5, PAGE 86.
B I O L O G I C A L C H I L D R E N
0 1 ≥ 32
% O F M E N
0 2 0 1 0 04 0 6 0 8 0
M E N 3 0 – 3 9
M E N 4 0 – 4 9
CHART 4.5From men’s 30s to their 40s, the proportionwith no children drops steeply and theproportion with three or more rises.

of their biological parents.38
Because of divorce, separation, remarriage,
recombined families, infertility and adoption,
many men at some point in their lives act as
fathers to children who are not biologically their
own. On average, men in their early 30s are
fathers to 1.2 biological children plus 0.2
stepchildren, foster children or adopted children;
both numbers rise as men age (Chart 4.7). The
likelihood of becoming a father to more than just
one’s biological children is pretty much the same
for men of all racial and ethnic backgrounds (not
shown).39
Some Men Never Have Children
As men and their partners age, they face an
increased risk of not being able to have a child.
Women between the ages of 35 and 44 are four
times more likely than those 25–34 to report that
they or their partners have some kind of fertility
impairment.40
But men can be childless for reasons other
than their own or their partner’s infertility. They
may not want to become a parent, may have never
been in a relationship with somebody with whom
they wanted to have a child or may have a partner
who does not want a child. True childlessness
among men can be measured only once the bio-
logical possibility of fathering children has ended;
as a result, it is extremely difficult to obtain reli-
able estimates of the proportion of American men
who are infertile, as compared with the proportion
who have not had children by choice.
Not All Births Involving Adult Men Are Intended
Around two-thirds of men in their 30s and early
40s say they wanted their most recent child. The
rest felt either that the birth occurred at a time
they did not want a child or that they did not
want to have a child (or another child). Among
men in their 30s and early 40s, about one-third
of births are unintended (Table 4a, page 48).41
A substantial proportion of men’s partners
resolve unintended pregnancies by abortion.
Roughly one in five pregnancies involving men in
their 30s end in abortion, as do one in three of
those involving men in their 40s (Table 4b,
page 48).42
Men in their 30s are responsible for an esti-
mated 373,000 pregnancies ending in abortions;
men in their 40s, for 110,000. Overall, men 30
and older account for one-third of abortions per-
formed each year in the United States (Chart
4.6).43 Given that more than half of men in their
30s and more than eight in 10 in their 40s want
no more children, this is not surprising.
In Their Own Right The Alan Guttmacher Institute
Chapter 4
4647
CHART 4.6
SOURCE: TABLE 4.6, PAGE 86.
3 0 – 3 4
3 5 – 3 9
≥ 4 0
A L L O T H E R
25
145
8
1511
3 . 9 M I L L I O NT O T A L U . S . B I R T H S , 1 9 9 4
1 . 4 M I L L I O NT O T A L U . S . A B O R T I O N S , 1 9 9 4
M E N ' S A G E ATC O N C E P T I O N
Forty-four percent of births and 34% of abortions involve men in their 30s and 40s.

Some Men in Their 30s Live Apart fromTheir Children
Although 66% of men in their 30s have fathered
children, only 55% live with a biological child
(53% also with the child’s mother and 2% with-
out her). At age 40–49, 87% of men are biologi-
cal fathers, but only 62% live with a biological
child (59% also with the mother and 3% without
her).44
When fathers in their 30s are not living with
their biological children, the main reasons are
probably that the children were born outside mar-
riage or the parents were married but have sepa-
rated or divorced. However, in men’s 40s, some of
the gap between fatherhood and coresidence with
children is also attributable to the fact that chil-
dren are beginning to leave home.
The events that break up families—nonmarital
childbearing, separation, divorce and remarriage—
do not always affect men and women in the same
way. For example, 11% of men in their 30s, com-
pared with only 4% of women, have children but
are not living with them. And only
2% of men in their 30s, compared
with 17% of women, live in house-
holds with children but no spouse or
partner.45 Overall, 1.8 million chil-
dren—4% of all American children
younger than 18—live with their
father alone.46
Black men in their 30s are the
least likely to be living with a spouse
or partner and children. They also
are more likely than white or
Hispanic men to have children but
not be living with them (23%, 9%
and 6%, respectively).47 Black
men’s higher levels of poverty,
unemployment and incarceration,
and lower levels of marriage, are all
likely to contribute to their reduced
likelihood of living with their biologi-
cal children.
An author who has compared the
living arrangements of men and
women in the 1990s comments that “ties
between parents and children are increasingly
convoluted, especially for men. Increasingly,
men…face complex decisions about allocating
resources to children from different unions who
live in different households.”48
Two-thirds of the 11 million fathers who do not
live with their children do not pay formal child
support. Of these approximately seven million
fathers, an estimated 4.5 million have no obvious
financial reason not to do so, but the remaining
2.5 million are poor themselves and without any
of the supports that society offers poor mothers.49
Fifteen percent of custodial parents in the
United States are men. Seventy-six percent of
men with custody of their children are white,
10% black and 14% Hispanic. Forty-five percent
are divorced (as are 31% of custodial mothers),
25% are still married to the child’s mother, 18%
were never married to her and 12% are separated
or widowed.50 Thirty-two percent of custodial
mothers with written agreements say the nonresi-
SOURCE: TABLE 4.7, PAGE 86.
3 0 – 3 4
3 5 – 3 9
40–44
4 5 – 4 9
M E N ' S C H I L D R E N
B I O L O G I C A L A D O P T E D , F O S T E RA N D S T E P C H I L D R E N
AV E R A G E N O . O F C H I L D R E N
0 0 . 5 2 . 51 1 . 5 2 3
Fatherhood may encompass more than aman’s biological children.
CHART 4.7

dent fathers have not spent any time with their
children in the past year, but 24% report that the
fathers see their children at least once a week.51
Men of All Ages Play an Increasing Role in Helping Raise Children
Because of the rapid rise in the labor-force partici-
pation of women with young children, the high cost
of private child care and the general unavailability
of high-quality, affordable child care in the United
States, men now spend more time than their
fathers did in helping care for young children.
Time diary estimates collected in 1995 indi-
cate that married men with children younger than
18 spend an average of one hour more a day with
them than comparable men did 30 years earlier.
In 1965, these fathers spent half the time moth-
ers did; in 1998, they spent two-thirds the time.
Nevertheless, mothers still spend twice as much
time as fathers doing nothing but taking care of
SOURCE: REFERENCE 42.
In Their Own Right The Alan Guttmacher Institute
Chapter 4
4849
TABLE 4a
SOURCE: REFERENCE 41.
AGE % OF BIRTHS THAT ARE UNPLANNED
TOTAL MISTIMED UNWANTED
25–49 38 21 17
25–29 49 34 1530–34 35 20 1535–39 32 15 1740–44 38 9 2945–49 21 4 17
NOTE: PERCENTAGES ARE BASED ON MEN WHOSE PARTNERS HAD A CHILD BETWEEN THE 1987–1988 AND THE 1992–1994 WAVES OF THE NATIONAL SURVEY OF FAMILIES AND HOUSEHOLDS.
Most pregnancies involving men in their 30s and 40s end in a birth.TABLE 4b
AGE AT NO. OF % DISTRIBUTION, BY OUTCOMECONCEPTION PREGNANCIES,
1994 * BIRTHS ABORTIONS TOTAL
30–34 1,195,000 82 18 10035–39 686,000 77 23 10040–49 323,000 66 34 100
*DOES NOT INCLUDE PREGNANCIES ENDING IN MISCARRIAGES.
As men age, they are involved in fewer mistimed and more unwanted births.

children.52 Because the information on which
estimates like these are based comes from mar-
ried couples, the findings do not take into consid-
eration the situation of unmarried fathers, now a
substantial proportion of fathers. Unmarried
fathers probably spend less time, on average, with
or taking care of their children simply because
many are not living with them.
One in four married fathers were helping care
for the 10 million preschool children whose moth-
ers were working in 1993. Men younger than 25,
those living in the Northeast, poor men, those not
employed and those working in service industries
are the most likely to contribute to the care of
small children with working mothers. Fathers
accounted for 16% of this type of care, grand-
mothers and other family members for 26%,
organized day care facilities for 31%, informal
baby-sitters for 21% and mothers themselves
(mostly those working at home) for 6%.53
Most working women also expect men to
assume a larger share of housework. In 1995,
women spent less time doing housework than
their counterparts did in 1965, a decline from 30
hours per week, on average, to 18. Much of this
drop is because more women now are working
full-time, but some of it may stem from the avail-
ability of labor-saving devices and take-out foods,
women’s greater ability to employ outside help
and less-meticulous housekeeping standards. Over
the same period, on the other hand, men have
doubled the number of hours they spend on
housework (from five to 10 hours each week, on
average). As a result, the total hours spent by
both partners has declined only from 35 to 28 in
the past 30 years.54

Eight in 10 adults living with AIDS in theUnited States are men. More than one in 10men who had AIDS diagnosed in 1999 wereexposed to HIV through heterosexual activity.
Reported rates of chlamydia andgonorrhea reach 500–600 per 100,000 menin their early 20s, levels that are much higherthan those of men in their 30s or older.
Compared with white and Hispanic men,black men have twice as high a level ofinfection with herpes, and probably haveseveral times the rates of bacterial STDs.
Nine in 10 men have heard of HIV, AIDS,gonorrhea and syphilis, but far fewer knowabout genital warts and are aware thatchlamydia can infect men. Men’s knowledgeof effective measures for preventing STDs is sketchy.
Condom use has almost doubled since theearly 1980s, but men’s reliance on thismethod drops as they mature. Half of menwho use condoms do so for birth control, notSTD protection.
Chapter 5
Sexually TransmittedDiseases andCondom Use
In Their Own Right The Alan Guttmacher Institute
Chapter 5
5051

“Considering the high levels of STD incidence, [condom] use is probablyinadequate in level and in consistency at all ages.”
The personal, societal and economic costs of sex-
ually transmitted diseases (STDs) are enormous
and growing. Some common and treatable STDs
are often little more than a nuisance if treated
without delay, even though the infected person
probably finds them an indignity or source of
embarrassment. Some infections are of short
duration and can be self-resolving, while others
have serious long-term consequences if untreated.
The newest infection, HIV, has no cure, even
though new drug therapies can delay the onset
of AIDS.
The spread of an STD is determined largely by
how infectious the bacterium or virus involved is,
the number of individuals in a community who are
infected, the ability of infected individuals to
obtain treatment, and prevailing patterns of sexual
behavior within and beyond population sub-
groups—particularly, the rate at which individuals
acquire new partners, the level of concurrent part-
nerships and the type of sexual activity people
engage in. Some of the factors associated with
modernity and technological progress—people’s
increased mobility, worldwide travel, the break-
down of barriers between social classes and
changing sexual mores—also help expand and
accelerate transmission.
Although sexual activity is the major route for
the transmission of STDs, a small proportion of
people acquire these diseases through infected
blood products, injection-drug use or mother-to-
fetus transmission.
Viral STDs Are Long-Term Infections and CanHave Severe Consequences
Three infections—HIV, genital herpes simplex
virus (HSV) and human papillomavirus (HPV)—
account for the bulk of viral STDs in the United
States. As with viral infections in general, these
three diseases, once contracted, cannot be eradi-
cated from the body.
HIV and AIDS
As of June 2000, according to the Centers for
Disease Control and Prevention (CDC), an estimat-
ed 308,000 adult Americans of both sexes were
living with AIDS, and 118,000 were living with
HIV infection. Virtually all Americans living with
AIDS or HIV (99%) are adults, and eight in 10
are men.1 These figures are known to be serious
underestimates, and experts believe that about
300,000 more Americans have been infected with
HIV but are unaware of it.2
Of men who received AIDS diagnoses in 1999,
53% had been exposed to HIV infection by having
sex with other men, 27% through injection-drug
use and 6% through both means. Thirteen per-
cent had been exposed through heterosexual
activity—three times the proportion in the early
1990s and six times that of the mid-1980s.3
There is no way of knowing when the men with
AIDS who contracted HIV through heterosexual
activity became infected. However, 16% of all
men who have had AIDS were in their 20s when
they received the diagnosis, 45% were in their
30s, 27% were in their 40s and 11% were 50 or
older.4 Before the introduction of antiretroviral
therapies to slow and perhaps halt the progression
of HIV into AIDS, a latency period of about 10
years separated infection with HIV from the devel-
opment of AIDS. Using 10 years’ latency as a
yardstick, an estimated six out of 10 men with
AIDS today would have been in their teens and
20s when they were infected.
The AIDS epidemic disproportionately affects
minorities. Thirty-nine percent of people living
with AIDS are white, 40% are black, 20% are
Hispanic and 1% are members of other racial or
ethnic groups.5 Furthermore, while 13% of men
with new AIDS diagnoses in 1999 contracted the
disease heterosexually, this is true for 5% of white
men, 14–16% of Hispanic men and of Asian/
Pacific Islanders, and 18% of black men.6

HIV is now the third leading cause of death
among black males 25–34 (after homicide and
accidents) and the second leading cause among
black men 35–44 (after heart disease).7
Genital Herpes
An estimated one million new cases of genital
herpes occur each year among men and women in
the United States.8 The disease, like other genital
diseases that produce sores, is believed to facili-
tate the transmission of the AIDS virus.9 Genital
herpes also causes problems for pregnant women,
since babies can be infected during their passage
through the birth canal if HSV is present.
The prevalence of genital herpes rose by 30%
between 1976–1978 and 1988–1994; it
increased fivefold among white
teenagers.10 Because genital herpes
cannot be cured (although the duration
of the outbreak can be shortened with
antiviral therapies11), many millions of
Americans of both sexes are infected
with this virus, even though the disease
is dormant in most of them. Prevention
of genital herpes is complicated by the
fact that many people do not know that
after a primary outbreak, the infection
is communicable even if it is latent.
One in six U.S. men 15–49 have
genital herpes—which translates into
about 11 million infected men (Chart
5.1). The prevalence of this disease is
highest among poor men and black
men. Prevalence rises with age and
with the number of lifetime sexual
partners a person has had, and is high-
er among people who did not complete
high school than among those with
some college education (not shown).12
HPV
An estimated five million new cases of
HPV—the medical label for what is
commonly known as genital warts—
occur among men and women each
year. It is estimated that at least 20
million Americans are infected with the dis-
ease,13 but data specifically on the prevalence of
HPV among men are lacking. Studies carried out
in other countries show that prevalence can be as
high as 17–30% among young men.14
Ulcerative genital warts, like genital herpes,
can facilitate the transmission of HIV; certain
types of HPV are strongly associated with cancer
of the cervix among women and with anal cancer
among people who have anal sex. Genital warts
also threaten infants born to infected mothers.
Bacterial STDs Can Be Cured, but Many Men AreUnaware That They Have Been Infected
Sexually active Americans are also at risk of three
major bacterial STDs—chlamydia, gonorrhea and
In Their Own Right The Alan Guttmacher Institute
Chapter 5
5253
SOURCE: TABLE 5.1, PAGE 87.
A L L
POOR
L O W - I N C O M E
W H I T E
M E X I C A N A M E R I C A N
B L A C K
B E T T E R - O F F
M O D E R AT E - I N C O M E
% O F M E N 1 5 – 4 9 W I T H H E R P E S
0 10 20 30 40 50
CHART 5.1Genital herpes is most commonamong men who are poor or black.

syphilis. These infections can be successfully
treated with antibiotics.
Chlamydia has been recognized as an STD only
since the 1970s. Sexually active men are often
unaware that they have been infected, so there
are men in the general community with undiag-
nosed, and therefore untreated, disease. If the
infection goes untreated, it can cause sterility in
men and can have serious health consequences
for women (pelvic inflammatory disease, which
may lead to ectopic pregnancies, infertility and
chronic pelvic pain).15
Gonorrhea—which used to be referred to as
“the clap”—has been known since ancient times.
It is highly infective and is easier to detect among
men than among women. Gonorrhea usually
affects the urogenital tract, but can also spread to
other areas of the body. Infected pregnant women
are at risk of having a spontaneous abortion, pre-
mature rupture of membranes and premature
delivery, and their newborns may have eye infec-
tions. Treatment of gonorrhea with antibiotics is
highly effective in most cases, although some
strains of the bacterium are now drug-resistant.
When gonorrhea is suspected, most authorities
recommend the immediate treatment of an infect-
ed person’s partners from the prior
2–4 weeks even before a definitive
diagnosis is made.16
Syphilis was endemic in Europe in
the late 15th century, and the natural
history of the disease has been known
since the 19th century. Because of the
successful use of penicillin and other
antibiotics, incidence levels of this
once widely feared disease have
reached all-time lows in Europe and
the United States, even though the
disease remains a problem in some
southern states. The long-term effects
of untreated syphilis involve the insidi-
ous deterioration of the central nerv-
ous system.17
Young Men and Black Men Are atGreatest Risk of ContractingBacterial STDs
National estimates of bacterial STD
cases are based on reports collected
by the CDC from state public health
authorities. However, the reports do
not represent the complete count of
new cases, because some states do
not report chlamydia, and one state
does not report syphilis. And even in
states that report to the CDC, public
clinics probably provide more com-
plete reports than do private doc-
tors.18 As a result, more affluent men,
Men in their teens and 20s are the most likelyto contract chlamydia and gonorrhea.
SOURCE: TABLE 5.2, PAGE 87.
CHART 5.2
1 5 – 1 9
2 0 – 2 4
25–29
3 0 – 3 4
4 5 – 5 4
4 0 – 4 4
3 5 – 3 9
D I S E A S EC H L A M Y D I A G O N O R R H E A
R AT E O F N E W I N F E C T I O N S P E R 1 0 0 , 0 0 0 M E N , 1 9 9 9
0 1 0 0 2 0 0 3 0 0 4 0 0 5 0 0 6 0 0 7 0 0

who probably seek treatment privately, are under-
counted to a greater extent than those who are
less well-to-do. The counts are also incomplete
because many infected men with no obvious
symptoms have no reason to seek a diagnosis,
which means that their infections are not count-
ed. This is truer of chlamydia than of gonorrhea
and syphilis. An estimated 50% of chlamydia
cases and 30% of gonorrhea cases (male and
female) are not reported, although the reporting of
syphilis is generally considered more complete.19
Reported rates of gonorrhea and chlamydia are
higher among men in their early 20s (roughly
500–600 new cases a year per 100,000) than
among other age-groups. Rates of both diseases
are high also among teenagers (about 340 per
100,000), and gonorrhea is at a similar level
among men in their late 20s (Chart 5.2, page
53).20 Younger men’s high rates of these diseases
are attributable to their elevated likelihood of hav-
ing multiple sexual partners during those years in
which few are married (Table 5a).21
The reported incidence of both gonorrhea and
chlamydia is many times higher among black men
(451 and 944 cases per 100,000, respectively)
than among Hispanic men (148 and 74 per
100,000) and white men (34 and 22 per
100,000). These wide differentials are hard to
explain. The fact that most minority men receive
STD care from publicly funded clinics with very
complete reporting levels22 undoubtedly con-
tributes to the disparity. Other factors include
black men’s higher poverty and more limited
access to general health care, their involvement in
sexual networks with high infection levels, their
relatively low likelihood of being married and their
high likelihood of having multiple sexual partners.
Men’s Knowledge of STDs Is Rather Uneven
More than nine in 10 men aged 20–39 in 1991
had heard of HIV and AIDS, gonorrhea and
syphilis. However, only two in three knew about
genital warts, and only one in three understood
that a man can become infected with chlamydia.
Eight in 10 knew that the pill and vasectomy do
not provide any protection against STD transmis-
sion, that the condom offers good or very good
protection and that monogamy is a highly effec-
tive way of reducing the chance of contracting
HIV.23 Only half of adolescents in 1995 knew
that it is possible to be infected with genital
herpes, gonorrhea or chlamydia, yet have no
symptoms.24
These findings suggest that although American
men’s knowledge of STDs is incomplete, their
knowledge of how to protect themselves from pos-
sible infection by using condoms is somewhat
better.
In Their Own Right The Alan Guttmacher Institute
Chapter 5
5455
TABLE 5a
SOURCE: REFERENCE 21.
AGE % DISTRIBUTION, BY NUMBER OF PARTNERS, 1992
0 1 2 3–5 ≥6 TOTAL
15–19 11 44 26 15 4 10020–29 4 64 11 16 5 10030–39 3 80 8 7 2 10040–49 5 83 8 4 0 100
Sexually experienced adolescents are more likely than adult men to havehad two or more partners in the past year.

Condom Use Has Been on the Rise
The proportion of couples using the condom by
itself rose from 12% in 1982 to 15% in 1988
and then to 20% in 1995.25 Increases were
steepest among couples who were not married or
cohabiting—from 16% in 1988 to 30% in
1995.26 These trends underestimate overall con-
dom use, because many couples use condoms in
combination with another method. Taking dual
use into account, the proportion using the con-
dom is very high among sexually active teenagers
(nearly seven in 10 at ages 15–17) and still quite
high among men in their early 20s (four in 10),
but is no more than two in 10 among men in
their 30s (Chart 5.3).27 Considering the high lev-
els of STD incidence, use is probably inadequate
in level and in consistency at all ages.
The increased use of condoms in the United
States has probably been spurred in large part by
growing concerns about HIV and
other STDs. Consistent condom use
has been estimated to be effective
99% of the time in preventing het-
erosexual HIV transmission.28 The
failure to prevent transmission is due
largely to inconsistent use, or to slip-
page and other problems, rather than
to the method itself.29
Men’s Attitudes Toward the CondomAre Mixed
Although men know that the condom
is effective against STD transmis-
sion, many say the main reason they
use this method is for birth control.
Among men 20–39 using the con-
dom, 49% use it for birth control
only, 43% to prevent both pregnancy
and STDs, and 8% for STD preven-
tion only.30 Most adolescent men
who use the condom—83%—do so
only to prevent pregnancy; 12% use
it to prevent infection, 2% for both
reasons and 3% because their part-
ner requested it.31 Of course, what-
ever the user’s intent, condoms provide protection
against both pregnancy and most STDs.
Despite its dual efficacy, men’s opinions about
the condom are not all positive. Many complain
that it reduces their sexual pleasure. Some men
find it embarrassing to buy condoms or put one
on in front of their partner. Others dislike having
to discuss condom use before sex. And some men
are fearful of losing an erection when they inter-
rupt lovemaking to put on a condom.32
A national study of 17–22-year-old men who
used condoms found that 23% had had at least
one condom break in the previous 12 months,
and 2–3% of all condoms used had broken.
Young men who had recently taken a sexuality
education course were less likely than average to
experience condom breakage, whereas men who
had ever had an STD (or whose partners had) and
men from households with incomes below
SOURCE: TABLE 5.3, PAGE 87.
1 5 – 1 7
1 8 – 1 9
20–24
2 5 – 2 9
3 5 – 3 9
3 0 – 3 4
U S E AT L A S T I N T E R C O U R S E I N T H E P A S T M O N T H
C O N D O M O N LY C O N D O M P L U S O T H E R M E T H O D
% O F S E X U A L LY A C T I V E M E N
0 2 0 4 0 6 0 8 0 1 0 0
Use of the condom is quite high at youngerages but declines as men get older.
CHART 5.3

Although the focus of this report is the sexual behavior ofmen who have sex with women, any future, more compre-hensive, overview of male sexual behavior should includemen who have sex with men. Unsafe sexual practices havegrave health implications for many of these men.
Homosexuality is variously defined on the basis of threecomponents—identity, desire and behavior.1 Same-sexbehavior does not always correspond with same-sex identi-ty. For example, in 1995, 61% of young men 15–19 whosaid that they had ever engaged in same-sex behavioridentified themselves as “100% heterosexual or straight,”and 4% as “mostly” or “100%” homosexual. Five percentwere unsure of their sexual orientation, and 30% identifiedthemselves as mostly heterosexual or bisexual.2
Given the fluidity of these definitions, it is extremely difficultto obtain accurate information on the proportion of men whohave sex with men. From men’s own reports, the proportionappears to be low, but it is probably understated because ofthe widespread social stigma attached to homosexuality. Thefollowing are among the best estimates available:
In the 1991 National Survey of Men, 2% of 20–39-year-olds reported that they had engaged in any same-sex activi-ty in the previous 10 years, and 1% reported havingengaged exclusively in same-sex relations during this time.3
In 1992, the National Health and Social Life Survey foundthat 9% of men 18–59 had had sex with a man at leastonce since puberty, but only 3% identified themselves ashomosexual or bisexual.4
In the 1995 National Survey of Adolescent Males, 5% of15–19-year-olds said they had ever engaged in any sexualactivity with a man, ranging from masturbation to analintercourse.5
Relationships and family situations vary among men whohave sex with men. Most have had vaginal intercourse atleast once.6 About three in 10 are currently living with amale partner, and two-thirds have ever lived with a malepartner. Almost one in three men currently in a same-sexrelationship were previously married. Five percent of gaycouples have children living with them.7
In the 1990 National AIDS Behavioral Study, 24% of 18–49-year-old men who have sex with men said they had had nopartners in the previous year, 41% had had one and 35%had had two or more.8
After a Decade of Decline, the Incidence of AIDSCould Increase Again Among Certain Groups After peaking at more than 40,000 new cases in 1992, AIDSincidence among men who have sex with men declined toabout 20,000 in 2000.9 There is no way of knowing howmuch of this decline can be attributed to the efficacy ofnew antiretroviral drugs in slowing the progression of HIVto AIDS, and how much to increases in safer sexual prac-tices among men who have sex with men starting in theearly 1990s. Some observers believe that impressiveincreases in condom use and declines in the number ofpartners among men who have sex with men,10 along with adramatic increase in public and private HIV prevention andeducation programs in the hardest-hit communities,11
should take credit for part of the reduction in AIDS levels.
However, some research suggests that the success of anti-retroviral therapies in prolonging life and improving thehealth of HIV-infected people might have had the effect ofmaking some men who have sex with men less vigilantabout safer sex12 and more complacent about AIDS,13
which could lead to a resurgence of the epidemic amongcertain groups. In a large study of gay men in SanFrancisco, the proportion who had engaged in anal sexincreased between 1994 and 1997 (from 58% to 61%),whereas the proportion reporting that they always usedcondoms declined (from 70% to 61%).14
Similarly, even though the incidence of rectal gonorrheaamong men who have sex with men declined in the early1990s, it rose from 21 to 38 new cases per 100,000 menbetween 1994 and 1997.15 Gonorrhea is believed to facili-tate the transmission of HIV. Statistics collected from STDclinics in 29 U.S. cities and counties between 1992 and 1999show that the proportion of gonorrhea cases attributable tosexual activity between men increased from 5% to 13%—a pattern that also suggests increasing rates of unsafesexual behavior among men who have sex with men.16
In Their Own Right The Alan Guttmacher Institute
Chapter 5
5657
MEN WHO HAVE SEX WITH MEN

$60,000 were more likely.33
But some reasons for men’s reluctance or
inability to use the condom are not related to
characteristics of the method:
Couples in relationships going on for less than
six months are more likely to use the condom
than those in much longer relationships.34 In one
survey, two in 10 adult men in an ongoing sexual
relationship, compared with six in 10 of those in
a casual relationship, used condoms. Seventy-two
percent of men in ongoing relationships said they
did not use condoms because they were having
sex with only one person. In contrast, the most
common reason given by men in casual relation-
ships was that a condom was not handy or avail-
able at the time of intercourse (37%).35
Condom use among adolescent men is likely to
decline as a relationship continues. If a new sexu-
al relationship begins, use often picks up again.36
Couples in which the man expects his partner
to assume the primary responsibility for contra-
ception are less likely to use a condom than are
those in which the man believes that he has
greater responsibility for contraception.37
Adolescent men with traditional attitudes
toward masculinity have more sexual partners,
less-intimate sexual relationships and a stronger
belief that relationships between men and women
are basically adversarial. This constellation of atti-
tudes is often associated with lower and less-
consistent use of condoms, with a weaker belief
that it is the man’s role to prevent pregnancy and
with a stronger belief that pregnancy validates a
man’s masculinity.38

There is no commonly agreed upondefinition of sexual and reproductive healthcare for men, and many barriers to theprovision of such care exist at the individual,economic and structural levels. The conse-quences of not effecting change on all thesefronts are too serious to be dismissed.
Obstacles to care include the tendency ofmany men not to seek regular, routine check-ups; the fact that health insurance, in boththe private and the public sectors, often doesnot cover the types of services men need,especially information and counseling; andthe high proportions of men—particularlypoor men—who do not have health insurance.
Few health professionals are specificallytrained to provide men with sexual andreproductive health education and services.
Men’s service needs change as they movethrough the reproductive life stages. Theolder men get, the more likely they are toneed medical sexual and reproductive healthservices rather than information.
At all ages, sexually active men, particu-larly those who do not use a condom andhave multiple partners, need regularscreening for sexually transmitted diseases.
Chapter 6
In Their Own Right The Alan Guttmacher Institute
Chapter 6
5859
Sexual andReproductive HealthInformation andServices for Men

Because men do not get pregnant or bear children
and because condom use is possible with no med-
ical monitoring, men’s sexual and reproductive
health needs are not as obvious, as directly relat-
ed to reproductive events or as clearly medical as
women’s. Nevertheless, from adolescence on,
most men need information and counseling about
sexual and reproductive health matters, and they
need somewhere reliable to go for related educa-
tion and health care.
At a minimum, all men need information and
education about contraceptive use, pregnancy and
childbearing, sexually transmitted diseases (STDs)
and how to avoid them, where to obtain and how
to use the condom correctly, and how to talk
about these issues with partners. In terms of their
medical needs, all men should have access to
routine screening and treatment for STDs, the fre-
quency of which would depend on their level of
exposure to these infections. Some older men will
also require surgical services for vasectomy,
screening and treatment for reproductive cancers,
and infertility treatment.
Information and Education Are Essential,Particularly for Younger Men
Early in their teenage years, and probably even
sooner, young men need accurate, unbiased,
straightforward information and advice about sex-
ual and reproductive health matters from people
or institutions they trust. Adolescents, particularly,
need information about puberty, male and female
sexual development, gender and sexual identity.
They also need skills in resisting peer pressure,
avoiding sexual violence (whether as victims or as
perpetrators), building relationships and commu-
nicating with young women about personal and
sexual matters.
One might assume that young men learn what
they need to know about sex and sexuality from
their friends and parents, or at school. But friends
are often an unreliable source of information, and
a great many parents do not feel up to the task of
teaching their children all they need to know.1
Most school curricula include sexuality education,
although vocal opponents in some communities
believe that this subject should be left to parents
and religious counselors. If schools provide sexu-
ality education, these critics believe that the cur-
riculum should stress refraining from intercourse
altogether as the only effective way of avoiding
pregnancy and STDs; in their view, it should also
teach that contraceptives and condoms are inef-
fective at preventing pregnancy and STDs.
Almost six in 10 adolescent men 15–18 say
they have discussed AIDS with their parents, and
four in 10 say they have talked about STDs or
birth control.2 However, boys are significantly less
likely than girls to have discussions about sexuali-
ty with a parent.3 This might be because parents
are most likely to talk about sex with their off-
spring of the same sex, and mothers are much
more likely than fathers to have conversations of
this kind.4
The reluctance of many parents and children to
talk to each other about sexual matters and the
ever-widening range of up-to-date information that
young people need clearly leaves an important
role for schools. Virtually all young men 15–19
have taken reproductive health education courses
at school.5 Most sexuality education teachers in
grades 7–12 teach their students about HIV and
other STDs, abstinence from sexual intercourse
and the skills needed to resist peer pressure to
have intercourse. These topics are more likely to
be included in the sexuality education curriculum
than they were 10 years ago. But fewer teachers
now cover birth control methods, abortion, ethical
issues relating to abortion, and where students
can go for birth control and STD services.6
The decline in teaching about birth control and
abortion does not reflect most parents’ wishes.
More than 90% of parents of secondary school
students want schools to cover the basics of preg-
“The availability of [information for men] in any widely accepted institutional orprofessional context is striking mainly for its absence.”
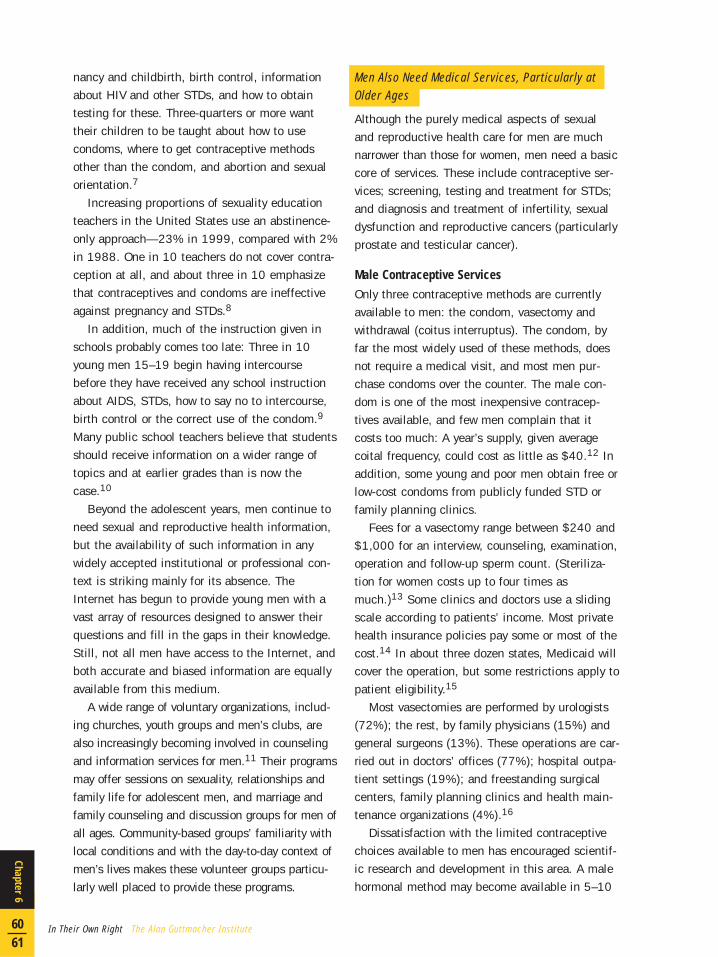
nancy and childbirth, birth control, information
about HIV and other STDs, and how to obtain
testing for these. Three-quarters or more want
their children to be taught about how to use
condoms, where to get contraceptive methods
other than the condom, and abortion and sexual
orientation.7
Increasing proportions of sexuality education
teachers in the United States use an abstinence-
only approach—23% in 1999, compared with 2%
in 1988. One in 10 teachers do not cover contra-
ception at all, and about three in 10 emphasize
that contraceptives and condoms are ineffective
against pregnancy and STDs.8
In addition, much of the instruction given in
schools probably comes too late: Three in 10
young men 15–19 begin having intercourse
before they have received any school instruction
about AIDS, STDs, how to say no to intercourse,
birth control or the correct use of the condom.9
Many public school teachers believe that students
should receive information on a wider range of
topics and at earlier grades than is now the
case.10
Beyond the adolescent years, men continue to
need sexual and reproductive health information,
but the availability of such information in any
widely accepted institutional or professional con-
text is striking mainly for its absence. The
Internet has begun to provide young men with a
vast array of resources designed to answer their
questions and fill in the gaps in their knowledge.
Still, not all men have access to the Internet, and
both accurate and biased information are equally
available from this medium.
A wide range of voluntary organizations, includ-
ing churches, youth groups and men’s clubs, are
also increasingly becoming involved in counseling
and information services for men.11 Their programs
may offer sessions on sexuality, relationships and
family life for adolescent men, and marriage and
family counseling and discussion groups for men of
all ages. Community-based groups’ familiarity with
local conditions and with the day-to-day context of
men’s lives makes these volunteer groups particu-
larly well placed to provide these programs.
Men Also Need Medical Services, Particularly atOlder Ages
Although the purely medical aspects of sexual
and reproductive health care for men are much
narrower than those for women, men need a basic
core of services. These include contraceptive ser-
vices; screening, testing and treatment for STDs;
and diagnosis and treatment of infertility, sexual
dysfunction and reproductive cancers (particularly
prostate and testicular cancer).
Male Contraceptive Services
Only three contraceptive methods are currently
available to men: the condom, vasectomy and
withdrawal (coitus interruptus). The condom, by
far the most widely used of these methods, does
not require a medical visit, and most men pur-
chase condoms over the counter. The male con-
dom is one of the most inexpensive contracep-
tives available, and few men complain that it
costs too much: A year’s supply, given average
coital frequency, could cost as little as $40.12 In
addition, some young and poor men obtain free or
low-cost condoms from publicly funded STD or
family planning clinics.
Fees for a vasectomy range between $240 and
$1,000 for an interview, counseling, examination,
operation and follow-up sperm count. (Steriliza-
tion for women costs up to four times as
much.)13 Some clinics and doctors use a sliding
scale according to patients’ income. Most private
health insurance policies pay some or most of the
cost.14 In about three dozen states, Medicaid will
cover the operation, but some restrictions apply to
patient eligibility.15
Most vasectomies are performed by urologists
(72%); the rest, by family physicians (15%) and
general surgeons (13%). These operations are car-
ried out in doctors’ offices (77%); hospital outpa-
tient settings (19%); and freestanding surgical
centers, family planning clinics and health main-
tenance organizations (4%).16
Dissatisfaction with the limited contraceptive
choices available to men has encouraged scientif-
ic research and development in this area. A male
hormonal method may become available in 5–10
In Their Own Right The Alan Guttmacher Institute
Chapter 6
6061

years.17 When this happens, men’s service needs
will probably expand to include clinical screening,
prescriptions, monitoring and the kind of follow-
up that women taking the pill have been used to
receiving for more than 40 years.
Screening, Testing and Treatment for STDs
For STD screening to be cost-effective, clinicians
must know the general pattern of risk to which
each of their male patients is exposed. This
involves knowing, among other important back-
ground characteristics, the types of sexual behav-
ior a man engages in, the number of sexual part-
ners he has had in a recent time period and
whether he injects drugs. These, as it turns out,
are precisely the sensitive areas that many gener-
al practitioners are reluctant to broach with
patients. The professionals working in specialized
public health clinics to diagnose and treat STDs
may have less of a problem with such questions,
but many have little time to take a full history
and provide counseling.
Contact and follow-up with the sexual partners
of infected men are important aspects of the
process required to reduce or contain the spread
of STDs. Busy general practitioners and special-
ists are unlikely to have the time or interest to
carry out this next step, and most public health
clinics lack the resources.
Infertility
Little information is available about whether men
want but are unable to father a child. Of the esti-
mated 13% of men in their late 40s who have
never had children, some could have but did not
want to, while others may have wanted to but
could not.
An estimated 10% of women aged 15–44 are
unable to have a child (or another child) because
their fertility or their partner’s is impaired.18 Of
the approximately 6.7 million women 15–44 with
fertility problems in 1995, 42% had ever received
some form of infertility services. Of those who had
ever sought treatment, 22% reported that the
problem was their husband’s or partner’s (about
600,000 men).19
Reproductive Cancers
Prostate cancer is the most common nonskin can-
cer in U.S. men. It is very rare among younger
men—in 1996, three per 1,000 men younger
than 45 (or 241,000) had prostate disease diag-
nosed. However, the rate rises sharply thereafter,
to 30 per 1,000 men aged 45–64 (or 780,000)
and 134 per 1,000 men aged 65 and over (or
1.8 million). An estimated 180,400 new cases
and 31,900 deaths were expected in 2000.
Although the number of men with this disease is
large, the majority do not die of it. At all ages, the
incidence of prostate cancer among black men
exceeds that of white men.20
While both digital rectal examination and a
specific clinical test are reasonably effective for
the early detection of prostate cancer, a lack of
evidence that screening and treatment reduces
deaths from this cause has led many health
providers to stop screening men.
Nearly 70% of men who have been treated for
prostate cancer experience long-term sexual dys-
function (erectile dysfunction or loss of sexual
desire).21 One study raises the possibility that
prostate cancer may be linked to the number of
sexual partners a man has in his lifetime.22
Testicular cancer is the most common form of
cancer in young men between the ages of 15 and
35. An estimated 7,400 men in the United
States were expected to receive a diagnosis of
testicular cancer in 1999.23 This disease is four
times more common in white men than in black
men.24 Most cancers of this type are discovered
by men themselves, or by their partners, either
unintentionally or during self-examination.25
Sexual Dysfunction
What men mean by sexual dysfunction (impo-
tence, premature ejaculation, loss of sexual desire
and feeling a loss of manhood, for example) does
not always correspond with a clinical definition of
sexual dysfunction. In a 1992 survey, 32% of
men 18–59 reported ever having had at least one
symptom of sexual dysfunction, and the propor-
tion increased steadily with age.26 Sexual dys-
function is also associated with poor health in

Most attention to delivering sexual and reproductive healthservices to U.S. men has focused on adolescents, youngadults and gay men. There is no generally accepted stan-dard set of sexual and reproductive health information andservices for all men, but several organizations have begunto develop prototype sets of services for different targetgroups. The set presented below draws heavily from exist-ing ones and aims to present a comprehensive frameworkof the needs of all men.1 It is by no means definitive, but isintended to stimulate discussion and advance effortstoward a set of services that has the support of a cross-section of all who work in men’s sexual and reproductivehealth. At the same time, any prototype service set willneed to be tailored to meet the needs of particulargroups—for example, young men, disadvantaged men andmen who engage in high-risk behaviors. The five servicecategories reflect differences in sources and types ofservices, even though there is some overlap.
InformationBasic sexuality and reproductive health education
Normal anatomy and pubertal development, social andemotional development, reproductive biology, changes insexual function during the reproductive life span, sexualidentity and orientation
Genital health and hygienePenile hygiene, how to perform a testicular exam, prostatecancer awareness
Healthy relationshipsStages in romantic relationships; when sexual involvementis appropriate; forms of sexual expression; sexual coercion,abuse and violence; domestic violence; statutory rapeawareness; the influence of alcohol and other drugs onsexual behavior
Pregnancy preventionCosts and consequences of pregnancy, contraceptive meth-ods (including abstinence and condoms), effectiveness ofcontraceptives
Sexually transmitted diseases (STDs), including HIVDefinitions, symptoms, transmission, diagnosis, treatment,prevalence, consequences, prevention techniques
FatherhoodPaternal and maternal rights and responsibilities, prenatal
health, childbirth, child development and health, well-childcare, paternity establishment, child support, visitation,single fathers’ support groups, parenting behaviors thatpromote healthy adolescent adjustment
Where and how to obtain other servicesGenetic counseling, mastectomy partner counseling,services for those with disabilities, services for thoseexperiencing or perpetrating sexual abuse
SkillsPregnancy and STD prevention and sexual health skills
Self-advocacy, risk assessment and avoidance, decision-making, setting and achieving goals, resisting peer pressure, communicating with and listening to partners,selecting partners and avoiding unhealthy relationships,distinguishing between consent and coercion, violence pre-vention, partner intimacy, negotiating sexual activity, safersex and setting limits, how to use contraceptives properly,recognizing STD symptoms, how to obtain services andmore information
Fatherhood skillsParenting, life skills (e.g., securing a job, housing, medicalcare), training and opportunities for self-sufficiency, com-munication with child’s mother, health guidance on why andhow to talk to one’s children regularly about health-relatedbehaviors (including sexual health), involvement in child’shealth and well-child care services
CounselingSelf-concept
Self-esteem, sexual identity and orientation, gender roles,personal potential, awareness of vulnerability, confidencein the future, sense of control over one’s life and decisions,nurturance
Life events and decision-makingRelationships with sexual partners, the partner’s role inpregnancy, abortion, adoption, delivery and the postpartumperiod, contraceptive method choice, decision-makingregarding sterilization (male or female) and hysterectomy
Values and motivationRespect for others; role expectations; setting and achiev-ing life goals; parenting as a life goal; values regardingparenthood; values regarding “being a man”; support
A MODEL SET OF SEXUAL AND REPRODUCTIVE HEALTH INFORMATION AND SERVICES FOR MEN
In Their Own Right The Alan Guttmacher Institute
Chapter 6
6263

general, urinary tract symptoms, depres-
sion, deterioration of a man’s economic
position and other kinds of stress. In addi-
tion, men who were sexually abused as
children are three times as likely to expe-
rience erectile dysfunction and twice as
likely to experience premature ejaculation
as men who had no such experience.27
The range of factors associated with
men’s sexual dysfunction suggests a wide
array of treatment options. However, the
range also makes correct diagnosis and
appropriate treatment for the condition, or
conditions, complex issues. The new drug
Viagra (approved by the Food and Drug
Administration in 1998) is targeted at one
condition, erectile dysfunction. As of 2000,
more than six million prescriptions for Viagra
had been written in the United States.28
Men Need Skills and Counseling, as Well asInformation and Medical Services
More comprehensive definitions of men’s
reproductive health needs have been sug-
gested by various agencies working in the
field.29 Taken together, these contribu-
tions help create a framework for moving
toward a consensus on what constitutes a
model of appropriate sexual and reproduc-
tive health care for men (see box).
Although the framework is not organ-
ized in terms of men’s changing sexual
and reproductive needs as they age, most
of the needs listed in the first two cate-
gories—information and skills—will
emerge in men’s teenage and early adult
years. These needs are already being
addressed in schools and youth programs,
although not nearly at the level necessary.
Many counseling and information services
for young people are the responsibility of
nonmedical people—teachers, youth work-
ers, social workers and community volun-
teers—whose number and skills clearly
need to be upgraded.
The third and fourth categories in the
groups for young fathers; value of healthy lifestyle, sexuali-ty and relationships; mutual fidelity; concern for partner’shealth; women’s and men’s role in contraceptive practiceand pregnancy
Preventive Health Care Services Sexual and reproductive health history
Sexual activity and behavior; use of condoms and contra-ceptives; sexual orientation; number of partners in the lastsix months; history of exchanging sex for money or drugs,injecting drugs, engaging in sex with other males, having apartner at risk of STD infection, having an STD, beinginvolved in pregnancy, being sexually abused, or perpetrat-ing sexual abuse or domestic violence; desires or concernsabout fatherhood
Cancer evaluation screeningFamily history screening for prostate, testicular, colon andskin cancer
Substance abuse screening Mental health assessmentRoutine physical
Blood pressure, lipid profile, heart and lung exam, breastexam, urine sample, urinary difficulties, nutrition and diet,development assessment
Premarital blood testLinks to the provision of appropriate additional services
or referral if needed
Clinical Diagnosis and TreatmentTesting for STDs, including HIV (determined by the indi-
vidual’s risk factors and performed in conjunction withpretest and posttest counseling); diagnosis; treatment;counseling; partner referral
Diagnosis and treatment for sexual dysfunction (impo-tence, premature ejaculation, disorders of the reproductivesystem, lesions of the genital tract, hernias and varicocele)
Fertility evaluationHistory, semen analysis, paternity blood test, infertilityservices
Contraceptive servicesVasectomy
Treatment for urologic disease, vasectomy reversal

In Their Own Right The Alan Guttmacher Institute
Chapter 6
6465
framework—counseling and screen-
ing (particularly screening for
STDs)—are applicable to men of all
ages. All men should get a regular
physical checkup, including an
assessment of their sexual and
reproductive health status and
needs. Health maintenance organiza-
tions typically cover routine check-
ups, but these examinations may not
include an assessment of sexual and
reproductive health and its implied
health care needs.
Most health insurance plans—
health maintenance organizations and
other private plans—are likely to
cover male services that involve clini-
cal diagnosis and treatment. With
appropriate indications and referrals,
men with health insurance can proba-
bly obtain most of the screening pro-
tocols listed under their plan’s cover-
age. But any type of counseling service is likely to
be covered only under the most generous health
insurance plan, and men with no coverage are
unlikely to obtain counseling, checkups or referrals.
Men Currently Receive a Wide Range ofReproductive Health Services, but Are TheySufficient?
Many doctors seeing men for routine health care
do not bring up issues related to sexual and
reproductive health. In a 1992 survey of private
primary care physicians, 49% reported that they
always or usually ask their patients (both male
and female) about STDs, 31% about condom use,
27% about sexual orientation and 22% about the
number of sex partners they have had. Twenty-five
percent believe their patients would be offended
by questions of this type.30
Despite the apparent reticence of some doc-
tors, American men are receiving sexual and
reproductive health services. In the late 1990s,
men 15–49 made 8.4 million visits a year to
office-based physicians in which they received
care related to sexual and reproductive health.
They made another 1.7 million visits to hospital
outpatient departments and emergency rooms for
the same reasons. And 2% of the 4.5 million vis-
its made to publicly funded family planning clin-
ics in 1995—or 94,000 visits—involved men
obtaining counseling, education or supplies of
contraceptive methods.31 Finally, publicly funded
local health department clinics provide STD ser-
vices to an estimated 800,000 men annually.32
Altogether, men 15–49 make about 10.9 million
visits annually to private physicians’ offices, hos-
pital outpatient departments, emergency rooms
and publicly funded STD and family planning
clinics for sexual and reproductive health care.33
The most common reason for men to seek
reproductive health care is to obtain testing or
treatment services for HIV or other STDs: Fifty-two
percent of the 10.9 million visits that men make
each year are for these services. Prostate problems
account for the next largest share of visits (18%).
Only 8% of visits are for family planning—mostly
for vasectomy counseling or services. About one-
fifth of visits are for psychosexual care and for
other reasons—such as problems involving the
SOURCE: TABLE 6.1, PAGE 87.
T Y P E O F S E R V I C E
H I V / O T H E R S T D
P R O S T AT E
FA M I LY P L A N N I N G
P S Y C H O S E X U A L / O T H E R
5218
822
1 0 . 9 M I L L I O N A N N U A L V I S I T S , 1 9 9 6 – 1 9 9 8
CHART 6.1Testing and treatment for STDs, includingHIV, are the primary reasons men seek sexualand reproductive health care.

urinary tract, scrotum, penis or testicles (Chart
6.1).34 It is impossible to know whether this
distribution reflects the actual pattern of men’s
needs. The preponderance of visits for HIV and
other STDs partly reflects the frequent doctor
visits that men with AIDS must make to maintain
their health. However, other kinds of care related
to STDs undoubtedly represent a large
part of the medical services that many
men need.
Each year, men 15–49 (excluding
the 800,000 men receiving STD care
in public clinics) make an average of
14 sexual and reproductive health
care visits per 100. This rate increases
substantially with men’s age, from six
visits per 100 men aged 15–19 to 23
visits per 100 men aged 45–49. Black
men aged 15–49 make an average of
22 visits per 100 per year, about twice
the number made by men of other
races (Chart 6.2).35 Again, it is impos-
sible to evaluate how closely these
patterns reflect men’s actual needs.
Nevertheless, the rates seem particu-
larly low for adolescent men (all of
whom should at least be receiving a
medical assessment of their sexual
and reproductive health once a year)
and for men in their late 40s (all of
whom should probably be screened for
prostate cancer with some regularity).
A Lack of Health Insurance PreventsSome Men from Obtaining Care
Of almost 69 million American men
between the ages of 15 and 49, 23%
have no health coverage of any kind.
Men are more likely than women to
be without health insurance, and the
gap has widened a little in recent
years. The proportion of men without
health insurance peaks in men’s early
20s (37%) and drops to 14% among
men in their late 40s. Men aged
20–29 living in poor families are the
most likely to have no health insurance (59%),
but even at older ages, about half of poor men
have no coverage (Chart 6.3, page 66).36
Hispanic men are more likely to be uninsured
(45%) than are members of other racial and eth-
nic groups (31% of blacks, 21–26% of other
minority groups and 17% of whites).37 For men
SOURCE: TABLE 6.2, PAGE 87.
A L L
15–19
2 0 – 2 4
W H I T E
H I S P A N I C
B L A C K
3 0 – 3 4
3 5 – 3 9
4 0 – 4 4
2 5 – 2 9
A N N U A L N O . O F V I S I T S P E R 1 0 0 M E N 1 5 – 4 9
0 5 10 15 20 25
4 5 – 4 9
CHART 6.2
Older men and black men are the mostlikely to make sexual and reproductivehealth visits.

overall, the other main factors associated with a
lack of health insurance are being out of the labor
force, being unemployed, working part-time, work-
ing in a small company (especially one with fewer
than 25 employees) and being foreign-born.38
In the teenage years, 78% of white men have
private insurance coverage (mostly through their
parents), compared with only 50% of
black adolescents and 41% of Hispanic
youth. However, 23% of black
teenagers and 18% of their Hispanic
peers have Medicaid coverage, reducing
the gap in coverage. As they leave ado-
lescence behind, many men lose either
the Medicaid coverage they were enti-
tled to through their mothers or the
automatic inclusion in their parents’
private family health insurance policies;
in all racial groups, the proportion of
men with health coverage is lower in
the early 20s than in adolescence.39
Structural Barriers Are an Impediment
The health care infrastructure itself, in
both the public and the private sectors,
creates obstacles to meeting men’s
needs. Public funding for men’s sexual
and reproductive health programs is
insufficient. Many federally supported
programs are designed to serve women
but not men, and do not offer male
services, like vasectomies. State fund-
ing may be earmarked only for female
procedures.40
In the private health sector, insur-
ance coverage and training for service
providers present challenges. For exam-
ple, it is not clear that health insurance
covers the full range of medical and
psychosexual counseling services men
might need at various stages of their
lives. And little is known about support
within the medical training community
for the inclusion of specialized instruc-
tion in male sexual and reproductive
health care.
Without such training, many doctors do not
have the knowledge or experience that would
make them comfortable in the role of sexual and
reproductive health care providers for men. Fewer
than half of pediatricians, nurses, psychologists
and social workers working with adolescents con-
sider themselves highly knowledgeable about sex-
In Their Own Right The Alan Guttmacher Institute
Chapter 6
6667
SOURCE: TABLE 6.3, PAGE 88.
0 2 0 4 0 6 0 8 0 1 0 0
P O O R
L O W - I N C O M E
M O D E R AT E - I N C O M E
B E T T E R - O F F
M E N 1 5 – 1 9
% W I T H N O H E A L T H I N S U R A N C E
M E N 2 0 – 2 9
M E N 3 0 – 3 9
M E N 4 0 – 4 9
CHART 6.3At every age, poor and low-income men arethe most likely to be uninsured.

uality education, contraceptive counseling or ado-
lescent pregnancy.41
In addition to these problems, many men are
out of touch with a regular source of preventive
health care of any kind. More than one in three
men 18–44 do not have a regular doctor, and
one-third have not seen a doctor in the past year.
Among men 50–64, six out of 10 have not been
screened for prostate cancer in the past year, and
one-third have not been screened for colon can-
cer. Fifty-one percent of men 18–44 have
received no preventive services at all in the past
year (compared with 16–18% of women of this
age). Poor men, uninsured men and Hispanic
men have by far the hardest time gaining access
to preventive health care services.42
Most women begin seeing a doctor for routine
and regular reproductive health care services after
they become sexually active, and women who
have children become linked to the health system
when they are pregnant and giving birth. But men
do not have a similar routine channel for obtain-
ing sexual and reproductive health care services,
and have traditionally not been encouraged to
seek such services. Because of the predominance
of female clients in family planning clinics, many
men believe that these clinics provide care only to
women, so are reluctant to go.43 In addition, of
course, most men do not require any medical
services to become fathers.
Young Men Face Additional Barriers
Young men’s physical, emotional and psychological
development changes very rapidly in the adoles-
cent years. In addition, young men who have a
regular doctor often switch from a pediatrician to
an internist at some point during adolescence.
Both of these types of general practice physicians
tend to serve a wide age range of clients, and may
have difficulty providing comprehensive counseling
and services specifically geared to adolescents.
Adolescents coming to adulthood in a world of
AIDS and growing social conservatism must rec-
oncile the impetus of their emerging sexuality
with the social realities around them. It is often
difficult to promote sexual abstinence as an
acceptable option for teenage men, some of
whom already hold casual attitudes toward sex. In
some communities, deep-seated societal assump-
tions hold that fatherhood at an early age is
inevitable. Young men in these communities often
lack adequate exposure to role models of men
who are financially and emotionally responsible
for the children they father. Young men in poor
communities may also be apathetic and feel that
their life situation cannot be improved.44
What Is to Be Done?
The sexual and reproductive health service needs
of young men have received somewhat greater
recognition than have the needs of adult men. In
fact, most of the small number of pilot projects
designed to serve men focus on adolescents.
However, these programs reach only a fraction of
adolescent men. And in a society where many
influential policymakers frown on sexuality educa-
tion, how should young men be taught not just
about reproductive biology, safer sex and healthy
relationships, but where to go if they need coun-
seling and advice in these areas?
How can the groups in society involved in
men’s sexual and reproductive health—medical
and other health professionals; community-based
organizations, especially those targeting young
men; parents; schools; and insurance compa-
nies—reach a consensus on the types and range
of education and services that men need? Which
medical specialists should be tapped to provide
services? What is the best way to overcome the
scarcity of resources and staff available to provide
for men’s sexual and reproductive health care
needs? And what health policies are being consid-
ered to address the needs of the millions of men
who lack any form of health insurance?
Moreover, given the reluctance of many men to
use the condom, what strategies can the public
health community recommend and implement on
a broad scale to involve men in reducing their
own and their partners’ STD levels? In particular,
how can they reach unmarried men?
As this report makes clear, the need to address
all these questions is critical.

Chapter 7
Summing Up
In Their Own Right The Alan Guttmacher Institute
Chapter 7
6869

“Helping men take greater control of their sexual and reproductivelives should be an important national goal.”
It is clearly essential to recognize the sexual and
reproductive health care needs of American men
and to increase their access to services address-
ing those needs. This report has touched upon
many of the reasons for the sense of urgency:
Because in addition to being partners and fathers,
men are individuals in their own right and deserve
to be treated accordingly. Because men who per-
ceive that taking care of their sexual and repro-
ductive health is to their own advantage are more
likely than those who lack this understanding to
obtain the kinds of care they need and to assume
responsibility for their sexual activity. Because
emphasizing the importance of information and
counseling services in sexual and reproductive
health care—the component that men now most
lack—also promises to enhance the comprehen-
siveness and quality of services for women.
Because in the end, meeting the needs of both
men and women should result in lower levels of
sexually transmitted diseases (STDs), fewer
unwanted pregnancies, healthier pregnancies and
births, and better parenting.
Two basic facts about male sexual and repro-
ductive health and behavior in the United States
emerge from this overview. First, a significant
number of men, particularly young men, are tak-
ing action to avoid the undesirable consequences
of sex—unintended pregnancy and sexually trans-
mitted disease. Eight in 10 teenage men practice
contraception the first time they have sex, mostly
using the condom, and high proportions continue
to use birth control from then onward. At the
same time, however, many men still expose them-
selves and their partners to a high risk of STDs
and unwanted pregnancy. Nearly one in five men
of all ages use no protection when they have
intercourse.
There are many explanations for why some men
fail to be more careful in their sexual relation-
ships. Some are rooted in men’s insufficient
appreciation of the risks they face, others in their
failure to acknowledge their own vulnerability.
Others undoubtedly stem from a lack of concern
about the consequences of irresponsible sexual
behavior. But as this report shows, additional rea-
sons well might be the inadequacy of existing
information and services for men, and men’s lim-
ited access to the services that are available,
often because so many lack health insurance.
Men’s Needs Can Be Measured Only Indirectly
It is extremely difficult to quantify men’s unmet
need for sexual and reproductive information and
health care. Nonetheless, the data in this report
offer some strong indirect indicators. The propor-
tion of men with AIDS who were infected through
heterosexual contact is continuing to rise, and
rates of STDs, particularly among adolescents and
men in their 20s, are alarmingly high. The propor-
tion of men in each age-group who are experienc-
ing key events can also provide measures of need.
Of the almost 69 million American men who
are between the ages of 15 and 49, some 62 mil-
lion have ever had intercourse, including half of
adolescent men, nine in 10 of those in their 20s
and virtually all of those in their 30s and 40s.
Substantial proportions have had intercourse very
recently (three in 10 teenagers, almost eight in
10 men in their 20s and nearly nine in 10 men in
their 30s and 40s). The proportions who have had
two or more partners in the past year, behavior
that increases the risk of contracting an STD, are
especially high among adolescents and men in
their 20s—25% and 29%, respectively (Chart
7.1, page 70).1
Use of the condom is substantial at all ages
and is especially high among men in their 20s,2
but the high rate of STDs suggests that condom
use needs to be even higher and even more con-
sistent than it now is. Certainly, all sexually active
men should have the knowledge and skills neces-
sary to use condoms effectively. But equally
important, they should also be knowledgeable

In Their Own Right The Alan Guttmacher Institute
Chapter 7
7071
about the range of female methods
of pregnancy and disease prevention
and have the interpersonal skills
required to support their partner’s
effective use of a method. The chal-
lenge here is to craft messages, pro-
grams and policies that do not try to
fight human nature—for example, by
urging all unmarried men to abstain
from sex—but that focus on helping
men recognize risky behavior, make
responsible decisions and lessen
the risks.
Each year, 3–14% of men,
depending on the age-group, are
involved in a pregnancy.3 These men
need an understanding of the impor-
tance of prenatal care, and how to
give their partners emotional support
during this period. There are some
indications that domestic violence
increases when women are pregnant,
especially when the circumstances
surrounding the pregnancy are less
than ideal.4 Men at high risk of vio-
lent behavior may require especially
intensive counseling and social ser-
vices. Finally, men involved in a
pregnancy need accurate information
about the options available to women
who may wish to consider ending a
pregnancy.
Male sexual and reproductive
health is also about fatherhood. By
their 40s, almost nine in 10 men
have fathered a child.5 At some point
in their lives, therefore, most men
need information about good parent-
ing practices, child health and devel-
opment, paternal responsibilities and
rights, and the importance of main-
taining close and supportive ties with
children with whom they might not
live. Men who are fathers also need
to be able to talk comfortably with
their children about the pleasures,
% O F M E N
1p1p
1 7 . 9 M I L L I O N M E N 2 0 – 2 9
2 0 . 6 M I L L I O N M E N 3 0 – 3 9
2 0 . 2 M I L L I O N M E N 4 0 – 4 9
E V E R H A D I N T E R C O U R S E
H A D I N T E R C O U R S E I N P A S T M O N T H
H A D ≥ 2 P A R T N E R S I N P A S T Y E A R
U S E D C O N D O M I N P A S T M O N T H
A R E I N V O LV E D I N A P R E G N A N C Y E A C H Y E A R
H AV E FAT H E R E D A C H I L D
1 0 . 2 M I L L I O N M E N 1 5 – 1 9
0 2 0 4 0 6 0 8 0 1 0 0
CHART 7.1
SOURCE: TABLE 7.1, PAGE 88.
Men’s sexual and reproductive healthbehaviors, and hence their needs,change over the course of their lives.

consequences and responsibilities of sexual
expression and of having children of their own
one day.
At the same time, men whose marriages have
broken up and who find themselves single again
need information that will help them navigate a
world that may be very different from the one in
which they were first single—particularly if their
marriage predated AIDS and the current epidemic
of STDs.
The Powerful External Conditions Shaping SomeMen’s Behavior Must Be Acknowledged
The broad links highlighted in this report among
men’s race and ethnicity, socioeconomic circum-
stances, and sexual and reproductive behaviors
are striking. However, these connections are far
more complex than is suggested by the data pre-
sented here, and they merit more in-depth investi-
gation and clarification than was possible in this
report.
Nevertheless, the report reveals some sobering
statistics about the conditions of some men’s
lives: More than one-third of all boys, and an even
higher proportion of black youth, grow up with
only one parent in the home. One-third of men
live in poor or low-income families during their
teens and 20s, an important measure, in light of
consistent findings linking economic and social
disadvantage and reduced hopes of moving out of
poverty to higher rates of sexual risk-taking.
Minority men have higher rates of STDs than
white men, and AIDS is increasingly becoming a
problem of poor and minority men.
However, poverty is not destiny, and race and
ethnicity do not determine one’s life course. Some
men with all the advantages of high income,
“intact” families, good education and successful
careers contract STDs, experience unintended
pregnancies, see their families break up and
become separated from their children. And many
low-income and minority men avoid these prob-
lems entirely. Clearly, more attention must be
paid to the sexual and reproductive health needs
of men of all income levels and racial and ethnic
backgrounds.
Still, the complex relationships between pover-
ty, high-risk behaviors, poor health outcomes, and
further economic and social disadvantage are
undeniable for both men and women. It will be
difficult to fully address a range of problematic
sexual and reproductive behaviors without also
addressing the broader social issues of poverty,
racial and ethnic discrimination, and the social
dislocation that flows from both.
Punitive Social Policies Are Not the Answer
Men, and women, of all ages and from all cultural
backgrounds are having to adapt their sexual and
reproductive lives to new societal expectations
about male and female roles, new definitions of
marriage and family, and the dramatically altered
context of all sexual relationships because of the
advent of HIV and AIDS and the prevalence of
other STDs. Such trends as the rising labor-force
participation of women with children, later mar-
riage, increasing rates of cohabitation and non-
marital childbearing, and high, though apparently
stable, divorce rates probably will not be reversed
any time soon.6 Many of the demands these new
and often difficult circumstances place on men
are not going to go away, either.
It is surprising, therefore, that so little sense of
public urgency surrounds men’s sexual and repro-
ductive behavior and its consequences for fami-
lies and society. Issues like impotence and
prostate cancer among well-known public figures
often receive a high level of media attention, but
men’s more routine sexual and reproductive
health needs capture far less attention.
There also seems to be no lack of concern
about escalating rates of nonmarital births.
Historically, most policies designed to address
It is surprising that so little sense of publicurgency surrounds men’s sexual and reproductive behavior and its consequences.

out-of-wedlock childbearing have focused on
unmarried mothers. More recent steps, however,
have targeted men. These have been largely puni-
tive measures designed to increase men’s finan-
cial support for children they father but do not
live with. The 1992 Child Support Recovery Act,
for example, makes it a federal crime to willfully
fail to pay child support. Under the 1994 Full
Faith and Credit for Child Support Orders Act,
states are required to enforce child support orders
established in other states. The 1998 Deadbeat
Parents Act makes it a felony to cross state lines
to evade a child support obligation. And Title III
of the 1996 Personal Responsibility and Work
Opportunity Reconciliation Act (the welfare reform
legislation) requires states to establish legal pater-
nity if children born out of wedlock are to be eli-
gible for aid under the federal Child Assistance
Program.
Whatever the intent of these laws, about one in
four nonresident fathers who are not in compli-
ance with child support laws are so poor—and
receive so little help in surmounting poverty—that
there is little hope of their being able to assist
their children, however much they might want to.7
The same is true of fathers who are in prison.8
Addressing the entrenched national problem of
poverty among children, and especially children
living with one parent, requires a broader policy
approach: Focusing primarily on the unwillingness
or inability of some unmarried fathers to stay in
their children’s lives and contribute to their sup-
port is not sufficient.
Reversing the neglect of men’s needs will also
require confronting some difficult ideological and
political realities, given that many influential poli-
cymakers believe either that sexuality and its
implications do not require program interventions
at all or that such programs should preach sexual
abstinence.
Serving Men Will Require New Approaches
Helping men lead healthier sexual and reproduc-
tive lives is a goal that is garnering increased
attention and legitimacy. Still, some health pro-
fessionals and many feminist activists fear that an
emphasis on men will inevitably drain much-
needed focus and health care resources away
from women. To be sure, more must be done to
meet the needs of women. However, anticipated
inroads into funding for women’s reproductive
health services may be somewhat overestimated,
since men need fewer high-cost, purely medical
services than women. Nonetheless, it will be
important to monitor the allocation of scarce
resources to ensure that the pressing unmet and
ongoing needs of women are fully attended to.
But even if it were free of any concern about
scarce resources, the planning and delivery of
sexual and reproductive health services for men
would not be a simple matter. A consensus of
what appropriately should constitute the basic
sexual and reproductive health “service set” for
men is still in the making, but it seems clear that
the bulk of men’s needs are for counseling and
education—services that both private health
insurance and Medicaid traditionally have been
unwilling to pay for. And because most reproduc-
tive health practitioners have been trained to
serve women’s medical needs, few professionals
exist to address men’s counseling needs in these
areas. In addition, what might constitute the best
settings for the delivery of men’s sexual and
reproductive health services within today’s system
of narrow medical specialization is the subject of
much active discussion but little agreement.
Despite the obstacles standing in the way of
improved sexual and reproductive health services
for men, helping men take greater control of their
sexual and reproductive lives should be an impor-
tant national goal. Men with enhanced reproduc-
tive education and competency are an essential
part of a “virtuous circle” linking their own
improved health with that of their partners, wives
In Their Own Right The Alan Guttmacher Institute
Chapter 7
7273
Reversing the neglect of men’s needswill require confronting some difficult ideological and political realities.

and children. Helping more men obtain the sexual
and reproductive health information and services
they need could help reduce unintended pregnan-
cies and births, just as the introduction of mater-
nal health and family planning programs made it
possible for women to better plan their families.
The impact on rates of HIV and other STDs could
be equally impressive.
But a strong case also can be made for bring-
ing men into the sexual and reproductive health
picture in their own right. Men, like women, have
a basic right to act on their own behalf, not just
for the “the greater good.” And, as is the case for
women, in the United States and around the
world, men are more likely to be responsive to
health messages about sex if they believe that
these messages reflect their own best interests.
They are also more likely to behave responsibly as
partners and as parents if they feel that their
involvement counts, and that their participation is
respected.
Finally, where men—especially adolescent
men—have been the focus of pilot programs, their
need for education, information, counseling and
improved skills in communications and relation-
ship-building has quickly become apparent. So
has the realization that effectively serving men
often requires frank discussion about sexuality,
sexual behaviors and gender roles, communication
and negotiation within relationships and the role
of the community and peer groups in establishing
or undermining positive models of male sexual
and reproductive behavior.9 These insights,
though highly challenging for program profession-
als to respond to, should help them address
men’s sexual and reproductive health needs more
effectively and in a more comprehensive, less
purely medical, way.
Most advocates of women’s sexual and repro-
ductive health and rights would contend that
these are the very perspectives that have been
lacking in the highly medicalized approach often
taken in addressing women’s needs. Some health
professionals have made an encouraging first step
in the right direction by beginning to acknowledge
that men’s—and women’s—sexual and reproduc-
tive behaviors are expressions, and reflections, of
many other aspects of their lives, including the
legitimate desire for sexual pleasure. This report
is intended to support the continued movement of
the health care field toward a more holistic and
broad-based approach to sexual and reproductive
health care. Such an approach should help to
improve not just the volume of services available
to men, but also the scope and quality of services
for women. What increasingly is seen as good for
men in their own right should turn out to be just
as good for women—to the ultimate benefit of
men and women as individuals, couples every-
where, their families and society as a whole.
What increasingly is seen as good for men intheir own right should turn out to be just asgood for women.

In Their Own Right The Alan Guttmacher Institute
References
7475
CHAPTER 1: THE IMPORTANCE ANDIMPLICATIONS OF MEN’S SEXUAL ANDREPRODUCTIVE BEHAVIOR1. Mundigo AI, Re-conceptualizing therole of men in the post-Cairo era, Culture,Health and Sexuality, 2000,2(3):323–337; United Nations PopulationFund (UNFPA), Male Involvement inReproductive Health, Including FamilyPlanning and Sexual Health, UNFPATechnical Report, New York: UNFPA,1995, No. 28; Greene ME and BiddlecomAE, Demographic accounts of male repro-ductive roles, Population andDevelopment Review, 2000,25(1):81–115; Children’s Defense Fund,Adolescent Fathers and Young AdultFathers: Problems and Solutions,Washington, DC: Children’s Defense Fund,1988; The National Fatherhood Initiative,Father Facts, third ed., 1998, <http://www.fatherhood.org/pdf/ffacts.pdf>,accessed Nov. 19, 2000; PopulationCouncil, Men as Supportive Partners inReproductive Health: Moving fromRhetoric to Reality, New York: PopulationCouncil, 2000; National Asian Women’sHealth Organization, The Asian AmericanMen’s Health Survey: SharingResponsibility, San Francisco: NationalAsian Women’s Health Organization,2000; International Planned ParenthoodFederation (IPPF), Men’s Needs andResponsibilities: Dialogue, Challenges,Overview, Responses, Planned ParenthoodChallenges, London: IPPF, 1996, No. 2;and National Institute of Child Health andHuman Development (NICHD), Nurturingfatherhood: improving data and researchon male fertility, family formation, andfatherhood, 1998, <http://fatherhood.hhs.gov/CFSForum/front.htm>, accessed Oct.30, 2000.2. Forrest JD, Timing of reproductive lifestages, Obstetrics & Gynecology, 1993,82(1):105–111; and Forrest JD, Contra-ceptive needs through stages of women’sreproductive lives, Contemporary Ob/Gyn,1988, Vol. 32, pp. 12–22.3. The Alan Guttmacher Institute, unpub-lished tabulations of the 1999 CurrentPopulation Survey.4. Ibid.5. Humes K and McKinnon J, The Asianand Pacific Islander population in theUnited States: population characteristics,Current Population Reports, 2000, SeriesP-20, No. 529; Council of EconomicAdvisers for the President’s Initiative onRace, Changing America: Indicators ofSocial and Economic Well-Being by Raceand Hispanic Origin, Washington, DC:U.S. Government Printing Office, 1998;and Staveteig S and Wigton A, Racial andEthnic Disparities: Key Findings from theNational Survey of America’s Families,New Federalism Series, Washington, DC:Urban Institute, 2000, No. B5.
BOX: DATA SOURCES1. Sanders SA and Reinisch JM, Wouldyou say you had sex if…? Journal of theAmerican Medical Association, 1999,281(3):275–277; Brown NR and SinclairRC, Estimating number of lifetime sexual
partners: men and women do it different-ly, Journal of Sex Research, 1999,36(3):292–297; and Weiderman MW,The truth must be in here somewhere:examining the gender discrepancy in self-reported lifetime number of sex partners,Journal of Sex Research, 1997,34(4):375–386.2. Garfinkel I, McLanahan SS andHanson TL, A patchwork portrait of non-resident fathers, in: Garfinkel I et al.,eds., Fathers Under Fire: The Revolutionin Child Support Enforcement, New York:Russell Sage, 1998, pp. 31–60. 3. Rendall MS et al., Incomplete report-ing of men’s fertility in the United Statesand Great Britain, Demography, 1999,36(1):135–144.
CHAPTER 2: MEN 15–19: INITIATINGSEXUAL RELATIONSHIPS1. Lugaila TA, Marital status and livingarrangements: March 1998 (update),Current Population Reports, 1998, SeriesP-20, No. 514, Table 4, pp. 26–30.2. McLanahan S and Sandefur G,Growing Up with a Single Parent: WhatHurts, What Helps, Cambridge, MA:Harvard University Press, 1994; BlumRW et al., The effects of race/ethnicity,income and family structure on adoles-cent risk behaviors, American Journal ofPublic Health, 2000, 90(12):1879–1884; and Lindberg LD et al.,Teen Risk-Taking: A Statistical Portrait,Washington, DC: Urban Institute, 2000. 3. U.S. Department of Education,National Center for Education Statistics(NCES), Dropout Rates in the UnitedStates: 1999, Washington, DC: Office ofEducational Research and Improvement,2000, Table 4, p. 19, and Figure 3, p. 17.4. The Alan Guttmacher Institute (AGI),unpublished tabulations of the 1999Current Population Survey (CPS).5. Ibid.6. Ibid.7. Strong B and Devault C, HumanSexuality, Mountain View, CA: MayfieldPublishing, 1994.8. Joyner K and Udry JR, You don’t bringme anything but down: adolescentromance and depression, Journal ofHealth and Social Behavior, 2000,41(4):369–391, Table 1, p. 375.9. Coles R and Stokes G, Sex and theAmerican Teenager, New York: RollingStone Press, 1985.10. Elliott L and Brantley C, Sex onCampus: The Naked Truth About the RealSex Lives of College Students, New York:Random House, 1997; and Schwartz IM,Sexual activity prior to coital initiation: acomparison between males and females,Archives of Sexual Behavior, 1999,28(1):63–69.11. Carolyn J et al., Adolescent males’willingness to report masturbation,Journal of Sex Research, 2000,37(4):327–332.12. Gates GJ and Sonenstein FL,Heterosexual genital activity among ado-
lescent males: 1988 and 1995, FamilyPlanning Perspectives, 2000, 32(6):295–297 & 304.13. AGI, unpublished tabulations of the1995 National Survey of AdolescentMales (NSAM).14. Remez L, Oral sex among adoles-cents: is it sex or is it abstinence? FamilyPlanning Perspectives, 2000, 32(6):298–304.15. Sanders SA and Reinisch JM, Wouldyou say you had sex if…? Journal of theAmerican Medical Association, 1999,281(3):275–277.16. Brown NR and Sinclair RC,Estimating number of lifetime sexualpartners: men and women do it different-ly, Journal of Sex Research, 1999,36(3):292–297.17. Singh S and Darroch JE, Trends insexual activity among adolescentAmerican women: 1982–1995, FamilyPlanning Perspectives, 1999,31(5):212–219.18. AGI, unpublished tabulations of the1995 NSAM.19. Whitaker DJ, Miller KS and Clark LF,Reconceptualizing adolescent sexualbehavior: beyond did they or didn’t they?Family Planning Perspectives, 2000,32(3):111–117.20. AGI, unpublished tabulations of the1995 NSAM.21. Ibid.22. AGI, unpublished tabulations of the1992 National Health and Social LifeSurvey (NHSLS). 23. Schoen C et al., The Health ofAdolescent Boys: Commonwealth SurveyFindings, New York: The CommonwealthFund, 1998.24. Raj A, Silverman JG and Amara H,The relationship between sexual abuseand sexual risk among high school stu-dents: findings from the 1997Massachusetts Youth Risk BehaviorSurvey, Maternal and Child HealthJournal, 2000, 4(2):125–134.25. Smith TW, A methodological analysisof the sexual behavior questions in theGeneral Social Surveys, Journal ofOfficial Statistics, 1992, 8(2): 309–325;Laumann EO et al., The SocialOrganization of Sexuality: SexualPractices in the United States, Chicago:University of Chicago, 1994; and see boxon page 13.26. AGI, Sex and America’s Teenagers,New York: AGI, 1994, Figure 10, p. 20.27. Santelli JS et al., Adolescent sexualbehavior: estimates and trends from fournationally representative surveys, FamilyPlanning Perspectives, 2000,32(4):156–165.28. Ku L et al., Understanding changesin sexual activity among young metropoli-tan men: 1979–1995, Family PlanningPerspectives, 1998, 30(6):256–262.29. Ibid.30. AGI, unpublished tabulations of the1995 NSAM.31. Whitaker DJ, Miller KS and Clark LF,
REFERENCES AND NOTES

2000, op. cit. (see reference 19).32. Ibid.33. Dittus PJ and Jaccard J, Adolescents’perceptions of maternal disapproval ofsex: relationship to sexual outcomes,Journal of Adolescent Health, 2000,26(4):268–278; and Hovell M et al.,Family influences on Latino and Angloadolescents’ sexual behavior, Journal ofMarriage and the Family, 1994, 56(4):973–986.34. Sieving RE, McNeely CS and BlumRW, Maternal expectations, mother-childconnectedness and adolescent sexualdebut, Archives of Pediatric andAdolescent Medicine, 2000,154(8):809–816.35. Dittus PJ, Jaccard J and Gordon VV,The impact of African American fatherson adolescent sexual behavior, Journal ofYouth and Adolescence, 1997, 26(4):445–465.36. Young E et al., The effects of familystructure on the sexual behavior of ado-lescents, Adolescence, 1991, 26(104):977–986; and McLanahan S andSandefur G, 1994, op. cit. (see refer-ence 2). 37. AGI, unpublished tabulations of the1995 NSAM.38. Upchurch DM et al., Gender and eth-nic differences in the timing of first sexu-al intercourse, Family PlanningPerspectives, 1998, 30(3):121–127.39. Blum RW et al., 2000, op. cit. (seereference 2).40. Ibid.; and Kirby D, EmergingAnswers: Research Findings on Programsto Reduce Teen Pregnancy, Washington,DC: The National Campaign to PreventTeen Pregnancy, 2001.41. AGI, unpublished tabulations of the1995 NSAM.42. Ibid.43. Santelli JS et al., Multiple sexualpartners among U.S. adolescents andyoung adults, Family PlanningPerspectives, 1998, 30(6):271–275.44. Sonenstein F, Pleck JH and Ku LC,Levels of sexual activity among adoles-cent males in the United States, FamilyPlanning Perspectives, 1991, 23(4):162–167.45. Murphy JJ and Boggess S, Increasedcondom use among teenage males,1988–1995: the role of attitudes, FamilyPlanning Perspectives, 1998, 30(6):276–280 & 303; and Santelli JS et al.,The use of condoms with other contra-ceptive methods among young men andwomen, Family Planning Perspectives,1997, 29(6):261–267.46. AGI, unpublished tabulations of the1995 NSAM.47. Ibid.48. Ibid.49. Ibid.50. Ku L, Sonenstein FL and Pleck JH,The dynamics of young men’s condomuse during and across relationships,Family Planning Perspectives, 1994,26(6):246–251.51. Landry JJ and Camelo TM, Youngunmarried men and women discussmen’s role in contraceptive practice,Family Planning Perspectives, 1994,26(5):222–227.
52. Besharov DS et al., eds., Why SomeMen Don’t Use Condoms: Male AttitudesAbout Condoms and Other Contra-ceptives, Menlo Park, CA: Henry J. KaiserFamily Foundation, 1997.53. AGI, unpublished tabulations of the1995 NSAM.54. Ranjit N et al., Contraceptive failurein the first two years of use: differencesacross socioeconomic subgroups, FamilyPlanning Perspectives, 2001,33(1):19–27.55. Sonenstein FL et al., Involving Malesin Preventing Teen Pregnancy, Wash-ington, DC: Urban Institute, 1997, p. 25.56. Lindberg LD, Ku L and Sonenstein F,Adolescents’ reports of reproductivehealth education, 1988 and 1995,Family Planning Perspectives, 2000,32(5):220–226.57. AGI, unpublished tabulations of the1995 NSAM.58. Marsiglio W, Adolescent males’ orien-tation toward paternity and contraception,Family Planning Perspectives, 1993,25(1):22–31, Table 2, p. 25.59. AGI, unpublished tabulations of the1995 NSAM.60. Ibid.61. Ibid.62. National Center for EducationStatistics, Digest of Education Statistics,2000, Table 375, <http://nces.ed.gov/pubs2001/digest/dt375.html>, accessedMar. 2, 2001.63. AGI, unpublished tabulations of the1995 NSAM.64. Darroch JE, Landry DJ and Oslak S,Pregnancy rates among U.S. women andtheir partners in 1994, Family PlanningPerspectives, 1999, 31(3):122–126 &136, Table 1, p. 124.65. Percentage distribution of births cal-culated by applying age-specificbirthrates to the 1994 population of men15–44. Birthrates: Ibid. Number of men:Deardorff KE, Hollmann FW andMontgomery P, U.S. Population Esti-mates, by Age, Sex, Race, and HispanicOrigin: 1990 to 1994, Washington, DC:U.S. Bureau of the Census, 1995.66. Darroch JE, Landry DJ and Oslak S,1999, op. cit. (see reference 64), Table2, p. 125.67. Calculated using data from ibid.68. Percentage distribution of abortionscalculated by applying age-specific abor-tion rates to the 1994 population of men15–44. Birthrates: Ibid. Number of men:Deardorff KE, Hollmann FW andMontgomery P, 1995, op. cit. (see refer-ence 65).69. Henshaw SK and Kost K, Parentalinvolvement in minors’ abortion decisions,Family Planning Perspectives, 1992,24(5):196–207 & 213.
BOX: MALE VIOLENCE AGAINST WOMEN1. Heise L, Moore K and Toubia N,Sexual Coercion and ReproductiveHealth: A Focus on Research, New York:Population Council, 1995.2. Ibid.3. Tjaden P and Thoennes N, Prevalence,Incidence and Consequences of ViolenceAgainst Women: Findings from theNational Violence Against Women Survey,
Atlanta: National Institute of Justice andCenters for Disease Control andPrevention, 1998, Table 1, p. 3, andTable 5, p. 6.4. Ibid., Table 1, p. 3.5. Ibid., Table 9, p. 8.6. Ibid., Table 4, p. 5, and Table 5, p. 6. 7. Goodwin MM et al., Intendedness andphysical abuse around the time of preg-nancy: findings from the Pregnancy RiskAssessment Monitoring System,1996–1997, Maternal and Child HealthJournal, 2000, 4(2):85–92. 8. Abma J, Driscoll A and Moore K,Young women’s degree of control overfirst intercourse: an exploratory analysis,Family Planning Perspectives, 1998,30(1):12–18.
CHAPTER 3: MEN 20–29: SETTLINGDOWN1. The Alan Guttmacher Institute (AGI),unpublished tabulations of the 1991National Survey of Men (NSM).2. AGI, unpublished tabulations of the1992–1994 National Survey of Familiesand Households (NSFH).3. AGI, unpublished tabulations of the1999 Current Population Survey (CPS).4. Ibid.5. Ibid.6. Ibid.7. Ibid.8. U.S. Department of Education,National Center for Education Statistics(NCES), The Condition of Education,1999, p. 24, <http://nces.ed.gov/pubs99/condition99/indicator_12.html/>,accessed Nov. 9, 2000.9. AGI, unpublished tabulations of the1999 CPS.10. AGI, unpublished tabulations of the1976 and 1999 CPS.11. U.S. Bureau of the Census, TableMS-2. Estimated Median Age at FirstMarriage, by Sex: 1890 to the Present,1999, <www.census.gov/population/socdemo/ms-la/tabms-2.txt>, accessedSept. 14, 2000.12. Norton AJ and Miller LF, Marriage,divorce and remarriage in the 1990s,Current Population Reports, 1992, SeriesP-23, No. 180, Table A, p. 2.13. AGI, unpublished tabulations of the1993–1994 General Social Surveys(GSS).14. South SJ, Racial and ethnic differ-ences in the desire to marry, Journal ofMarriage and the Family, 1993, 55(5):357–370.15. Bumpass LL and Sweet JA, Nationalestimates of cohabitation, Demography,1989, 26(4):615–625; and Bumpass Land Lu HH, Trends in cohabitation andimplications for children’s family contextsin the U.S., Population Studies, 2000,54(1):29–41.16. Saluter AF and Lugaila T, Marital sta-tus and living arrangements: March1996, Current Population Reports, 1998,Series P-20, No. 496, p. 5. 17. Bumpass LL and Sweet JA,Cohabitation, Marriage and Union Stability:Preliminary Findings from NSFH2, NSFHWorking Paper, Madison, WI: Center forDemography and Ecology, University ofWisconsin, 1995, No. 65, Table 1.

In Their Own Right The Alan Guttmacher Institute7677
18. Bumpass LL and Sweet JA, Nationalestimates of cohabitation, Demography,1989, 26(4):615–625.19. Ibid.20. Casper LM and Sayer LC,Cohabitation transitions: different atti-tudes and purposes, different paths,paper presented at the annual meeting ofthe Population Association of America,Los Angeles, Mar. 23–25, 2000.21. AGI, unpublished tabulations of the1991 NSM.22. AGI, unpublished tabulations of the1992–1994 NSFH.23. Ibid.24. AGI, unpublished tabulations of the1999 CPS.25. Oppenheimer VK, Kalmijn M andLim N, Men’s career development andmarriage timing during a period ofrising inequality, Demography, 1997,34(3):311–330.26. Lichter DT et al., Race and retreatfrom marriage: a shortage of marriageablemen? American Sociological Review,1992, 57(6):781–799; and South SJand Lloyd KM, Marriage opportunitiesand family formation: further implicationsof imbalanced sex ratios, Journal ofMarriage and the Family, 1992, 54(2):440–451.27. Wilson WJ, When Work Disappears:The World of the New Urban Poor, NewYork: Vintage Press, 1996.28. Farley R and Bianchi S, The GrowingRacial Difference in Marriage and FamilyPatterns, Research Report, Ann Arbor,MI: Population Studies Center, Universityof Michigan, 1987, No. 87-107; andSouth SJ and Lloyd KM, 1992, op. cit.(see reference 26).29. AGI, unpublished tabulations of the1999 CPS.30. Vega WA, Hispanic families in the1980s: a decade of research, Journal ofMarriage and the Family, 1990,52(4):1015–1024; and South SJ, Racialand ethnic differences in the desire tomarry, Journal of Marriage and theFamily, 1993, 55(2):357–370.31. AGI, unpublished tabulations of the1992 National Health and Social LifeSurvey (NHSLS).32. Sonenstein FL et al., Involving Malesin Preventing Teen Pregnancy,Washington, DC: Urban Institute, 1997,pp. 19 and 27. 33. AGI, unpublished tabulations of the1992 NHSLS.34. Laumann EO and Youm Y, Sexualexpression in America, in: Laumann EOand Michael RT, eds., Sex, Love andHealth in America: Private Choices andPublic Policies, Chicago: University ofChicago Press, 2001, pp. 109–147.35. AGI, unpublished tabulations of the1992 NHSLS.36. Ibid.37. Ibid.38. AGI, unpublished tabulations of the1991 NSM.39. Ibid.40. Ibid.41. Ibid.42. Ibid.43. Grady WR, Klepinger D and Nelson-
Wally A, Contraceptive characteristics:the perceptions and priorities of men andwomen, Family Planning Perspectives,1999, 31(4):168–175.44. AGI, unpublished tabulations of the1992–1994 NSFH.45. AGI, unpublished tabulations of the1988 and 1994 GSS.46. Miller WB, Childbearing motivationand its measurement, Journal ofBiosocial Science, 1995,27(4):473–487.47. Marsiglio W, Male procreative con-sciousness and responsibility: a concep-tual analysis and research agenda,Journal of Family Issues, 1991, 12(3):268–290; Seccombe K, Assessing thecosts and benefits of children: gendercomparisons among child-free husbandsand wives, Journal of Marriage and theFamily, 1991, 53(1):191–202; andBlake J and del Pinal JH, The childless-ness option: recent American views ofnonparenthood, in: Hendershot GE andPlacek PJ, eds., Predicting Fertility:Demographic Studies of Birth Expecta-tions, Lexington, KY: D.C. Heath andCompany, 1981, pp. 235–261.48. AGI, unpublished tabulations of the1992–1994 NSFH.49. Numbers and percentage distributionof births calculated by applying age-spe-cific birthrates to the 1994 population ofmen 15–44. Birthrates: Darroch JE,Landry DJ and Oslak S, Pregnancy ratesamong U.S. women and their partners in1994, Family Planning Perspectives,1999, 31(3):122–126 & 136, Table 1.Number of men: Deardorff KE, HollmannFW and Montgomery P, U.S. PopulationEstimates, by Age, Sex, Race and His-panic Origin: 1990 to 1994, Washington,DC: U.S. Bureau of the Census, 1995.50. Ventura SJ et al., Births: final datafor 1998, National Vital Statistics Report,2000, Vol. 48, No. 3, Table 4, p. 27,and Table 20, p. 48. 51. AGI, unpublished tabulations of the1992–1994 NSFH.52. Ibid.53. NCES, Digest of Education Statistics,1999, Table 387, p. 437 <http://www.nces.ed.gov/pubs99/digest98/d982379.html>, accessed Nov. 17,2000.54. Percentages of births that are nonmari-tal calculated from Darroch JE, Landry DJand Oslak S, 1999, op. cit. (see reference49).55. AGI, unpublished tabulations of the1992–1994 NSFH.56. Numbers and percentage distributioncalculated using age-specific birthratesand abortion rates for 1994, based onDarroch JE, Landry DJ and Oslak S,1999, op. cit. (see reference 49).57. Darroch JE, Landry DJ and Oslak S,1999, op. cit. (see reference 49), Table3, p. 126.58. AGI, Sharing Responsibility: Women,Society and Abortion Worldwide, NewYork: AGI, 1999, p. 17.
BOX: INCARCERATED MEN1. The Alan Guttmacher Institute (AGI),unpublished tabulations of the 1997Survey of Inmates in State and FederalCorrection Facilities, and of the 1996
Survey of Inmates in Local Jails. 2. Ibid.3. Bureau of Justice Statistics, CriminalOffenders Statistics, 2000, <http://www.ojp.usdoj.gov/bjs/crimoff.htm>, accessedJuly 23, 2001.4. Human Rights Watch, Punishment andPrejudice: Racial Disparities in the Waron Drugs, 2000, Vol. 12, No. 2(G),<http://www.hrw.org/reports/2000/usa/>accessed May 24, 2001.5. AGI, unpublished tabulations of the1997 Survey of Inmates in State andFederal Correction Facilities, and of the1996 Survey of Inmates in Local Jails.6. AGI, unpublished tabulations of the1999 Current Population Survey (CPS).7. Bureau of Justice Statistics, 2000, op.cit. (see reference 3).8. Brien PM and Harlow CW, HIV inPrisons and Jails, 1993, Washington, DC:Bureau of Justice Statistics, 1995.9. Centers for Disease Control andPrevention (CDC), HIV/AIDS SurveillanceReport, 1993, Vol. 5, No. 4, Figure 1,<http://www.cdc.gov/nchstp/dstd/Stats_Trends/1999SurvRpt.htm>, accessed July3, 2001.10. CDC, STD Surveillance 1999: STDsin Persons Entering Corrections Facilities,<http://www.cdc.gov/nchstp/dstd/Stats_Trends/1999Surveillance/99PDF/99Section10.pdf>, accessed June 8, 2001.11. Division of STD Prevention, CDC,Sexually Transmitted Disease Surveillance1999, Atlanta: CDC, 2000.12. AGI, unpublished tabulations of the1997 Survey of Inmates in State andFederal Correction Facilities, and of the1996 Survey of Inmates in Local Jails.13. AGI, unpublished tabulations of the1992–1994 National Survey of Familiesand Households.14. AGI, unpublished tabulations of the1997 Survey of Inmates in State andFederal Correction Facilities, and of the1996 Survey of Inmates in Local Jails.15. Ibid.16. Sorensen E and Wheaton L, Incomeand Demographic Characteristics ofNonresident Fathers in 1993,Washington, DC: Urban Institute, 2000.17. King AEO, The impact of incarcera-tion on African American families: impli-cations for practice, Journal ofContemporary Human Services, 1993,74(2):145–153.
CHAPTER 4: MEN 30–49: FORMINGFAMILIES1. The Alan Guttmacher Institute (AGI),unpublished tabulations of the1992–1994 National Survey of Familiesand Households (NSFH).2. AGI, unpublished tabulations of the1999 Current Population Survey (CPS).3. Ibid.4. Ibid. 5. Ibid. Agricultural work includes farm-ing, forestry and fishing; unskilled manu-al worker corresponds to the category“operator/transport” in the CPS.6. AGI, unpublished tabulations of the1992–1994 NSFH.7. AGI, unpublished tabulations of the1999 CPS.
References

8. AGI, unpublished tabulations of the1992–1994 NSFH.9. Ibid.10. AGI, unpublished tabulations of the1999 CPS.11. Hoffman SD and Duncan GJ, Theeffect of income, wages and AFDC bene-fits on marital disruption, Journal ofHuman Resources, 1995, 30:19–41; andSouth SJ and Lloyd KM, Spousal alterna-tives and marital dissolution, AmericanSociological Review, 1995, 60(1):21–35.12. AGI, unpublished tabulations of the1999 CPS.13. Cherlin A, Marriage, Divorce, andRemarriage, second ed., Cambridge, MA:Harvard University Press, 1992.14. Castro Martin T and Bumpass LL,Recent trends and differentials in maritaldisruption, Demography, 1989,26(1):37–51; Norton AJ and MoormanJE, Current trends in marriage anddivorce among American women, Journalof Marriage and the Family, 1987,49(1):3–14; and Da Vanzo J and RahmanMO, American families: trends and corre-lates, Population Index, 1993,59(3):350–386.15. Clark SC, Advance report of finaldivorce statistics, 1989 and 1990,Monthly Vital Statistics Report, 1995,Vol. 43, No. 9, Suppl., Table 10, p. 19.16. Bumpass LL, Sweet J and CastroMartin T, Changing patterns of remar-riage, Journal of Marriage and the Family,1990, 52(3):747–756; and Norton AJand Miller LF, Marriage, divorce andremarriage in the 1990s, CurrentPopulation Reports, 1992, Series P-23,No. 180.17. Chadwick BA and Heaton TB, eds.,Statistical Handbook on the AmericanFamily, second ed., Phoenix, AZ: OryxPress, 1999, Chart A1–9, p. 9.18. Clark SC, 1995, op. cit. (see refer-ence 15).19. AGI, unpublished tabulations of the1992 National Health and Social LifeSurvey (NHSLS).20. Ibid.21. Ibid.22. Laumann EO, Paik A and Rosen RC,Sexual dysfunction in the United States:prevalence and predictors, Journal of theAmerican Medical Association, 1999,281(6):537–544.23. AGI, unpublished tabulations of the1992 NHSLS.24. AGI, unpublished tabulations of the1992–1994 NSFH.25. AGI, unpublished tabulations of the1991 National Survey of Men (NSM).26. Chandra A, Surgical sterilization inthe United States: prevalence and char-acteristics, 1965–95, Vital and HealthStatistics, 1998, Series 23, No. 20.27. Godecker AL, Thomson E andBumpass LL, Union status, marital histo-ry and female contraceptive sterilizationin the United States, Family PlanningPerspectives, 2001, 33(1):35–41 & 49.28. Chandra A, 1998, op. cit. (see refer-ence 26). 29. AGI, unpublished tabulations of the1991 NSM.30. AGI, unpublished tabulations of the1995 National Survey of Family Growth
(NSFG).31. Henshaw S, Unintended pregnancy inthe United States, Family PlanningPerspectives, 1998, 31(1):24–29 & 46.32. AGI, unpublished tabulations of the1992–1994 NSFH.33. Ibid.34. Bachu A, The Fertility of AmericanMen, U.S. Bureau of the Census,Population Division Working Paper,Washington, DC: 1996, No. 14.35. Percentage distribution of births cal-culated by applying age-specificbirthrates to the 1994 population of men15–44. Birthrates: Darroch JE, Landry DJand Oslak S, Pregnancy rates among U.S.women and their partners in 1994,Family Planning Perspectives, 1999,31(3):122–126 & 136, Table 1. Numberof men: Deardorff KE, Hollmann FW andMontgomery P, U.S. PopulationEstimates, by Age, Sex, Race and His-panic Origin: 1990 to 1994, Washington,DC: U.S. Bureau of the Census, 1995.36. Ventura SJ et al., Births: final datafor 1998, National Vital Statistics Report,2000, Vol. 48, No. 3, Table 20, p. 48.37. Percentage distribution of births calculated by applying age-specificbirthrates to the 1994 population of men15–44 (sources: see reference 35).38. Fields J, Living arrangements of chil-dren, Current Population Reports, 1996,Series P-70, No. 74, Table 3, p. 6.39. AGI, unpublished tabulations of the1992–1994 NSFH.40. Chandra A and Stephen EH, Im-paired fecundity in the United States:1982–1995, Family Planning Per-spectives, 1998, 30(1):34–42.41. AGI, unpublished tabulations of the1992–1994 NSFH.42. Darroch JE, Landry DJ and Oslak S,1999, op. cit. (see reference 35), Table3, p. 126.43. Percentage distributions calculatedby applying age-specific birthrates andabortion rates to the 1994 population ofmen 15–44 (sources: see reference 35).44. AGI, unpublished tabulations of the1992–1994 NSFH.45. Ibid.46. U.S. Bureau of the Census, LivingArrangements of Children Under 18 YearsOld: 1960 to Present, 1999,<http://www.census.gov/population/socdemo/ms-la/tabch-1.txt>, Table CH-1,accessed July 26, 2000.47. AGI, unpublished tabulations of the1992–1994 NSFH.48. King RB, Time spent in parenthoodstatus among adults in the United States,Demography, 1999, 36(3):377–385.49. Sorensen E and Zibman C, Poor DadsWho Don’t Pay Child Support: Deadbeatsor Disadvantaged? New Federalism SeriesB, Washington, DC: Urban Institute,2000, No. B-30. 50. Grall T, Child support for custodialmothers and fathers, 1997, CurrentPopulation Reports, 2000, Series P-60,No. 212.51. Nord CW and Zill N, Non-CustodialParents’ Participation in Their Children’sLives: Evidence from the Survey ofIncome and Program Participation, 1996,<http://fatherhood.hhs.gov/SIPP/
noncusp1.htm>, accessed June 22,2001.52. Bianchi SM, Maternal employmentand time with children: dramatic changeor surprising continuity? Demography,2000, 37(4):401–414. 53. Casper LM, My daddy takes care ofme! fathers as care providers, CurrentPopulation Reports, 1997, Series P-70,No. 59; and Casper LM, Who’s mindingour preschoolers? Current PopulationReports, 1996, Series P-70, No. 53.54. Bianchi S, Robinson J, Sayer L andMilkie M, Is anyone doing the housework?Social Forces, 2000, 79(1):191–228.
CHAPTER 5: SEXUALLY TRANSMITTEDDISEASES AND CONDOM USE1. Centers for Disease Control andPrevention (CDC), HIV/AIDS SurveillanceReport, 2000, Vol. 12, No. 1, Table 1, p. 5, and Table 25, p. 34.2. Altman LK, Swift rise seen in HIVcases for gay blacks, New York Times,May 31, 2001, pp. A1 & A16.3. CDC, 2000, op. cit. (see reference 1),Table 20, p. 28; and earlier CDC surveil-lance reports.4. CDC, 2000, op. cit. (see reference 1),Table 7, p. 14.5. Ibid., Table 24, p. 34.6. Ibid., Table 20, p. 28. 7. National Center for Injury Preventionand Control, CDC, 5 Leading causes ofdeath, United States, 1998, black, males,<http://webapp.cdc.gov/sasweb/ncipc/leadcaus.html>, accessed Nov. 9, 2000. 8. American Sexual Health Association(ASHA), Sexually Transmitted Diseases inAmerica: How Many Cases, and at WhatCost? Research Triangle Park, NC: ASHA,1998.9. National Institute of Allergy andInfectious Diseases, Fact Sheet,<http://www.niaid.nih.gov/factsheets/stdherp.htm>; and Corey L and SimmonsA, eds., The Medical Importance ofGenital Herpes Simplex Virus Infection,1997, London: International HerpesManagement Forum, 1997, p. 63.10. Fleming DT et al., Herpes simplexvirus type 2 in the United States, 1976to 1994, New England Journal ofMedicine, 1997, 337(16):1105–1111.11. CDC, Guidelines for treatment of sex-ually transmitted disease, Morbidity andMortality Weekly Report, 1998,47(RR–1):1–118.
12. The Alan Guttmacher Institute (AGI),unpublished tabulations of the1988–1994 National Health andNutrition Examination Surveys.13. ASHA, 1998, op. cit. (see reference 8).14. Panchaud C et al., Incidence andprevalence of genital herpes and humanpapillomavirus infections in developedcountries, New York: AGI, 2001.15. Mertz KJ et al., A pilot study of theprevalence of chlamydial infection in anational household survey, SexuallyTransmitted Diseases, 1998, 25(5):225–228; and Schacter J, Chlamydia—the more you look, the more you find—how much is there? Sexually TransmittedDiseases, 1998, 25(5):229–231.16. Hook EW and Handsfield HH,Gonococcal infections in the adult, in:

In Their Own Right The Alan Guttmacher Institute7879
Holmes KK et al., Sexually TransmittedDiseases, third ed., New York: McGraw-Hill, 1999, pp. 451–466.17. Sparling PF, Natural history ofsyphilis, in: ibid., pp. 473–478.18. Brackbill RM, Sternberg MR andFishbein M, Where do people go for treat-ment of sexually transmitted diseases?Family Planning Perspectives, 1999,31(1):10–15. 19. Panchaud C et al., 2001, op. cit.(see reference 14).20. Division of STD Prevention, CDC,Sexually Transmitted Disease Surveillance1999, Atlanta: CDC, 2000, pp. 79 and 89.21. AGI, unpublished tabulations of the1995 National Survey of AdolescentMales (NSAM) and the 1992 NationalHealth and Social Life Survey.22. Brackbill RM, Sternberg MR andFishbein M, 1999, op. cit. (see reference18).23. AGI, unpublished tabulations of the1991 National Survey of Men (NSM).
24. AGI, unpublished tabulations of the1995 NSAM.25. Piccinino LJ and Mosher WD, Trendsin contraceptive use: 1982–1995, FamilyPlanning Perspectives, 1998,30(1):4–10 & 46.26. Bankole A, Darroch JE and Singh S,Determinants of trends in condom use inthe United States, 1988–1995, FamilyPlanning Perspectives, 1999, 31(6):264–271.27. AGI, unpublished tabulations of the1995 NSAM and the 1991 NSM.28. Davis KR and Weller SC, The effec-tiveness of condoms in reducing hetero-sexual transmission of HIV, FamilyPlanning Perspectives, 1999, 31(6):272–279.29. Warner DL and Hatcher RA, Malecondoms, in: Hatcher RA et al., eds.,Contraceptive Technology, 17th ed., NewYork: Ardent Media, 1998, pp. 325–357.30. Tanfer K et al., Condom use amongU.S. men, Family Planning Perspectives,1993, 25(2):61–66.31. Ku L, Sonenstein FL and Pleck JH,The dynamics of young men’s condomuse during and across relationships,Family Planning Perspectives, 1994,24(6):246–251.32. Besharov DJ et al., eds., Why SomeMen Don’t Use Condoms: Male AttitudesAbout Condoms and OtherContraceptives, Menlo Park, CA: Henry J.Kaiser Family Foundation, 1997; SaccoWP et al., Gender differences in AIDS-relevant condom attitudes and condomuse, AIDS Education and Prevention,1993, 5(4):311–326; and Grady WR etal., Condom characteristics: the percep-tions and preferences of men in theUnited States, Family Planning Per-spectives, 1993, 25(2):67–73.33. Lindberg LD et al., Young men’sexperience with condom breakage, FamilyPlanning Perspectives, 1997,29(3):128–131 & 140.34. Bankole A, Darroch JE and Singh S,1999, op. cit. (see reference 26).
35. Anderson JE et al., Condom use andHIV risk behaviors among U.S. adults:data from a national survey, FamilyPlanning Perspectives, 1999, 31(1):
24–28.36. Ku L, Sonenstein FL and Pleck JH,1994, op. cit. (see reference 31).37. Forste R and Morgan J, How relation-ships of U.S. men affect contraceptiveuse and efforts to prevent sexually trans-mitted diseases, Family PlanningPerspectives, 1998, 30(2):56–62.38. Pleck JH, Sonenstein F and Ku LC,Masculinity ideology: its impact on ado-lescent males’ heterosexual relationships,Journal of Social Issues, 1993, 49(3):11–29.
BOX: MEN WHO HAVE SEX WITH MEN1. Laumann EO et al., The SocialOrganization of Sexuality: SexualPractices in the United States, Chicago:University of Chicago Press, 1994.2. Billy JOG et al., The sexual behavior ofmen in the United States, FamilyPlanning Perspectives, 1993,25(2):52–61.3. Ibid.4. Laumann EO et al., 1994, op. cit. (seereference 1).5. The Alan Guttmacher Institute (AGI),unpublished tabulations of the 1995 Na-tional Survey of Adolescent Males (NSAM).6. Laumann EO et al., 1994, op. cit. (seereference 1).7. Black D et al., Demographics of thegay and lesbian population in the UnitedStates: evidence from available systemat-ic data sources, Demography, 2000,37(2):139–154.8. Binson D et al., Prevalence and socie-tal distribution of men who have sex withmen: United States and its urban cen-ters, Journal of Sex Research, 1999,32(3):245–254.9. Centers for Disease Control andPrevention (CDC), HIV and AIDS—UnitedStates, 1981–2000, Morbidity andMortality Weekly Report, 2001, 50(21):430–434, Figure 2, p. 434.10. Winkelstein W et al., The SanFranciso Men’s Health Study: continueddecline in HIV seroconversion ratesamong homosexual/bisexual men,American Journal of Public Health,1988, 78(11):1472–1474; Ehrhardt AA,Yingling S and Warne PA, Sexual behaviorin the era of AIDS: what has changed inthe United States? Annual Review of SexResearch, 1991, 2(1):25–47; andCatania JA et al., Changes in condom useamong homosexual men in San Francisco,Health Psychology, 1991, 10(3):190–199.11. Shilts R, And the Band Played On:Politics, People, and the AIDS Epidemic,New York: St. Martin’s Press, 1987; andRevenson TA and Schiaffino KM,Community-based health interventions,in: Rappaport J and Seidman E, eds.,Handbook of Community Psychology, NewYork: Kluwer Academic Press/Plenum,2000, p. 471.12. CDC, HIV incidence among youngmen who have sex with men—seven U.S.cities, 1994–2000, Morbidity andMortality Weekly Report, 2001,50(21):440–444.13. Wolitski RJ et al., Are we headed fora resurgence of the HIV epidemic amongmen who have sex with men? AmericanJournal of Public Health, 2001,91(6):883–888.
14. CDC, Increases in unsafe sex and rec-tal gonorrhea among men who have sexwith men—San Francisco, California,Morbidity and Mortality Weekly Report,1999, 48(3):45. 15. Ibid.16. Fox KK et al., Gonorrhea in the HIVera: a reversal in trends among men whohave sex with men, American Journal ofPublic Health, 2001, 91(6):959–964.
CHAPTER 6: SEXUAL AND REPRODUCTIVEHEALTH INFORMATION AND SERVICESFOR MEN1. Miller BC, Families Matter: A ResearchSynthesis of Family Influences onAdolescent Pregnancy, The NationalCampaign to Prevent Teen Pregnancy,Washington, DC: 1998.2. The Alan Guttmacher Institute (AGI),unpublished tabulations of the 1995Survey of Adolescent Males (NSAM); andCenters for Disease Control andPrevention, Youth Risk BehaviorSurveillance: United States, 1995,Morbidity and Mortality Weekly Report,1996, 45(SS-4), Table 30.3. Holtzman D and Rubinson R, Parentand peer communication effects onAIDS-related behavior among U.S. highschool students, Family PlanningPerspectives, 1995, 27(6):235–240 &268.4. Miller KS et al., Family communica-tion about sex: what are parents saying,and are their adolescents listening?Family Planning Perspectives, 1998,30(5):218–222 & 235.5. Lindberg LD, Ku L and Sonenstein F,Adolescents’ reports of reproductivehealth education, 1988 and 1995,Family Planning Perspectives, 2000,32(5):220–226.6. Darroch JE, Landry DJ and Singh S,Changing emphases in sexuality educa-tion in U.S. public secondary schools,1988–1999, Family PlanningPerspectives, 2000, 32(5):204–211.7. Hoff T et al., Sex Education inAmerica: A Series of National Surveys ofStudents, Parents, Teachers, andPrincipals, Menlo Park, CA: Henry J.Kaiser Family Foundation, 2000, Table23, p. 31.8. Darroch JE, Landry DJ and Singh S,2000, op. cit. (see reference 6).9. Lindberg LD, Ku L and Sonenstein F,2000, op. cit. (see reference 5).10. Darroch JE, Landry DJ and Singh S,2000, op. cit. (see reference 6), Table 2,p. 223.11. Sonenstein FL et al., Involving Malesin Preventing Teen Pregnancy,Washington, DC: Urban Institute, 1997;and Office of Population Affairs,Department of Health and HumanServices, Title X Male InvolvementPrevention Services, 2000, <http://opa.osophs.dhhs.gov/titlex/ofp-male-grantees.html>, accessed Aug. 6, 2001.12. Hatcher RA et al., eds. ContraceptiveTechnology, 17th ed., New York: ArdentMedia, 1998, 333–334.13. Planned Parenthood Federation ofAmerica (PPFA), Birth Control Series, AllAbout Vasectomy, no date, <http://www.plannedparenthood.org/bc/allaboutvas.htm>, accessed Dec. 2, 2000.
References

14. AGI, Uneven & Unequal: InsuranceCoverage and Reproductive HealthServices, New York: AGI, no date, Table3, p. 11.15. PPFA, no date, op. cit. (see reference13).16. Marquette CM et al., Vasectomy inthe United States, American Journal ofPublic Health, 1995, 85(5):644–649.17. Bremner WJ et al., Current approach-es to systemic male contraception, in:Coutinho EM and Spinol P, eds., CurrentKnowledge in Reproductive Medicine,Amsterdam: Elsevier Science, 2000,pp. 315–331.18. Chandra A and Stephen EH, Impairedfecundity in the United States: 1982–1995, Family Planning Perspectives,1998, 30(1):34–42.19. Stephen EH and Chandra A, Use ofinfertility services in the United States,Family Planning Perspectives, 2000,32(3):132–137.20. Adams PF, Hendershot GE andMarano MA, Current estimates from theNational Health Interview Survey, 1996,Vital and Health Statistics, 2000, Series10, No. 200, Tables 58 and 63. 21. The National Cancer Institute, Copingwith prostate cancer, in: Prostate Cancer,<http://cancernet.nci.nih.gov/Cancer_Types/Prostate_Cancer.shtml>, accessed Nov. 9,2000.22. Rosenblatt KA, Wicklund KG andStanford JL, Sexual factors and the riskof prostate cancer, American Journal ofEpidemiology, 2001, 153(12):1152–1158.23. National Cancer Institute, Questionsand Answers About Testicular Cancer, nodate, <http://cis.nci.nih.gov/fact/6_34.htm>, accessed Oct. 13, 2000.24. National Cancer Institute, Testing fortesticular cancer, in: Testicular Cancer, nodate, <http://cancernet.nci.nih.gov/cancer_types/testicular_cancer.shtml>,accessed Aug. 13, 2001.25. National Cancer Institute, no date,op. cit. (see reference 23).26. Laumann EO, Paik A and Rosen RC,Sexual dysfunction in the United States,in: Laumann EO and Michael RT, eds.,Sex, Love and Health in America: PrivateChoices and Public Policies, Chicago:University of Chicago Press, 2001, pp. 353–376.27. Ibid., pp. 362 and 365.28. Mulcahy JJ, Erectile dysfunction—isthe incidence increasing? editorial,Journal of Urology, 2000, 163(2):47.29. Sonenstein FL, ed., Young Men’sSexual and Reproductive Health: Towarda National Strategy. Framework andRecommendations, Washington, DC:Urban Institute, 2000; Sonenstein FL etal., Involving Males in Preventing TeenPregnancy, Washington, DC: UrbanInstitute, 1997; EngenderHealth, MaleReproductive Health Services Model,2000, <http://www.engenderhealth.org/ia/wwm/emrhm0.html>, accessed Apr. 4,2001; and American Medical Association,Guidelines for Adolescent PreventiveServices Recommendations, 2000,<http://www.ama-assn.org/ama/pub/category/2279.html>, accessed Feb. 2,2001.30. Loft J et al., HIV prevention practicesof primary care physicians—United
States, 1992, Morbidity and MortalityWeekly Report, 1994, 42(51):988–992.31. Manzella K and Frost J, Family plan-ning annual report: 1995 summary, part2: detailed tables and data forms, sub-mitted to the Office of Population Affairs,Department of Health and HumanServices, New York: AGI, 1996.32. Landry DJ and Forrest JD, Publichealth departments providing sexuallytransmitted disease services, FamilyPlanning Perspectives, 1996,28(6):261–266.33. Ibid.; AGI, unpublished tabulations ofthe 1996–1998 National AmbulatoryMedical Care Surveys and the NationalHospital Ambulatory Surveys ofEmergency and Outpatient Departments;and Manzella K and Frost J, 1996, op.cit. (see reference 31).34. Ibid.35. Ibid.; and Hollmann FW et al., U.S.Population Estimates by Age, Sex, Raceand Hispanic Origin: 1990 to 1997,Washington, DC: U.S. Bureau of theCensus, 1998.36. AGI unpublished tabulations of the1999 Current Population Survey (CPS).37. Ibid.38. Mills RJ, Health insurance coverage—1999, Current Population Reports, 2000,Series P-60, No. 211.39. AGI, unpublished tabulations of the1999 CPS.40. Schulte MM and Sonenstein F, Menat family planning clinics: the newpatients? Family Planning Perspectives,1995, 27(5):212–216.41. Hellerstedt WL et al., Perceived knowl-edge and training needs in adolescentpregnancy prevention, Archives ofPediatrics and Adolescent Medicine,2000, 154(7):679–684.42. Sandman D, Simantov E and An C,Out of Touch: American Men and theHealth Care System, New York: TheCommonwealth Fund, 2000, Table 1, p. 37.43. Schulte MM and Sonenstein F, 1995,op. cit. (see reference 40).44. Sonenstein FL et al., 1997, op. cit.(see reference 29).
BOX: A MODEL SET OF SEXUAL ANDREPRODUCTIVE HEALTH INFORMATIONAND SERVICES FOR MEN1. American Medical Association,Guidelines for Adolescent PreventiveServices Recommendations, 2000,<http://www.ama-assn.org/ama/pub/category/2279.html>, accessed Feb. 2,2001; EngenderHealth, MaleReproductive Health Services Model,2000, <http://www.engenderhealth.org/ia/wwm/emrhm0.html>, accessed Apr. 4,2001; and Sonenstein FL, ed., YoungMen’s Sexual and Reproductive Health:Toward a National Strategy. Frameworkand Recommendations, Washington DC:Urban Institute, 2000.
CHAPTER 7: SUMMING UP1. Number of men: The Alan GuttmacherInstitute (AGI), unpublished tabulationsof the 1999 Current Population Survey.Sexual behavior, 15–19: AGI, unpublishedtabulations of the 1995 National Surveyof Adolescent Males (NSAM). Sexual
behavior, 20–49: AGI, unpublished tabula-tions of the 1992 National Health andSocial Life Survey.2. Condom use, 15–19: AGI, unpublishedtabulations of the 1995 NSAM. Condomuse, 20–39: AGI, unpublished tabulationsof the 1991 National Survey of Men.Condom use, 40–49: AGI, unpublishedtabulations of the 1996 and 1998General Social Surveys.3. Numbers and percentage distributionscalculated by applying age-specificbirthrates and abortion rates for 1994 tothe 1994 population of men 15–44.Birthrates and abortion rates: Darroch JE,Landry DJ and Oslak S, Pregnancy ratesamong U.S. women and their partners in1994, Family Planning Perspectives,1999, 31(3):122–126 &136, Table 1.Number of men: Deardorff KE, HollmannFW and Montgomery P, U.S. PopulationEstimates by Age, Sex, Race, andHispanic Origin: 1990 to 1994,Washington, DC: U.S. Bureau of theCensus, 1995.4. Goodwin MM et al., Intendedness andphysical abuse around the time of preg-nancy: findings from the Pregnancy RiskAssessment Monitoring System, 1996–1997, Maternal and Child HealthJournal, 2000, 4(2):85–92.5. Fathered a child, 15–19: AGI, unpub-lished tabulations of the 1995 NSAM.Fathered a child, 20–29: weighted averageof the proportions for 20–24 and 25–29from the 1992 Survey of Income andProgram Participation. See: Bachu A,Fertility of American Men, Working Paper,Washington, DC: Population Division,U.S. Bureau of the Census, 1996, No.14. Fathered a child, 30–39 and 40–49:AGI, unpublished tabulations of the1992–1994 National Survey of Familiesand Households.6. Cherlin AJ, Marriage, Divorce, andRemarriage, second ed., Cambridge, MA:Harvard University Press, 1992; andNational Institute of Child Health andHuman Development, Nurturing father-hood: improving data and research onmale fertility, family formation, andfatherhood, 1998 <http:// fatherhood.hhs.gov/CFSForum/front.htm>, accessedOct. 30, 2000.7. Sorensen E and Zibman C, Poor DadsWho Don’t Pay Child Support: Deadbeatsor Disadvantaged? New Federalism:Issues and Options for States Series,Washington, DC: Urban Institute, 2000,No. B-30.8. Sorensen E and Wheaton L, Incomeand Demographic Characteristics ofNonresident Fathers in 1993,Washington, DC: Urban Institute, 2000.9. Kirby D, Emerging Answers: ResearchFindings on Programs to Reduce TeenPregnancy, Washington, DC: The NationalCampaign to Prevent Teen Pregnancy,2001.

In Their Own Right The Alan Guttmacher Institute
Appendix
8081
U.S. total 68,952 12.6 47.8 54.3 22.7 24.0 29.8 63.7 54.0 75.0 12.1 12.9
Alabama 1,058 13.4 36.0 49.3 32.6 26.1 33.7 67.1 57.5 70.8 27.6 1.6Alaska 165 7.3 59.7 58.4 21.1 21.6 25.5 58.5 51.7 93.7 4.2 2.0Arizona 1,181 16.8 59.6 56.3 26.2 32.6 39.7 65.6 50.2 66.0 3.2 30.9Arkansas 633 12.8 34.3 44.5 33.9 34.7 40.8 71.1 54.4 79.3 18.0 2.7California 8,825 18.9 60.8 56.8 23.1 29.7 35.1 57.3 51.3 60.6 6.4 33.0
Colorado 1,128 8.5 62.9 64.4 20.0 19.2 22.8 64.5 52.2 80.1 3.6 16.3Connecticut 767 9.7 53.4 58.6 14.1 17.6 18.9 60.2 54.3 79.0 11.4 9.6Delaware 189 10.1 45.7 48.5 21.2 17.6 25.0 62.2 51.9 70.1 25.2 4.8D.C. 139 11.1 52.4 61.1 25.9 25.1 36.0 31.4 23.8 34.2 58.1 7.7Florida 3,590 13.4 43.2 53.0 29.2 26.8 32.8 60.4 50.3 65.6 14.7 19.7
Georgia 1,983 14.0 43.8 49.1 25.3 21.8 31.0 69.6 53.8 62.2 34.6 3.2Hawaii 290 9.3 55.3 56.2 19.4 23.9 29.9 57.1 48.5 93.6 2.4 4.0Idaho 319 13.7 54.7 53.8 30.0 30.4 34.1 75.2 61.7 87.9 0.3 11.8Illinois 3,123 11.1 51.0 58.1 17.5 18.4 24.5 61.6 53.9 73.5 14.1 12.4Indiana 1,508 13.5 36.2 45.9 22.3 20.8 23.1 68.6 58.0 91.1 5.9 3.1
Iowa 714 7.7 45.3 53.3 20.1 23.8 29.1 70.3 57.9 95.2 1.9 2.9Kansas 643 7.9 53.3 63.5 20.4 21.9 31.5 67.3 53.6 87.8 6.3 5.9Kentucky 990 17.2 38.5 46.0 27.1 24.6 32.3 72.7 61.1 89.9 8.7 1.4Louisiana 1,043 13.8 40.0 45.9 28.9 28.2 38.2 68.5 54.3 68.3 30.0 1.7Maine 301 7.0 42.0 47.2 31.8 20.2 28.5 64.6 56.7 99.4 0.2 0.3
Maryland 1,286 12.4 51.8 52.7 15.6 17.3 19.7 60.7 52.2 65.1 30.7 4.2Massachusetts 1,588 10.5 51.7 57.0 19.3 18.8 23.9 57.6 46.2 88.6 4.5 6.9Michigan 2,589 8.8 45.8 54.0 17.0 17.9 25.5 63.4 53.8 85.4 11.5 3.1Minnesota 1,249 4.8 52.6 68.9 20.0 17.5 18.8 62.7 59.4 93.5 3.7 2.8Mississippi 677 15.8 40.9 48.0 35.2 32.8 38.7 69.6 57.1 62.0 36.7 1.3
Missouri 1,400 10.4 43.9 57.3 25.2 20.2 27.1 65.7 54.0 89.1 9.2 1.7Montana 232 6.4 51.1 54.9 26.2 34.9 40.9 68.1 54.5 97.7 0.4 1.9Nebraska 421 7.1 51.7 57.5 21.9 23.6 29.0 69.1 58.0 90.3 4.1 5.6Nevada 453 13.3 52.1 49.4 20.0 24.1 27.2 60.6 54.3 73.0 5.5 21.5New Hampshire 318 10.5 53.1 54.5 18.7 16.8 20.3 68.5 57.9 97.3 1.5 1.3
New Jersey 2,042 8.1 47.4 59.4 16.6 16.9 20.4 62.2 53.2 72.2 14.5 13.3New Mexico 432 15.1 46.8 53.4 36.2 35.6 44.2 69.9 55.7 56.9 1.8 41.3New York 4,571 13.2 48.0 54.5 22.0 24.9 32.1 58.7 50.6 69.3 14.4 16.3North Carolina 1,840 14.5 41.2 49.2 28.1 22.3 30.0 66.5 56.3 74.4 21.5 4.1North Dakota 151 7.1 51.4 62.0 23.5 26.6 34.7 64.1 57.9 99.3 0.2 0.4
Ohio 2,755 7.9 41.2 52.9 18.4 20.9 26.9 66.0 56.9 88.0 10.2 1.8Oklahoma 790 10.0 50.6 54.0 25.2 28.0 32.5 68.8 60.0 87.3 9.2 3.5Oregon 868 12.8 56.4 59.5 21.5 27.7 32.7 63.4 56.5 88.0 1.8 10.2Pennsylvania 2,864 8.4 38.3 48.3 20.2 20.8 26.5 63.5 55.1 88.7 8.8 2.4Rhode Island 232 12.4 50.9 57.7 17.5 18.1 22.3 63.2 50.2 89.1 4.3 6.6
South Carolina 953 13.5 34.7 49.4 32.4 21.8 33.0 63.9 56.3 72.5 26.0 1.5South Dakota 188 7.0 41.9 55.7 29.5 28.0 31.6 66.2 52.5 96.8 1.8 1.4Tennessee 1,349 16.4 36.7 46.6 30.8 27.7 33.5 70.2 58.2 78.9 19.4 1.7Texas 5,268 17.5 48.1 52.5 25.2 30.6 34.6 67.4 57.2 55.0 12.0 33.1Utah 552 10.0 66.2 65.0 29.3 22.9 27.9 74.7 63.6 91.1 0.7 8.2
Vermont 155 8.7 42.5 50.3 31.1 22.9 29.2 65.6 54.0 98.9 0.2 0.9Virginia 1,729 9.2 49.9 58.5 19.1 16.7 23.2 62.3 52.7 76.0 20.7 3.3Washington 1,469 7.8 59.0 60.0 19.8 20.5 25.4 64.3 55.1 92.2 2.9 4.9West Virginia 426 16.6 30.5 36.0 31.0 36.0 39.9 69.3 57.0 96.6 3.1 0.4Wisconsin 1,390 8.0 44.2 56.1 17.1 18.6 23.3 67.7 53.2 91.3 6.0 2.7Wyoming 123 4.9 55.2 57.7 17.2 26.2 32.5 66.6 57.5 94.1 1.1 4.9
*The Current Population Survey (CPS) measures respondents’ health insurance coveragein the previous year. If an individual male had been covered by both Medicaid and pri-vate health insurance, he was counted as being covered only by Medicaid.†Data are based on New York City; no cases were reported elsewhere in the state.
Note: To obtain reasonably large samples for analysis of CPS data, we combined infor-mation for three years, 1998–2000, and calculated annual averages, centered on 1999.Similarly, data for 1980 are based on combining surveys conducted in 1979–1981. Sources: Number of men; education; poverty, marital, immigrant, employment and
No. (in 000s),
1999
% of men25–49 with
<highschool
education,1999
% of men25–49 with≥somecollege,1980
% of men25–49 with≥somecollege,1999
% of men20–49 at<200% of
poverty,1980
% of men20–49 at<200% of
poverty,1999
% ofwomen
20–49 at<200% of
poverty,1999
% of men20–49
currentlymarried,
1980
% of men20–49
currentlymarried,
1999
% of men15–49non-
Hispanicwhite,1999
% of men15–49non-
Hispanicblack,1999
% of men15–49
Hispanic,1999
State
EDUCATION POVERTY STATUS MARITAL STATUS RACE/ETHNICITY
APPENDIX: SOCIOECONOMIC AND DEMOGRAPHIC CHARACTERISTICS OF U.S. MEN, AND RATES OF SEXUALLY TRANSMITTED DISEASES,
MEN15– 49

U.S. total 13.3 90.2 3.4 5.2 71.9 22.8 3.9 20.5 94.7 136.0 2.9
Alabama 3.4 87.8 2.2 5.0 73.5 21.5 4.1 21.3 38.1 258.6 4.8Alaska 5.1 87.6 5.8 5.3 67.9 26.9 6.4 17.8 133.4 46.2 0.3Arizona 18.9 91.7 3.9 4.5 63.2 32.3 4.3 13.9 113.2 109.7 6.4Arkansas 3.9 88.2 5.1 5.1 67.5 27.4 3.3 27.8 101.7 134.6 3.5California 33.2 89.1 4.5 6.9 63.9 29.3 4.2 17.2 111.7 58.9 1.3
Colorado 10.8 92.7 1.7 3.1 75.3 21.6 5.1 16.7 135.5 63.8 0.1Connecticut 11.5 88.5 3.5 4.4 78.1 17.6 4.6 17.6 86.2 96.0 0.6Delaware 5.5 90.3 2.9 5.5 74.8 19.8 5.2 28.3 136.3 207.4 2.5D.C. 15.3 84.0 7.8 10.8 65.1 24.2 4.0 9.9 129.0 821.9 8.6Florida 20.7 89.1 2.7 4.0 66.6 29.4 4.2 15.7 74.4 163.7 3.0
Georgia 4.7 91.0 3.0 4.7 71.4 23.9 3.5 20.1 146.9 296.9 7.2Hawaii 17.5 88.0 5.6 6.6 76.6 16.9 4.3 23.6 97.5 35.3 0.2Idaho 8.2 93.6 2.7 3.3 72.7 23.9 3.4 24.9 72.7 7.5 0.2Illinois 14.0 91.6 3.1 3.4 76.7 19.8 3.5 11.8 123.7 196.6 4.1Indiana 2.6 91.6 2.3 2.7 81.3 16.0 4.3 12.6 80.6 98.8 7.8
Iowa 4.1 94.7 1.9 4.0 82.2 13.9 5.1 20.2 93.4 43.5 0.2Kansas 6.8 92.3 1.7 4.2 78.4 17.4 5.8 34.1 81.9 84.5 0.5Kentucky 2.6 89.9 3.4 5.2 72.6 22.2 4.7 16.3 69.5 87.4 2.9Louisiana 3.1 84.9 4.1 5.7 68.7 25.7 4.5 16.1 161.3 309.0 7.3Maine 2.0 90.4 3.9 4.5 75.9 19.6 5.8 37.1 37.8 7.1 0.0
Maryland 10.8 90.4 2.4 3.6 76.5 19.9 3.2 22.7 88.0 227.2 7.2Massachusetts 14.4 88.7 2.9 7.7 74.5 17.7 2.6 30.4 61.3 42.0 0.7Michigan 6.1 90.4 2.9 6.0 76.8 17.2 4.2 16.1 88.7 170.3 3.2Minnesota 6.9 93.3 1.8 5.4 81.5 13.1 3.8 41.2 85.1 57.3 0.2Mississippi 1.4 86.3 4.9 6.6 67.0 26.3 3.0 14.5 109.9 317.2 7.7
Missouri 2.7 91.0 2.9 3.9 80.0 16.1 2.4 21.1 69.9 141.6 1.8Montana 1.4 89.5 4.7 5.0 68.8 26.2 5.7 24.7 89.6 4.1 0.2Nebraska 6.6 93.3 2.2 3.4 80.1 16.5 3.3 21.0 87.5 80.8 0.4Nevada 20.3 94.0 3.6 2.7 68.3 29.0 5.5 22.9 65.9 92.5 0.2New Hampshire 4.3 91.9 2.1 3.4 78.8 17.8 5.6 36.8 35.5 9.3 0.0
New Jersey 19.1 90.6 4.8 3.2 74.8 22.1 2.7 26.4 32.6 102.2 0.9New Mexico 7.6 87.9 4.9 7.8 61.1 31.1 4.4 21.9 98.2 52.1 1.1New York 24.6 87.1 4.6 8.2 65.1 26.7 3.6 16.3 81.6† 105.0† 1.3†North Carolina 6.1 91.8 2.4 4.0 74.4 21.6 4.6 22.6 92.8 282.5 7.2North Dakota 1.1 92.6 2.6 3.1 77.7 19.2 4.8 23.8 84.1 11.6 0.0
Ohio 3.4 90.5 3.3 4.1 79.9 16.1 3.8 28.5 103.4 152.2 0.9Oklahoma 4.0 90.2 3.6 3.1 72.5 24.3 4.0 19.5 89.2 109.0 6.7Oregon 12.9 92.9 3.2 6.9 71.0 22.1 4.2 19.6 102.7 29.0 0.2Pennsylvania 4.2 90.4 3.3 6.4 79.0 14.7 3.5 32.7 78.8 102.9 1.0Rhode Island 12.3 91.5 3.4 6.6 78.9 14.5 3.3 14.8 121.2 48.4 0.4
South Carolina 1.7 91.9 3.1 3.2 77.1 19.7 4.9 26.8 90.8 489.7 8.2South Dakota 1.1 90.2 1.9 3.4 79.1 17.6 5.8 33.0 95.8 20.7 0.0Tennessee 2.3 89.6 3.4 13.2 67.4 19.3 3.5 14.2 119.5 244.3 13.7Texas 16.9 91.2 3.4 3.9 64.7 31.5 3.4 20.1 108.7 163.9 3.0Utah 8.5 95.1 3.0 2.3 78.2 19.5 2.6 21.0 57.6 14.8 0.2
Vermont 3.4 91.5 1.4 10.7 72.7 16.5 4.7 41.7 24.4 10.3 0.3Virginia 9.0 91.6 2.1 2.6 77.7 19.7 3.7 23.0 65.6 145.7 2.5Washington 9.6 91.9 3.1 5.8 74.6 19.6 5.2 33.7 109.0 39.7 2.6West Virginia 1.2 84.3 5.5 9.5 64.1 26.3 3.7 22.8 26.7 26.0 0.2Wisconsin 3.4 91.6 2.2 4.6 81.4 14.0 2.8 27.0 125.1 110.1 0.9Wyoming 1.6 93.5 4.2 4.1 75.1 20.8 5.3 14.1 57.1 7.0 0.0
health insurance status; and race/ethnicity: The Alan Guttmacher Institute, unpub-lished tabulations of the 1998–2000 CPS. Household headship and child support:Bernard SN and Knitzer J, Map and Track: State Initiatives to Encourage ResponsibleFatherhood, 1999 Edition, New York: National Center for Children in Poverty, 1999,
Appendix C, Table 1, p. 197, and Table 6, p. 203. Sexually transmitted diseases:Centers for Disease Control and Prevention (CDC), Sexually Transmitted DiseaseSurveillance, 1999, Atlanta: CDC, 2000, Tables 7, 11, 16, 18, 27 and 29.
% of men15–49
foreign-born,1999
% of men20–49 in
labor force,1999
% of men20–49 in
labor forcewho are
unemployed,1999
% of men15–49 withMedicaid,
1999
% of men15–49 with
private/other
insurance,1999
% of men15–49
uninsured,1999
% of house-holds with children
younger than18 headed byfather, 1996
% of child support
enforcementcases resultingin collection ofsupport, 1996
Chlamydiarate per100,000males 10and older,
1999
Gonorrhearate per100,000males 10and older,
1999
Syphilisrate per100,000males 10and older,
1999
State
IMMIGRANTSTATUS EMPLOYMENT STATUS HEALTH INSURANCE STATUS* HOUSEHOLD
HEADSHIPCHILD
SUPPORT SEXUALLY TRANSMITTED DISEASES
VARIOUS YEARS, BY STATE

In Their Own Right The Alan Guttmacher Institute
Tables
8283
Table 1.1: Men and women experience importantsexual and reproductive events at similar ages.
Event Median age*
Men Women
Spermarche/menarche 14.0 12.6First intercourse 16.9 17.4First marriage 26.7 25.1First birth 28.5 26.0Intend no more children 33.2 30.9
*Age by which half of men or women have experienced the event.Sources: Men: Spermarche: Kulin HE et al., The onset of sperm produc-tion in pubertal boys: relationship to gonadotropin excretion, AmericanJournal of Diseases of Children, 1989, 143(2):190–193. First inter-course: AGI, unpublished tabulations of the 1995 National Survey ofAdolescent Males. First marriage: U.S. Bureau of the Census, TableMS-2, Estimated median age at first marriage, by sex: 1890 to thepresent, 1999,<http://www.census.gov/population/socdemo/ms-la/tabms-2.txt>, accessed Sept. 14, 2000. First birth: Estimated asequivalent to the median for women plus 2.5 years, which is the differ-ence between women’s and men’s median age at birth in the five yearsbefore the interview date, based on women’s reports in the 1995National Survey of Family Growth (NSFG). Intend no more children:AGI, unpublished tabulations of the 1992–1994 National Survey ofFamilies and Households. Women, all events: AGI, unpublished tabula-tions of the 1995 NSFG.
Table 1.2: American men 15–49 have diverse socialand economic characteristics.
Characteristic % distribution of men 15–49,1999 (N=68.9 million)
Race/ethnicityWhite 70Hispanic 13Black 12Asian/Pacific Islander 4Native American 1
Poverty statusPoor 10Low-income 16Moderate-income 25Better-off 49
Marital statusMarried 46Separated/divorced/widowed 10Never-married 44
Total 100
Note: Poverty level is based on the individual’s family income and thenumber of people in the family. Men are classified as poor if their fami-ly income is less than 100% of the poverty level ($16,450 for a familyof four in 1998), low-income if it is 100–199% of poverty, moderate-income if it is 200–349% of poverty and better-off if it is more than350% of poverty. Source: AGI, unpublished tabulations of the 1999Current Population Survey.
TABLES
Table 1.3: In the United States, race/ethnicity andpoverty status are closely related.
Poverty % distribution of men 15–49, by poverty status, 1999
White Hispanic Black Asian/ Native(N=48.3 (N=8.8 (N=8.4 Pacific Americanmillion) million) million) Islander (N=
(N=2.9 500,000)million)
Poor 6 20 17 10 16Low-income 12 30 21 15 21Moderate-
income 25 27 27 24 29Better-off 57 23 35 51 34Total 100 100 100 100 100
Source: AGI, unpublished tabulations of the 1999 Current PopulationSurvey.
Table 2.1: Many adolescent men live with only oneparent, are both going to school and working, comefrom poor or low-income families and have no healthinsurance.
Characteristic % distribution of men, 1999(N=10.2 million)
Living arrangements*Two parents 66Mother only 24Father only 5Other 5
School/work†School only 46School and work 33Work only 16No school or work 5
Poverty status‡Poor 15Low-income 18Moderate-income 25Better-off 42
Health insurance coverage‡Medicaid 12Other government 1Private 67None 20
Total 100
*Based on 12–17-year-olds; data are for 1998. †Based on 16–19-year-olds. ‡Based on 15–19-year-olds. Sources: Living arrangements:Lugaila TA, Marital status and living arrangements: March 1998(update), Current Population Reports, 1998, Series P-20, No. 514, Table4, pp. 26–30. All other measures: AGI, unpublished tabulations of the1999 Current Population Survey.

Table 2.2: Most men begin sexual intercourse duringtheir teenage years.
Age % of men who have had intercourse, 1995
All White Hispanic Black
11 1.6 1.1 1.9 6.012 3.2 1.9 3.4 10.013 6.1 3.4 6.9 18.914 13.4 8.5 17.7 34.615 22.7 15.6 30.2 53.016 36.3 29.3 41.5 67.517 52.4 45.6 60.2 80.218 66.1 60.0 74.3 89.319 78.4 75.5 78.2 92.9
Source: AGI, unpublished tabulations of the 1995 National Survey ofAdolescent Males.
Table 2.3: By their late teenage years, just over twoin 10 sexually experienced men have had only onepartner, and almost three in 10 have had six or more.
Characteristic % distribution of sexually experienced men18–19, by number of partners, 1995
1 2–5 ≥6
All 23 49 28
Poverty statusPoor/low-income 22 48 30Moderate-income/
better-off 24 50 26
Race/ethnicityWhite 28 51 21Hispanic 17 45 38Black 8 42 50
Source: AGI, unpublished tabulations of the 1995 National Survey ofAdolescent Males.
Table 2.4: Most adolescent men and their partnersuse contraceptives, but their methods change overtime.
Timing of intercourse % of men 15–19, by method used, 1995
Condom Condom Withdrawal Femaleonly plus other methods
method only*
First† 60 7 2 4Most recent‡ 40 20 2 18
*Pill, implant, injectable, IUD, female sterilization, female condom,spermicide, douche, vaginal film or periodic abstinence. †Based onthose who are sexually experienced. ‡Based on those who have hadintercourse in the past month. Note: When respondents reported usingmore than one method, they were assigned to only one category,according to the effectiveness of any male method used: vasectomy,condom only, condom plus another method, withdrawal, all femalemethods. Source: AGI, unpublished tabulations of the 1995 NationalSurvey of Adolescent Males.
Table 2.5: Very few teenage men become fathers.
Characteristic % of men 15–19 who are fathers, 1995
All 2.7
Age15–17 0.618–19 6.2
Poverty statusPoor 4.4Low-income 2.2Moderate-income 2.3Better-off 2.9
Race/ethnicityWhite 2.3Hispanic 3.3Black 4.4
Source: AGI, unpublished tabulations of the 1995 National Survey ofAdolescent Males.
Table 2.6: Seven percent of births and 13% ofabortions involve men in their teens.
Age % distribution of men, by age at conception, 1994
Births (N=3.9 million) Abortions (N=1.4 million)
<18 2 518–19 5 8All other 93 87Total 100 100
Sources: Numbers and percentage distributions calculated by applyingage-specific birthrates and abortion rates for 1994 to the 1994 popula-tion of men 15–44. Birthrates and abortion rates: Darroch JE, LandryDJ and Oslak S, Pregnancy rates among U.S. women and their partnersin 1994, Family Planning Perspectives, 1999, 31(3):122–126 & 136,Table 1. Number of men: Deardorff KE, Hollmann FW and MontgomeryP, U.S. Population Estimates, by Age, Sex, Race, and Hispanic Origin:1990 to 1994, Washington, DC: U.S. Bureau of the Census, 1995.

In Their Own Right The Alan Guttmacher Institute
Tables
8485
Table 3.1: As men move through their 20s, they areincreasingly likely to be married or cohabiting,employed, covered by health insurance and better-offeconomically.
Characteristic % distribution of men, 1990s
20–24 25–29(N=9.2 (N=9.1million) million)
Union statusCurrently married 18 42Cohabiting 9 13Divorced/separated/widowed 3 7Never-married and not cohabiting 70 38
Employment statusCurrently employed 73 87Seeking employment 7 5Not in labor force 20 8
Health insurance coveragePrivate 57 65Medicaid 5 3Other government 1 1None 37 31
Poverty statusPoor 13 10Low-income 20 16Moderate-income 27 26Better-off 40 48
Total 100 100
Sources: Union status, 20–24: AGI, unpublished tabulations of the1991 National Survey of Men. Union status, 25–29: AGI, unpublishedtabulations of the 1992–1994 National Survey of Families andHouseholds. All other measures: AGI, unpublished tabulations of the1999 Current Population Survey.
Table 3.2: Union status varies by race and ethnicity,especially in men’s late 20s.
Characteristic % distribution of men, by union status, early 1990s
Currently Cohabiting Divorced/ Never- Totalmarried separated/ married
widowed and notcohabiting
All men 20–24 18 9 3 70 100White 18 10 3 69 100Hispanic 23 5 4 68 100Black 12 10 2 76 100
All men 25–29 41 13 7 39 100White 47 11 7 34 100Hispanic 28 23 2 47 100Black 16 16 9 59 100
Sources: Men 20–24: AGI, unpublished tabulations of the 1991National Survey of Men. Men 25–29: AGI, unpublished tabulations ofthe 1992–1994 National Survey of Families and Households.
Table 3.3: Two-thirds of all sexually experienced menin their 20s had one partner in the past year, but thisproportion varies among subgroups.
Characteristic % distribution of sexually experienced men 20–29,by number of partners in the past year, 1992
0 1 2–5 ≥6 Total
All men 20–29 4 65 26 5 100
Age20–24 3 56 33 8 10025–29 5 71 21 3 100
Union statusMarried 1 94 4 1 100Cohabiting 0 70 25 5 100Never-married 7 48 37 8 100
Note: The survey included too few divorced, separated or widowed mento permit separate measures for this group. However, they are includedin the distributions according to age. Source: AGI, unpublished tabula-tions of the 1992 National Health and Social Life Survey.
Table 3.4: Most sexually active men in their 20s ortheir partners use contraceptives.
Men’s age Among men who had intercourse inand method the past month, % using various
methods, 1991
All Married/ Not in a unioncohabiting
20–24 82 68 91Vasectomy 0 0 0Condom only 21 14 26Condom plus other method 18 8 24Withdrawal 4 5 3Female methods only* 39 41 38
25–29 87 84 95Vasectomy 3 4 0Condom only 20 17 27Condom plus other method 14 11 24Withdrawal 5 5 3Female methods only* 45 47 41
*Pill, implant, injectable, IUD, female sterilization, female condom,spermicide, douche, vaginal film or periodic abstinence. Source: AGI,unpublished tabulations of the 1991 National Survey of Men.

Table 3.5: Forty-nine percent of births and 53% ofabortions involve men in their 20s.
Age % distribution of men, by age at conception, 1994
Births (N=3.9 million) Abortions (N=1.4 million)
20–24 21 2925–29 28 24All other 51 47Total 100 100
Sources: Numbers and percentage distributions calculated by applyingage-specific birthrates and abortion rates for 1994 to the 1994 popula-tion of men 15–44. Birthrates and abortion rates: Darroch JE, LandryDJ and Oslak S, Pregnancy rates among U.S. women and their partnersin 1994, Family Planning Perspectives, 1999, 31(3):122–126 & 136,Table 1. Number of men: Deardorff KE, Hollmann FW and MontgomeryP, U.S. Population Estimates, by Age, Sex, Race, and Hispanic Origin:1990 to 1994, Washington, DC: U.S. Bureau of the Census, 1995.
Table 3.6: Men who are poor or low-income or havelittle education are the most likely to have had a childby their late 20s.
Characteristic % of men 30–34, by ageat first child’s birth, early 1990s
<25 25–29
All men 30–34 26 24
Education<high school 53 22Complete high school 32 21Some college 22 31≥college 7 20
Poverty statusPoor 35 33Low-income 35 42Moderate-income 32 23Better-off 17 19
Race/ethnicityWhite 22 24Hispanic 40 23Black 39 24
Note: These data are based on men’s actual reporting, which may beunderstated (see box, page 13). Source: AGI, unpublished tabulationsof the 1992–1994 National Survey of Families and Households.
Table 4.1: In their 30s and 40s, men are increasinglylikely to be married and have at least a moderateincome; the vast majority have a job and health insur-ance.
Characteristic % distribution of men, 1990s
30–39 40–49(N=21.0 (N=20.5million) million)
Union statusCurrently married 65 78Cohabiting 7 4Divorced/separated/widowed 9 13Never-married and not cohabiting 19 5
Poverty statusPoor 8 7Low-income 16 12Moderate-income 27 23Better-off 49 58
Employment statusCurrently employed 89 88Seeking employment 3 3Not in labor force 8 9
Health insurance coverageMedicaid 4 4Other government 1 2Private 73 78None 22 16
Total 100 100
Sources: Union status: AGI, unpublished tabulations of the 1992–1994National Survey of Families and Households. All other measures: AGI,unpublished tabulations of the 1999 Current Population Survey.
Table 4.2: In their 30s and 40s, poor men and blackmen are the least likely to be married.
Characteristic % distribution of men, by union status, early 1990s
Currently Cohabiting Divorced/ Never- Totalmarried separated/ married
widowed and notcohabiting
All men 30–49 71 6 11 12 100
Race/ethnicityBlack 52 8 20 20 100Hispanic 69 10 9 12 100White 74 5 10 11 100
Poverty statusPoor 60 13 18 9 100Low-income 74 8 13 5 100Moderate-
income 76 4 10 10 100Better-off 77 5 8 10 100
Source: AGI, unpublished tabulations of the 1992–1994 National Surveyof Families and Households.

Table 4.5: From men’s 30s to their 40s, the propor-tion with no children drops steeply and the proportionwith three or more rises.
Age % distribution of men, by number of children, early 1990s
0 1 2 ≥3 Total
30–39 33 19 28 20 10040–49 15 16 38 31 100
Source: AGI, unpublished tabulations of the 1992–1994 NationalSurvey of Families and Households.
Table 4.6: Forty-four percent of births and 34% ofabortions involve men in their 30s and 40s.
Age % distribution of men, by age at conception, 1994
Births (N=3.9 million) Abortions (N=1.4 million)
30–34 25 1535–39 14 11≥40 5 8All other 56 66Total 100 100
Sources: Numbers and percentage distributions calculated by applyingage-specific birthrates and abortion rates for 1994 to the 1994 popula-tion of men 15–44. Birthrates and abortion rates: Darroch JE, LandryDJ and Oslak S, Pregnancy rates among U.S. women and their partnersin 1994, Family Planning Perspectives, 1999, 31(3):122–126 & 136,Table 1. Number of men: Deardorff KE, Hollmann FW and MontgomeryP, U.S. Population Estimates, by Age, Sex, Race, and Hispanic Origin:1990 to 1994, Washington, DC: U.S. Bureau of the Census, 1995.
Table 4.7: Fatherhood may encompass more than aman’s biological children.
Age Mean number of children per man, early 1990s
Biological Adopted, foster Totaland stepchildren
30–34 1.2 0.2 1.435–39 1.7 0.4 2.140–44 2.0 0.4 2.445–49 2.1 0.5 2.6
Source: AGI, unpublished tabulations of the 1992–1994 NationalSurvey of Families and Households.
In Their Own Right The Alan Guttmacher Institute
Tables
8687
Table 4.3: The great majority of men in their 30s and40s, except for those not in union, have only one sex-ual partner in a given year.
Characteristic % distribution of sexually experienced men,by number of partners in the past year, 1992
0 1 2–5 ≥6 Total
All men 30–49 4 81 14 1 100
Age30–39 3 80 15 2 10040–49 5 83 12 0 100
Union statusMarried 1 93 6 0 100Cohabiting 0 86 14 0 100Divorced/separated/
widowed 19 33 43 5 100Never-married and
not cohabiting 14 43 41 2 100
Source: AGI, unpublished tabulations of the 1992 National Health andSocial Life Survey.
Table 4.4: Reliance on vasectomy increases rapidlyin men’s late 30s, but female methods provide thegreater part of overall protection.
Men’s age Among men who had intercourse inand method the past month, % using various
methods, 1991
All Married/ Not in a unioncohabiting
30–34 81 80 85Vasectomy 5 6 2Condom only 15 12 28Condom plus other method 7 6 8Withdrawal 4 5 1Female sterilization 17 19 11Other female methods only* 33 32 35
35–39 84 83 91Vasectomy 20 21 12Condom only 11 11 17Condom plus other method 5 4 15Withdrawal 3 3 3Female sterilization 24 25 15Other female methods only* 21 19 29
*Pill, implant, injectable, IUD, female condom, spermicide, douche,vaginal film or periodic abstinence. Notes: No national statistics areavailable on the contraceptive use of men 40 and older. When respon-dents reported using more than one method, they were assigned to onlyone category, according to the effectiveness of any male method used:vasectomy, condom only, condom plus another method, withdrawal, allfemale methods. Source: AGI, unpublished tabulations of the 1991National Survey of Men.

Table 5.1: Genital herpes is most common amongmen who are poor or black.
Characteristic % of men 15–49 with herpes simplexvirus type 2, 1988–1994
All 17
Poverty statusPoor 25Low-income 17Moderate-income 18Better-off 16
Race/ethnicityWhite 15Mexican American 17Black 31
Note: The survey oversampled Mexican Americans; therefore, estimatescan be made for this subgroup of Hispanic men. Other Hispanic menwere included in a residual race/ethnicity category (“other”); therefore,all Hispanics could not be analyzed as a group. Source: AGI, unpub-lished tabulations of the 1988–1994 National Health and NutritionExamination Surveys.
Table 5.2: Men in their teens and 20s are the mostlikely to contract chlamydia and gonorrhea.
Age Rate of new infections per 100,000 men, 1999
Chlamydia Gonorrhea
15–19 344 34120–24 504 58625–29 245 35230–34 108 20735–39 56 14440–44 29 9845–54 13 51
Note: Rates are based on numbers reported to state health depart-ments and suffer from substantial levels of underreporting; however,relative differences by age likely indicate real patterns of variation.Source: Division of STD Prevention, Centers for Disease Control andPrevention (CDC), Sexually Transmitted Disease Surveillance, 1999,Atlanta: CDC, 2000, pp. 79 and 89.
Table 5.3: Use of the condom is quite high at youngerages but declines as men get older.
Age % of men who used condoms in the past month, 1990s
Condom only Condom plus other method
15–17 47 2018–19 35 2020–24 21 1825–29 20 1430–34 15 635–39 11 5
Note: For men 15–19, figures are for use at most recent intercourse inthe past month. For those 20 and older, figures are for use any time inthe past month. Source: AGI, unpublished tabulations of the 1995National Survey of Adolescent Males and 1991 National Survey of Men.
Table 6.1: Testing and treatment for STDs, includingHIV, are the primary reasons men seek sexual andreproductive health care.
Type of service % distribution of annual sexualand reproductive health visitsmade by men 15–49, 1990s
HIV/other STD services 52Prostate 18Family planning 8Psychosexual/other 22Total 100
Note: Each year, men 15–49 made an estimated 10.9 million visits toprivate physicians’ offices, hospital outpatient departments, hospitalemergency rooms, family planning clinics and STD clinics for sexualand reproductive health services. To give appropriate weight to all ser-vices obtained, the denominator of the percentage distribution is allreported sexual health services received. A visit was counted more thanonce if it involved more than one of these sevices. Sources: AGI, unpub-lished tabulations of the 1996–1998 National Ambulatory Medical CareSurveys and the National Hospital Ambulatory Medical Care Surveys ofEmergency and Outpatient Departments; Manzella K and Frost J, Familyplanning annual report: 1995 summary, part 2: detailed tables anddata forms, report submitted to the Office of Population Affairs,Department of Health and Human Services, New York: AGI, 1996; andLandry DJ and Forrest JD, Public health departments providing sexuallytransmitted disease services, Family Planning Perspectives, 1996,28(6):261–266.
Table 6.2: Older men and black men are the mostlikely to make sexual and reproductive health visits.
Characteristic Mean annual number of visitsper 100 men, late 1990s
All men 15–49 14.4
Age15–19 5.720–24 8.425–29 12.030–34 15.835–39 15.840–44 19.345–49 23.3
Race/ethnicityWhite 13.5Hispanic 12.3Black 22.3
Note: Includes visits to private physicians’ offices, hospital outpatientdepartments and hospital emergency rooms. Sources: Number of visits:AGI, unpublished tabulations of the 1996–1998 National AmbulatoryMedical Care Surveys and the National Hospital Ambulatory MedicalCare Surveys of Emergency and Outpatient Departments. Base popula-tions: Hollmann FW et al., U.S. Population Estimates by Age, Sex, Raceand Hispanic Origin: 1990 to 1997, Washington, DC: U.S. Bureau of theCensus, 1998.

In Their Own Right The Alan Guttmacher Institute
Tables
88
Table 6.3: At every age, poor and low-income menare the most likely to be uninsured.
Characteristic % uninsured, 1999
Age 15–19Poor 38Low-income 33Moderate-income 18Better-off 8
Age 20–29Poor 59Low-income 49Moderate-income 34Better-off 21
Age 30–39Poor 54Low-income 40Moderate-income 21Better-off 10
Age 40–49Poor 46Low-income 36Moderate-income 20Better-off 6
Source: AGI, unpublished tabulations of the 1999 Current PopulationSurvey.
Table 7.1: Men’s sexual and reproductive healthbehaviors, and hence their needs, change over thecourse of their lives.
Age 15–19 20–29 30–39 40–49
No. of men (in millions) 10.2 17.9 20.6 20.2
% of all men who:Ever had intercourse 55.2 92.8 97.5 99.8Had intercourse in past month 29.9 75.1 87.3 87.8Had ≥2 partners in past year 24.8 28.8 16.6 12.0Used condom in past month 17.4 27.1 16.3 15.4Are involved in a pregnancy
each year 5.2 14.1 8.6 3.3Have fathered a child 2.7 30.0 67.0 87.0
Sources: Number of men: AGI, unpublished tabulations of the 1999Current Population Survey. Sexual behavior, 15–19: AGI, unpublishedtabulations of the 1995 National Survey of Adolescent Men (NSAM).Sexual behavior, 20–49: AGI, unpublished tabulations of the 1992National Health and Social Life Survey. Condom use, 15–19: AGI,unpublished tabulations of the 1995 NSAM. Condom use, 20–39: AGI,unpublished tabulations of the1991 National Survey of Men. Condomuse, 40–49: AGI, unpublished tabulations of the 1996 and 1998General Social Surveys. Pregnancy involvement: Numbers and percent-age distributions calculated by applying age-specific birthrates andabortion rates for 1994 to the 1994 population of men 15–44.Birthrates and abortion rates: Darroch JE, Landry DJ and Oslak S,Pregnancy rates among U.S. women and their partners in 1994, FamilyPlanning Perspectives, 1999, 31(3):122–126 & 136, Table 1. Numberof men: Deardorff KE, Hollmann FW and Montgomery P, U.S. PopulationEstimates, by Age, Sex, Race, and Hispanic Origin: 1990 to 1994,Washington, DC: U.S. Bureau of the Census, 1995. Fathered a child,15–19: AGI, unpublished tabulations of the 1995 NSAM. Fathered achild, 20–29: weighted average of the proportions for 20–24 and25–29 from the 1992 Survey of Income and Program Participation. See:Bachu A, Fertility of American Men, Working Paper, Washington, DC:Population Division, U.S. Bureau of the Census, 1996, No. 14.Fathered a child, 30–39 and 40–49: AGI, unpublished tabulations ofthe 1992–1994 National Survey of Families and Households.

© 2002 The Alan Guttmacher Institute, A not-for-profit corporation for sexual and reproductive health research, policy analysis and public education;all rights, including translation into other languages, reserved under the UniversalCopyright Convention, the BerneConvention for the Protection of Literaryand Artistic Works and the Inter–and Pan American Copyright Conventions(Mexico City and Buenos Aires).
Rights to translate information containedin this report may be waived.
ISBN: 0-939253-57-7
In Their Own Right: Addressing theSexual and Reproductive Health Needs of American Men may be purchased for $20; postage and handling are additional. Volume discounts are available upon request.
The Alan Guttmacher InstituteA not-for-profit corporation for sexual and reproductive health research,policy analysis and public education.
120 Wall StreetNew York, NY 10005Telephone: 212-248-1111Fax: 212-248-1951E-mail: [email protected]
1120 Connecticut Avenue NW Suite 460Washington, DC 20036
www.guttmacher.org
Design: Nestor.Stermole VCG, New York City.
Photography ©: Cover, Brad Wilson/Photonica;page 6, Leila Pivetta/Getty Images/FPG; page14, Nicolas Russell/Getty Images/Image Bank;page 26, Eyewire; page 38, Photonica/ZEFAZeitgeist; page 50, Arunas Klupsas/Nonstock;page 58, Michael Krasowitz/Getty Images/FPG;page 7, Mel Curtis/PhotoDisc.