Embed Size (px)
Citation preview

“In the Heart of the Storm”
Cerritos College11th Annual Advisory CommitteeMember Recognition Breakfast
Jack Kyser Sr. VP & Founding Economist,
The Kyser Center for Economic Research, LAEDC
Thursday April 30, 2009

The U.S., California & Southern The U.S., California & Southern California are in a RecessionCalifornia are in a Recession
How much longer will it last?
What type of recovery will we see?
Impact of Federal Stimulus & State Budget

Jobless Rates High & RisingJobless Rates High & Rising
3
4
5
6
7
8
9
10
11
Ja
n-9
0
Ja
n-9
1
Ja
n-9
2
Ja
n-9
3
Ja
n-9
4
Ja
n-9
5
Ja
n-9
6
Ja
n-9
7
Ja
n-9
8
Ja
n-9
9
Ja
n-0
0
Ja
n-0
1
Ja
n-0
2
Ja
n-0
3
Ja
n-0
4
Ja
n-0
5
Ja
n-0
6
Ja
n-0
7
Ja
n-0
8
Ja
n-0
9
U.S. 8.5%
California 11.2%
March 2009
Sources: BLS, CA EDD
Percent Unemployed (SA)

Job Counts Dropping FastJob Counts Dropping Fast
-4-3-2-1012345
90:1 92:1 94:1 96:1 98:1 00:1 02:1 04:1 06:1 08:1Year: Quarter
Rest of U.S.
California
Year/Year % Change
Sources: Bureau of Labor Statistics, CA EDD

U.S. EQUITY PRICES
600
700
800
900
1,000
1,100
1,200
1,300
1,400
1,500
1,600
96:12 98:6 99:12 01:6 02:12 04:6 05:12 07:6 08:12Year: Month
S& P Index
1,250
1,600
1,950
2,300
2,650
3,000
3,350
3,700
4,050
4,400
4,750NASDAQ Index
S&P 500
NASDAQ Composite

Source: BEA
U.S. Light Vehicle Sales
3
4
5
6
7
8
9
10
11
12
Jan
-90
Jan
-91
Jan
-92
Jan
-93
Jan
-94
Jan
-95
Jan
-96
Jan
-97
Jan
-98
Jan
-99
Jan
-00
Jan
-01
Jan
-02
Jan
-03
Jan
-04
Jan
-05
Jan
-06
Jan
-07
Jan
-08
Jan
-09
Latest Month Plotted: Feb 2009
Mil
lio
ns o
f V
eh
icle
s S
AA
R
3
4
5
6
7
8
9
10
11
12
Cars
Light Trucks
U.S Housing Starts Are DownU.S Housing Starts Are Down
0200400600800
1,0001,2001,4001,6001,8002,0002,200
Multiple FamilySingle Family
Forecast
000s of Dwelling Units
Source: U.S. Census Bureau, forecast by LAEDC

1.15
1.20
1.25
1.30
1.35
1.40
Jan. 2006 Jul. 2006 Jan. 2007 Jul. 2007 Jan. 2008 Jul. 2008 Jan. 2009
Rat
io
Inventory-to-Sales Ratio

Tracking Retail SalesTracking Retail Sales
-12%
-10%
-8%
-6%
-4%
-2%
0%
2%
4%
6%
8%
Jan-07 May-07 Sep-07 Jan-08 May-08 Sep-08 Jan-09
Total Retail Sales
Core Retail Sales
Source: US Census Bureau
Year-Over-Year % Change

Spot Energy PricesSpot Energy Prices
0
2
4
6
8
10
12
14
Jan
-99
Jul-
99
Jan
-00
Jul-
00
Jan
-01
Jul-
01
Jan
-02
Jul-
02
Jan
-03
Jul-
03
Jan
-04
Jul-
04
Jan
-05
Jul-
05
Jan
-06
Jul-
06
Jan
-07
Jul-
07
Jan
-08
Jul-
08
Jan
-09
0
20
40
60
80
100
120
140
160West TX Intermediate -->
<-- Natural Gas (Henry Hub)
$/Mcf $/Barrel
Sources: EIA, Natural Gas Weekly
Latest Month Plotted: Feb 2009

CONSUMER INFLATION
-2.5%
-1.5%
-0.5%
0.5%
1.5%
2.5%
3.5%
4.5%
5.5%
2004 2005 2006 2007 2008 2009 2010
Source: Bureau of Labor Statistics
ForecastHistory
Year-Year % Change in CPI-U

Interest RatesInterest Rates
0.0
1.0
2.0
3.0
4.0
5.0
6.0
2003 2004 2005 2006 2007 2008 2009f 2010f
0.0
2.0
4.0
6.0
8.0
10.0
Fed Funds Rate
10Yr Treasury Note
Bank Prime Rate
30Yr Fixed Mortgage
4th Quarter Averages %

U.S. Economic GrowthU.S. Economic Growth
1.6
2.5
3.62.9
21.3 1.4
2.8
-3.2-4.0
-3.0
-2.0
-1.0
0.0
1.0
2.0
3.0
4.0
5.0
'02 '03 '04 '05 '06 '07 '08 '09f '10f
% Change in Real GDP, Year-Over-Year
Sources: BEA, forecasts by LAEDC

Risks to the ForecastRisks to the Forecast Upside:
• Lower energy prices/costs
Downside:
• Bank lending constraints
• The length and depth of the housing and automotive downturns
• “Fear”

Global Growth RetreatsGlobal Growth Retreats
-3.0-1.50.01.53.04.56.07.59.0
10.512.0
World Euro Area DevelopingAsia
Latin/SouthAmerica
Japan
2007 2008e2009f 2010f
Annual % Change
Source: IMF (Jan., 2009)
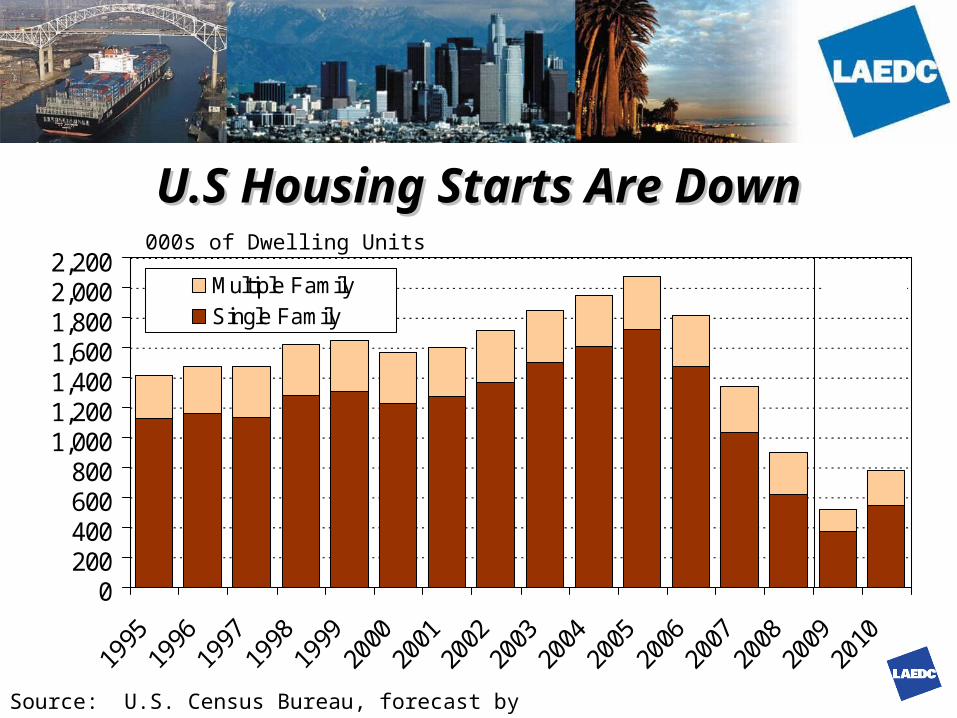
California Fundamentals
0%
2%
4%
6%
8%
10%
12%
90-0
191
-01
92-0
193
-01
94-0
195
-01
96-0
197
-01
98-0
199
-01
00-0
101
-01
02-0
103
-01
04-0
105
-01
06-0
107
-01
08-0
109
-01
-800
-600
-400
-200
0
200
400
600
800
Nonfarm Jobs: -62,100
Unemployment Rate: 11.2%
Un
emp
loym
ent
Rat
e
Ch
ang
e in
No
nfa
rm J
ob
s Y
ear/
Yea
r (0
00s)
Source: California Employment Development Dept.
March 2009
NSA

-110.5
-94.1
-91.6
-36.5
-32.5
-23.3
-22.8
-9.4
11.8
32.3
-0.1
-150 -125 -100 -75 -50 -25 0 25 50
Construction
Manufacturing
Retail Trade
Leisure & Hospitality
Finance & Insurance
Prof'l, Scientific & Tech.
Wholesale Trade
Real Estate
Government
Private Education
Health Care
Source: California Employment Development Dept; forecasts by LAEDC.
2009 Industry Winners and Losers--California2009 Industry Winners and Losers--California
Total Change: -447.5
Year-Year Change in Average Employment (000s)

Job Growth by Metro AreasJob Growth by Metro Areas
-82.8
-71.9
-45.4
-44.6
-43.0
-36.7
-36.6
-13.9
-8.9
-4.9
-4.5
-149.4
-2.5
-170 -145 -120 -95 -70 -45 -20 5
Los AngelesInland Empire
OrangeSacramento
San DiegoOakland
San JoseSan Francisco
VenturaFresno
ModestoStockton
BakersfieldNonfarm Numerical Employment Change in Thousands March ’08 -’09
Sources: CA EDD, Labor Market Information Division

CALIFORNIA HOUSING MARKETCALIFORNIA HOUSING MARKET
0
100
200
300
400
500
600
700
90:1 92:1 94:1 96:1 98:1 00:1 02:1 04:1 06:1 08:1Year: Quarter
0
40
80
120
160
200
240
280New Home Permits [--->]
Existing Home Resales [<---]
000s of Units, Annual Rate
Sources: U.S. Census Bureau, California Association of Realtors
000s of Units, Last 12 Mos

Source: California Association of REALTORS®
Median Home Price--CaliforniaMedian Home Price--California
$0
$100
$200
$300
$400
$500
$600
Jan-01 Jan-02 Jan-03 Jan-04 Jan-05 Jan-06 Jan-07 Jan-08 Jan-09
Thousands of $
$247,590
February ‘09
Down -58.2% from May ’07
(peak)

Risks for the California EconomyRisks for the California Economy
• Local government finance
• Water supply
• Unfriendly business environment
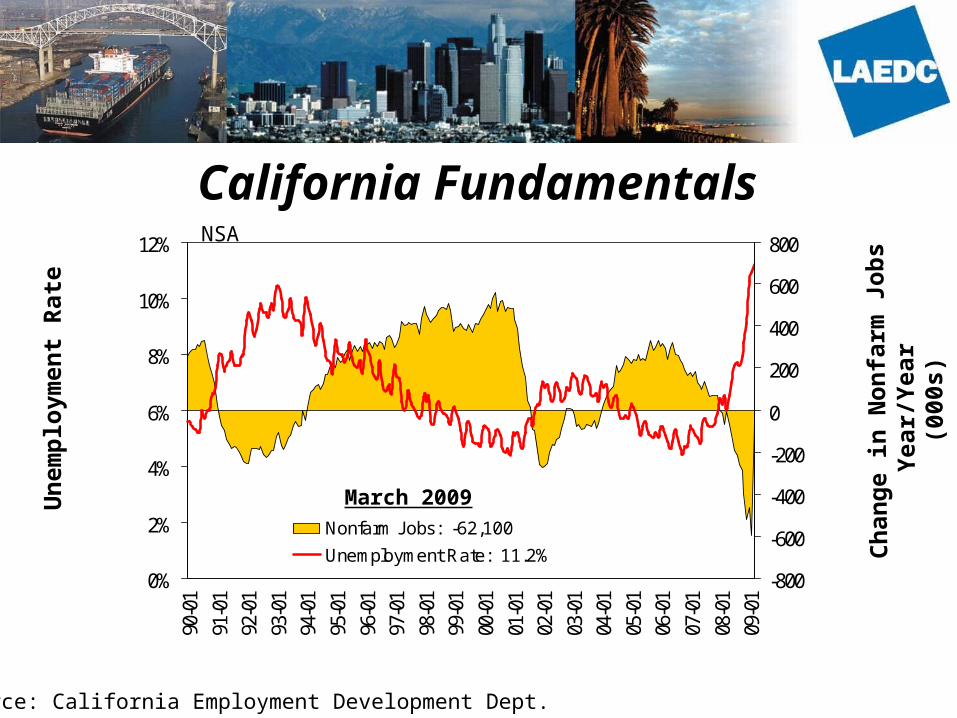
Los Angeles County Fundamentals
0%
3%
5%
8%
10%
13%
90-0
1
91-0
192
-01
93-0
1
94-0
195
-01
96-0
1
97-0
198
-01
99-0
1
00-0
101
-01
02-0
103
-01
04-0
1
05-0
106
-01
07-0
1
08-0
109
-01
-200
-100
0
100
200
Change in Nonfarm Jobs: -149,400
Unemployment Rate: 11.4%
Un
emp
loym
ent
Rat
e
Ch
ang
e in
No
nfa
rm J
ob
s Y
ear/
Yea
r (0
00s)
Source: California Employment Development Dept.
March 2009

2009 Industry Winners & Losers in2009 Industry Winners & Losers in Los Angeles County Los Angeles County
Sources: CA EDD, Labor Market Information Division; forecasts by LAEDC
-28.5-25.0
-19.5-15.0
-10.5-10.0
-9.5-7.0
-6.0-5.0
-2.53
6.5
-35 -30 -25 -20 -15 -10 -5 0 5 10
ManufacturingRetail
ConstructionAdminstrative
Finance & InsuranceTran/Ware/Util
Wholesale TradeLeisure & Hos Svcs
InformationProfessional Bus
Government(Private) Education
Health SvcsTotal Nonfarm: -100.5Total Nonfarm: -100.5
Jobs 1000’s

Some Industry TrendsSome Industry Trends
Los Angeles County

LA County Aerospace IndustryLA County Aerospace Industry
0
10
20
30
40
50
60
2000
2001
2002
2003
2004
2005
2006
2007
2008
2009
f
2010
f
• Changing Defense spending priorities
• More orders for the C-17?
• Aging workforce
No Change in
Employment in 2009
Employment in Thousands
Source: CA EDD, LMID

LA County Financial Services IndustryLA County Financial Services Industry
0
10
20
30
40
50
60
70
80
90
2000
2001
2002
2003
2004
2005
2006
2007
2008
2009
f
2010
f
• New regulations
• Changed players in retail banking
Letter Grade
C-
Employment in Thousands
Source: CA EDD, LMID

LA County International TradeLA County International Trade
0
2
4
6
8
10
12
14
16
18
2000
2001
2002
2003
2004
2005
2006
2007
2008
2009
f
2010
f
• Recovery in 2010?
• New Port Facilities
• Environmental challenges
• Hungry competitors
Letter Grade
C-
TEUs in Millions
Sources: Ports of Los Angeles & Long Beach, forecasts by LAEDC

LA County Motion Picture/ TV LA County Motion Picture/ TV ProductionProduction
100
115
130
145
160
Jan-
06
May
-
Sep
-
Jan-
07
May
-
Sep
-
Jan-
08
May
-
Sep
-
2009
f
• Labor problems
• Run-away production
• A changing business model in broadcast TV
Letter Grade
B-
Employment in Thousands
Source: CA EDD, LMID

LA County Tourism IndustryLA County Tourism Industry
50
51
52
53
54
55
56
57
58
20
00
20
01
20
02
20
03
20
04
20
05
20
06
20
07
20
08
20
09
f
20
10
f
• Business & international travel down
• New facilities in early 2010
• Too many CVBs
Letter Grade
C+
Employment in Thousands
Source: CA EDD, LMID

Housing Permits in Los Angeles County Housing Permits in Los Angeles County
0
5,000
10,000
15,000
20,000
25,000
30,000
1990
1991
1992
1993
1994
1995
1996
1997
1998
1999
2000
2001
2002
2003
2004
2005
2006
2007
2008
2009
F
Sources: Construction Industry Research Board; forecast by LAEDC

Los Angeles County Housing MarketLos Angeles County Housing Market
0
2,000
4,000
6,000
8,000
10,000
12,000
Jan-06 May-06 Sep-06 Jan-07 May-07 Sep-07 Jan-08 May-08 Sep-08 Jan-09
$200
$250
$300
$350
$400
$450
$500
$550
$600
Home Sales Median Home Price (000s)
Sources: RERC (DataQuick)

New Home InventoryNew Home Inventory — LA County —
0
1,200
2,400
3,600
4,800
1990
1991
1992
1993
1994
1995
1996
1997
1998
1999
2000
2001
2002
2003
2004
2005
2006
2007
2008
2008
Attached
Detached
Number of Unsold New Homes
Source: RERC

Los Angeles County Apartment Vacancy Los Angeles County Apartment Vacancy Rates & Average Rental RatesRates & Average Rental Rates
0.0
2.0
4.0
6.0
8.0
Q2:
05
Q3:
05
Q4:
05
Q1:
06
Q2:
06
Q3:
06
Q4:
06
Q1:
07
Q2:
07
Q3:
07
Q4:
07
Q1:
08
Q2:
08
Q3:
08
1,400
1,500
1,600
1,700
1,800<-- Vacancy Rate Avg. Rental Rate-->
Source: RERC
% $

Office Vacancy RatesOffice Vacancy RatesLos Angeles County By AreaLos Angeles County By Area
5
7
9
11
13
15
17
19
21
23
25
99:1 00:1 01:1 02:1 03:1 04:1 05:1 06:1 07:1 08:1 09:1Year: Quarter
Central L.A. 12.8%
West L.A. 12.5%
San Fernando Valley 16.7%
South Bay 15.1%
San Gabriel Valley 11.5%
Percent vacant, quarterly averages
Source: Grubb & Ellis Research Services
2009: Q1

Industrial Vacancy RatesIndustrial Vacancy RatesLos Angeles County By AreaLos Angeles County By Area
0
2
4
6
8
10
99:1 00:1 01:1 02:1 03:1 04:1 05:1 06:1 07:1 08:1 09:1
Central/ Dntwn L.A. 2.3%
Mid Cities 1.8%
San Fernando Valley 3.1%
South Bay 2.4%
San Gabriel Valley 3.8%
Percent vacant, quarterly averages
Year: QuarterSource: Grubb & Ellis Research Services
2009: Q1

Taxable Retail Sales in Los Angeles County Taxable Retail Sales in Los Angeles County
-5.0
-3.0
-1.0
1.0
3.0
5.0
7.0
9.0
11.0
13.0
15.0
Q1
:00
Q1
:01
Q1
:02
Q1
:03
Q1
:04
Q1
:05
Q1
:06
Q1
:07
Q1
:08
<-- % Change, Year to Year
Source: State Board of Equalization (BOE)
%

Los Angeles County Employment ForecastLos Angeles County Employment Forecast
-150,000
-100,000
-50,000
0
50,000
100,000
2000 2001 2002 2003 2004 2005 2006 2007 2008 2009 F
0
2
4
6
8
10
12
14
Chg. In Nonfarm Employment
Unemployment Rate
Source: California EDD; forecast by LAEDC
%

Risks for the LA County EconomyRisks for the LA County Economy
• No economic development strategy
• Government agencies frequently unfriendly to business
• A target for business raiders from other states
• Which industries changed due to the great recession?

Employment Trends in North Gateway Employment Trends in North Gateway
400
425
450
475
500
Q1
:01
Q3
:01
Q1
:02
Q3
:02
Q1
:03
Q3
:03
Q1
:04
Q3
:04
Q1
:05
Q3
:05
Q1
:06
Q3
:06
Q1
:07
Q3
:07
Q1
:08
Source: California Employment Development Dept (EDD)
Total Employment in Thousands

-4,236
-1,976
-1,451
-775
1
20
334
352
451
1,519
10,557
-9,737
335
-15,000 -10,000 -5,000 0 5,000 10,000 15,000
Professional & Business SvcsManufacturing
ConstructionFinancial Activities
WholesaleNatural Resources
InformationGovernment
Transportation & UtilitiesLeisure & Hospitality
Retail TradeEducation & Health Svcs
Other Svcs
Source: California Employment Development Dept (EDD)
Industry Performance for the North Gateway RegionIndustry Performance for the North Gateway Region
Change in Employment by Industry from Q2 2007 to Q2 2008

Changed Industries: A Short ListChanged Industries: A Short List
• Autos: DealersLocal aftermarket industry
• Business Services:Advertising – shift in reaching
consumers
• Entertainment:Change in broadcast TV
• International Trade/Logistics:“Near-shoring” – how real
• Retail: Squeezing out excess capacityFuture of luxury/near-luxury
segments

THANK YOU and STAY INFORMED
Keep up with economic news and major developments by subscribing to e-EDGE, our
free weekly economic newsletter. Check out the
current issue at www.LAEDC.org