Embed Size (px)
Citation preview

Gazprom in the European Gas Market
by Valery Nemov
OOO Gazprom Export
Deputy Head Contract Structuring and Pricing Directorate
Novy Urengoy, June 19, 2017
1 Gazprom in the European Gas Market
Poland, 11.1
France, 11.5
United Kingdom
17.9
Italy, 24.7
Turkey, 24.8
Germany, 49.8
Deliveries by Gazprom Group
to Far Abroad in 2016 (under OOO Gazprom export and GAZPROM Schweiz AG contracts)
• In 2016, total gas
deliveries reached
unprecedented
179.3 bcm
• Annual growth totaled
in 19.9 bcm
(+12.5%)
• In 2016, the biggest
customers were
Germany, Turkey and
Italy with the former
having received
record-breaking 49.8
bcm
2
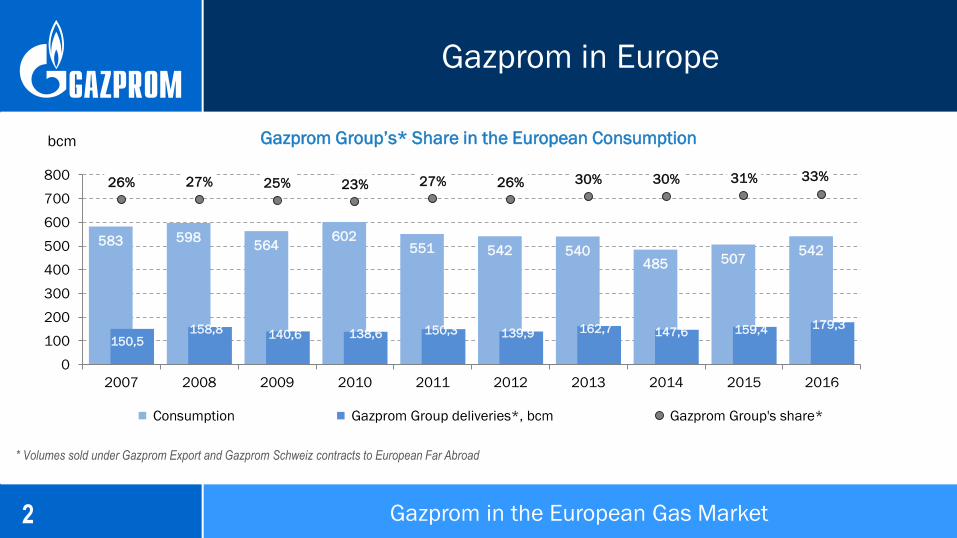
583 598 564
602 551 542 540
485 507 542
26% 27% 25% 23% 27% 26% 30% 30% 31% 33%
0
100
200
300
400
500
600
700
800
2007 2008 2009 2010 2011 2012 2013 2014 2015 2016
Consumption Gazprom Group deliveries*, bcm Gazprom Group's share*
150,5
Gazprom in Europe
bcm
* Volumes sold under Gazprom Export and Gazprom Schweiz contracts to European Far Abroad
Gazprom Group’s* Share in the European Consumption
158,8 140,6 138,6 150,3 139,9 162,7 147,6 159,4 179,3
158,8 140,6 138,6 150,3 139,9 162,7 147,6 159,4 179,3 150,5
Gazprom in the European Gas Market

3
Gazprom Group’s* Share in the European Imports**
271 273 257
280 274 248 255
225 240 273
56% 58% 55% 50% 55% 56% 64% 66% 66% 66%
0
100
200
300
400
2007 2008 2009 2010 2011 2012 2013 2014 2015 2016
Consumption, bcm Gazprom Group deliveries*, bcm Gazprom Group's share*
139,9 162,7 147,6 159,4
179,3
bcm
* Volumes sold under Gazprom Export and Gazprom Schweiz contracts to European Far Abroad
** Difference between consumption and domestic production
158,8 150,5 140,6 138,6 150,3
Gazprom in Europe
Gazprom in the European Gas Market

4
Gas Consumption in Europe, 2011-2015
European Gas Consumption in 2013 – 2017
In Q1 2017 natural gas
consumption in Europe
exceeded the volumes
of Q1 2016 by 4 bcm or
2.2%, amounting to
183.3 bcm. It is
remarkable that
consumption volumes
were higher in January
(+11.0 bcm or +16.0%)
but lower in February
and especially in March
(-0.4 bcm or -0.7% and -
6.6 bcm or -12.0%
respectively), reflecting
the impact of the
weather factor.
Monthly Gas Consumption (Accumulated Values)
Gazprom in the European Gas Market
5
Medium-Term Gas Consumption Forecast
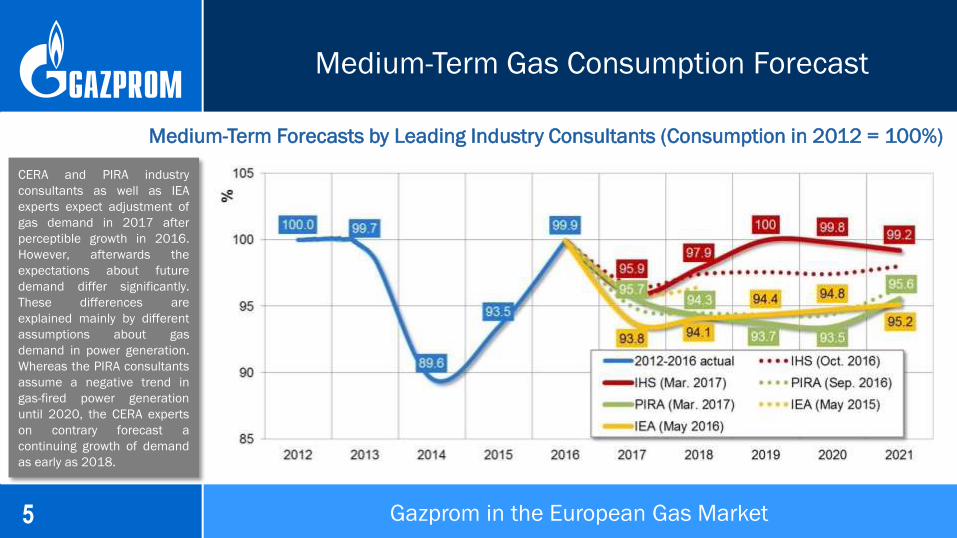
Medium-Term Forecasts by Leading Industry Consultants (Consumption in 2012 = 100%)
CERA and PIRA industry
consultants as well as IEA
experts expect adjustment of
gas demand in 2017 after
perceptible growth in 2016.
However, afterwards the
expectations about future
demand differ significantly.
These differences are
explained mainly by different
assumptions about gas
demand in power generation.
Whereas the PIRA consultants
assume a negative trend in
gas-fired power generation
until 2020, the CERA experts
on contrary forecast a
continuing growth of demand
as early as 2018.
Gazprom in the European Gas Market

6
Major Factors Affecting Gas Consumption in
Europe in Q1 2016 and Q1 2017*
Q1 2016 Q1 2017
1.Favorable weather conditions
(cold and long winter, hot summer)
2. Economic recovery
3. Use of gas in power generation
4. Base period effect
Total consumption dynamics, YoY: +2.7% +2.2%
* Factors are defined in comparison with long-term averages. Factors could affect consumption in a bidirectional way. Changes in volumes
made on year-on-year and quarter-on-quarter basis.
Gazprom in the European Gas Market

7
Gas-fired Power Generation Projected Growth
Power generation is
the key area for gas
consumption growth in
Europe.
Even the ‘greenest’,
heavily subsidisied
scenario envisages
more electricity to be
produced from gas.
By 2025 ‘basic’
scenario foresees
30%+ growth in the EU
gas generation against
2015 figures.
‘Basic’ scenario* ‘Strategy 2030’**
* 21% energy efficiency rise by 2030, 33% CO2 emissions cut by 2030 against the 1990 level, renewables reaching 24.4% in primary energy consumption by 2030
** 27% energy efficiency rise by 2030, 40% CO2 emissions cut by 2030 against the 1990 level, renewables reaching 27% in primary energy consumption by 2030
Source: European Commission, ENTSO-E
438
473
489
505
521
537
554
570
586
602
618
634
650
666
682
698
714
0
500
1000
1500
2000
2500
3000
3500
4000
2014
2016
2018
2020
2022
2024
2026
2028
2030
ТWh
33.3
%
33.6
%
Gazprom in the European Gas Market
438
473
476
478
481
484
487
489
492
495
497
500
503
505
508
511
513
0
500
1000
1500
2000
2500
3000
3500
4000
2014
2016
2018
2020
2022
2024
2026
2028
2030
Oil
Natural Gas
Coal
Wind
Solar, tidal etc.
Biomass
Hydro
Nuclear
ТWh
26.4
%
40.1
%
8
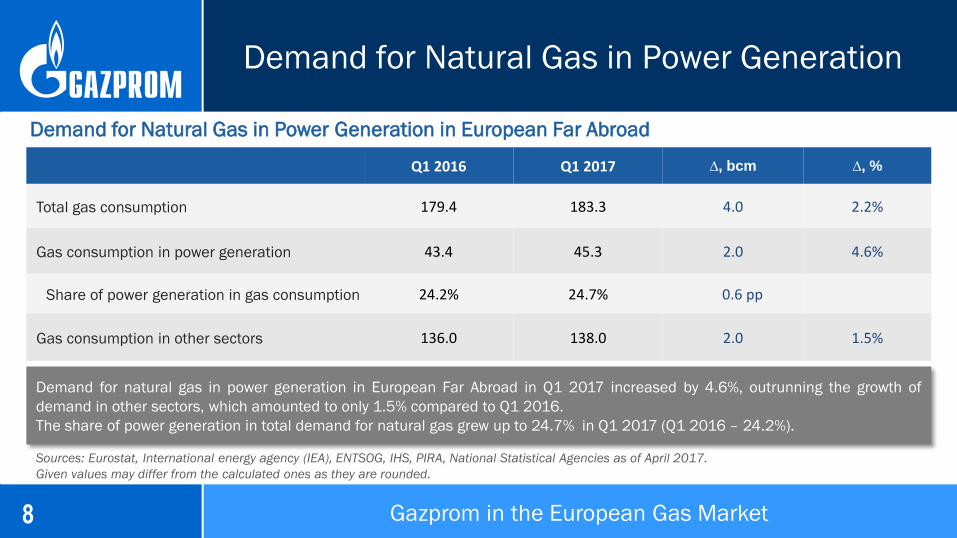
Demand for Natural Gas in Power Generation
Q1 2016 Q1 2017 ∆, bcm ∆, %
Total gas consumption 179.4 183.3 4.0 2.2%
Gas consumption in power generation 43.4 45.3 2.0 4.6%
Share of power generation in gas consumption 24.2% 24.7% 0.6 pp
Gas consumption in other sectors 136.0 138.0 2.0 1.5%
Demand for Natural Gas in Power Generation in European Far Abroad
Demand for natural gas in power generation in European Far Abroad in Q1 2017 increased by 4.6%, outrunning the growth of
demand in other sectors, which amounted to only 1.5% compared to Q1 2016.
The share of power generation in total demand for natural gas grew up to 24.7% in Q1 2017 (Q1 2016 – 24.2%).
Sources: Eurostat, International energy agency (IEA), ENTSOG, IHS, PIRA, National Statistical Agencies as of April 2017.
Given values may differ from the calculated ones as they are rounded.
Gazprom in the European Gas Market
9
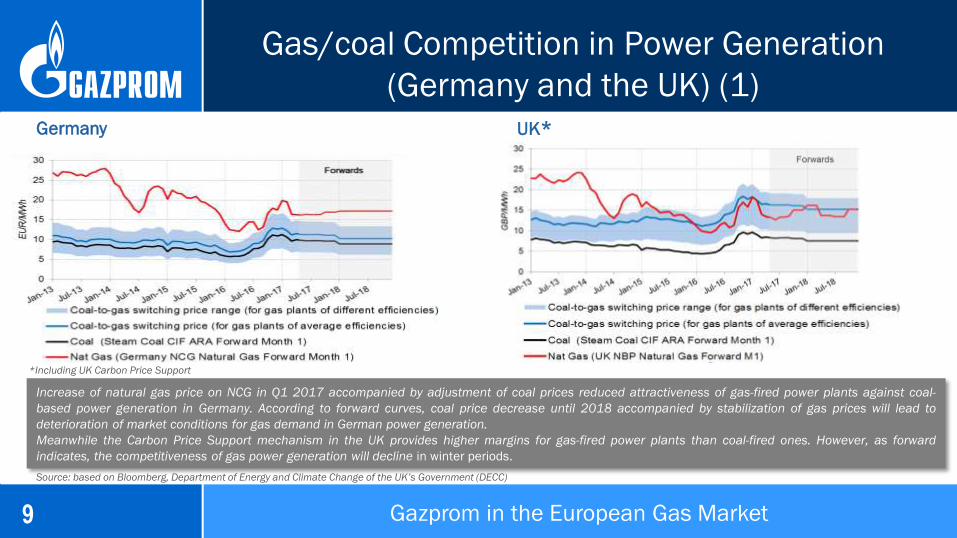
Gas/coal Competition in Power Generation
(Germany and the UK) (1)
Source: based on Bloomberg, Department of Energy and Climate Change of the UK’s Government (DECC)
Germany UK*
Increase of natural gas price on NCG in Q1 2017 accompanied by adjustment of coal prices reduced attractiveness of gas-fired power plants against coal-
based power generation in Germany. According to forward curves, coal price decrease until 2018 accompanied by stabilization of gas prices will lead to
deterioration of market conditions for gas demand in German power generation.
Meanwhile the Carbon Price Support mechanism in the UK provides higher margins for gas-fired power plants than coal-fired ones. However, as forward
indicates, the competitiveness of gas power generation will decline in winter periods.
*Including UK Carbon Price Support
Gazprom in the European Gas Market
10
Gas/coal Competition in Power Generation
(Germany and the UK) (2)
Source: based on Bloomberg, Department of Energy and Climate Change of the UK’s Government (DECC)
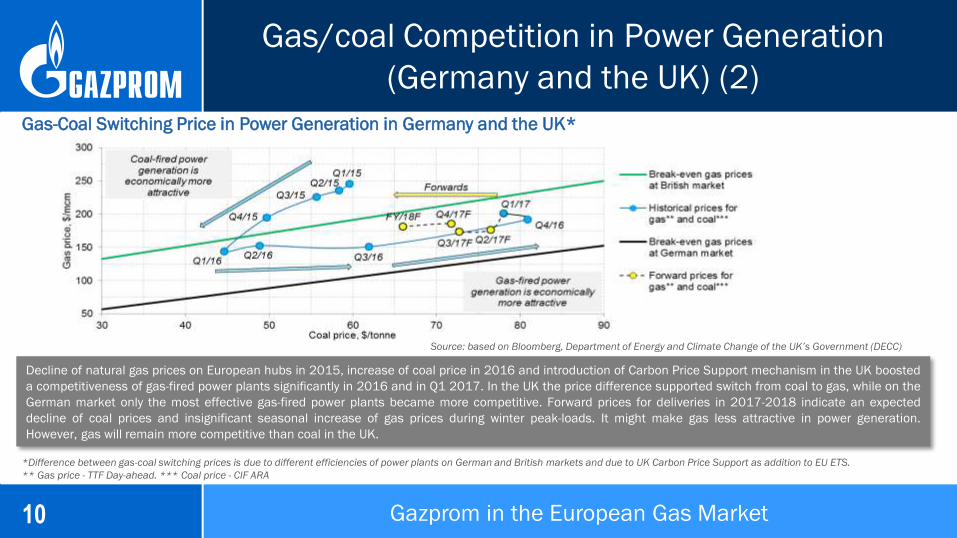
Gas-Coal Switching Price in Power Generation in Germany and the UK*
*Difference between gas-coal switching prices is due to different efficiencies of power plants on German and British markets and due to UK Carbon Price Support as addition to EU ETS.
** Gas price - TTF Day-ahead. *** Coal price - CIF ARA
Decline of natural gas prices on European hubs in 2015, increase of coal price in 2016 and introduction of Carbon Price Support mechanism in the UK boosted
a competitiveness of gas-fired power plants significantly in 2016 and in Q1 2017. In the UK the price difference supported switch from coal to gas, while on the
German market only the most effective gas-fired power plants became more competitive. Forward prices for deliveries in 2017-2018 indicate an expected
decline of coal prices and insignificant seasonal increase of gas prices during winter peak-loads. It might make gas less attractive in power generation.
However, gas will remain more competitive than coal in the UK.
Gazprom in the European Gas Market
11 11
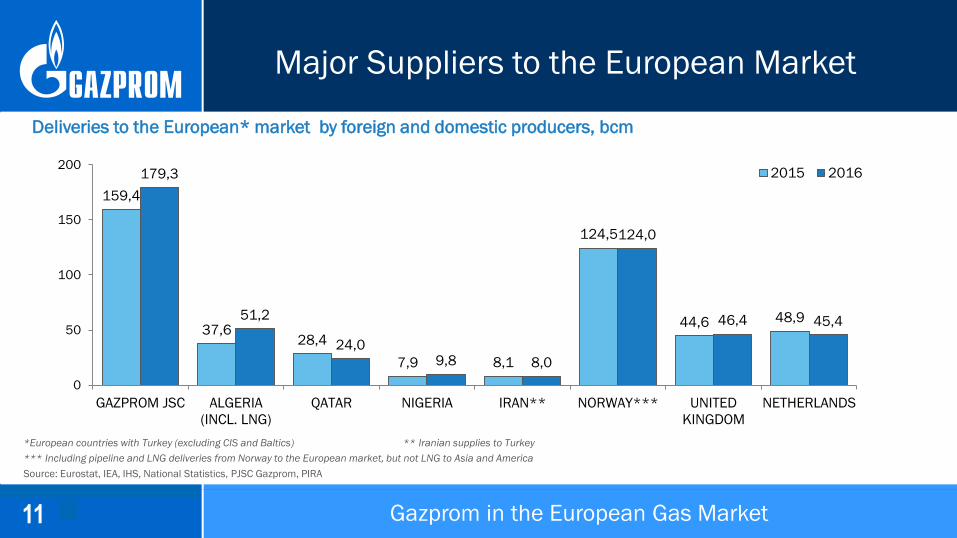
Deliveries to the European* market by foreign and domestic producers, bcm
*European countries with Turkey (excluding CIS and Baltics) ** Iranian supplies to Turkey
*** Including pipeline and LNG deliveries from Norway to the European market, but not LNG to Asia and America
Source: Eurostat, IEA, IHS, National Statistics, PJSC Gazprom, PIRA
Major Suppliers to the European Market
159,4
37,6 28,4
7,9 8,1
124,5
44,6 48,9
179,3
51,2
24,0 9,8 8,0
124,0
46,4 45,4
0
50
100
150
200
GAZPROM JSC ALGERIA
(INCL. LNG)
QATAR NIGERIA IRAN** NORWAY*** UNITED
KINGDOM
NETHERLANDS
2015 2016
Gazprom in the European Gas Market

12
Supply Dynamics to Europe
by Major Foreign Producers (Q1’2017)
Sources: Eurostat, IEA, ENTSOG, Bloomberg, National Statistical Agencies as of April 2017.
Given values may differ from the calculated ones as they are rounded.
Comparison of supply dynamics in Q1 2017 with range of deliveries in 2010–
2016 demonstrates a record level of supplies by PJSC Gazprom, as well as
close to the average level of supplies from Algeria and a low level of LNG
supplies from Qatar.
Gazprom in the European Gas Market

13
Supply Dynamics to Europe
by Major Domestic Producers (Q1’2017)
Sources: Eurostat, IEA, ENTSOG, Bloomberg, National Statistical Agencies as of April 2017.
Given values may differ from the calculated ones as they are rounded.
Comparison of supply dynamics in Q1 2017 with range of deliveries in 2010 –
2016 demonstrates a high level of supplies from Norway, which in January
and March were higher than those of previous years, as well as a low level of
supplies from the Netherlands and the UK.
Gazprom in the European Gas Market
14
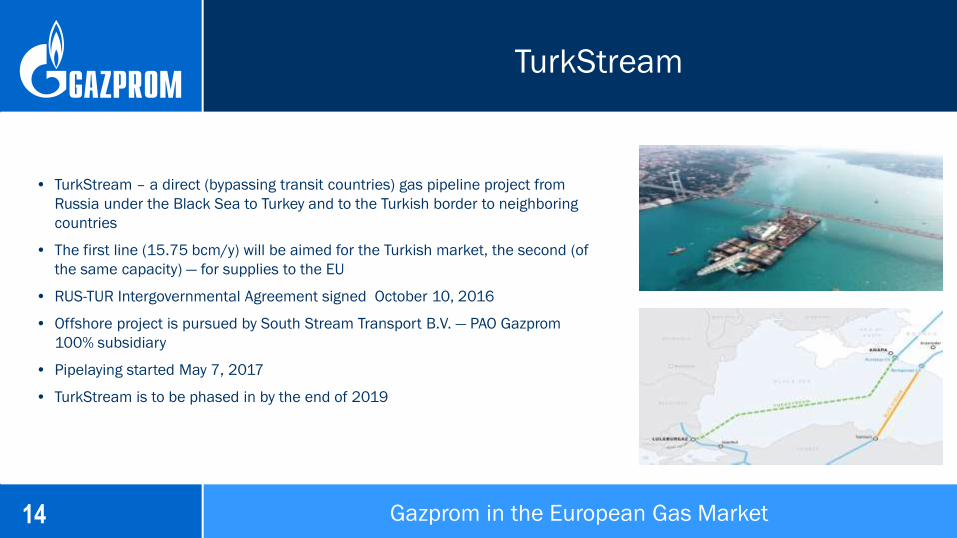
TurkStream
• TurkStream – a direct (bypassing transit countries) gas pipeline project from
Russia under the Black Sea to Turkey and to the Turkish border to neighboring
countries
• The first line (15.75 bcm/y) will be aimed for the Turkish market, the second (of
the same capacity) — for supplies to the EU
• RUS-TUR Intergovernmental Agreement signed October 10, 2016
• Offshore project is pursued by South Stream Transport B.V. — PAO Gazprom
100% subsidiary
• Pipelaying started May 7, 2017
• TurkStream is to be phased in by the end of 2019
Gazprom in the European Gas Market

15
Nord Stream 2
• Following the success of the first Nord Stream,
the Nord Stream 2 project provides for a twin
pipeline to go from Russia under the Baltic Sea
to Germany carrying additional 55 bcm/y
• Along with higher security of supplies Nord
Stream 2 supports European drive for energy
security and emissions cut
• Project is handled by Nord Stream 2 AG
• Agreements to finance the project have been
signed by Nord Stream 2 AG with energy
majors ENGIE, OMV, Shell, Uniper и Wintershall
Gazprom in the European Gas Market
16
Underground Storages: Getting Supplies More
Reliable and Flexible
Rehden
Banatski Dvor
Katharina
Bergermeer
Haidach
Dambořice
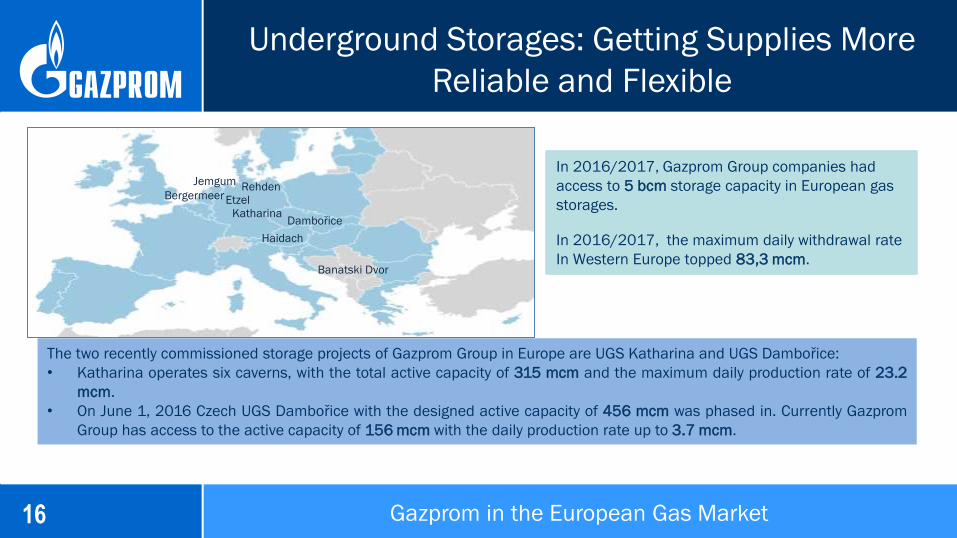
In 2016/2017, Gazprom Group companies had
access to 5 bcm storage capacity in European gas
storages.
In 2016/2017, the maximum daily withdrawal rate
In Western Europe topped 83,3 mcm.
The two recently commissioned storage projects of Gazprom Group in Europe are UGS Katharina and UGS Dambořice:
• Katharina operates six caverns, with the total active capacity of 315 mcm and the maximum daily production rate of 23.2
mcm.
• On June 1, 2016 Czech UGS Dambořice with the designed active capacity of 456 mcm was phased in. Currently Gazprom
Group has access to the active capacity of 156 mcm with the daily production rate up to 3.7 mcm.
Gazprom in the European Gas Market
Etzel
Jemgum

17
• In 2013-2016, the number of Gazprom Group natural gas filling stations in Europe went from 23 to 69
• In 2016 Gazprom Group entered the Serbian gas motor fuel market
• The volume of CNG/LNG supplied to own and third party NGV filling stations rose from 4.8 mcm to 14.6 mcm
• The Gazprom NGV Europe company together with local partners implements first European projects on municipal LNG-powered
buses introduction in Poland
• By 2025 the capacity of the European gas motor fuel market might amount to as much as 27 bcm in additional demand*
Natural Gas as Motor Fuel
* ACER (Agency for the Cooperation of Energy Regulators) forecast.
0
5
10
15
20
2013 2014 2015 2016
Serbia
Czech Rep.
Poland
Germany
Sales of gas for NGV through own and third party stations , mcm/y
Gazprom in the European Gas Market
18
Source: adapted Timera
Energy periodization given
in article “The next phase
of global gas pricing”
See: http://www.timera-
energy.com/the-next-
phase-of-global-gas-
pricing/
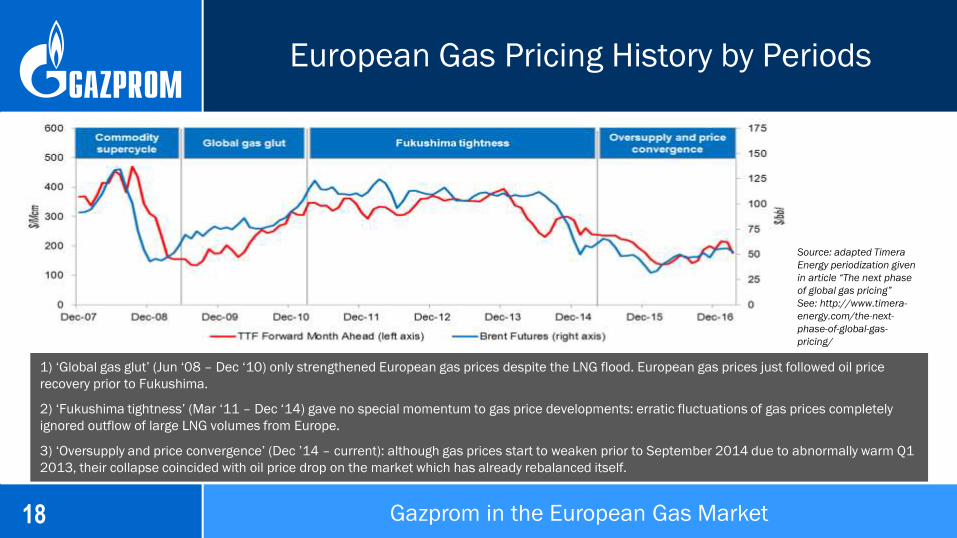
European Gas Pricing History by Periods
1) ‘Global gas glut’ (Jun ‘08 – Dec ‘10) only strengthened European gas prices despite the LNG flood. European gas prices just followed oil price
recovery prior to Fukushima.
2) ‘Fukushima tightness’ (Mar ‘11 – Dec ‘14) gave no special momentum to gas price developments: erratic fluctuations of gas prices completely
ignored outflow of large LNG volumes from Europe.
3) ‘Oversupply and price convergence’ (Dec ’14 – current): although gas prices start to weaken prior to September 2014 due to abnormally warm Q1
2013, their collapse coincided with oil price drop on the market which has already rebalanced itself.
Gazprom in the European Gas Market
19
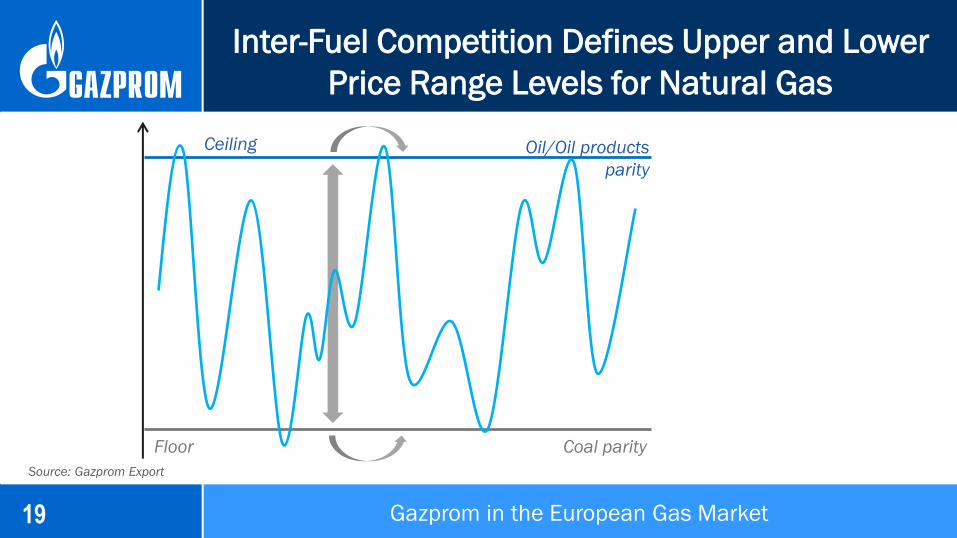
Ceiling
Floor
Oil/Oil products
parity
Coal parity
Source: Gazprom Export
Inter-Fuel Competition Defines Upper and Lower
Price Range Levels for Natural Gas
Gazprom in the European Gas Market
20
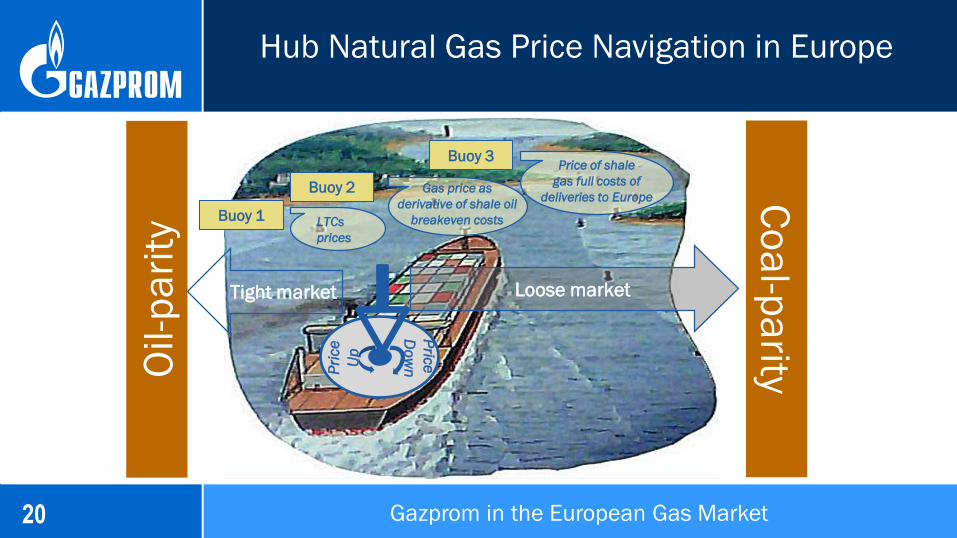
Oil-p
ari
ty C
oa
l-pa
rity
Loose market Tight market
Buoy 1
Buoy 2
Buoy 3
LTCs
prices
Gas price as
derivative of shale oil
breakeven costs
Price of shale
gas full costs of
deliveries to Europe
Pri
ce
Up
Pric
e
Do
wn
Hub Natural Gas Price Navigation in Europe
Gazprom in the European Gas Market

21
Bouy #1. Extreme Weather Conditioned Pushed
TTF Prices above BAFA for Nearly Two Months
Sources: BAFA, Bloomberg
In January – February 2017 natural gas on the most liquid European hub TTF was traded with a premium to average import price in Germany (BAFA), reflecting the higher demand for natural gas as a consequence of weather impact. However, in March prices declined due to a lower gas demand at the end of the winter season. Gas futures with delivery in Summer 2017 are traded at a level of $175/Mcm, whereas the winter futures – at a level of $190/Mcm. Thus, the seasonal spread is about $15/Mcm.
Gazprom in the European Gas Market

22
Bouy #2. Correlation and Regression Analysis
Indicates
that TTF Price Dependence on Oil Prices is
Increasing Correlation
(TTF MA, USD/mcm)
Time period Brent,
USD/barrel
Oil Price:
Six month moving
average
Oil Price:
Nine month moving
average
2008-2016 76.6% 85.5% 83.3%
2008-2013 69.9% 84.7% 81.9%
2014-2016 79.5% 87.3% 88.7%
R Squared
(TTF MA, USD/mcm)
2008-2016 58.6% 73.1% 69.4%
2008-2013 48.9% 71.8% 67.1%
2014-2016 63.2% 76.3% 78.6%
This effectively means that NA shale breakeven costs which emerged as the major determinant for
global oil prices are setting price rage for European hub prices
Gazprom in the European Gas Market
23
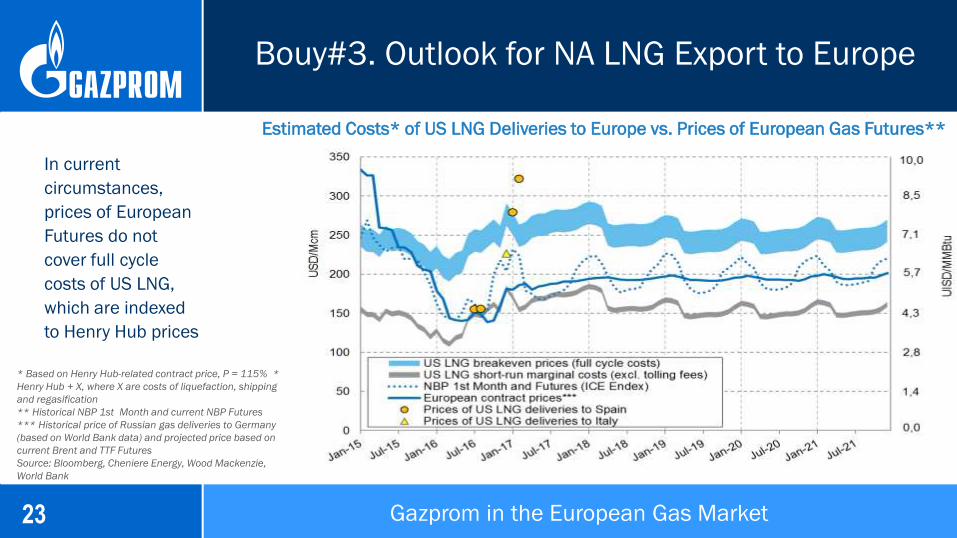
Bouy#3. Outlook for NA LNG Export to Europe
In current
circumstances,
prices of European
Futures do not
cover full cycle
costs of US LNG,
which are indexed
to Henry Hub prices
Estimated Costs* of US LNG Deliveries to Europe vs. Prices of European Gas Futures**
* Based on Henry Hub-related contract price, P = 115% *
Henry Hub + X, where X are costs of liquefaction, shipping
and regasification
** Historical NBP 1st Month and current NBP Futures
*** Historical price of Russian gas deliveries to Germany
(based on World Bank data) and projected price based on
current Brent and TTF Futures
Source: Bloomberg, Cheniere Energy, Wood Mackenzie,
World Bank
Gazprom in the European Gas Market
24
Thank you!
Gazprom in the European Gas Market