Embed Size (px)
Citation preview

International Journal of Shape Modeling, Vol. 0, No. 0 (1994) 000{000fc World Scienti�c Publishing Company
OBJECT SHAPE MORPHING WITH
INTERMEDIATE REFLECTANCE PROPERTIES
YOICHI SATO�
Department of Electrical Engineering and Electronics
Institute of Industrial Science, The University of Tokyo
7-22-1 Roppongi, Minato-ku, Tokyo 106, Japan
IMARI SATO
Department of Electrical Engineering and Electronics
Institute of Industrial Science, The University of Tokyo
7-22-1 Roppongi, Minato-ku, Tokyo 106, Japan
and
KATSUSHI IKEUCHI
Department of Electrical Engineering and Electronics
Institute of Industrial Science, The University of Tokyo
7-22-1 Roppongi, Minato-ku, Tokyo 106, Japan
Received (received date)Revised (revised date)
Communicated by (Name of Editor)
Image morphing techniques can create a smooth transition between two images. How-ever, one of the main weakness of the image morphing technique is that intermediateimages in the transition often have physically incorrect shading such as highlights andshadows. Moreover, we cannot alter viewing and lighting conditions when creating theintermediate images. That is because those images are obtained by simply interpolat-ing pixel intensities of the two 2D images without knowledge of 3D object shape andre ectance properties. In this context, 3D shape morphing techniques have a de�niteadvantage in that arbitrary viewing and illumination conditions can be used for creatingnew images. Unfortunately, previous 3D morphing techniques do not account for objectsurface re ectance properties or re ection models when generating intermediate images.This often results in undesired shading artifacts. In this paper, we consider a new ap-proach for 3D shape and re ectance morphing of two real 3D objects. Our morphingmethod consists of two components: shape and re ectance property measurement, andsmooth interpolation of those measured properties. The measured shape and re ectanceparameters are used to compute intermediate shape and re ectance parameters. Finally,the computed shape and re ectance parameters are used to render intermediate imageswhich represent a smooth transition between the two objects.
Keywords: Computer Vision, Color Image Analysis, Re ectance Measurement, ShapeMorphing
1. Introduction
Recently, image morphing techniques for creating a smooth transition between two
1
�Contact the author at [email protected].
2 International Journal of Shape Modeling
images have been extensively studied. These techniques are based on interpolation
of coordinates (and colors) of image pixels in two images. Surprisingly convincing
image transitions can be created when the interpolation is designed carefully [1] and
[11].
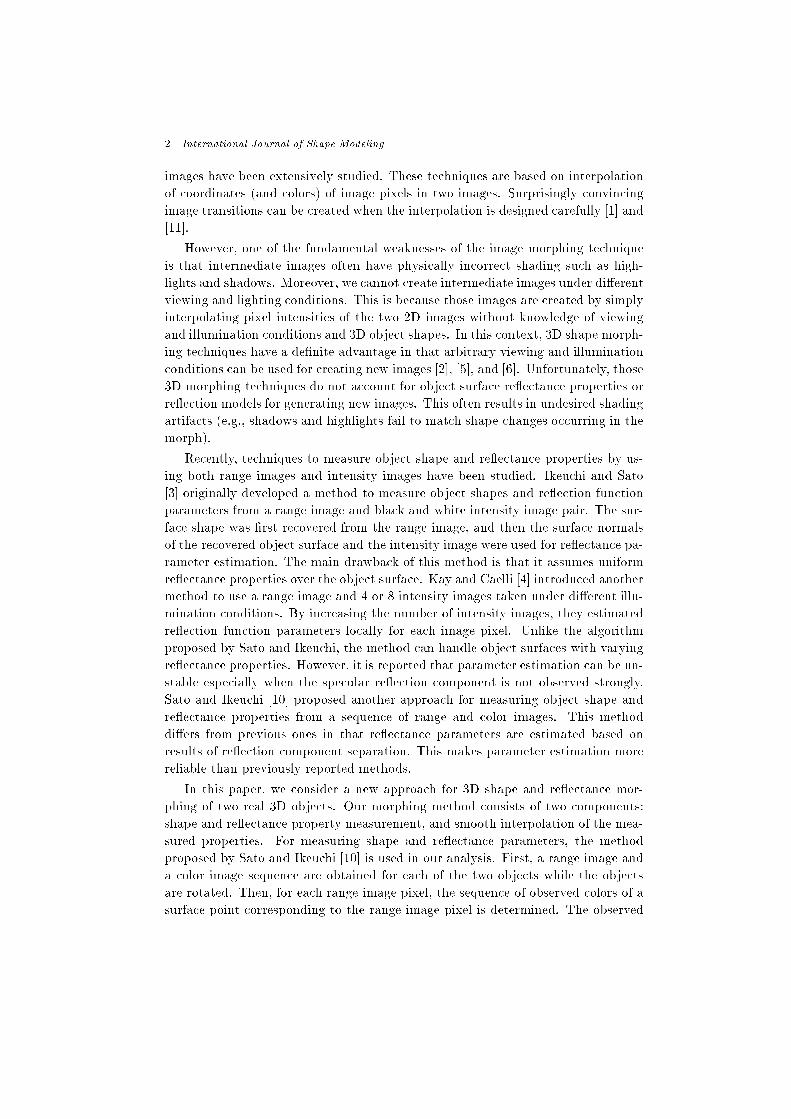
However, one of the fundamental weaknesses of the image morphing technique
is that intermediate images often have physically incorrect shading such as high-
lights and shadows. Moreover, we cannot create intermediate images under di�erent
viewing and lighting conditions. This is because those images are created by simply
interpolating pixel intensities of the two 2D images without knowledge of viewing
and illumination conditions and 3D object shapes. In this context, 3D shape morph-
ing techniques have a de�nite advantage in that arbitrary viewing and illumination
conditions can be used for creating new images [2], [5], and [6]. Unfortunately, those
3D morphing techniques do not account for object surface re ectance properties or
re ection models for generating new images. This often results in undesired shading
artifacts (e.g., shadows and highlights fail to match shape changes occurring in the
morph).
Recently, techniques to measure object shape and re ectance properties by us-
ing both range images and intensity images have been studied. Ikeuchi and Sato
[3] originally developed a method to measure object shapes and re ection function
parameters from a range image and black and white intensity image pair. The sur-
face shape was �rst recovered from the range image, and then the surface normals
of the recovered object surface and the intensity image were used for re ectance pa-
rameter estimation. The main drawback of this method is that it assumes uniform
re ectance properties over the object surface. Kay and Caelli [4] introduced anothermethod to use a range image and 4 or 8 intensity images taken under di�erent illu-
mination conditions. By increasing the number of intensity images, they estimated
re ection function parameters locally for each image pixel. Unlike the algorithm
proposed by Sato and Ikeuchi, the method can handle object surfaces with varying
re ectance properties. However, it is reported that parameter estimation can be un-
stable especially when the specular re ection component is not observed strongly.
Sato and Ikeuchi [10] proposed another approach for measuring object shape and
re ectance properties from a sequence of range and color images. This method
di�ers from previous ones in that re ectance parameters are estimated based on
results of re ection component separation. This makes parameter estimation more
reliable than previously reported methods.
In this paper, we consider a new approach for 3D shape and re ectance mor-
phing of two real 3D objects. Our morphing method consists of two components:
shape and re ectance property measurement, and smooth interpolation of the mea-
sured properties. For measuring shape and re ectance parameters, the method
proposed by Sato and Ikeuchi [10] is used in our analysis. First, a range image and
a color image sequence are obtained for each of the two objects while the objects
are rotated. Then, for each range image pixel, the sequence of observed colors of a
surface point corresponding to the range image pixel is determined. The observed

Instructions for Typesetting Camera-Ready Manuscripts 3
color sequence is separated into the di�use and specular re ection components by
the algorithm used originally by Sato and Ikeuchi [9]. Subsequently, parameters of
a re ection function used in our analysis are estimated reliably for the separated
re ection components. The re ection model used here is a linear combination of the
Lambertian model and a simpli�ed Torrance-Sparrow model [13]. The estimated re-
ectance parameters of each surface point are combined with its measured (X; Y;Z)
location, and then stored in a new 2D image. Therefore, each pixel of the 2D image
has re ectance parameters as well as a (X; Y;Z) location. The 2D image containing
the (X;Y; Z) location and re ectance parameters is referred to as an object image
in this paper. After object images are created for the two objects, the two object
images are used to create a new intermediate object image by interpolating the
shape and re ectance properties of the two object images. Pixelwise correspon-
dences between the two object images used for the interpolation is established from
correspondence of manually drawn line pairs in the two object images [1]. Finally,
the newly created intermediate object image is used to render new images of theobject under arbitrary viewing and illumination conditions.
The paper is organized as follows. Section 2.1 and Section 2.2 describe our image
acquisition system and determination of observed color sequences for each range-
image pixel. Section 2.3 introduces the re ection model used in our experiment. The
algorithm for separating the di�use and specular re ection components is explained
in Section 2.4, and re ectance parameter estimation is discussed in Section 2.5.
Section 3 explains how to establish pixelwise correspondences between two object
images based on manually drawn line pairs. Our approach is applied to two real
objects, and experimental results are shown in Section 4. Concluding remarks are
presented in Section 5.
2. Measuring Shape and Re ectance Properties
This section describes a method to recover object surface re ectance properties from
a range image and a color image sequence. First, we describe the image acquisition
system in our analysis followed by a description of the algorithm used for re ectance
parameter estimation.
2.1. Image Acquisition System
A range image is obtained using a light-stripe range �nder with a liquid crystal
shutter and a color CCD video camera [8]. It can compute 3D point locations
corresponding to image pixels based on optical triangulation. For each range image,
a set of three images is obtained containing X;Y and Z locations of all pixels. Each
of the range-image pixels represents an (X;Y;Z) location of a corresponding point
on an object surface. The same color camera is used for digitizing color images.
Therefore, pixels of the range images and the color images directly correspond.
The color video camera is calibrated to ensure linear response from all three color
bands. The experimental setup used in our experiments is illustrated in Fig. 1. A

4 International Journal of Shape Modeling
color camera
light stripe range finder
object
PUMA arm
light source
Figure 1: Image acquisition system
single incandescent lamp is used as a point light source. In our experiments, the
light source color is assumed to be given by calibration. The light source is located
nearby the camera lens so that both the viewing direction and the illumination
direction are approximately the same. This light source location is chosen to avoid
the problem of self-shadowing.
First, the range �nder is calibrated using a calibration box of known size and
shape. The calibration produces a 3 � 4 matrix � which represents the projec-
tion transformation between the world coordinate system and the image coordinate
system. The object whose shape and re ectance information are to be recovered
is mounted to the end of a PUMA 560 manipulator whose location with respect
to the world coordinate system is given by calibration. The object orientation is
controlled using the PUMA manipulator, and the object location is given as a 4�4
transformation matrix T for each digitized image. First, one range image is cap-
tured to determining the shape of the object surface facing to the camera. Then,
a sequence of color images is captured at a �xed angle step of object orientation.The projection transformation matrix � and the transformation matrix T will be
used for determining an observed color sequence for each of the range image pixels.
The observed color sequence represents how a surface point corresponding to the
range image pixel appears as the object rotates, and it will be used for analyzing
re ectance properties of the object.
2.2. Observed Color Sequence for Each Point on Object Surface
For measuring re ectance properties of the object surface, a sequence of observed
colors has to be determined for each point on the object surface. In this section, we
describe how to determine the observed color sequence.
We represent world coordinates and image coordinates using homogeneous co-
ordinates. A point on the object surface with Euclidean coordinates (X;Y; Z) is
expressed by a column vector P = [X; Y;Z; 1]T . An image pixel location (x; y) is
represented by p = [x; y; 1]T . As described in the previous section, the camera pro-
jection transformation is represented by a 3 � 4 matrix �, and the object location
and orientation are given by a 4� 4 object transformation matrix T . We represent

Instructions for Typesetting Camera-Ready Manuscripts 5
the object transformation matrix for the frontal range image by Trange, and that
for the input color image frame f by Tf (f = 1 : : : n). Thus, the projection of a
range image pixel (i.e., corresponding point on the object surface) in the color image
frame f is given as
pf =Y
TfT�1
rangeP (f = 1 : : : n) (1)
where the last component of pf has to be normalized to give the projected image
location (x; y). The observed color of the range-image pixel in the color image frame
f is given as the (R;G;B) color intensity at the pixel location (x; y). To avoid
unnecessary aliasing, bilinear interpolation is used to sample the color intensity. If
the range image pixel is not visible in the color image (i.e., the surface point isfacing away from the camera, or it is occluded), the observed color for the pixel is
set to (R;G;B) = (0; 0; 0). By repeating this for all object orientations, we �nally
get an observed color sequence for each of the range image pixels.
2.3. Re ection Model
In this section, we describe the re ectance model used in this work. The re ectance
model will be used later for separating the di�use and surface re ection components
from a sequence of color images. The re ection component separation is described
in Section 2.4. The model will also be used for re ectance parameter estimation
which is explained in Section 2.5.
A general re ection model is described in terms of three re ection components,
namely the di�use lobe, the specular lobe, and the specular spike [7]. Unlike the
di�use lobe and the specular lobe components, the specular spike component is not
commonly observed in many actual applications. The component can be observed
only from mirror-like smooth surfaces where re ected light rays of the specular spike
component are concentrated in a specular direction. It is, thus, di�cult to observe
the specular spike component from a coarsely sampled set of viewing directions.
Therefore, in many computer vision and computer graphics applications, re ection
models are represented by linear combinations of two re ection components: the
di�use lobe component and the specular lobe component. These two re ection
components are normally called the di�use re ection component and the specular
re ection component, respectively. This re ection model was formally introduced by
Shafer as the dichromatic re ection model [12]. The Torrance-Sparrow model [13] is
used in our analysis for representing the di�use and specular re ection components.As Fig. 1 illustrates, the illumination and viewing directions are �xed and are
assumed to be the same. The re ection model used for the particular experiment
setup is given as
Im = KD;m cos � +KS;m
1
cos �exp
��2
2�2�m = R;G;B (2)
where � is the angle between the surface normal and the viewing direction (or the
light source direction), KD;m and KS;m are constants for the respective re ection

6 International Journal of Shape Modeling
components, and �� is the standard deviation of a facet slope � of the Torrance-
Sparrow model. For the derivation of the re ection model, see the appendices of [10].
The direction of the light source and the camera with respect to the surface normal is
referred as the sensor direction � in this paper. In our analysis, only re ections which
bounce only once from the light source are considered. Therefore, the re ection
model is valid only for convex objects, and it cannot represent interre ections on
concave object surfaces. We empirically found that interre ection did not a�ect our
analysis signi�cantly.
2.4. Re ection Component Separation
The algorithm to separate the two re ection components is described here. The
separation of the di�use and specular components is important for robust estima-
tion of re ectance parameters. It has been reported that estimating all re ectance
parameters at once tends to make computation unstable [4]. Therefore, the separa-
tion algorithm is applied prior to re ectance parameter estimation. The separation
algorithm was originally introduced for the case of a moving light source by Sato
and Ikeuchi [9]. In this paper, a similar algorithm is applied for the case of a moving
object.Using three color bands; red, green, and blue, the coe�cients KD;m and KS;m,
in Eq.(2), becomes two linearly independent vectors, ~KD and ~KS , unless the colors
of the two re ection components are accidentally the same
~KD =�KD;R KD;G KD;B
�T ~KS =�KS;R KS;G KS;B
�T(3)
These two vectors represent the colors of the di�use and specular re ection compo-
nents in the dichromatic re ectance model [12].
First, the color intensities in the R, G, and B channels from n input images of
the object are measured for each range image pixel as described in Section 2.2. It is
important to note that all intensities are measured for the same range image pixel.
The three sequences of intensity values are stored in the columns of an n�3 matrix
M . Considering the re ectance model and two color vectors in Eq.(2) and Eq.(3),
the intensity values in the R, G, and B channels can be represented as
M =�
~MR~MG
~MB
�
=
26664
cos �1 E(�1)cos �2 E(�2)...
...cos �n E(�n)
37775�KD;R KD;G KD;B
KS;R KS;G KS;B
�(4)
=�
~GD~GS
� " ~KD
T
~KS
T
#
� GK

Instructions for Typesetting Camera-Ready Manuscripts 7
where E(�) = (exp(��2=2��2))= cos �, the two vectors ~GD and ~GS represent the
intensity values of the di�use and specular re ection components with respect to
the sensor direction �. The vectors ~KD and ~KS represent the di�use and the
specular re ection color vectors, respectively. We call the two matrices G and K,
the geometry matrix and the color matrix, respectively.
Suppose we have an estimate of the color matrix K. Then, the two re ection
components represented by the geometry matrix G are obtained by projecting the
observed re ection stored in M onto the two color vectors ~KD and ~KS .
G =MK+ (5)
where K+ is the 3� 2 pseudoinverse matrix of the color matrix K.
The derivation shown above is based on the assumption that the color matrix
K is known. In our experiments, the specular re ection color vector ~KS is directly
measured by a calibration procedure. Therefore, only the di�use color vector ~KD
is unknown and needs to be determined.
From Eq.(2), it can be seen that the distribution of the specular re ection com-
ponent is limited to a �xed angle, depending on ��. Therefore, if two vectors,
~wi = [IRi IGi IBi]T (i = 1; 2) are sampled on the � axis at large enough interval,
at least one of these vectors will be equal to the color vector of the di�use re ec-
tion component ~KD . (i.e., it has no specular re ection component.) The desired
color vector of the di�use re ection component ~KD is the vector ~wi which subtends
the largest angle with respect to the vector ~KS . The angle between the two color
vectors can be calculated as � = arccos( ~KS � ~wi=(j ~KS jj ~wij)).
Once we get the color matrix K, the geometry matrix G can be calculated from
Eq.(5). Each of the di�use and specular re ection components is then given as
MD = ~GD~KD
TMS = ~GS
~KS
T: (6)
2.5. Specular Parameter Estimation for Segmented Regions
In the previous section, we described our method for separating the two re ection
components from a sequence of observed colors of each range image pixel. In this
section, we will discuss how to estimate parameters of the re ectance model for the
range image pixel using the separated re ection components.
By applying the separation algorithm as explained above, we obtain a sequence
of the di�use re ection intensities and a sequence of the specular re ection intensi-
ties for each range image pixel. This information is su�cient to estimate re ectance
parameters of the re ection model Eq.(2) separately for the two re ection compo-
nents. As Eq.(2) shows, the re ectance model is a function of the angle between the
surface normal and the viewing direction �. Therefore, for estimating re ectance
parameters: KD;m, KS;m, and ��, the angle � has to be computed as the object
is rotated. Since the projection transformation matrix is already given and the
object orientation is known in the world coordinate system, it is straightforward

8 International Journal of Shape Modeling
to compute the surface normal vector and a viewing direction vector (or a illumi-
nation vector) at a surface point corresponding to each range image pixel. Thus,
the angle � between the surface normal and the viewing direction vector can be
computed. After the angle � is computed, the re ectance parameters for the di�use
re ection component (KD;m) and the specular re ection component (KS;m and ��)
are estimated separately. In our experiments, the camera output is calibrated so
that the specular re ection color has the same value from the three color channels.
Therefore, only one color band is used to estimate KS in our experiment.
By repeating the estimation procedure for all range image pixels, we can esti-
mate the di�use re ection component parameters for all range image pixels if those
pixels are illuminated in one or more frames of the image sequence. On the other
hand, the specular re ection component can be observed only from a few viewing
directions. Due to this fact, the specular re ection component can be observed
only in a small subset of all range image pixels. We cannot estimate the specular
re ection component parameters for those pixels in which the specular re ection
component is not observed. Even if the specular re ection component is observed,
the parameter estimation can become unreliable if the specular re ection is not
su�ciently strong.
For the above reasons, we decided to assign the specular re ection component
parameters based on region segmentation. In our experiments, it is assumed that
the object surface can be segmented into a �nite number of regions which have
uniform di�use color, and all range image pixels within each region have the same
specular re ection component parameters. By using the segmentation algorithm,the specular re ection parameters of each region can be estimated from range im-
age pixels with strong specularity. The estimated parameters are assigned to the
rest of range image pixels in the region. The range image pixels with strong spec-
ularity can be easily selected after the re ectance components are separated. The
limitation of this approach is that the specular re ection parameters for a region
cannot be estimated if no specularity is observed in the region. In that case, the
specular re ection parameters of neighboring regions can be assigned to the region
as an approximation. It is important to note that segmentation and parameter es-
timation are used only for the specular re ection component. The di�use re ection
component parameters are estimated locally regardless of specularity.
After re ectance parameters are estimated for each of the range image pixels,
each range image pixel has 5 associated re ectance parameters (KD;R, KD;G, KD;B,
KS , and ��). Combining those parameters with the (X;Y; Z) location of the range
image pixel, we obtain a new image with 8 bands (X, Y , Z, KD;R, KD;G, KD;B,
KS , and ��). We call this image an object image since it contains both shape and
re ectance properties of the object. Using this technique, we obtain the object
images of two real objects. These object images will be later used for creating a
new object model whose shape and re ectance properties are interpolated from the
two real objects.

Instructions for Typesetting Camera-Ready Manuscripts 9
Q1n Q2
n
P1n P2
n
X1 X2nv
u
v
u
the first object image the second object image
Figure 2: Pixel correspondence by a line pair
3. Interpolation of Shape and Re ectance Properties
After object images of the real objects are created, we can generate new object
images by interpolating between the obtained object images. For this purpose,
we need to de�ne pixelwise correspondence between the two object images. In
this section, we describe how to de�ne the pixelwise correspondence and how to
interpolate the two object images based on the correspondence.
Several algorithms for establishing pixelwise correspondence between two images
have been developed. In our analysis, we used the mapping introduced by Beier
and Neely [1] to de�ne the pixelwise correspondence between the two object images,
each of which has 8 bands (X, Y , Z, KD;R, KD;G, KD;B , KS , and ��). A user
selects m pairs of corresponding line features each of which is speci�ed by pairs of
pixel coordinates Pni Q
ni where i is the image number (i = 1; 2) and n is the index of
the line pair (n = 1 : : : m). First, we consider a mapping de�ned by one pair of lines
in the two object images (Fig. 2). A pair of corresponding lines Pn1 Q
n1 in the �rst
object image and Pn2 Q
n2 in the second object image de�nes a coordinate mapping
from the �rst image pixel coordinate X1 to the second image pixel coordinate Xn2
such that
u =(X1 � Pn
1 ) � (Qn1 � Pn
1 )
kQn1 � Pn
1 k2
v =(X1 � Pn
1 ) � (Qn1 � Pn
1 )?kQn
1� Pn
1k
(7)
Xn2 = Pn
2 + u(Qn2 � Pn
2 ) +v(Qn
2 � Pn2 )?
kQn2� Pn
2k
(8)
where (V )? is the vector perpendicular to and the same length as the input vector
V . (There are two perpendicular vectors de�ned this manner. Either the left or
right one can be used as long as it is consistently used throughout.) The value
u represents the position along the line segment Pni Q
ni . The value u is 0 at the
point Pni and 1 at the point Qn
i , and can be less than 0 and greater than 1 outside
the line segment P ni Q
ni . The value v represents the perpendicular distance from X
to the line segment Pni Q
ni . Then, Eq.(8) determines the second image coordinate
Xn2 which corresponds to the �rst image coordinate X1 based on the nth line pairs
Pn1 Q
n1 and Pn
2 Qn2 (n = 1 : : :m).

10 International Journal of Shape Modeling
For multiple pairs of lines, the second image coordinate X2 is given by a linear
combination of displacements Xn2 �X1 for all line pairs (n = 1 : : :m). The weight of
the linear combination is determined by the distance from the �rst image coordinate
X1 to the line segment P n1 Q
n1 as
wn = fkQn
1 � Pn1 k
p
a + dist(X1; Pn1 Q
n1 )gb
(9)
where a, b and p are constants which are used to change the relative e�ect of the
lines. In our implementation, we used a = 0:1, b = 2:0, and p = 0:2.
Finally, the second image coordinate X2 is given as
X2 = X1 +
Xn
wn(Xn2 �X1)X
n
wn: (10)
Once the pixelwise correspondences are established, an intermediate object im-
age can be created as linear interpolation of the two object images. For each pixel
X1 of the �rst object image, the corresponding pixel X2 in the second object image
is determined. Then, a new intermediate object image pixel is given as linear in-
terpolation of values of the two object image pixels X1 and X2. Smooth transition
of object shapes and re ectance properties are obtained by gradually changing the
ratio of the interpolation.
4. Experimental Results
4.1. Measurement
In the previous sections, we described our method for obtaining new object mod-
els whose shape and re ectance properties are interpolated from two real objects.The method includes four steps: (1) separate the two fundamental re ection compo-
nents using a range image and a sequence of color images, (2) estimate the re ection
model parameters from the separated re ection components, and store them with
the (X;Y;Z) coordinates as an object image, (3) establish pixelwise correspondences
between two object images, and create an intermediate object image by interpolat-
ing the two object images, and (4) synthesize images of the interpolated object
using Eq.(2). We applied the method to actual range and color images taken in a
laboratory setup in order to demonstrate the feasibility of the proposed method.
The target objects used in our experiment are two plastic toys with an approx-
imate height of 170mm. These objects are multi-colored, and each painted surface
region appears to have a uniform color. One frontal range image and a sequence of
color images of each object are taken using the image acquisition system described
in Section 2.1. A frontal range image is captured before rotating the object (ob-
ject orientation = 0�). Then, a sequence of color images are taken by rotating the
object. In our experiment, color images are taken at 3� intervals from �90� to 90�

Instructions for Typesetting Camera-Ready Manuscripts 11
(60 color images total). The input range images for the two plastic toys are shown
as a mesh in Fig. 3. The input color image sequences of the objects are shown in
Fig. 4 and Fig. 5.
object 1 object 2
Figure 3: Measured shapes
frame 0 frame 15 frame 30 frame 45 frame 59
Figure 4: Input color sequence for object 1
frame 0 frame 15 frame 30 frame 45 frame 59
Figure 5: Input color sequence for object 2
4.2. Re ection Component Separation
By projecting a range image pixel onto all input color images, a sequence of observed
colors is determined for the range image pixel as explained in Section 2.2. Fig. 6 (a)
illustrates a typical observed color sequence for a range image pixel with specularity.
The intensities are set to zero before image frame 8 and after image frame 53
because the surface point corresponding to the range image pixel is not visible
from the camera due to self-occlusion. The specular re ection component can be
observed near image frame 29. When the specular re ection component exists, the

12 International Journal of Shape Modeling
output color intensity is a linear combination of the di�use re ection component
and the specular re ection component. In this example, the observed specular
re ection is relatively small compared to the di�use re ection component. As a
result, estimating re ectance parameters for both the di�use and specular re ection
components together could be sensitive to various disturbances such as image noise.
That is why the re ection component separation is performed in prior to parameter
estimation in our analysis. By separating the two re ection components, re ectance
parameters can be estimated separately in a robust manner.
The algorithm to separate the di�use and specular re ection components was
applied to the observed color sequence for each range image pixel. The red, green,
and blue intensities of the observed color sequence are stored in the matrixM as its
columns Eq.(4). Then, the matrix G is computed from the matrixM and the matrix
K which is estimated as described in Section 2.4. Finally, the di�use and specular
re ection components are given as shown in Eq.(6). This re ection component
separation is repeated for all range image pixels. The separation result for the
observed color change in Fig. 6 (a) is shown in Fig. 6 (b). After the re ection
component separation, re ectance parameters can be estimated separately. The
result of parameter estimation will be shown in Section 4.3.
0 10 20 30 40 50 60image frame number
0.0
20.0
40.0
60.0
80.0
100.0
120.0
140.0
inte
nsity
redgreenblue
0 10 20 30 40 50 60image frame number
0.0
20.0
40.0
60.0
80.0
100.0
120.0
140.0
inte
nsity
diffuse reddiffuse greendiffuse bluespecular red
specular greenspecular blue
(a) (b)
Figure 6: Observed color sequence (a) and separation result (b)
4.3. Re ectance Parameter Estimation for Segmented Regions
By using the separated di�use re ection components, the object surface was seg-
mented based on the hue of the di�use re ection components, as explained in Section
2.5. The results of the region segmentation are shown in Fig. 7 (segmented regions
are represented as grey levels). For estimating specular re ection component pa-
rameters, 10 range image pixels with the largest specular re ection component are
selected for each of the segmented regions. Then, the specular re ection component
parameters of the re ection model Eq.(2) are estimated for each of those selected
range image pixels. Finally, the average of the estimated parameters of the selected
range image pixels is used as the specular re ection component parameters of the
segmented region. The estimated specular re ection parameters are assigned to
all range image pixels within the segmented region. The results of the estimated
specular re ection component parameters are shown in Table 1 and Table 2.

Instructions for Typesetting Camera-Ready Manuscripts 13
region 4
region 3
region 1
region 0
region 2
region 5
region 2
region 3
region 4
region 1
region 0
region 6
object 1 object 2
Figure 7: Segmented object surface
Unlike the specular re ection parameter estimation, parameters of the di�use
re ection component (KD;R;KD;G; KD;B) are estimated for each range image pixel
individually. That is because the di�use re ection component at the range image
pixel is guaranteed to be observed as long as the range image pixel is illuminated
and not occluded from the viewing direction. The results of the di�use re ection
component parameter estimation are shown in Fig. 8. which shows the estimated
parameters KD;R, KD;G, and KD;B as a color image.
Table 1. Estimated specular parameters for the object 1
Ks ��
0 17.31 0.3011 37.00 0.280
region 2 40.33 0.2693 42.17 0.3014 46.38 0.238
Table 2. Estimated specular parameters for the object 2
Ks ��
0 36.82 0.2931 43.69 0.1872 78.15 0.166
region 3 78.55 0.1974 82.71 0.2315 91.54 0.1666 43.69 0.189
By combining the �ve estimated parameters (KD;R, KD;G, KD;B, KS , and
��) and three measured values (X;Y;Z), we obtain object images for the two real
objects. These two object images are used to create intermediate object images
which have interpolated shape and re ectance properties.

14 International Journal of Shape Modeling
object 1 object 2
Figure 8: Estimated KD
object 1 object 2
Figure 9: Edited line pairs (70 line pairs are shown in green)
4.4. Interpolation of Shape and Re ectance Parameters
By using the two object images, an interpolated object shape and re ectance prop-
erties are created as explained in Section 3. Fig. 9 shows 70 manually drawn
corresponding line pairs on the two object images in green. Based on the line pairs,
pixelwise correspondence between the two object images is determined. Then, the
two images are linearly interpolated to produce an intermediate object image. An
example of the interpolated object shape and re ectance parameters are shown in
Fig. 10. In this particular example, 50%-50% interpolation was used.
KS σ αKDshape
Figure 10: Interpolation of shape, KD, KS , and ��

Instructions for Typesetting Camera-Ready Manuscripts 15
100%-0% 75%-25% 50%-50% 25%-75% 0%-100%
Figure 11: Synthesized interpolated objects
4.5. Morphing Results
Finally, the interpolated object shape and re ectance properties are used to create
new color images in the morph. Fig. 11 shows a synthesized color image of the
object for 50%-50% interpolation along with synthesized images for other interpo-
lation ratios which are created in the same manner as 50%-50% interpolation. The
same viewing direction, light source direction, and object orientation are used for
rendering Fig. 11 as for frame 30 of the input color images in Fig. 4 and Fig.
5. It is important to see that specularity appears naturally in those synthesized
color images. This is because, unlike other methods, our method uses intermediate
re ectance parameters, as well as intermediate shapes, which are computed sepa-
rately from the two real objects. Therefore, images rendered using our approach do
not contain false specularities which are often created by other 2D or 3D morphing
techniques.
5. Conclusion
We have studied an approach for 3D shape and re ectance property morphing of
two real objects. Unlike previously developed 3D shape morphing techniques, ourapproach uses object surface re ectance properties as well as object shapes for cre-
ating intermediate morphing results. This enables us to render images with correct
shading such as highlights and shadows. Our morphing method consists of two
components: shape and re ectance property measurement, and smooth interpola-
tion of those measured properties. First, a range image and a color image sequence
are used for obtaining an object shape and re ectance properties. The estimation
of the re ection parameters is performed reliably by separating the re ection com-
ponents. The obtained shape and re ectance parameters are stored in an extended
range image which we call object image. The re ection model used in our analy-
sis is described as a linear combination of the Lambertian model and a simpli�ed
Torrance-Sparrow model. After object images are created for the two real objects,
the object images are used to create a new intermediate object image which has
interpolated shape and re ectance properties. Finally, the newly created interme-
diate object image is used to render new images of the objects in the morph. The
proposed approach has been applied to real range and color images of two plas-
16 International Journal of Shape Modeling
tic objects, and the e�ectiveness of the proposed approach has been successfully
demonstrated by showing intermediate morphing results with proper shadings.
References
1. T. Beier and S. Neely, Feature-based image matamorphosis, Computer Graphics, vol.26, no. 2, (July 1992) pp. 35-42. Proceedings of SIGGRAPH 92.
2. T. He, S. Wang, and A. Kaufman, Wavelet-based volume morphing, in Proceedingsof IEEE/ACM SIGGRAPH Visualization '94, Los Alamitos, CA (October 1994) pp.85-91.
3. K. Ikeuchi and K. Sato, Determining re ectance properties of an object using range andbrightness images, IEEE Transactions on Pattern Analysis and Machine Intelligence,vol. 13, no. 11 (November 1991) pp. 1139-1153.
4. G. Kay and T. Caelli, Inverting an illumination model from range and intensity maps,CVGIP: Image Understanding, vol. 59, no. 2 (March 1994) pp. 183-201.
5. J. R. Kent, W. E. Carlson, and R. E. Parent, Shape transformation for polyhedralobjects, Computer Graphics, vol. 26, no. 2, New York, NY (July 1992) pp. 47-54. Pro-ceedings of SIGGRAPH 92.
6. A. Lerios, C. D. Gar�nkle, and M. Levoy, Feature-based volume metamorphosis, Com-puter Graphics, Los Angeles, CA (August 1995) pp. 449-456. Proceedings of SIG-GRAPH 95.
7. S. Nayar, K. Ikeuchi, and T. Kanade, Surface re ection: physical and geometrical per-spectives, IEEE Transactions on Pattern Analysis and Machine Intelligence, vol. 13,no. 7, (1991) pp. 611-634.
8. K. Sato, H. Yamamoto, and S. Inokuchi, Range imaging system utilizing nematic liquidcrystal mask, in Proceedings of International Conference on Computer Vision, (1987)pp. 657-661.
9. Y. Sato and K. Ikeuchi, Temporal-color space analysis of re ection, Journal of OpticalSociety of America A, vol. 11, no. 11 (November 1994) pp. 2990-3002.
10. Y. Sato and K. Ikeuchi, Re ectance analysis for 3D computer graphics model gener-ation, Graphical Models and Image Processing, vol. 58, no. 5 (September 1996) pp.437-451.
11. T. W. Sederberg, P. Gao, G. Wang, and H. Mu, 2-D shape blending: An intrinsicsolution to the vertex path problem, in Proceedings of ACM SIGGRAPH 93, NewYork, NY (August 1993) pp. 15-18.
12. S. Shafer, Using color to separate re ection components, COLOR Research, vol. 10, no.4, (1985) pp. 210-218.
13. K. E. Torrance and E. M. Sparrow, Theory for o�-specular re ection from roughenedsurface, Journal of Optical Society of America, vol. 57 (1967) pp. 1105-1114.