Embed Size (px)
Citation preview

Consolidated group revenues climb 15 % to € 1,887 (1,639) million
Consolidated group operating profit rises sharply, up 43 % to € 263 (184) million
Forecast for fiscal 2012/13 overall: consolidated group revenues over € 7.0 (7.0) billion; consolidated group operating profit over € 800 (751) million
First quarter 2012/13March 1 to May 31, 2012Release date: July 12, 2012
Interim ReportQ12012/13

➥Contents Overview
Annual general meeting for fiscal 2011/12 July 19, 2012
Q2 – 1st half year report 2012/13 October 11, 2012
Q3 – 1st to 3rd quarter report 2012/13 January 10, 2013
Press and analysts’ conference fiscal 2012/13 May 16, 2013
Q1 – 1st quarter report 2013/14 July 11, 2013
Annual general meeting for fiscal 2012/13 August 1, 2013
Q2 – 1st half year report 2013/14 October 10, 2013
This interim report is available in German and English. This trans-lation is provided for convenience and should not be relied upon exclusively. PDF files of the interim report can be downloaded from the company’s homepage at www.suedzucker.de/de/Investor-Relations/Publikationen/Berichte/Berichte_2012_13/ and/orwww.suedzucker.de/en/Investor-Relations/Publikationen/Berichte/Berichte_2012_13/
On the following pages, the numbers in brackets represent the corresponding previous year’s figures or items. Südzucker AG’s financial year is not aligned with the calendar year. The first quar-ter covers the period March 1 to May 31.
Numbers and percentages stated are subject to differences due to rounding.
Financial calendar

Contents
Interim management report ����������������������� 4
Economic policy, general framework _________________ 4
Market developments ____________________________ 6
Business performance ____________________________ 9
Risk management ______________________________ 18
Events after the balance sheet date _________________ 18
Outlook ______________________________________ 19
Interim financial statements ���������������������� 20
Consolidated statement of comprehensive income ______ 20
Consolidated cash flow statement __________________ 21
Consolidated balance sheet _______________________ 22
Consolidated statement of changes in
shareholders’ equity ____________________________ 23
Development of income and expenses recognized
directly in group equity___________________________ 24
Notes to the interim financial statements ����������� 24

Contents Group figures
to May 31, 2012
1st quarter2012/13 2011/12 +/- in %
Revenues and earningsRevenues € million 1,887 1,639 15.1EBITDA € million 312 231 34.8EBITDA margin % 16.5 14.1Depreciation € million -49 -47 3.4Operating profit € million 263 184 43.0Operating margin % 13.9 11.2Net earnings for the year € million 263 130 > 100
Cash flow and investmentsCash flow € million 252 191 32.0Investments in fixed assets1 € million 58 49 19.4Investments in financial assets/acquisitions € million 181 2 > 100Total investments € million 239 51 > 100
PerformanceFixed assets1 € million 2,606 2,608 -0.1Goodwill € million 1,141 1,132 0.8Working Capital € million 2,235 1,672 33.7Capital Employed € million 6,095 5,533 10.2
Capital structureTotal assets € million 7,921 7,389 7.2Shareholders’ equity € million 4,166 3,810 9.3Net financial debt € million 1,223 932 31.3Equity ratio % 52.6 51.6Net financial debt as % of equity (Gearing) % 29.4 24.4
SharesMarket capitalization € million 4,656 4,144 12.4Total shares issued as of May 31 million of shares 189.4 189.4 0.0Average price € 23.24 20.47 13.5Highest price € 24.81 22.27 11.4Lowest price € 21.84 18.61 17.4Closing price on May 31 € 24.59 21.89 12.3Average trading volume/day million of shares 726 663 9.5MDAX® closing price on May 31 10,148 10,884 -6.8Performance Südzucker share March 1 to May 31 % 13 10Performance MDAX® March 1 to May 31 % 3 6
Employees 17,829 17,463 2.11 Including intangible assets.

3Overview
First quarter 2012/13
•Consolidatedgrouprevenuesclimb15%to€1,887(1,639)million
•Consolidatedgroupoperatingprofitrisessharply,up43%to€263(184)million
•Sugarsegment’soperatingprofitrises,primarilybecauseofhighersalesrevenuesinWesternEuropesincefallof2011,drivenbyhigherworldmarketprices:
•Revenues:+21%to€998(827)million
•Operatingprofit:€193(111)million
•Specialproductssegmentstartsfiscalyearonhighnote:
•Revenues:+2%to€460(450)million
•Operatingprofit:€43(40)million
•CropEnergiessegment’srevenuesupsharply,drivenbyhigherethanolvolumes:
•Revenues:+24%to€153(124)million
•Operatingprofit:€15(15)million
•Highercostsdrivefruitsegment’soperatingprofitdownfromlastyear’shighlevel:
•Revenues:+16%to€276(238)million
•Operatingprofit:€12(18)million
Forecast for the 2012/13 financial year
•Consolidatedgrouprevenuesexpectedtoexceed€7.0(7.0)billion
•Consolidatedgroupoperatingprofitexpectedtobeabove€800(751)million.
Overview
Revenues by segment€ million 1st quarter
2012/13 2011/12 +/-in%
Sugarsegment 998 827 20.5
Specialproductssegment 460 450 2.3
CropEnergiessegment 153 124 23.7
Fruitsegment 276 238 16.0
Group 1,887 1,639 15.1
53%
24%
8%
15%
Operating profit by segment€ million 1st quarter
2012/13 2011/12 +/-in%
Sugarsegment 193 111 73.2
Specialproductssegment 43 40 8.1
CropEnergiessegment 15 15 -2.6
Fruitsegment 12 18 -30.1
Group 263 184 43.0
73%
16%
6%
5%

4 Interim management reportEconomic policy, general framework
Economic policy, general framework
EU sugar market
TheEUCommissiondoesnotexpectimportsfrompreferrednationstorisesignificantlyduringthecurrent2011/12sugarmarketingyear(October1toSeptember30).Inordertoensureacontinuoussupplyforthemarket,0.4milliontonnesofnon-quotasugarwerereleasedformarketingintheEUfoodmarketinDecember2011andafurther0.25milliontonnesinApril2012,forwhichsugarproducersarerequiredtopayasurpluslevyof85and211€/t.Inaddition,theEUCommissionlaunchedatenderofferingforimportsforthe2011/12sugarmarketingyear,towhichabout0.4milliontonnesofimportswereallocatedinseveralstepsforimportatreducedduties.Duetotheimprovedsupplysituation,theEU’sinventorieswillinfactbehigherasofSeptember30,2012.
Licensestoexport0.65milliontonnesofnon-quotasugarasofJanuary2012hadalreadybeenallocatedforthe2011/12sugarmarketingyearbyMarch2011.InNovember2011,afurther0.7milliontonneswereapprovedforexport.Fortheupcoming2012/13sugarmarketingyear,0.65milliontonneswereinitiallyapprovedforexport.
Aduty-freeworldmarketimportquotaof0.4milliontonnesperannumhasalsobeenregularlygrantedfornon-quotasugarforusebythechemical,pharmaceuticalandfer-mentationindustries,aswellasforbioethanolproduction,sincethe2008/09sugarmar-ketingyear;however,thisquotahasbeenlittleusedtodate.Inviewofthehighworldmarketpricesforsugarandhighlogisticscosts,itisnotlikelythatmuchusewillbemadeofthisquotaforthe2011/12sugarmarketingyeareither.
EU sugar policies
KeysectionsofthedomesticEUsugarmarketregulationswillexpireonSeptember30,2015.VariousoptionsregardingEUsugarmarketregulationsasofthe2015/16sugarmarket-ingyeararealsobeingexploredwithinthecontextofcurrentdiscussionsonthefuturedirectionofEUagriculturalpolicyasof2014.TheEUCommissionsubmittedalegislativeproposaltotheCouncilofAgriculturalMinistersandtheEUParliamentinOctober2011,inwhichitrecommendedthattheexistingquotasandminimumbeetpriceregulationsbeterminatedeffectiveSeptember30,2015.However,MichelDantin,therapporteuroftheEuropeanParliament’sagriculturalcommitteeforthereformofthecommonmarketorganization,calledforanextensionofthesugarquotaandminimumbeetpriceregula-tionstoSeptember30,2020.
ThecurrentEUsugarmarketregulationsprotecttheEUsugarmarketfromvolumevola-tilityandguaranteeahighdegreeofsupplysecurityforprocessorsandconsumers.Thedevelopmentsofthepasttwoyears, includingthoseintheinternationalsugarmarket,haveshownhowimportantadequateself-sufficiencyis.Theexistingvolumemanagementsysteminconjunctionwithminimumbeetpricesthuscontinuestobeanindispensabletool.SüdzuckerconsidersanextensionofthecurrentEUsugarpoliciestoatleast2020necessarytoensuresupplyreliabilityforconsumersandprocessorsinEurope,indepen-dentofdevelopmentsontheworldmarket.

5Interim management reportEconomic policy, general framework
WTO/free-trade agreement
Todate,theongoingWTO-IInegotiations,whichhavebeenunderwaysince2001,havenotbeenconcluded.Because2012isapresidentialelectionyearintheUnitedStates,theDoharoundisnotexpectedtobeconcludedthisyeareither.
InparallelwiththeongoingWTO-IIround,theEUCommissionisalsonegotiatingpoten-tialfreetradeagreementswithvariousnationsandcommunities,suchasMERCOSUR.Intheeventsugarandsugaryproductsarenotdefinedassensitiveproducts–contrarytocurrenttradepractice–substantialadditionalduty-freesugarvolumescouldinfuturebeimportedintotheEuropeanUnion.
TheEUCommissiongrantedtheAndeannationsColombiaandPeruandCentralAmericannationssuchasCostaRica,Guatemala,Honduras,Nicaragua,PanamaandElSalvadoranannualduty-freeimportquotaof0.3milliontonnesofsugarandproductscontainingsubstantialamountsofsugar.Theseagreementsmustberatifiedbyallofthebeneficiarystates.TheagreementsarethentoberolledoutbeforetheyhavebeenratifiedbytheEUcommitteesandtheirmemberstates.Thisisexpectedtotakeplaceinthefirsthalfof2013.
Implementation of European climate and energy package
TheEU’s renewableenergyand fuelqualitydirectives formthe legislative frameworkforthemandatoryblendratioof10%renewableenergiesinthetransportationsectorby2020.TheEUrequirementsfornationalimplementation,particularlytheintroductionofsustainabilitycriteria,arenowlegallybindinginmemberstatessuchasGermany,GreatBritain,theNetherlands,Austria,SwedenandHungary.ThesustainabilitycriteriaensurethatonlysustainablyproducedbiofuelsareusedintheEU;amongotherthings,producersmustgenerateatleast35%lessbyweightofgreenhousegasemissionsthanfossilfuels.Todate,theEUCommissionhasapprovedeightcertificationsystems,validthroughouttheEU,thatcanbeusedtoverifyadherencetothesustainabilitycriteria.
OnDecember22,2010,theEUCommissionpresentedareportontheimpactofindirectland-usechange(iLUC)onbiofuelgreenhousegasemissions.Inviewofthehighdegreeofuncertaintyregardingthealgorithmsusedintherepresentativemodel,theEUCom-missionisreviewingtheneedtoimplementlegislation.TheCommissionplanstopresentsuggestedlegislationpriortothe2012summerbreak.OnMarch15,2012,theEuropeanParliamentaskedtheEUCommissiontointroduceadditionalsustainabilityconditions,es-peciallyregionalones,forcertainbiofuelcategoriesinordertohelpappropriatelyprotecttheenvironmentinnon-EUcountries.TheEuropeanParliamentthussharestheviewoftheGermanbiofuelindustry,whichduringtheiLUCdebateshadalreadyspokenoutearlyinfavorofhandlingland-usechangesregionallytoavoidundesirabledevelopmentsincountriesoutsidetheEU.

6 Interim management reportEconomic policy, general framework | Market developments
Progress on creating fair trade rules for bioethanol imports
OnNovember25,2011,theEUCommissionlaunchedanti-dumpingandanti-subsidycourtactionsrelatedtotheimportofbioethanoloriginatingintheUnitedStates.TheEuro-peanbioethanolassociationePURElaunchedbothcourtactions,becausesharplyhigherbioethanolimportsfromtheUnitedStateshavenegativelyimpactedbioethanolpricesinEuropeandcausedsignificanteconomicdisadvantagesfortheEuropeanbioethanolindustry.TheimportsweredriveninpartbyAmericangovernmentsubsidies,whichwereoriginallyintendedtopromotetheuseofbioethanolasafuelintheUnitedStates.Duty-relatedfactorsduetoinconsistenttreatmentofbioethanolimportsintotheEUalsohadanimpact.TheEUCommissioniscurrentlyinvestigatingwhetherthesepracticeshadaseriousnegativeimpactontheEuropeanbioethanol industryandwhetheritneedstointroduceoffsettingduties.TheEUCommissionwilldecidewhetherornottointroducepreliminaryoffsettingdutiesnolaterthanAugust24,2012.
TheEUCommissionhadalreadyadoptedlegislationthatwillhelptoharmonizetariffsre-latedtobioethanolimportsonMarch13,2012.TheEUCommissionmadeclearthatblendsofbioethanolandgasolinewithabioethanolcomponentofover70%aretobetreatedasdenaturedethanol.ThismakesitmucheasiertoapplytariffstobioethanolimportsintotheEuropeanUnioncorrectlyandconsistently.Inthepast,customsauthoritiesinvari-ousstateshadintroduceddifferentclassificationsofbioethanolblends,anddespitethehighpercentageofbioethanol,hadoftenincorrectlytreatedthemaschemicalproducts.Thisenabledimporterstocircumventexistingcustomsruleswhenimportingbioethanol.However,thenewbioethanolimportruleswillnotcontributetorestoringfairtradecondi-tionsuntilthesecondhalfof2012,afterthetransitionalphaseisover.MarketobserversthusexpectUSsupplierstoactivelycontinueexportingamountsofbioethanolforthetimebeing;attheendofMay2012,theirelevatedinventoriestotaledabout3.4millionm3.
Market developmentsWorld sugar market
F.O.Licht’ssecondestimateoftheworld’ssugarbalanceforthe2011/12campaignyear,releasedinMarch2012,forecaststhatproductionwill increaseto176.9(165.4)milliontonnesandconsumptionriseto164.9(160.4)milliontonnes.Basedontheseproductionandconsumptionforecasts,inventorieswillriseto70.5(62.8)milliontonnesofsugar,or42.8(39.1)%ofoneyear’sconsumption,stillalowlevel.
Pricesontheworldsugarmarketcontinuedtobevolatileduringthecurrentbusinessyear.WorldmarketpricesforwhitesugarinMarch2012startedat650USD/tor490€/t,butsubsequentlydeclinedto559USD/tor450€/tasoftheendofMay.

7Interim management reportMarket developments
Grain prices still high
According to theUSDepartmentofAgriculture’s (USDA) June12,2012estimate,globalgrainproduction(excludingrice)forthe2012/13harvestisexpectedtorise3.5%toabout1,903milliontonnes.TheincreasestemsprimarilyfromincreasedcorncultivationinChinaandtheEU,aswellasgoodcornyieldsintheUnitedStates.Grainproductionwillthusexceedestimatedgrainconsumptionof1,888milliontonnesby2.6%andconsequentlyinventorieswillrise4.4%toabout374milliontonnes.TheEUCommissionisexpectingaslightdeclineintheyieldforthe2012/13grainharvestyearduetoreducedwheatcultivationandfrostdamage.Thegrainyieldisexpectedtodecline0.6%andcomeinat283milliontonnes,slightlyaboveprojectedconsumptionofabout276milliontonnes.Ofthistotal,about61%isexpectedtobeusedforanimalfeedand3.7%toproducebioethanol.
Inspiteoftheabundantsupplyofgrain,one-monthfuturesformillingwheatontheNYSELiffeParisremainedhigh,forwhichamoremoderatedwheatharvestforecastfortheEUandtheRussianFederationwaspartlyresponsible.Theone-monthfuturescontractslippedfromabout217€/tatthebeginningofMarchtoabout213€/tattheendofMay.
European ethanol prices rise slightly
AftertheBraziliansugarcaneharvestshranklastyearforthefirsttimeintenyears,ana-lystsareexpectingaslightlybetterharvestthanlastyearforthe2012/13sugarmarketingyear.However,expertspredictthatethanolfuelproductionwillcontinuetobeaslowaslastyearat21.1millionm3.Despitetightsupplies,ethanolpricesfellfromabout700USD/m3atthebeginningofMarchtoabout600USD/m3attheendofMayduetodecliningdomesticdemandforethanolfuel.
One-monthfuturesforbioethanoldroppedfrom594USD/m3atthebeginningofMarchto528USD/m3attheendofMay2012ontheChicagoBoardofTrade(CBOT)andtheChicagoMercantileExchange(CME).Thepricedropreflectslowercommodityandenergycosts,aswellashigherinventories.
InEurope,pricesatthebeginningofMarch2012werequotedat570€/m3FOBRotterdamduetothelowdemandforfuelandrosetoabout590€/m3attheendofMay2012duetohighercommoditycosts.Europeanethanolpricesarethusrunningcountertotheinter-nationaldecliningtrend,butduringthereportingperiod,werealmostalwayslowerthangasolineprices.Bioethanolwasabout100€/m3cheaperthangasolineattimes.
TheEUmarketforethanolfuelexpanded1.5%to5.5millionm3in2011,andexpertsexpectethanolfueldemandtojumpanother7.8%to5.9millionm3in2012.BioethanolconsumptioninGermanyisexpectedtogrow2.0%to1.6millionm3.Withanoticeablyincreasedshareofover15%inApril2012,E10hasestablisheditselfasthesecondmostimportanttypeofgasolineinGermanyaheadofSuperPlus.
8 Interim management reportMarket developments
Fruit
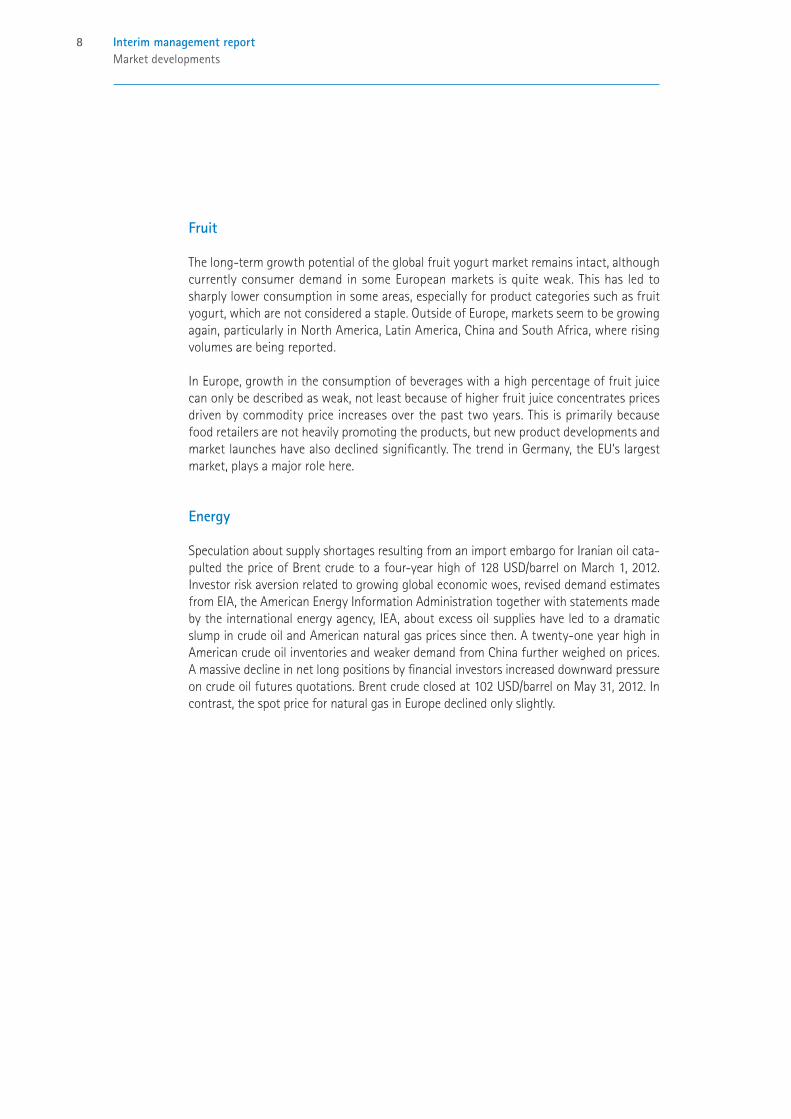
Thelong-termgrowthpotentialoftheglobalfruityogurtmarketremainsintact,althoughcurrentlyconsumerdemand insomeEuropeanmarkets isquiteweak.Thishas ledtosharplylowerconsumptioninsomeareas,especiallyforproductcategoriessuchasfruityogurt,whicharenotconsideredastaple.OutsideofEurope,marketsseemtobegrowingagain,particularlyinNorthAmerica,LatinAmerica,ChinaandSouthAfrica,whererisingvolumesarebeingreported.
InEurope,growthintheconsumptionofbeverageswithahighpercentageoffruitjuicecanonlybedescribedasweak,notleastbecauseofhigherfruitjuiceconcentratespricesdrivenbycommoditypriceincreasesoverthepasttwoyears.Thisisprimarilybecausefoodretailersarenotheavilypromotingtheproducts,butnewproductdevelopmentsandmarketlauncheshavealsodeclinedsignificantly.ThetrendinGermany,theEU’slargestmarket,playsamajorrolehere.
Energy
SpeculationaboutsupplyshortagesresultingfromanimportembargoforIranianoilcata-pultedthepriceofBrentcrudetoafour-yearhighof128USD/barrelonMarch1,2012.Investorriskaversionrelatedtogrowingglobaleconomicwoes,reviseddemandestimatesfromEIA,theAmericanEnergyInformationAdministrationtogetherwithstatementsmadebytheinternationalenergyagency,IEA,aboutexcessoilsupplieshaveledtoadramaticslumpincrudeoilandAmericannaturalgaspricessincethen.Atwenty-oneyearhighinAmericancrudeoilinventoriesandweakerdemandfromChinafurtherweighedonprices.Amassivedeclineinnetlongpositionsbyfinancialinvestorsincreaseddownwardpressureoncrudeoilfuturesquotations.Brentcrudeclosedat102USD/barrelonMay31,2012.Incontrast,thespotpricefornaturalgasinEuropedeclinedonlyslightly.

9Interim management reportBusiness performance
Business performance
Revenues and operating profit | Group
Revenues
€ million 1st quarter
2012/13 2011/12 +/-in%
Sugarsegment 998 827 20.5
Specialproductssegment 460 450 2.3
CropEnergiessegment 153 124 23.7
Fruitsegment 276 238 16.0
Group 1,887 1,639 15.1
Consolidatedgrouprevenuesgrewabout15%to€1,887(1,639)millioninthefirstthreemonthsofthe2012/13financialyear.Allsegmentscontributedtothisgrowth.
Operating profit
€ million 1st quarter
2012/13 2011/12 +/-in%
Sugarsegment 193 111 73.2
Specialproductssegment 43 40 8.1
CropEnergiessegment 15 15 -2.6
Fruitsegment 12 18 -30.1
Group 263 184 43.0
Consolidatedgroupoperatingprofitrosesharply,to€263(184)million.Thisincreasewasdrivenprimarilybythesugarsegment.Thefruitsegmentwasunabletomatchtheprioryear’sresult,buttheCropEnergiesandspecialproductsegments’numberswereonoraboveprioryear’slevel.

10 Interim management reportBusiness performance
Revenues and operating profit | Sugar segment
€ million 1st quarter
2012/13 2011/12 +/-in%
Revenues 998 827 20.5EBITDA 206 123 65.8
Depreciationonfixedassetsandintangibleassets -13 -12 3.9
Operating profit 193 111 73.2Restructuringcosts/specialitems 0 0 -
Income from operations 193 111 72.6EBITDAmargin 20.7% 15.0%
Operatingmargin 19.3% 13.4%
Investmentsinfixedassets 30 23 33.8
Investmentsinfinancialassets/acquisitions 181 2 >100
Total investments 211 25 > 100Employees 7,590 7,497 1.2
Thesugar segment reportedsharplyhigher revenues than lastyear in thefirst threemonthsoffiscal2012/13,upabout21%to€998(827)million.Theincreasewasdrivenmainlybyhighersugarsalesrevenuesresultingfromhigherworldmarketprices.Theim-provedharvestin2011andtheavailableexportquotasalsoledtomoreexports.
Thesugarsegment’soperatingprofitsoaredto€193(111)million,drivenmainlybyhighersugarrevenues.Commoditycostswerealsoupsharply.WhilelastyearonlythepricelevelinEasternEuropetrackedworldmarketpricesonaccountofthetermsofvariouscon-tracts,infallof2011revenuesinWesternEuropebegantocatchup.

11Interim management reportBusiness performance
Revenues and operating profit | Special products segment
€ million 1st quarter
2012/13 2011/12 +/-in%
Revenues 460 450 2.3EBITDA 63 59 7.3
Depreciationonfixedassetsandintangibleassets -20 -19 5.8
Operating profit 43 40 8.1Restructuringcosts/specialitems 0 0 -
Income from operations 43 40 8.6EBITDAmargin 13.7% 13.0%
Operatingmargin 9.3% 8.8%
Investmentsinfixedassets 17 12 38.8
Investmentsinfinancialassets/acquisitions 0 0 -
Total investments 17 12 38.8Employees 4,445 4,350 2.2
Thespecialproductsegment’sgrowthatthebeginningofthefiscalyearexceededourexpectations.Volumewassteady,buthighersalesrevenuesdroverevenuesto€460(450)million.
Operatingprofitroseto€43(40)million.Thestarchdivision’soperatingprofitwashigherthanlastyear,drivenbyhigherpricesforsweetenersandisoglucose.Together,theBENEO,FreibergerandPortionPackdivisionsalsocontributedtothehigherprofits.Thedivisionswereabletopassonhighercommoditycoststothemarketbyraisingprices.

12 Interim management reportBusiness performance
Revenues and operating profit | CropEnergies segment
€ million 1st quarter
2012/13 2011/12 +/-in%
Revenues 153 124 23.7EBITDA 23 23 -0.9
Depreciationonfixedassetsandintangibleassets -8 -8 1.3
Operating profit 15 15 -2.6Restructuringcosts/specialitems 0 0 -100.0
Income from operations 15 15 -2.0EBITDAmargin 14.9% 18.6%
Operatingmargin 9.7% 12.4%
Investmentsinfixedassets 5 6 -16.1
Investmentsinfinancialassets/acquisitions 0 0 -
Total investments 5 6 -16.1Employees 315 307 2.6
TheCropEnergiessegmentagainreportedrobustgrowthduringthefirstquarteroffiscal2012/13.Revenuesrose24%to€153(124)million,primarilyduetohigherbioethanolvolumes.
TheCropEnergiessegment’soperatingprofitreachedthesamehighlevelas lastyear,cominginat€15(15)million.Thenegativeimpactofhighercommoditypriceswasoffsetbyimprovedcapacityutilizationandtheassociatedvolumegrowth.
13Interim management reportBusiness performance
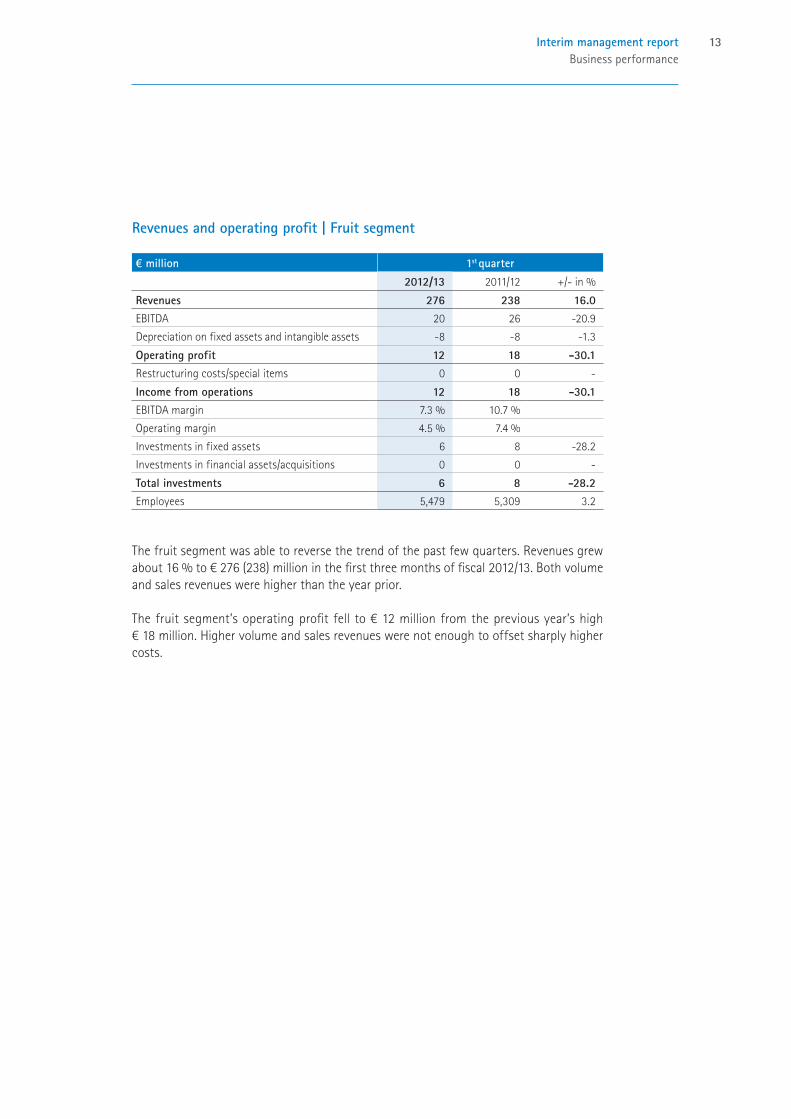
Revenues and operating profit | Fruit segment
€ million 1st quarter
2012/13 2011/12 +/-in%
Revenues 276 238 16.0EBITDA 20 26 -20.9
Depreciationonfixedassetsandintangibleassets -8 -8 -1.3
Operating profit 12 18 -30.1Restructuringcosts/specialitems 0 0 -
Income from operations 12 18 -30.1EBITDAmargin 7.3% 10.7%
Operatingmargin 4.5% 7.4%
Investmentsinfixedassets 6 8 -28.2
Investmentsinfinancialassets/acquisitions 0 0 -
Total investments 6 8 -28.2Employees 5,479 5,309 3.2
Thefruitsegmentwasabletoreversethetrendofthepastfewquarters.Revenuesgrewabout16%to€276(238)millioninthefirstthreemonthsoffiscal2012/13.Bothvolumeandsalesrevenueswerehigherthantheyearprior.
Thefruitsegment’soperatingprofitfell to€12millionfromthepreviousyear’shigh€18million.Highervolumeandsalesrevenueswerenotenoughtooffsetsharplyhighercosts.

14 Interim management reportBusiness performance
Income statement | Group
€ million 1st quarter
2012/13 2011/12 +/-in%
Revenues 1,887 1,639 15.1Operatingprofit 263 184 43.0
Resultfromrestructuringandspecialitems 0 0 -33.3
Income from operations 263 184 42.8Incomefromcompaniesconsolidatedatequity 1 1 -23.1
Financialresult -26 -20 30.0
Earnings before income taxes 238 165 44.1Taxesonincome 25 -35 -
Net earnings for the year 263 130 > 100ofwhichattributabletoSüdzuckerAGshareholders 220 91 >100
ofwhichattributabletohybridcapital 7 7 0.0
ofwhichattributabletominorityinterests 36 32 13.0
Earnings per share (€) 1.17 0.48 > 100
Income from operationsinthefirstthreemonthsoffiscal2012/13wasinlinewiththesubstantiallyhigheroperatingprofitthanayearearlierof€263(184)million.Therewerenospecialitemsorchargesagainstprofitsfromrestructuring.
Income from companies consolidated at equitywasaboutthesameaslastyearat€1(1)millionandincludesthecompany’sshareofearningsfromajoint-venturedistributor.
Thefinancial result deterioratedinthefirstthreemonthsoffiscal2012/13from€-20millionto€-26million.Despitehigheraveragedebt,netinterestexpenseimprovedsig-nificantly,goingfrom€-22millionto€-17million,becauseoflowershort-terminterestratesontherefinancingofthethe€500millionbondredeemedinFebruary2012andcommercialpaperstofinancetheMarch2012installmentsforbeets.Income/lossfromfinancingactivitieswentfrom€2millionto€-9million,mainlybecauseofunrealizednon-cashcurrencyexchangelossesrelatedtoeurofinancingoftheEasternEuropeansubsidiariesasthevalueofthePolishzlotyandRomanianleuslidfurther.
The tax resultfollowinghigherearnings before taxesof€238(165)millionwasposi-tiveandtotaled€25million(deferredtaxincome),whichcomparestotaxexpensesof€35millioninthefirstquarterof2011/12.Thepositivetaxbalanceinthefirstquarterof2012/13resultedfromthesuccessfulconclusionofalong-standingappealbeforethefinancialcourtsregardingtaxationissuessurroundingtheForeignTaxAct.One-timede-ferredtaxincomeinthisconnectiontotaled€76million;theassociatedcurrentincometaxexpenseis€51million.

15Interim management reportBusiness performance
Oftheconsolidated net earningsof€263(130)million,€220(91)millionwereallo-catedtoSüdzuckerAGshareholders,€7(7)milliontohybridbondholdersand€36(32)milliontoothernon-controllinginterests,mainlytheco-ownersofAGRANAGroupandCropEnergiesGroup.
Earnings per sharecameinat€1.17(0.48).Thecalculationisbasedonthetime-weightedaverageof188.8(189.3)millionsharesoutstanding.
Cash flow | Group
€ million 1st quarter
2012/13 2011/12 +/-in%
Cash flow 252 191 32.0
Increase (-) in working capital -430 -218 97.7
Investments in fixed assets Sugarsegment 30 23 33.8
Specialproductssegment 17 12 38.8
CropEnergiessegment 5 6 -16.1
Fruitsegment 6 8 -28.2
Total investments in fixed assets 58 49 19.4
Investments in financial assets/acquisitions 181 2 > 100
Dividends paid 0 0 -50.0
Theincreaseincash flow of€61millionto€252(191)millionwasdrivenbythegrowthinoperatingprofit.
Asexpected,theincreaseinworking capitalcausedcommittedcapitaltoriseto€430millionfrom€218milliontheyearprior.Theresultingincreasedfinancingrequirementscomparedtolastyearareattributabletothesignificantlyhigherfinal installmentsforbeetsforthe2011campaigninMarchandApril2012,drivenbyhigherpricesandvolumes.
Thegroup’sinvestments in fixed assets(includingintangibleassets)intheperiodfromMarch1toMay31,2012totaled€58(49)million.Investmentsof€30(23)millionbythesugarsegmentweremainlyforreplacements.Thespecialproductssegmentinvested€17(12)million;amongotherthings,ontheconstructionofawheatstarchsystematthePischelsdorffacilityinAustria.TheCropEnergiessegmentinvested€5(6)milliontofurtheroptimizeitsproductionsystems.Thefruitsegmentinvested€6(8)million,mainlyinthefruitpreparationsarea.
Investments in financial assetstotaling€181(2)millionwerefortheacquisitionofa25%stakeminusoneshareintheBritishtradingcompanyED&FManbasedinLondon.

16 Interim management reportBusiness performance
Balance sheet | Group
€ million 31.05.2012 31.05.2011 +/- in %
AssetsNon-currentassets 4,242 4,039 5.0
Currentassets 3,679 3,350 9.8
Total assets 7,921 7,389 7.2
Liabilities and shareholders’ equityShareholders’equity 4,166 3,810 9.3
Non-currentliabilities 1,876 1,764 6.4
Currentliabilities 1,879 1,815 3.5
Total liabilities and shareholders’ equity 7,921 7,389 7.2
Netfinancialdebt 1,223 932 31.3
Equityratio 53% 52%
Netfinancialdebtas%ofequity(Gearing) 29% 24%
Non-current assetsrose€203millionto€4,242(4,039)million,€181millionofwhichwasfortheacquisitionofaninterestinED&FMan,basedinLondon,England,andisre-portedundersharesofcompaniesconsolidatedatequity.
Theincreaseincurrent assetsof€329million,bringingthetotalto€3,679(3,350)mil-lion,islargelyduetothepriceandvolume-drivenincreaseof€425millionininventories,whichendedat€1,867(1,442)million,inadditiontothemainlyprice-drivenincreaseof€140millionintradereceivables,whichtotaled€922(782)million.Currenttaxreceiv-ablesof€77(28)millionincludeareimbursementrightof€59millionfrompre-paidtaxesfollowingthesuccessfulconclusionofalong-standingfinancialcourtappealregardingtaxationissuessurroundingtheForeignTaxAct.
Shareholders’ equity rose€356millionto€4,166(3,810)million;totalassetswerehigherthantheyearprior,aswastheequityratioatabout53(52)%.SüdzuckerAGheld600,000treasurysharesonMay31,2012.Thetotalacquisitioncostsof€12.8millionwerereportedundershareholderequity.
Non-current liabilities rose€112millionto€1,876(1,764)million.Thisisprimarilytheresultofhigherprovisionsforpensionsandsimilarobligationsduetovaluationadjust-ments.Thediscountratefordeterminingobligationsforpensionsandsimilarobligationswasadjustedto4.00%asofMay31,2012.ForMay31,2011,ithadbeensetat5.00%.Thediscountratehadtobecorrectedto4.50%asofthelastbalancesheetdate.Thevalu-ationadjustmentsareallocatedandrecognizeddirectlyinequitytakingintoconsiderationdeferredtaxes.
The€64millionincreaseincurrent liabilitiesto€1,879(1,815)millionistheresultofanincreaseincurrenttaxliabilities,whichrose€66millionto€108(42)million.

17Interim management reportBusiness performance
Net financial debtcameinat€1,223(932)millionasexpected,€291millionhigherthantheyearprior.TheincreaseresultedfromhigherworkingcapitalfinancingrequirementsandthecostofacquiringastakeinED&FMan.Theratioofnetfinancialdebttoequitythusincreasedfrom24%to29%.
Thestrongfinancialindicatorsarenowalsoreflectedinthecompany’srating.AttheendofJanuary2012,Moody’sratingagencyraisedSüdzucker’slong-termratingfrom“Baa2”to“Baa1”andonJune5,2012,Standard&Poor’sratingagencyupgradeditsratingofthecompanyfrom“BBB”to“BBB+”,alsowithastableoutlook.
Employees | Group
1st quarter
2012/13 2011/12 +/-in%
Sugarsegment 7,590 7,497 1.2
Specialproductssegment 4,445 4,350 2.2
CropEnergiessegment 315 307 2.6
Fruitsegment 5,479 5,309 3.2
Group 17,829 17,463 2.1
Theaveragenumberofpersonsemployedbythegroupinthefirstthreemonthsoffiscal2012/13roseto17,829(17,463).Thesugarsegmentadded93employees.Theincreaseof95employeesinthespecialproductsegmentwaspartlydrivenbytheconstructionofthenewwheatstarchproductionplantinPischelsdorf,Austria.The170workershiredbythefruitsegmentwereaddedtosatisfytheneedforseasonalworkersduringtheharvestingcampaign.
18 Interim management reportRisk management | Events after the balance sheet date
Risk management
Südzuckerusesanintegratedsystemfortheearlyidentificationandmonitoringofgroup-specificrisks.Successfulriskmanagementisbasedonachievinganappropriatebalancebetweenopportunitiesandrisks.Thecompany’sriskcultureischaracterizedbyrisk-awaremanagement,clearlyassignedresponsibilities,independenceinriskcontrollingandbytheimplementationofinternalcontrols.
Currentlytherearenorisksthatthreatentheorganization’scontinuedexistence,nordoweforeseeanysuchrisks.
Detailedinformationaboutthegroup’sriskmanagementsystemanditsopportunitiesandriskscanbefoundinthe2011/12annualreportundertheriskssectiononpages74–81.
Inviewofthecurrentconfidencecrisisinthecapitalmarkets,theoverallriskofreceiv-ablesdefault,productpricingandcurrencyfluctuationshasincreased.Theriskmanage-mentsystemiscontinuouslybeingenhancedtomitigatetheserisks.
Events after the balance sheet date June1,2012wastheclosingdateforthesigningofthejointventuredealcomprisingAGRANA Juice Holding GmbH, Gleisdorf, Austria, and Ybbstaler Fruit Austria GmbH,Kröllendorf,Austria.
ThenewlyfoundedjointventureYBBSTALERAGRANAJUICEGmbHisheadquarteredinKröllendorf,Austria,andhasfourteenproductionplantsinAustria,Denmark,Hungary,Poland,Romania,UkraineandChina.Thejointventure,whichgeneratesannualrevenuesofabout€350million,willbefullyconsolidatedbyAGRANAasofthesecondquarterof2012/13.ThetwomanufacturingcompaniesYbbstalerFruitAustriaGmbH,Kröllendorf,andYbbstalerFruitPolskasp.zoo,Chelm,Poland,havealsobeenfullyconsolidatedintotheAGRANAgroupasofthebeginningofthesecondquarter.
Themergerisexpectedtogeneratesynergiesandimproveaccesstointernationalmarkets,aswellascreateadditionalgrowthopportunities.
AGRANAInternationalVerwaltungs-undAsset-ManagementGmbH,Viennaholds50.01%ofthe jointventure’sparentcompany,YBBSTALERAGRANAJUICEGmbH,Kröllendorf,whileRWARaiffeisenWareAustria,Vienna,holds49.99%.
19Interim management reportOutlook
Outlook1
Infiscal2012/13wecontinuetoexpectallsegmentstogeneratehigherrevenuesandthusconsolidatedrevenuestoriseslightlytoover€7.0billion.
Wecontinuetoexpectconsolidatedoperatingprofittorisetoover€800million,mostofwhichwillcomefromthesugarsegment.Weexpectthespecialproductssegmenttore-peatlastyear’sstrongresultsandtheCropEnergiessegmenttobuildonlastyear’srecordprofits.Weexpectthefruitsegment’soperatingprofittoimprove.
Thisforecastcontinuestobebasedontheassumptionthateconomicconditionswillnotdeteriorateinspiteoftheeuroandstatedebtcrises.
Sugar segmentFiscal2012/13willbedominatedbyconcertedeffortstoselltheabove-averagesugarvolumefromthe2011harvest.Atthesametime,maintainingabalancebetweensupplyanddemandisofcrucialimportance.Aslongasworldmarketpricelevelsremainhigh,weexpectEuropeanpricesforquotasugartoremainstable.Ourforecastcallsforquotasugarvolumestobethesameaslastyearandnon-quotasugarvolumestoincrease.Overall,weexpectrevenuesandoperatingprofittoagainrisesubstantially.
Special products segmentWecontinuetoexpectthespecialproductssegment’srevenuestorisemoderately.Weexpectthestarchdivision’srevenuestodeclineslightly,andhigherrevenuesfromallotherdivisions.Weexpectoperatingprofittobeatthesamehighlevelastheyearprior.HerethemaincontributorswillbetheFreiberger,BENEOandPortionPackEuropedivisions.Volumegrowthisexpectedtoagainpartiallyoffsettheimpactofthehighercommoditycostswehavealreadyexperienced.Despitetheexcellentstartintothecurrentbusinessyear,weexpectthestarchdivision’soperatingprofittobelowerthantheunusuallyhighlevelitreachedlastyear.
CropEnergies segmentHigherbioethanolproductionandvolumesareexpectedtofurtherincreaserevenuesintheCropEnergiessegmentdespiteslightlylowersalesrevenues.Assuch,operatingprofitshouldbebackabove€50millionandthusclosetotherecordresultsreportedlastyear.
Fruit segmentWeexpectthefruitsegmenttogeneratehigherrevenuesforbothfruitpreparationsandfruit juiceconcentrates.Operatingprofitinthefirstquarterwashigherthaninprevi-ousquarters.Weexpectthispositivetrendtocontinuefortheremainderoftheyear,incontrasttothesignificantdeclineinoperatingprofitexperiencedlastyear.Wethereforeexpectoperatingprofitfortheyearoveralltobehigherthanattheendofthepriorfiscalyear.Theimprovementwillbedrivenbycontinuingrecoveryoflastyear’sweakvolumedevelopmentforfruitpreparations.
1TheforecastforconsolidatedgrouprevenuesandconsolidatedgroupoperatingprofitincludedinthisreportcorrespondtotheconfirmedforecastdatedJune25,2012.
20 Interim financial statementsConsolidated statement of comprehensive income
€ million 1st quarter
2012/13 2011/12 +/-in%
Income statement
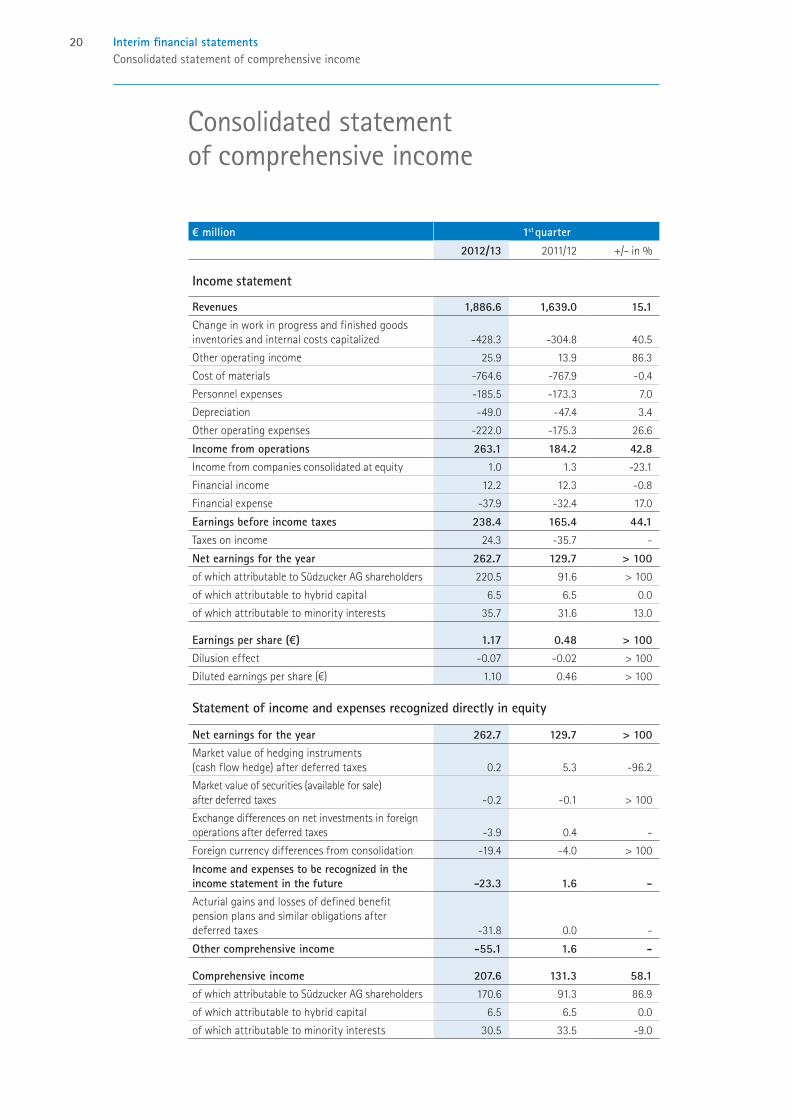
Revenues 1,886.6 1,639.0 15.1Changeinworkinprogressandfinishedgoodsinventoriesandinternalcostscapitalized -428.3 -304.8 40.5
Otheroperatingincome 25.9 13.9 86.3
Costofmaterials -764.6 -767.9 -0.4
Personnelexpenses -185.5 -173.3 7.0
Depreciation -49.0 -47.4 3.4
Otheroperatingexpenses -222.0 -175.3 26.6
Income from operations 263.1 184.2 42.8Incomefromcompaniesconsolidatedatequity 1.0 1.3 -23.1
Financialincome 12.2 12.3 -0.8
Financialexpense -37.9 -32.4 17.0
Earnings before income taxes 238.4 165.4 44.1Taxesonincome 24.3 -35.7 -
Net earnings for the year 262.7 129.7 > 100ofwhichattributabletoSüdzuckerAGshareholders 220.5 91.6 >100
ofwhichattributabletohybridcapital 6.5 6.5 0.0
ofwhichattributabletominorityinterests 35.7 31.6 13.0
Earnings per share (€) 1.17 0.48 > 100Dilusioneffect -0.07 -0.02 >100
Dilutedearningspershare(€) 1.10 0.46 >100
Statement of income and expenses recognized directly in equity Net earnings for the year 262.7 129.7 > 100Marketvalueofhedginginstruments(cashflowhedge)afterdeferredtaxes 0.2 5.3 -96.2
Marketvalueofsecurities(availableforsale)afterdeferredtaxes -0.2 -0.1 >100
Exchangedifferencesonnetinvestmentsinforeignoperationsafterdeferredtaxes -3.9 0.4 -
Foreigncurrencydifferencesfromconsolidation -19.4 -4.0 >100
Income and expenses to be recognized in the income statement in the future -23.3 1.6 -Acturialgainsandlossesofdefinedbenefitpensionplansandsimilarobligationsafterdeferredtaxes -31.8 0.0 -
Other comprehensive income -55.1 1.6 -
Comprehensive income 207.6 131.3 58.1ofwhichattributabletoSüdzuckerAGshareholders 170.6 91.3 86.9
ofwhichattributabletohybridcapital 6.5 6.5 0.0
ofwhichattributabletominorityinterests 30.5 33.5 -9.0
Consolidated statement of comprehensive income

21Interim financial statementsConsolidated cash flow statement
€ million 1st quarter
2012/13 2011/12 +/-in%
Netearningsfortheyear 262.7 129.7 >100
Depreciationandamortizationofintangibleassets,fixedassetsandotherinvestments 49.0 47.5 3.2
Decrease(-)/Increase(+)innon-currentprovisionsanddeferredtaxliabilitiesandincrease(-)/decrease(+)indeferredtaxassets -6.0 14.3 -
Otherincome(-)/expenses(+)notaffectingcash -53.9 -0.8 >100
Cash flow 251.8 190.7 32.0Gain(-)/Loss(+)ondisposalofitemsincludedinnon-currentassetsandofsecurities -1.6 -0.7 >100
Decrease(-)/Increase(+)incurrentprovisions -20.8 -17.6 18.2
Decrease(-)/Increase(+)ininventories,receivablesandothercurrentassets 366.5 168.0 >100
Decrease(-)/Increase(+)inliabilities(excludingfinancialliabilities) -776.1 -368.1 >100
Decrease (-)/Increase (+) in working capital -430.4 -217.7 97.7
I. Net cash flow from operating activities -180.2 -27.7 > 100Investmentsinfixedassetsandintangibleassets -58.4 -48.9 19.4
Investmentsinfinancialassets -180.5 -2.1 >100
Investments -238.9 -51.0 > 100Cashreceivedondisposalofnon-currentassets 2.6 3.3 -21.2
Cashpaid(-)/received(+)forthepurchase/saleofsecurities 69.2 -11.8 -
II. Cash flow from investing activities -167.1 -59.5 > 100
Capitaldecrease(-)/increase(+) -4.4 -1.7 >100
Dividendspaid -0.1 -0.2 -50.0
Repaiment(-)/Refund(+)offinancialliabilities 204.3 376.4 -45.7
III. Cash flow from financing activities 199.8 374.5 -46.6
IV. Change in cash and cash equivalents (total of I., II. und III.) -147.5 287.3 -Changeincashandcashequivalents duetoexchangeratechanges -47.0 0.1 -
duetochangesinentitiesincludedinconsolidation 0.0 0.0 -
Decrease (-)/Increase (+) in cash and cash equivalents -194.5 287.4 -Cashandcashequivalentsatthebeginningoftheperiod 537.4 250.0 >100
Cash and cash equivalents at the end of the period 342.9 537.4 -36.2
€ million 1st quarter
2012/13 2011/12 +/-in%
Dividendsreceivedfromcompaniesconsolidatedatequityandotherinvestments 0.9 0.4 >100
Interestreceipts 10.5 11.5 -8.7
Interestpayments -24.6 -18.8 30.9
Incometaxespaid -23.7 -22.4 5.8
Consolidated cash flow statement

22 Interim financial statementsConsolidated balance sheet
€ million 31.05.2012 31.05.2011 +/- in % 29.02.2012 +/- in %
AssetsIntangibleassets 1,188.7 1,185.8 0.2 1,191.6 -0.2
Fixedassets 2,557.4 2,554.3 0.1 2,554.1 0.1
Sharesincompaniesconsolidatedatequity 193.9 12.4 >100 12.3 >100
Otherinvestments 33.7 32.8 2.7 33.7 0.0
Securities 105.1 105.6 -0.5 105.1 0.0
Otherassets 34.6 28.5 21.4 9.0 >100
Deferredtaxassets 128.7 119.5 7.7 130.7 -1.5
Non-current assets 4,242.1 4,038.9 5.0 4,036.5 5.1Inventories 1,866.9 1,441.7 29.5 2,323.7 -19.7
Tradereceivables 921.9 781.5 18.0 805.8 14.4
Otherassets 428.5 398.8 7.4 496.8 -13.7
Currenttaxreceivables 77.4 28.3 >100 16.2 >100
Securities 41.2 162.6 -74.7 108.1 -61.9
Cashandcashequivalents 342.9 537.4 -36.2 501.5 -31.6
Current assets 3,678.8 3,350.3 9.8 4,252.1 -13.5
Total assets 7,920.9 7,389.2 7.2 8,288.6 -4.4
Liabilities and shareholders’ equityIssuedsubscribedcapital 189.4 189.4 0.0 189.4 0.0
Nominalvalueownshares -0.6 -0.1 >100 -0.4 50.0
Outstanding subscibed capital 188.8 189.3 -0.3 189.0 -0.1
Capitalreserves 1,189.3 1,189.3 0.0 1,189.3 0.0
Revenuereserves 1,404.2 1,122.8 25.1 1,237.9 13.4
Equity attributable to shareholders of Südzucker AG 2,782.3 2,501.4 11.2 2,616.2 6.3
Hybridcapital 683.9 683.9 0.0 683.9 0.0
Otherminorityinterests 699.7 624.7 12.0 669.1 4.6
Shareholders’ equity 4,165.9 3,810.0 9.3 3,969.2 5.0Provisionsforpensionsandsimilarobligations 593.9 479.3 23.9 546.1 8.8
Otherprovisions 155.2 167.6 -7.4 173.6 -10.6
Non-currentfinancialliabilities 980.4 941.9 4.1 931.4 5.3
Otherliabilities 13.1 14.0 -6.4 13.1 0.0
Deferredtaxliabilities 133.2 160.7 -17.1 140.5 -5.2
Non-current liabilities 1,875.8 1,763.5 6.4 1,804.7 3.9Otherprovisions 162.6 170.4 -4.6 183.6 -11.4
Currentfinancialliabilities 732.2 795.2 -7.9 574.0 27.6
Tradepayablesandotherliabilities 456.5 414.8 10.1 1,234.4 -63.0
Otherliabilities 419.4 392.9 6.7 437.8 -4.2
Currenttaxliabilities 108.5 42.4 >100 84.9 27.8
Current liabilities 1,879.2 1,815.7 3.5 2,514.7 -25.3
Total liabilities and shareholders’ equity 7,920.9 7,389.2 7.2 8,288.6 -4.4
Netfinancialdebt 1,223.4 931.5 31.3 790.7 54.7
Equityratio 52.6% 51.6% 47.9%
Netfinancialdebtas%ofequity(Gearing) 29.4% 24.4% 19.9%
Consolidated balance sheet1

23Consolidated statement of changes in shareholders’ equity
Interim financial statements
€ million
Issued subscribed
capital
Nominal valueown
sharesCapital
reservesRevenue reserves
Equity of Südzucker
share-holders
Hybrid capital
Other minority interests
Total share-
holders’ equity
March 1, 2011 189.4 0.0 1,189.3 1,033.6 2,412.3 683.9 590.5 3,686.7Marketvaluationsandexchangedifferencesonnetinvestments 3.5 3.5 0.0 2.1 5.6
Acturialgainsandlossesofdefinedbenefitpensionplansandsimilarobligationsafterdeferredtaxes 0.0 0.0 0.0 0.0 0.0
Foreigncurrencytransalationdifferencesfromconsolidation -3.8 -3.8 0.0 -0.2 -4.0
Income and expenses directly recognized in equity -0.3 -0.3 0.0 1.9 1.6
Netearnings 91.6 91.6 6.5 31.6 129.7
Comprehensive income 91.3 91.3 6.5 33.5 131.3Distributions 0.0 0.0 -6.5 -0.2 -6.7
Capitalincrease/decrease 0.0 0.0 0.0 0.0 0.0 0.0 0.0
Ownshares 0.0 -0.1 0.0 -1.6 -1.7 -1.7
Otherchanges -0.5 -0.5 0.0 0.9 0.4
May 31, 2011 189.4 -0.1 1,189.3 1,122.8 2,501.4 683.9 624.7 3,810.0
March 1, 2012 189.4 -0.4 1,189.3 1,237.9 2,616.2 683.9 669.1 3,969.2Marketvaluationsandexchangedifferencesonnetinvestments -5.6 -5.6 0.0 1.7 -3.9
Acturialgainsandlossesofdefinedbenefitpensionplansandsimilarob-ligationsafterdeferredtaxes -30.3 -30.3 0.0 -1.5 -31.8
Foreigncurrencytransalationdifferencesfromconsolidation -14.0 -14.0 0.0 -5.4 -19.4
Income and expenses directly recognized in equity -49.9 -49.9 0.0 -5.2 -55.1Netearnings 220.5 220.5 6.5 35.7 262.7
Comprehensive income 170.6 170.6 6.5 30.5 207.6Distributions 0.0 0.0 -6.5 -0.1 -6.6
Capitalincrease/decrease 0.0 0.0 0.0 0.0 0.0 0.0 0.0
Ownshares 0.0 -0.2 0.0 -4.2 -4.4 -4.4
Otherchanges -0.1 -0.1 0.0 0.2 0.1
May 31, 2012 189.4 -0.6 1,189.3 1,404.2 2,782.3 683.9 699.7 4,165.9
1Theprioryear’snumbershavebeenadjustedinaccordancewithIAS8;furtherdisclosuresareincludedinnote(1)ofthenotestotheconsolidatedfinancialstatements.
Consolidated statement of changes in shareholders’ equity1

24Development in income and expenses recognized directly in group equity Interim financial statements | Notes to the interim financial statements
€ million
Market value of hedging
instruments (cash flow
hedge)
Market value of
securities (available for sale)
Exchange differences
on net investments
in foreign operations
Market valuations
and exchange
differences on net
investments
Accumu-lated
exchange differences
Actuarial gains and
losses
Income and expenses
recognized directly in
equity
March 1, 2011 9.7 7.4 -7.6 9.5 -3.0 -62.3 -55.8Changesrecognizedinequity 22.2 -0.1 0.5 22.6 -4.0 0.0 18.6
Changesrecognizedinprofitorloss -14.3 -14.3 -14.3
Deferredtaxes -2.6 0.0 -0.1 -2.7 0.0 -2.7
May 31, 2011 15.0 7.3 -7.2 15.1 -7.0 -62.3 -54.2
March 1, 2012 -0.3 4.2 -10.3 -6.4 -13.3 -107.8 -127.5Changesrecognizedinequity 23.5 -0.2 -4.9 18.4 -19.4 -44.7 -45.7
Changesrecognizedinprofitorloss -22.2 -22.2 -22.2
Deferredtaxes -1.1 0.0 1.0 -0.1 12.9 12.8
May 31, 2012 -0.1 4.0 -14.2 -10.3 -32.7 -139.6 -182.6
1Theprioryear’snumbershavebeenadjustedinaccordancewithIAS8;furtherdisclosuresareincludedinnote(1)ofthenotestotheconsolidatedfinancialstatements.
Notes to the interim financial statements
Segment report | Group
€ million 1st quarter
2012/13 2011/12 +/-in%
Südzucker GroupGross revenues 1,969.8 1,703.8 15.6Consolidation -83.2 -64.8 28.4
Revenues 1,886.6 1,639.0 15.1
EBITDA 311.9 231.3 34.8EBITDAmargin 16.5% 14.1%
Depreciation -49.0 -47.4 3.4
Operating profit 262.9 183.9 43.0Operatingmargin 13.9% 11.2%
Resultfromrestructuringandspecialitems 0.2 0.3 -33.3
Income from operations 263.1 184.2 42.8Investmentsinfixedassets 58.4 48.9 19.4
Investmentsinfinancialassets/acquisitions 180.5 2.1 >100
Total investments 238.9 51.0 > 100
Capital employed 6,094.5 5,532.7 10.2Averagenumberofemployees 17,829 17,463 2.1
Development in income and expenses recognized directly in group equity1
25 Notes to the interim financial statements
Segment report | Sugar, Special products
€ million 1st quarter
2012/13 2011/12 +/-in%
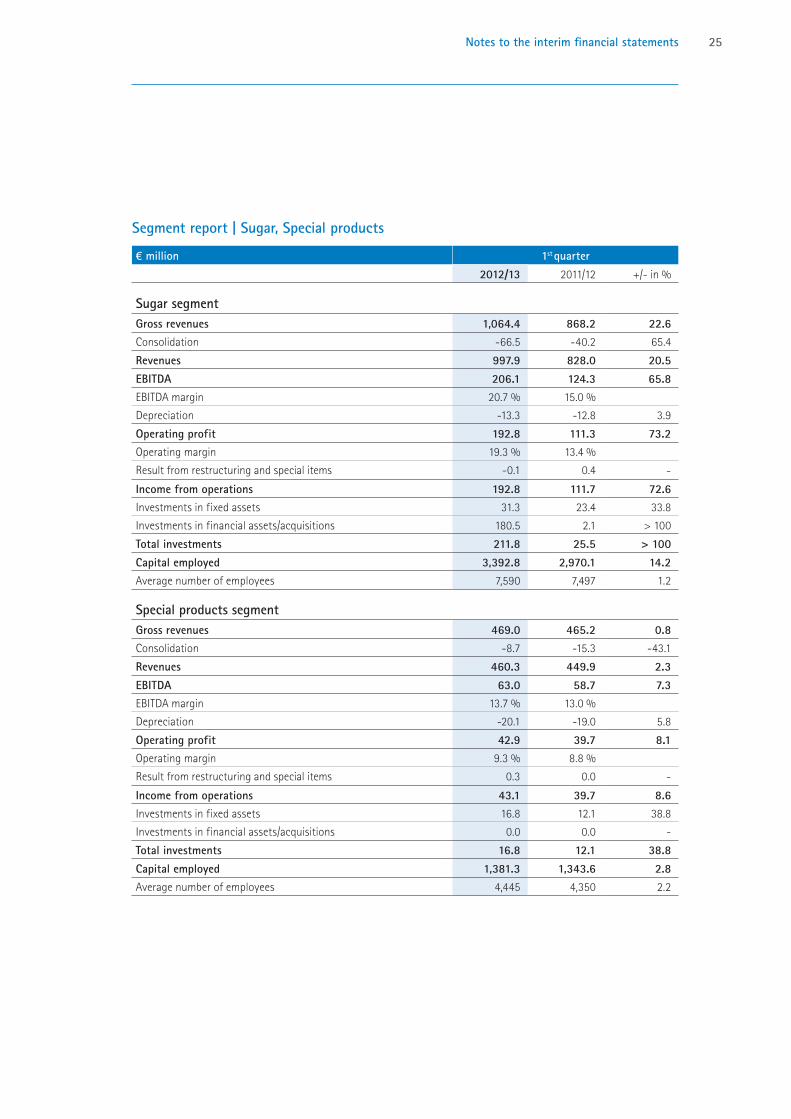
Sugar segment Gross revenues 1,064.4 868.2 22.6Consolidation -66.5 -40.2 65.4
Revenues 997.9 828.0 20.5
EBITDA 206.1 124.3 65.8EBITDAmargin 20.7% 15.0%
Depreciation -13.3 -12.8 3.9
Operating profit 192.8 111.3 73.2Operatingmargin 19.3% 13.4%
Resultfromrestructuringandspecialitems -0.1 0.4 -
Income from operations 192.8 111.7 72.6Investmentsinfixedassets 31.3 23.4 33.8
Investmentsinfinancialassets/acquisitions 180.5 2.1 >100
Total investments 211.8 25.5 > 100
Capital employed 3,392.8 2,970.1 14.2Averagenumberofemployees 7,590 7,497 1.2
Special products segment Gross revenues 469.0 465.2 0.8Consolidation -8.7 -15.3 -43.1
Revenues 460.3 449.9 2.3
EBITDA 63.0 58.7 7.3EBITDAmargin 13.7% 13.0%
Depreciation -20.1 -19.0 5.8
Operating profit 42.9 39.7 8.1Operatingmargin 9.3% 8.8%
Resultfromrestructuringandspecialitems 0.3 0.0 -
Income from operations 43.1 39.7 8.6Investmentsinfixedassets 16.8 12.1 38.8
Investmentsinfinancialassets/acquisitions 0.0 0.0 -
Total investments 16.8 12.1 38.8
Capital employed 1,381.3 1,343.6 2.8Averagenumberofemployees 4,445 4,350 2.2
26 Notes to the interim financial statements
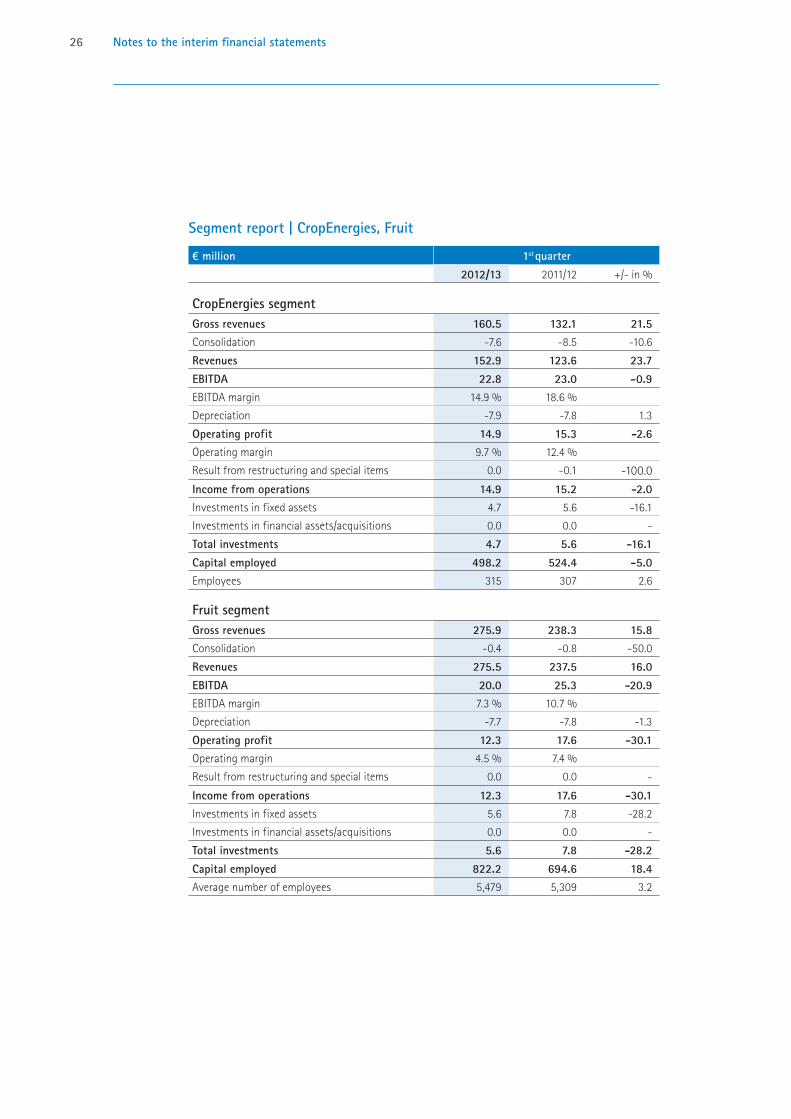
Segment report | CropEnergies, Fruit
€ million 1st quarter
2012/13 2011/12 +/-in%
CropEnergies segment Gross revenues 160.5 132.1 21.5Consolidation -7.6 -8.5 -10.6
Revenues 152.9 123.6 23.7
EBITDA 22.8 23.0 -0.9EBITDAmargin 14.9% 18.6%
Depreciation -7.9 -7.8 1.3
Operating profit 14.9 15.3 -2.6Operatingmargin 9.7% 12.4%
Resultfromrestructuringandspecialitems 0.0 -0.1 -100.0
Income from operations 14.9 15.2 -2.0Investmentsinfixedassets 4.7 5.6 -16.1
Investmentsinfinancialassets/acquisitions 0.0 0.0 -
Total investments 4.7 5.6 -16.1
Capital employed 498.2 524.4 -5.0Employees 315 307 2.6
Fruit segment Gross revenues 275.9 238.3 15.8Consolidation -0.4 -0.8 -50.0
Revenues 275.5 237.5 16.0
EBITDA 20.0 25.3 -20.9EBITDAmargin 7.3% 10.7%
Depreciation -7.7 -7.8 -1.3
Operating profit 12.3 17.6 -30.1Operatingmargin 4.5% 7.4%
Resultfromrestructuringandspecialitems 0.0 0.0 -
Income from operations 12.3 17.6 -30.1Investmentsinfixedassets 5.6 7.8 -28.2
Investmentsinfinancialassets/acquisitions 0.0 0.0 -
Total investments 5.6 7.8 -28.2
Capital employed 822.2 694.6 18.4Averagenumberofemployees 5,479 5,309 3.2
27Notes to the interim financial statements
(1) Principles of preparation of the interim consolidated financial statements
SüdzuckerGroup’sinterimfinancialstatementsasofMay31,2012werepreparedinaccor-dancewiththerulesoninterimfinancialreportingpursuanttoIAS34(InterimFinancialReporting), inconformancewiththeInternationalFinancialReportingStandards(IFRS)publishedbytheInternationalAccountingStandardsBoard(IASB).SüdzuckerAG’sgroupfinancialstatementdatedMay31,2012hasbeencondensedasperIAS34.SüdzuckerAG’sboardofdirectorsreleasedthisinterimreportforpublicationonJuly9,2012.
Thestandardsandinterpretationsthatcameintoeffectforthefirsttimeinthe2012/13fi-nancialyearwereappliedforthefirsttimeinpreparingtheseinterimfinancialstatements.Theamendedstandardhadnoimpactonthefinancialstatementsortheasset,financialandearningspositionofthegroup.Theprovisionsforpensionsandsimilarobligationswerediscountedby4.00%insteadofthe4.50%appliedasofFebruary29,2012.Thepreviousyear,thediscountrateonFebruary28,2011andMay31,2011was5.00%.Thesameaccountingandvaluationmethodsasthoseusedtopreparethegroupannualfi-nancialstatementsdatedFebruary29,2012wereappliedfortheremainderofthisinterimreport.Therelevantexplanatorynotesunderitem(5),pages104to110ofthe2011/12annualreportthusalsoapplyhere.Inordertoimprovecomparabilityofthereportingofpensionsandsimilarobligations,Südzuckerdecidedinthefourthquarteroffiscal2011/12torecognizeallactuarialgainsandlossesintheperiodinwhichtheyoccur.Thedisclosurefortheproratedprioryear’speriodwasadjustedaccordingly.Furtherdetailscanbefoundinthenotestothe2011/12annualreportunderitems(1)and(27).
Incometaxeswerecalculatedonthebasisoflocalcorporateincometaxratesincon-siderationoftheincometaxforecastfortheentirebusinessyear.Materialspecialitemsarefullyrecognizedneglectingthedeterminationoftheannualtaxrateintherespectivequarter.
SugarisprimarilyproducedfromSeptembertoDecember.Thisiswhydepreciationonsys-temsusedforthecampaignisprimarilyappliedtothethirdquarterresults.Thematerial,personnelandotheroperatingexpensesincurredpriortothesugarcampaigntoprepareforproductionareitemizedoverthecourseofthefiscalyearandcapitalizedasworkinprogressviachangesininventories.
SüdzuckerGroup’sannualreportfor2011/12canbeviewedordownloadedatwww.suedzucker.de/de/Investor-Relations/and/orwww.suedzucker.de/en/Investor-Relations/.
(2) Companies included in consolidation
Asoftheendofthefirstquarterof2012/13,thescopeofconsolidationincluded155companiesinadditiontoSüdzuckerAG(endoffiscal2011/12:156companies).Thede-consolidatedcom-panywasmerged.Proportionateconsolidationwasappliedtoeight(eight)companiesandtheequitymethodcontinuestobeappliedtotwo(one)companies.

28 Notes to the interim financial statements
Theincreaseforcompaniesconsolidatedatequityrelatestothe25%minusonesharestakeinBritishtradingcompanyED&FManHoldingsLtd.,London.ThecostofthisacquisitionwasUSD255millionandisreportedinitsentirety,includingincidentalacquisitioncosts,underthebal-ancesheetitem“Sharesofcompaniesconsolidatedatequity”.TheEuropeanCommissiongaveSüdzuckerapprovalforproceedingwiththeacquisitiononMay16,2012.Asaresult,thedealdidnotcloseuntiltheendofthefirstquarter.TheCommission’sinvestigationdeterminedthatinmostEuropeanmarketsthemergerwillhavenoadverseimpactoncompetition.ToalleviatepossibleconcernsinItaly,SüdzuckerandED&FManhavedeclaredthemselvespreparedtoacceptthatED&FManwillgiveupitsinterestinasugarrefineryinItaly.ED&FMan’sfiscalyearisnotthesameasSüdzucker’sandendsonSeptember30.ED&FManresultsproratedtoreflectSüd-zucker’sinterestinthecompanyanddatingbacktwomonthswillbeincorporatedonSüdzucker’skeyclosingdates.Materialeventsbetweenthesekeydateswillbeadjusted.
(3) Earnings per share
ThecalculationofearningspershareaccordingtoIAS33fromMarch1toMay31,2012wasbasedonatime-weightedaverageof188.8millionsharesoutstanding.Earningspersharecameinat€1.17.NoholdersoftheconvertiblebondissuedonJune30,2009exer-cisedconversionrightsduringthereportingperiod.Assumingtotalconversiontoshares,thedilutedearningspersharewere€1.10pershare.Thecalculationisbasedonthetheo-reticalconversionof15millionsharesoratotalof203.8millionshares.
(4) Inventories
€ million May 31 2012 2011Rawmaterialsandsupplies 406.0 381.2
Workinprogressandfinishedgoods
Sugarsegment 1,018.6 718.9
Specialproductssegment 191.7 166.0
CropEnergiessegment 30.0 24.8
Fruitsegment 107.2 67.7
Totalofworkinprogressandfinishedgoods 1,347.5 977.4
Merchandise 113.4 83.1
1,866.9 1,441.7
Inventorieswere significantlyhigher than theyearpriorat€1,866.9 (1,441.7)million,mainlyduetotheriseincommoditycosts,butalsotohigherstocks.Thesignificantriseinfinishedandunfinishedgoodsinthesugarsegmentcomparedtotheyearpriorisduetohigherbeetpricesandhighervolumeofsugarproducedduringthe2011campaign.Theincreaseinmerchandisefrom€83.1millionto€113.4millionismainlyattributabletothesugarsegmentandreflectstheincreasedtradingactivities.

29Notes to the interim financial statements
(5) Trade receivables and other assets
Remaining term Remaining term
€ million May 31 2012 to 1 year over 1 year 2011 to 1 year over 1 year
Trade receivables 921.9 921.9 0.0 781.5 781.5 0.0ReceivablesduefromtheEUfromexportrecoveries 5.3 5.3 0.0 9.3 9.3 0.0
Othertaxesrecoverable 114.4 114.4 0.0 83.4 83.4 0.0
Positivemarketvaluederivatives 24.4 24.4 0.0 40.2 40.2 0.0
Otherfinancialassets 234.0 199.6 34.4 188.9 174.0 14.9
Othernon-financialassets 85.0 84.8 0.2 105.5 91.9 13.6
Other assets 463.1 428.5 34.6 427.3 398.8 28.5
Tradereceivablesrose€140.4millionto€921.9(781.5)million,duetohighersalesrevenuesinthesugarsegmentdespitelowerpricerealizationtargets.
Theincreaseinotherfinancialassetsto€234.0(188.9)millionrelatesmainlytohigherreceivablesfromsugardeliveriestotheItaliansugardistributorMaxiS.r.L.,Bozen,whichisconsolidatedatequity.
(6) Trade payables and other liabilities
Remaining term Remaining term
€ million May 31 2012 to 1 year over 1 year 2011 to 1 year over 1 year
Liabilitiestobeetgrowers 91.2 91.2 0.0 29.4 29.4 0.0
Liabilitiestoothertradetradepayables 365.3 365.3 0.0 385.4 385.4 0.0
Trade payables 456.5 456.5 0.0 414.8 414.8 0.0
Liabiliitiesforproductionlevy 0.9 0.9 0.0 0.0 0.0 0.0
Liabilitiesforpersonnelexpenses 120.3 119.7 0.6 103.3 102.8 0.5
Liabilitiesforothertaxesandsocialsecuritycontributions 60.5 60.5 0.0 55.8 55.8 0.0
Negativemarketvaluederivatives 35.5 35.5 0.0 15.3 15.3 0.0
Otherliabilities 207.3 194.8 12.5 228.0 214.5 13.5
On-accountpaymentsreceivedonorders 8.0 8.0 0.0 4.5 4.5 0.0
Other liabilities 432.5 419.4 13.1 406.9 392.9 14.0
LiabilitiestobeetfarmersonFebruary29,2012totaled€794.6million.Ofthistotal,€703.4millionwaspaidoffinthefirstquarterof2012/13.ThefinalinstallmentsforthesugarcampaignpaidoutinMarchandApril2012werethusabout€360millionhigherthanlastyear.Theoutstandingliabilitiesof€91.2millionasofMay31,2012areforthefinalinstallmentsforbeetsinFranceandBelgium.
30 Notes to the interim financial statements
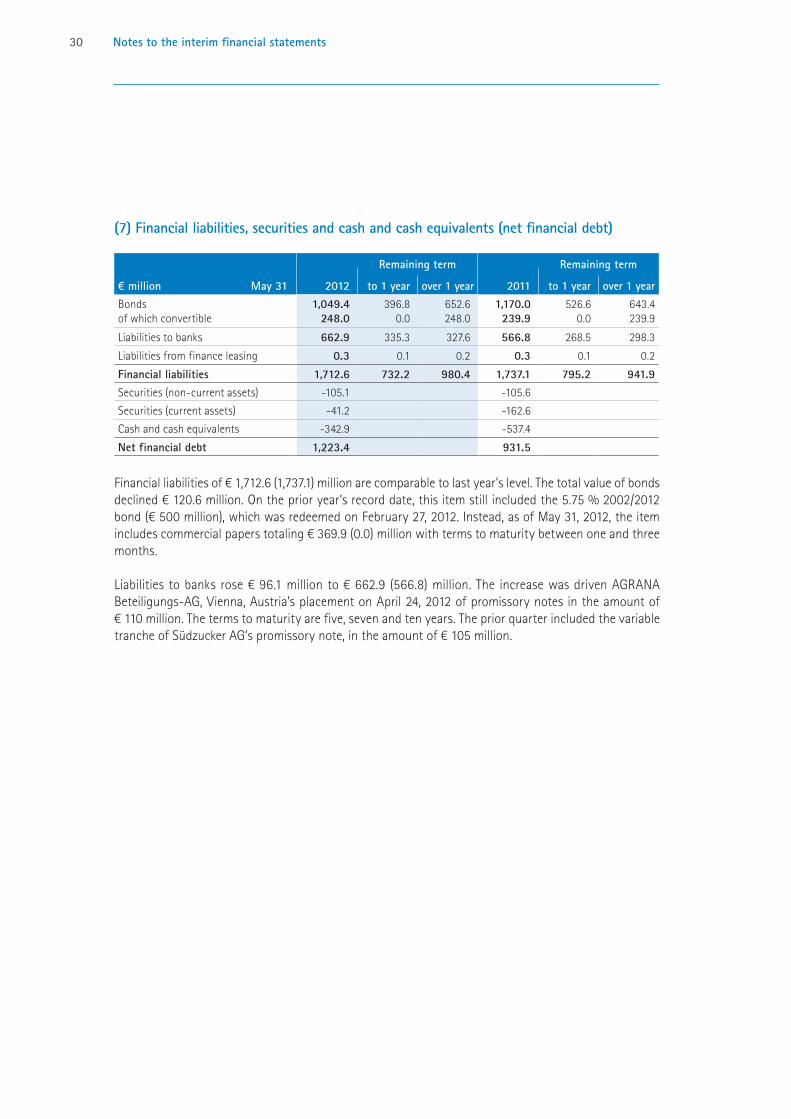
(7) Financial liabilities, securities and cash and cash equivalents (net financial debt)
Remaining term Remaining term
€ million May 31 2012 to 1 year over 1 year 2011 to 1 year over 1 yearBonds 1,049.4 396.8 652.6 1,170.0 526.6 643.4ofwhichconvertible 248.0 0.0 248.0 239.9 0.0 239.9
Liabilitiestobanks 662.9 335.3 327.6 566.8 268.5 298.3
Liabilitiesfromfinanceleasing 0.3 0.1 0.2 0.3 0.1 0.2
Financial liabilities 1,712.6 732.2 980.4 1,737.1 795.2 941.9Securities(non-currentassets) -105.1 -105.6
Securities(currentassets) -41.2 -162.6
Cashandcashequivalents -342.9 -537.4
Net financial debt 1,223.4 931.5
Financialliabilitiesof€1,712.6(1,737.1)millionarecomparabletolastyear’slevel.Thetotalvalueofbondsdeclined€120.6million.Ontheprioryear’srecorddate,thisitemstillincludedthe5.75%2002/2012bond(€500million),whichwasredeemedonFebruary27,2012.Instead,asofMay31,2012,theitemincludescommercialpaperstotaling€369.9(0.0)millionwithtermstomaturitybetweenoneandthreemonths.
Liabilities tobanksrose€96.1millionto€662.9 (566.8)million.The increasewasdrivenAGRANABeteiligungs-AG,Vienna,Austria’splacementonApril24,2012ofpromissorynotesintheamountof€110million.Thetermstomaturityarefive,sevenandtenyears.ThepriorquarterincludedthevariabletrancheofSüdzuckerAG’spromissorynote,intheamountof€105million.
(8) Related parties
The related parties described in the 2011/12 annual report under item (37) in the notes remain unchanged.
(9) Events after the interim reporting period
For information on events after May 31, 2012, please refer to the supplementary report in the interim management report. Mannheim, July 9, 2012Südzucker Aktiengesellschaft Mannheim/OchsenfurtThe executive board
Dr. Heer Dr. Kirchberg Kölbl Prof. Dr. Kunz Marihart
Forward looking statements/forecasts
This interim report contains forward looking statements based on assumptions and es-timates made by the executive board of Südzucker AG. Although the executive board may be convinced that these assumptions and estimates are reasonable the future ac-tual developments and future actual results may vary considerably from the assump-tions and estimates due to many external and internal factors. For example, matters to be mentioned in this connection include negotiations relating to the world trade agreement (WTA), changes to the overall economic situation, changes to EU sugar policies, consumer behavior and state food and energy policies. Südzucker AG assumes no responsibility and accepts no liability for future developments and future actual results achieved being the same as the assumptions and estimates included in this interim report.
Forward looking statements/forecasts31Notes to interim financial statements

südzucker ag
Contacts
Investor RelationsNikolai [email protected]: +49 621 421-240Fax: +49 621 421-321
Financial press Dr. Dominik [email protected]: +49 621 421-428Fax: +49 621 421-425
Südzucker on the Internet
For more information about Südzucker Group please go to our website: www.suedzucker.de
Published by
Südzucker AktiengesellschaftMannheim/OchsenfurtTheodor-Heuss-Anlage 1268165 Mannheim, GermanyPhone: +49 621 421-0
© 2012