Embed Size (px)
Citation preview

IN-SITU CHEMICAL OXIDATION PILOT STUDY WORK PLAN
Alcas Cutlery Corporation Facility Olean, New York
Prepared by: CDM Smith Inc. 555 17th Street, Suite 1100 Denver, Colorado 80202 Prepared for:
ALCOA INC. 2300 North Wright Rd. Alcoa TN, 37701
Attn: Mr. Robert Prezbindowski
March 2012
i
Contents Section 1 Introduction ....................................................................................... 1-1
1.1 Background ......................................................................................................................... 1-1 1.2 Objectives ............................................................................................................................ 1-2 1.3 Technology Description ................................................................................................. 1-2
1.3.1 ISCO with Persulfate ............................................................................................................. 1-2 1.3.2 Summary of Bench-Scale Testing .................................................................................... 1-2
Section 2 Data Needs for the Pilot Test............................................................... 2-1 2.1 Problem Statement .......................................................................................................... 2-1 2.2 Decision Questions ........................................................................................................... 2-1 2.3 Inputs to the Decision ..................................................................................................... 2-1 2.4 Boundaries of the Study ................................................................................................. 2-2 2.5 Decision Rules .................................................................................................................... 2-2 2.6 Limits on Decision Errors .............................................................................................. 2-3
Section 3 Activated Persulfate Pilot Test ............................................................ 3-1 3.1 Pilot Test Design and Implementation ..................................................................... 3-1
3.1.1 Equipment Mobilization ..................................................................................................... 3-2 3.1.2 Monitoring Well Installation ............................................................................................ 3-2 3.1.3 Activated Persulfate Injection .......................................................................................... 3-2 3.1.4 Groundwater Monitoring ................................................................................................... 3-3
3.2 Assessment of ISCO Performance ............................................................................... 3-6 3.2.1 Oxidant Distribution ............................................................................................................. 3-7 3.2.2 VOC Destruction ..................................................................................................................... 3-7
3.3 Evaluation of Full –Scale Operational Requirements .......................................... 3-7
Section 4 Investigation Derived Waste ............................................................... 4-1
Section 5 Bench and Pilot Test Report ................................................................ 5-1
Section 6 References .......................................................................................... 6-1

Contents
ii
Figures 1-1 Alcas Facility Layout 3-1 Field Pilot Test Layout 3-2 Pilot Test Schedule Tables 2-1 Analytical Methods for ISCO Pilot Test 3-1 Available Monitoring Locations for Pilot Test 3-2 Monitoring Frequency Within Pilot Test Area 3-3 Sampling Requirements for ISCO Pilot Test 3-4 ISCO Performance Assessment
Appendices Appendix A SOP’s Appendix B Upper Water-Bearing Zone Contour Map Appendix C Monitoring Well VOC Data and Trends

iii
Acronyms bls below land surface cm/sec centimeter per second CDM Smith CDM Smith Inc. COC contaminant of concern DCE dichloroethene DNAPL dense non-aqueous phase liquid DO dissolved oxygen DQOs data quality objectives EPA Environmental Protection Agency FFS focused feasibility study ft feet gal gallons GC/FID gas chromatographic-flame ionization detector method HDPE high-density polyethylene IDW investigation derived waste ISCO in situ chemical oxidation ISCR in situ chemical reduction L liter lbs pounds mg/L milligrams per liter mL milliliter MS/MSD matrix spike/ matrix spike duplicate MSDS material safety data sheets mV millivolts ORP oxidation reduction potential OU operable unit PCE tetrachloroethene psi pounds per square inch ROD record of decision RPD relative percent difference SSHP site safety and health plan Site Alcas Cutlery Corporation Facility Site SOP standard operating procedure TCE trichloroethene µg/L micrograms per liter UIC underground injection control UWBZ upper water bearing zone VC vinyl chloride VOC volatile organic compound vs versus

Acronyms
iv
THIS PAGE INTENTIONALLY LEFT BLANK

1-1
Section 1 Introduction
This work plan describes pilot study treatability testing to support evaluation of in-situ chemical oxidation (ISCO) as part of the treatment technology selection during Part II of the Focused Feasibility Study (FSS) prepared for the Alcas Cutlery Corporation Facility Site (Site) in Olean, Cattaraugus County, New York. Results from bench scale testing (CDM Smith 2012) support additional evaluation of ISCO with alkaline activated persulfate as a potential treatment technology for the Site residual source area. A pilot test is proposed at the Site to evaluate the effectiveness of ISCO with activated persulfate to reduce the source mass of chlorinated volatile organic compounds (VOCs). The findings of the pilot study will be used to assess the viability of ISCO with activated persulfate for full-scale application and to compare it to other alternatives. This introductory section provides an overview of the project background, the work plan objectives, and the technology descriptions. Details are provided in subsequent sections.
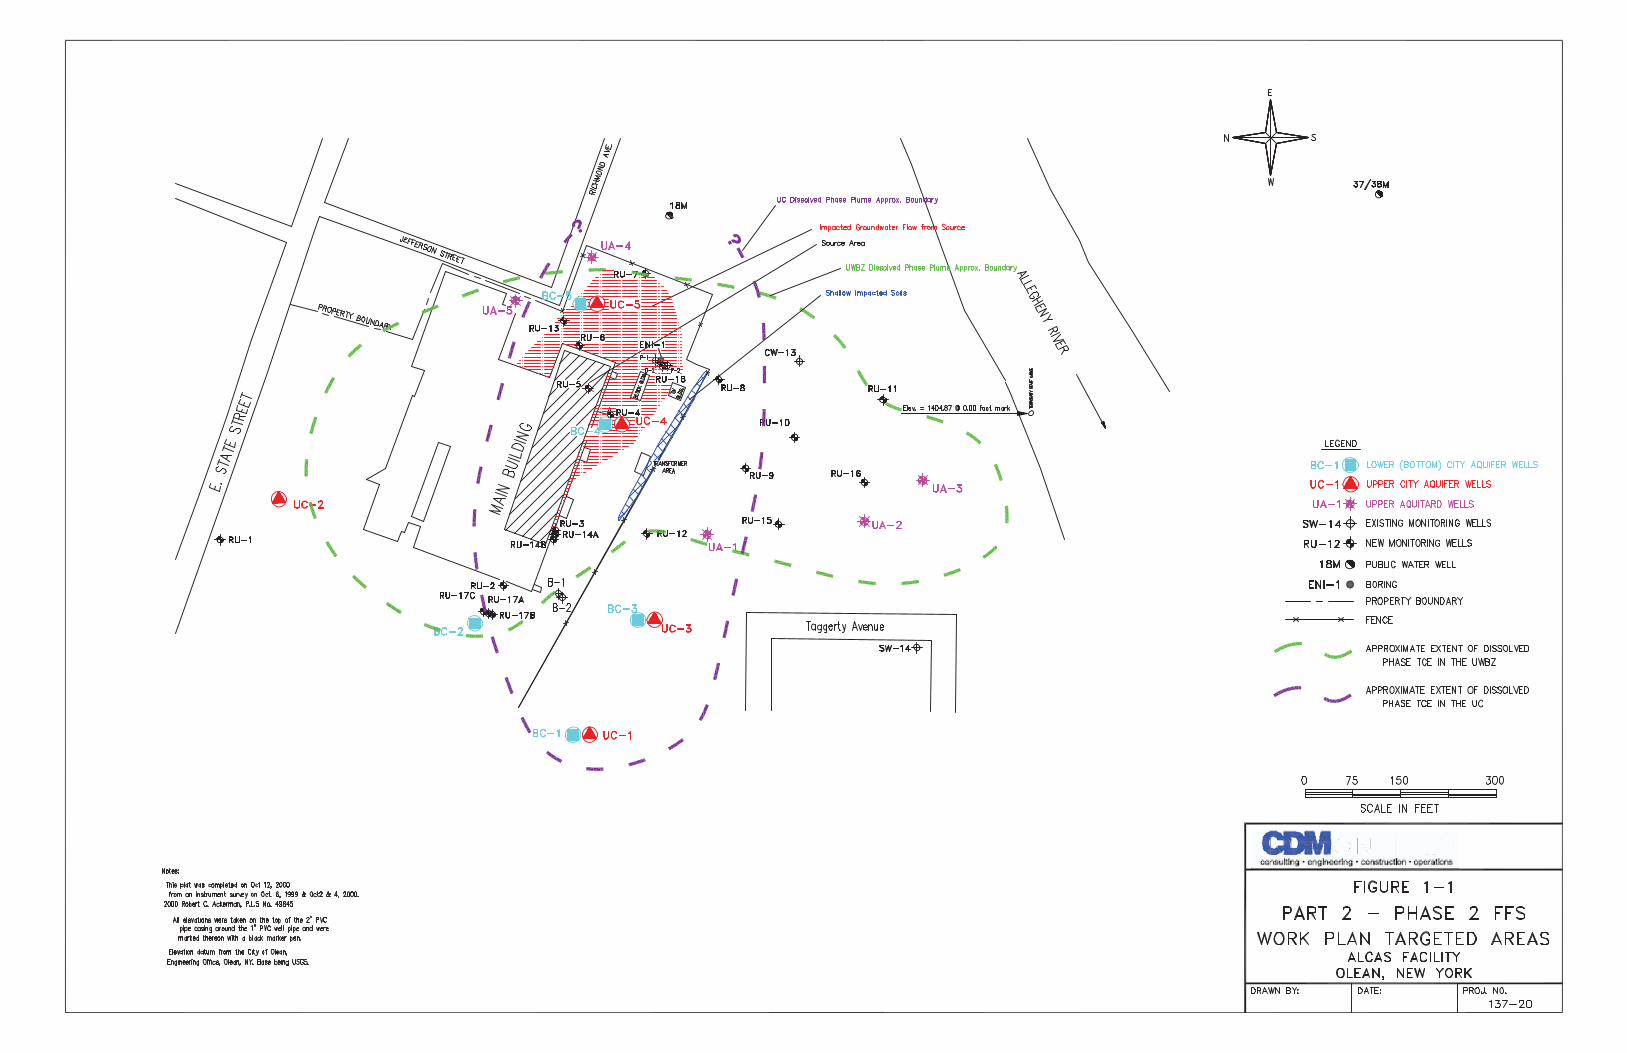
1.1 Background Background details and discussion of previous investigations and remedial activities at the Site were presented in the Bench and Pilot and Bench Study Remedial Action Plan (CDM Smith 2011). A map of the Site showing relevant features is presented on Figure 1-1.
Part II Phase 2 of the focused feasibility study (FFS) included implementation of bench and pilot testing at the Site. This testing is focused on obtaining targeted parameters to evaluate the technologies that were “short listed” in the previously submitted Part I of the FFS. These technologies are being evaluated for implementation predominantly in the upper water-bearing zone (UWBZ) at the Site. The bench testing focused on ISCO using activated persulfate, ozone, and peroxone (i.e., ozone plus hydrogen peroxide). Because application of ISCO depends on site-specific conditions, a bench-scale treatability study using site soil and groundwater was conducted at the CDM Smith Environmental Treatability Laboratory (ETL) in Bellevue, Washington to evaluate its efficacy for potential inclusion in the overall remedy to treat the Site. Results of the bench-scale testing were presented in the Draft Bench Scale Test Summary Report (CDM 2012), and the pilot testing described in this work plan is designed to validate the results of the bench testing at a field scale. Technology selection will be detailed during the Part II Phase 3 of the FFS effort following completion of Phase 2 field characterization, bench testing and pilot testing activities.
ISCO technology involves injecting chemical oxidant into the subsurface to oxidize chlorinated VOCs, thus reducing their mass. The four major oxidants generally used in ISCO for remediation of contaminated soil and groundwater are permanganate, persulfate, hydrogen peroxide, and ozone. In the bench study, persulfate, ozone, and peroxone were planned for testing because they were determined to be most applicable to the site.

Section 1 • Introduction
1-2
1.2 Objectives The overall objectives of the proposed pilot testing are to collect data to evaluate the efficacy of ISCO to treat the Site source area and adjacent high-concentration areas, and to ensure whatever is done in the field at the site will “do no harm” to the City Aquifer or existing municipal well treatment system.
The specific objectives of the pilot test are as follows:
1. Demonstrate whether ISCO with activated persulfate can successfully oxidize and reduce the source mass of chlorinated VOCs within the Site source area.
2. Determine injection parameters needed for full-scale design, including amendment dosing rates, and required frequency of oxidant injections,
3. Determine hydraulic parameters needed for a full-scale design, including target depth intervals, feasible injection rates and radius of influence through a single injection point,
4. Evaluate production and mitigation of secondary water quality factors, such as total organic carbon (TOC), sulfate, and dissolved metals (e.g., iron and manganese) to ensure no impacts to the 18M municipal supply well.
1.3 Technology Description 1.3.1 ISCO with Persulfate Various forms of persulfate including ammonium persulfate [(NH4)2 S2O8], sodium persulfate (Na2 S2O8), and potassium persulfate (K2S2O8
In the pH range of 3 to 7, the half reaction equation of persulfate is:
) have been shown to oxidize TCE effectively. Use of potassium persulfate in ISCO application is less common due to its low solubility. Injection of ammonium persulfate may lead to elevated concentrations of ammonia in groundwater, which is undesirable. As a result, sodium persulfate was selected for use in this study.
22242
282 222 OHSOHOHOS ++→+ −+−
(Standard potential = 2.1 volts)
Generation of H+ can lead to significant pH reductions and metals mobilization when persulfate is used. Therefore, use of alkaline activation or buffers (e.g., bicarbonate) is sometimes included with persulfate. While persulfate is reactive by itself, its reactivity is greatly enhanced by activation and the resultant production of free radicals. Activated persulfate forms a more powerful oxidant – the sulfate radical (SO4•-). Sulfate radical has a greater oxidation potential (2.6 V) than persulfate (2.1 V), and can degrade a wider range of chlorinated VOCs at faster rates by initiating a series of radical propagation and termination chain reactions. Heat, high pH, ferrous or chelated iron, and hydrogen peroxide are common persulfate activators.
1.3.2 Summary of Bench-Scale Testing A bench-scale treatability study was conducted at CDM Smith ETL in Bellevue, Washington, to assess the feasibility of ISCO treatment at the Site. Bench-scale test results were summarized in the Draft Bench-Scale Testing Summary Report (CDM Smith 2012). Persulfate with bicarbonate buffer and persulfate activated with sodium hydroxide were determined to be most applicable to the Site and were the focus of the treatability study.

Introduction • Section 1
1-3
The objectives of the bench-scale study were to:
1. Evaluate degradation of the constituents of concern by persulfate and activated persulfate, using Site soil and groundwater as the test matrix.
2. Evaluate the rate of breakdown of the persulfate and activated persulfate during the treatment test.
3. Evaluate the potential formation of any undesirable byproducts of the in situ treatments, such as oxidized metals, that could negatively impact the City Aquifer and 18M municipal supply well.
4. Determine if persulfate with or without activation is applicable for Site source treatment, and if any additional testing (e.g., a small scale, short-term pilot test near the Site source area) is needed to confirm feasibility.
The performance of sodium hydroxide activated persulfate was superior to persulfate with bicarbonate buffer in the study for two reasons:
1. For each dosage tested, the activated persulfate more effectively oxidized the VOCs.
2. At the highest dosage, the bicarbonate-buffered persulfate resulted in high concentrations of the byproduct bromate, whereas activated persulfate did not.
For activated persulfate, a 1 percent dosage provided some removal of the VOCs, but removal was less than 60 percent of the high-concentration TCE and cis-1,2-DCE. The 10 percent dosage provided 90 – 99 percent removal of the four VOCs tested, and initial removal rates were faster than in the 5 percent dosage. However, the VOC removal in the 5 percent dosage approached that of the 10 percent dosage by the end of the test, ranging from 85 to 98 percent. Furthermore, it appears that removal was still occurring at that time for both TCE and cis-1,2-DCE. Thus it appears that a dosage of activated persulfate of approximately 5 percent will provide the optimum balance between effective VOC removal and cost, without the formation of undesirable oxidized byproducts.
The applicability of ISCO via alkaline-activated persulfate at the Site depends on the treatment goals. The bench-scale results demonstrate that substantial mass removal can be achieved with this technology under the ideal mixing conditions of the laboratory; however, even in those conditions, final VOC concentrations were above federal drinking water standards. This suggests that in a field application at a heterogeneous site where significant VOC mass is likely to be located in low permeability soil lenses, treatment to drinking water standards would not be possible even with multiple oxidant applications. However, if the treatment goal were to achieve a specified mass removal in a specific area, this technology appears promising.

Section 1 • Introduction
1-4
THIS PAGE INTENTIONALLY LEFT BLANK

2-1
Section 2 Data Needs for the Pilot Test The EPA’s Data Quality Objectives (DQO) process was used to help frame the “problem” to be addressed by an ISCO pilot test at the Site, and to define the associated data needs. The DQO process is a series of planning steps that are designed to ensure that the type, quantity, and quality of environmental data used in decision-making are appropriate for the intended purpose. The DQO process specifies project decisions, the data quality required to support those decisions, specific data types needed, data collection requirements, and analytical techniques necessary to generate the specified data quality.
2.1 Problem Statement Historical operations at the Site have resulted in impacted soils and groundwater with TCE and other chlorinated products. An ISCO pilot test is proposed at the Site for the purpose of validating results of the bench-scale study and evaluating its potential viability for full-scale application for remediation of the chlorinated solvent source area.
2.2 Decision Questions The decisions to be made based on the ISCO pilot test pertain to the performance of the technology as a whole. Specific decision questions include the following:
Can activated persulfate be effectively distributed at the Site to successfully treat TCE concentrations representative of the source zone?
Is the degradation rate using activated persulfate in site soil and groundwater sufficient to treat concentrations of TCE representative of the source zone?
Is the reaction rate of activated persulfate conducive to effective injection and distribution in the subsurface?
Does injection of activated persulfate form any potential undesirable byproducts (e.g., secondary water quality factors) from the in situ treatment that could negatively impact the City Aquifer and/or municipal supply well?
2.3 Inputs to the Decision The data to be collected during the pilot study are considered inputs to the decision questions. The various data required are grouped here into categories roughly corresponding to the most relevant questions:
Persulfate distribution
– sulfate concentrations and pH;
Degradation ratestrends over time evaluated (i.e., measured as TCE, cis-1,2-DCE, and VC);
– chlorinated hydrocarbon concentrations will be analyzed and

Section 2 • Data Needs for the Pilot Test
2-2
Persulfate reaction rates
– oxidant concentrations measured as dissolved oxygen, persulfate, and sulfate;
Secondary water quality factors
– pH, hexavalent chromium, bromate, dissolved metals, total organic carbon, and sulfate.
Other factors pertaining to technology selection
2.4 Boundaries of the Study
–ISCO amendment cost, oxidant mass required, injection cost, oxidant longevity, ability to mitigate any secondary water quality factors
In this context, the term “boundaries” refers both to spatial and temporal boundaries for the pilot test. The pilot test will encompass approximately a ten-foot diameter area immediately south of the Alcas facility, in the vicinity of well RU-4. The pilot test will include one injection location approximately 5 feet from RU-4. Vertically, the injection and monitoring wells will target the UWBZ (up to 25 feet below land surface [bls]). The vertical extent of the injection will be confirmed during installation of monitoring wells at the Site. The pilot test duration (including baseline sampling), is planned for a maximum of 3 months.
2.5 Decision Rules Decision rules identify the actions to be taken for a given answer to each of the questions in Section 2.2. In some cases the decision rules are qualitative in nature due to the multiple lines of evidence that must be considered to evaluate this technology.
If activated persulfate cannot be effectively distributed at the Site using the proposed technique, then an assessment of additional delivery alternatives would need to be made. This should be evident very early in the pilot test and would require re-evaluation of the use of activated persulfate for full-scale remediation.
Degradation extents and rates of TCE will be measured. If TCE degradation is not achieved or reaction rates are slow, then the activated persulfate treatment will not be considered further.
Demand of activated persulfate reagents was evaluated during the bench test. Based on bench testing results, a 5% persulfate concentration was determined to be optimal for TCE degradation while avoiding generation of byproducts. If this dosing does not yield sufficient TCE degradation in the field, then the activated persulfate dosing rate for full-scale application will need to be re-evaluated, or the technology rejected.
Secondary water quality factors will be evaluated, including impacts to pH, production of bromate, and production of dissolved metals including hexavalent chromium. Bench testing of the planned 5% dosage of persulfate indicated limited potential for formation of bromated and limited increases in dissolved metals concentrations. The production of bromate and/or metals will be evaluated relative to the hydraulic transport pathways from the Alcas source area to municipal supply well 18M to determine if these factors could negatively impact the well. If sufficiently high, the treatment will not be considered further.
Once it is determined that activated persulfate can be distributed effectively and ISCO achieves the desired degradation, the activated persulfate treatment may be considered for full-scale implementation. A decision regarding the most cost-effective injection strategy will depend upon the ease of distribution, the rate of degradation, the cost of the persulfate, the mass of persulfate required, and the longevity of the persulfate in the subsurface. All of these factors will be considered to develop cost estimates for a potential full-scale implementation approach.

Data Needs for the Pilot Test • Section 2
2-3
2.6 Limits on Decision Errors Limits on allowable errors for decision inputs ensure that data quality will be sufficient for the intended purpose. Total study error consists of two types of decision errors: sampling design errors and measurement errors. Because a judgmental sampling design is being followed in the pilot test, statistically derived limits on sampling design error are not quantifiable.
The judgmental sampling approach is designed to limit the probability of sampling design errors by:
Collecting data from multiple lines of evidence (e.g. oxidant concentrations, TCE degradation, and/or multiple secondary water quality factors) to ensure an internally consistent data set.
Collecting data at a sufficient frequency to demonstrate reproducibility of results.
Locating monitoring wells so as to maximize the potential for influence by the activated persulfate injections.
Designing the pilot test based on successful pilot tests at other sites.
Measurement errors will be limited by selecting appropriate analytical procedures, detection limits, and quality control acceptance criteria (precision and accuracy). These are provided in Table 2-1

Section 2 • Data Needs for the Pilot Test
2-4
Table 2-1. Analytical Methods for ISCO Pilot Test
Analyte
Required Quantitation
Limit Precision Accuracya
Method
(recovery)
VOCs
Tetrachloroethene (PCE) 5 µg/L 14% RPD 70-130% EPA 8260B
Trichloroethene (TCE) 5 µg/L 14% RPD 70-130% b EPA 8260B
cis-1,2-dichloroethene (DCE)
5 µg/L 14% RPD 70-130% EPA 8260B
Vinyl Chloride (VC) 2 µg/L 14% RPD 70-130% EPA 8260B
Oxidants
Persulfate 1 mg/L 25% RPD 50-150% Field Test Kit
Sulfate 5 mg/L 25% RPD 50-150% EPA 300.0
Water Quality Parameters
Dissolved metals - c - - EPA 6010B,
EPA 7470A (mercury
Hexavalent Chromium 2 µg/L 20% RPD 80-120% EPA Method 7199
Bromate 5 µg/L 25% RPD 50-150% EPA 300.1
Total Organic Carbon 0.2 mg/L 25% RPD 50-150% SM 5310C
Dissolved Oxygen (DO) 0.1 mg/L 25% RPD 50-150% Flow Cell
pH 0.1 units 25% RPD N/A Flow Cell d
Redox Potential (ORP) 1 mV 25% RPD 50-150% Flow Cell
Specific conductivity 1 mS/cm 25% RPD 50-150% Flow Cell
Alkalinity 5 mg/L 25% RPD 50-150% Test Kit aFor analytical methods that do not measure matrix spike recovery, the percentage range indicated represents the acceptable range for check standards bRPD = relative percent difference for duplicate sample analysis c Metals include Ag, Al, Ba, Be, Cd, Ca, Cr, Co, Cu, Fe, Mg, Mn, Na, Ni, K, Na, Sb, V, Zn, As, Pb, Se, Tl, and Hg dCheck standards should be within 0.2 pH units

3-1
Section 3 Activated Persulfate Pilot Test The primary objective of the pilot test is to determine the potential viability of ISCO for full-scale application within the TCE source area. In the process, the Site-specific requirements for full-scale implementation of ISCO will be determined. In this section, the details regarding design, implementation and assessment of the pilot test are presented.
3.1 Pilot Test Design and Implementation Existing data were utilized to locate the pilot test in order to facilitate success. The criteria considered included historical concentrations of Site constituents in groundwater, the location of existing monitoring wells, the location and effects of the municipal extraction well on groundwater, anticipated potentiometric surface and groundwater gradient, and location of Site buildings. Once the general area for the pilot test was selected, the layout of the pilot test was designed (Figure 3-1).
Several areas near the building on site were evaluated for their use in completion of a pilot study. The vicinity of RU-4 was selected due to the presence of TCE in the UWBZ at relatively high concentrations (greater than 100 mg/L in groundwater) and its location in close proximity to the source area beneath the building. While not located directly in the suspected source area beneath the building, the groundwater TCE concentrations greater than approximately 10% of TCE solubility may be indicative of residual source material present in the vicinity; therefore performance during a field pilot study at this location should be comparable to performance in other portions of the source area. Additionally, the bench studies were completed using groundwater from RU-4 and soil from the vicinity of RU-4, allowing for comparison of bench-scale and pilot-scale results. Performing the pilot test outside the building also avoids challenges associated with working in very tight quarters in the building at this stage, which would likely require more time. Finally, while there may be some influence in the vicinity of RU-4 due to the municipal pumping well, that influence appears to be somewhat limited based on available potentiometric surface data for the UWBZ (Appendix B).
The pilot test well layout is shown in Figure 3-1. An injection well will be completed in a in the vicinity of RU-4. The permanent injection well is planned for this pilot study in order to simulate expected full-scale operations. Permanent injection wells, rather than direct-push injection, would be preferable for full-scale ISCO application due to the need for up to three applications of oxidant, and the challenges that would be encountered with multiple mobilizations of direct-push injection equipment into the building. For the pilot study, the design radius of influence (ROI) around the injection well will be approximately 5 feet. The injection well will be located approximately five feet from RU-4, to increase the likelihood that RU-4 will be affected by the persulfate injection within a reasonable timeframe to be able to observe TCE degradation at this location. The injection well will have a screen length of approximately 10 feet, depending on the lithology and depth to groundwater observed during well installation. Two additional monitoring wells (RU-22A and RU-22B) will be installed within five feet on the opposite side of the injection well. These additional monitoring wells will be utilized to evaluate distribution of
Section 3 • Activated Persulfate Pilot Test
3-2
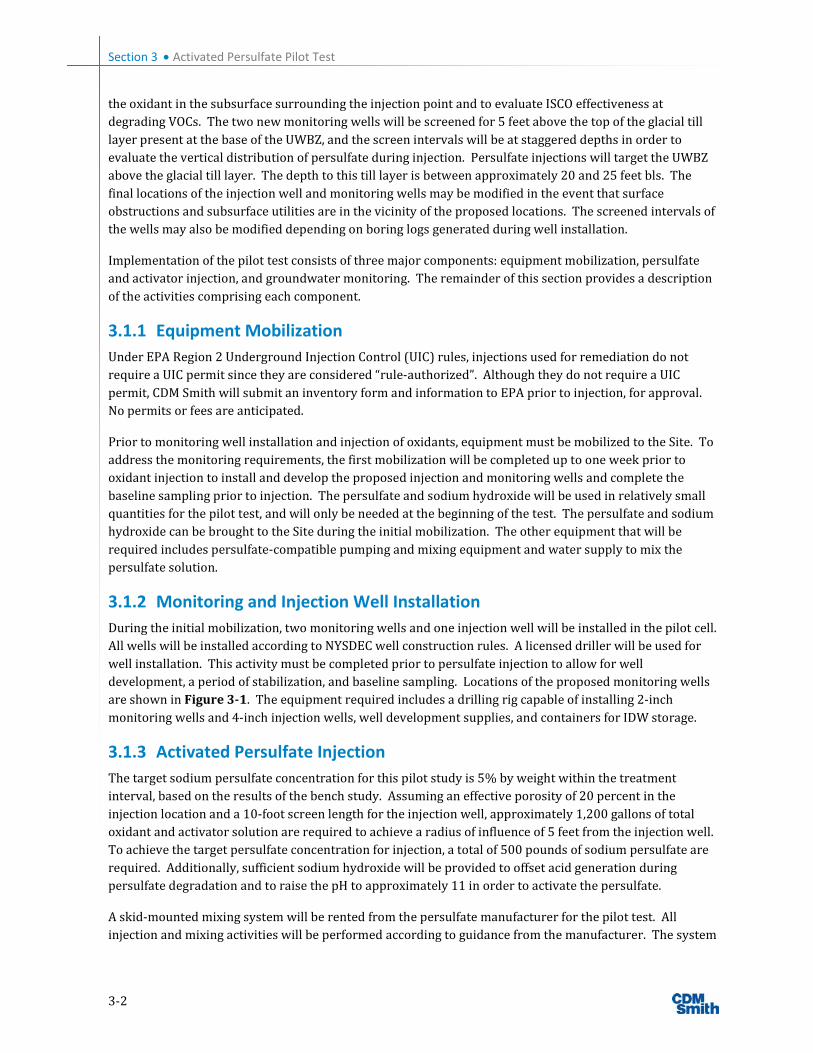
the oxidant in the subsurface surrounding the injection point and to evaluate ISCO effectiveness at degrading VOCs. The two new monitoring wells will be screened for 5 feet above the top of the glacial till layer present at the base of the UWBZ, and the screen intervals will be at staggered depths in order to evaluate the vertical distribution of persulfate during injection. Persulfate injections will target the UWBZ above the glacial till layer. The depth to this till layer is between approximately 20 and 25 feet bls. The final locations of the injection well and monitoring wells may be modified in the event that surface obstructions and subsurface utilities are in the vicinity of the proposed locations. The screened intervals of the wells may also be modified depending on boring logs generated during well installation.
Implementation of the pilot test consists of three major components: equipment mobilization, persulfate and activator injection, and groundwater monitoring. The remainder of this section provides a description of the activities comprising each component.
3.1.1 Equipment Mobilization Under EPA Region 2 Underground Injection Control (UIC) rules, injections used for remediation do not require a UIC permit since they are considered “rule-authorized”. Although they do not require a UIC permit, CDM Smith will submit an inventory form and information to EPA prior to injection, for approval. No permits or fees are anticipated.
Prior to monitoring well installation and injection of oxidants, equipment must be mobilized to the Site. To address the monitoring requirements, the first mobilization will be completed up to one week prior to oxidant injection to install and develop the proposed injection and monitoring wells and complete the baseline sampling prior to injection. The persulfate and sodium hydroxide will be used in relatively small quantities for the pilot test, and will only be needed at the beginning of the test. The persulfate and sodium hydroxide can be brought to the Site during the initial mobilization. The other equipment that will be required includes persulfate-compatible pumping and mixing equipment and water supply to mix the persulfate solution.
3.1.2 Monitoring and Injection Well Installation During the initial mobilization, two monitoring wells and one injection well will be installed in the pilot cell. All wells will be installed according to NYSDEC well construction rules. A licensed driller will be used for well installation. This activity must be completed prior to persulfate injection to allow for well development, a period of stabilization, and baseline sampling. Locations of the proposed monitoring wells are shown in Figure 3-1. The equipment required includes a drilling rig capable of installing 2-inch monitoring wells and 4-inch injection wells, well development supplies, and containers for IDW storage.
3.1.3 Activated Persulfate Injection The target sodium persulfate concentration for this pilot study is 5% by weight within the treatment interval, based on the results of the bench study. Assuming an effective porosity of 20 percent in the injection location and a 10-foot screen length for the injection well, approximately 1,200 gallons of total oxidant and activator solution are required to achieve a radius of influence of 5 feet from the injection well. To achieve the target persulfate concentration for injection, a total of 500 pounds of sodium persulfate are required. Additionally, sufficient sodium hydroxide will be provided to offset acid generation during persulfate degradation and to raise the pH to approximately 11 in order to activate the persulfate.
A skid-mounted mixing system will be rented from the persulfate manufacturer for the pilot test. All injection and mixing activities will be performed according to guidance from the manufacturer. The system

Activated Persulfate Pilot Test • Section 3
3-3
consists of a 500-gallon batch mixing tank, diaphragm pump, and associated hoses and fittings used to mix the persulfate solutions on site. All materials in the mixing and injection system are constructed of materials compatible with persulfate. Guidance provided by FMC (manufacturer of the persulfate product) indicate that mixing activator with the persulfate in a single batch prior to injection is only recommended if the total volume can be injected within one or two hours after mixing; otherwise the persulfate and activator should be mixed and injected sequentially. For example, a 100 to 200-gallon batch of persulfate solution will be mixed and injected, followed by a 100 to 200-gallon batch of sodium hydroxide solution. This sequence will be repeated until the target volume of solution and target mass of persulfate and sodium hydroxide has been injected. This sequential injection strategy maximizes the likelihood of mixing of the persulfate and activator in the subsurface, and minimizes potential for reduced effectiveness of the persulfate by performing the activation prior to injection.
Injection will be completed under low pressures using the diaphragm pump provided with the skid-mounted system. Due to the relatively shallow injection depth, injection pressures will be kept below 10 pounds per square inch (psi) during all injection activities. Low-pressure injection, at pressures less than the overburden pressure, eliminates the potential for generation of preferential pathways in the subsurface and increases the likelihood of achieving more uniform distribution of the oxidant around the injection point.
Given the proposed pilot study location near RU-4 in the UWBZ, and the relatively stagnant hydraulic gradient observed in this area during recent sampling, the injected persulfate is not expected to migrate significantly outside of the pilot study area. Additionally, since injection is proposed in the UWBZ, persulfate is not expected to migrate to the upper portion of the City Aquifer during the pilot study. This is supported by the several orders-of-magnitude decrease in concentrations of TCE observed between wells RU-4 (screened in the UWBZ) and UC-4 (screened in the upper City Aquifer) as presented in Table 3-1.
Following completion of the injection activities, approximately 50 gallons of clean chase water (potable water) will be flushed through the mixing system and injected into the well to push the persulfate solution out of the injection well screen into the formation.
3.1.4 Groundwater Monitoring The injection and monitoring well locations were chosen to enable evaluation of the vertical and horizontal influence of persulfate injections within the UWBZ and whether any effects are observed in the Upper City Aquifer in the vicinity of the injection location. Table 3-1 lists screen intervals and VOC data for the existing monitoring wells in the vicinity. Additional VOC data are provided in Appendix C. Monitoring well RU-4 and proposed wells RU-22A and RU-22B are located in the immediate vicinity of the pilot injection well, and will be sampled as indicated in Tables 3-2 and 3-3. Additionally, existing monitoring wells RU-5 and UC-4 will be sampled as indicated in Tables 3-2 and 3-3. RU-5 will be monitored to assess groundwater quality outside of the pilot study cell, in the vicinity of the source area. UC-4 will be sampled to confirm that negative impacts are not observed in the upper portion of the city Aquifer. Groundwater sampling will be conducted using standard operating procedures (SOPs) in Appendix A, including SOP 1-6 - Water Level Measurement, 4-3 - Well Development and Purging, 1-12 – Low Flow Sampling, and 1-2 - Sample Paperwork, Custody Seals and Labels.

Section 3 • Activated Persulfate Pilot Test
3-4
Table 3-1. Available Monitoring Locations for Pilot Test
Well Screened Interval
(feet bls) VOC Concentration (2011 data) (mg/L)
RU-4 11-20 a TCE – 150; cis-DCE – 16; VC – 2.7 RU-5 14-24 TCE – 80; cis-DCE – 0.27; VC – 0.013 RU-22A (to be installed) 15-20 (anticipated) NA RU-22B (to be installed) 20-25 (anticipated) NA UC-4 46-56 TCE – 0.055; cis-DCE – 0.0018; VC – ND UC-5 50-60 TCE – 0.095; cis-DCE – 0.00093 J; VC – ND D-2 30-35 TCE – 16; cis-DCE – 0.44; VC – 0.051 RW-1 5-20 TCE – 39; cis-DCE – 3.7; VC – 1.4 (1999 data) Notes: bls –below land surface TCE - trichloroethene VOC – volatile organic compound cis-DCE – cis-1,2-dichloroethene mg/L – milligrams per liter VC – vinyl chloride NA – not applicable
Table 3-2. Monitoring Frequency Within the Pilot Test Area
Well Screened Interval (feet bls) Sampling Frequencya
RU-4 11-20 Baseline, Week 2, Week 6, Month 3
RU-22A 15-20 (anticipated) Baseline, Week 2, Week 6, Month 3
RU-22B 20-25 (anticipated) Baseline, Week 2, Week 6, Month 3
RU-5 14-24 Baseline, Month 3 UC-4 46-56 Baseline, Month 3 UC-5 50-60 Baseline, Month 3 D-2 30-35 Baseline, Month 3 RW-1 5-20 Baseline, Month 3 a
Hexavalent Chromium – Sampled at baseline and Month 3 only All analytes listed in Table 3-3 will be sampled at each well during each sampling event with the following exceptions:
TOC – Sampled at baseline and Month 3 only

Activated Persulfate Pilot Test • Section 3
3-5
Table 3-3. Sampling Requirements for ISCO Pilot Test
Analytes Sample container size
and type Preservative Holding
time Comments
VOCs Two glass 40-mL VOA vials
4ºC 7 days No headspace
Dissolved Metals 500-mL HDPE pH<2 with HNO3
6-months, 28 days for mercury
; 4ºC
Hexavalent Chromium 250-mL HDPE 4ºC 24 hours
Bromate 250-mL HDPE 4ºC 14 days
Total Organic Carbon One glass 500-mL amber 4ºC, pH<2. 28 days
Sulfate 250-mL HDPE 4ºC 14 days
Persulfate 250-mL HDPE 4ºC Analyze immediately in the field
Alkalinity 250-mL HDPE 4ºC Analyze immediately in the field
DO, pH, ORP, specific Conductivity
Analyze immediately in the field
Notes: VOC – volatile organic compound HNO3
VOA – volatile organic analysis mL - milliliter – nitric acid
HDPE – high-density polyethylene
The monitoring frequency and analytes for each location were determined based on experience with technology implementation, the expected rate of change of the parameters of interest, the relative importance and cost of individual analytes, and the temporal boundaries of the pilot test.
Figure 3-2 presents the proposed schedule of the major pilot test activities in terms of time elapsed since the start of the test. Prior to the start of the test, all planned monitoring wells will be sampled during the baseline event. Groundwater sampling for performance assessment will begin two weeks after the persulfate injection. After persulfate injection, monitoring rounds will be conducted at the 2-week, 6-week, and 3-month marks.
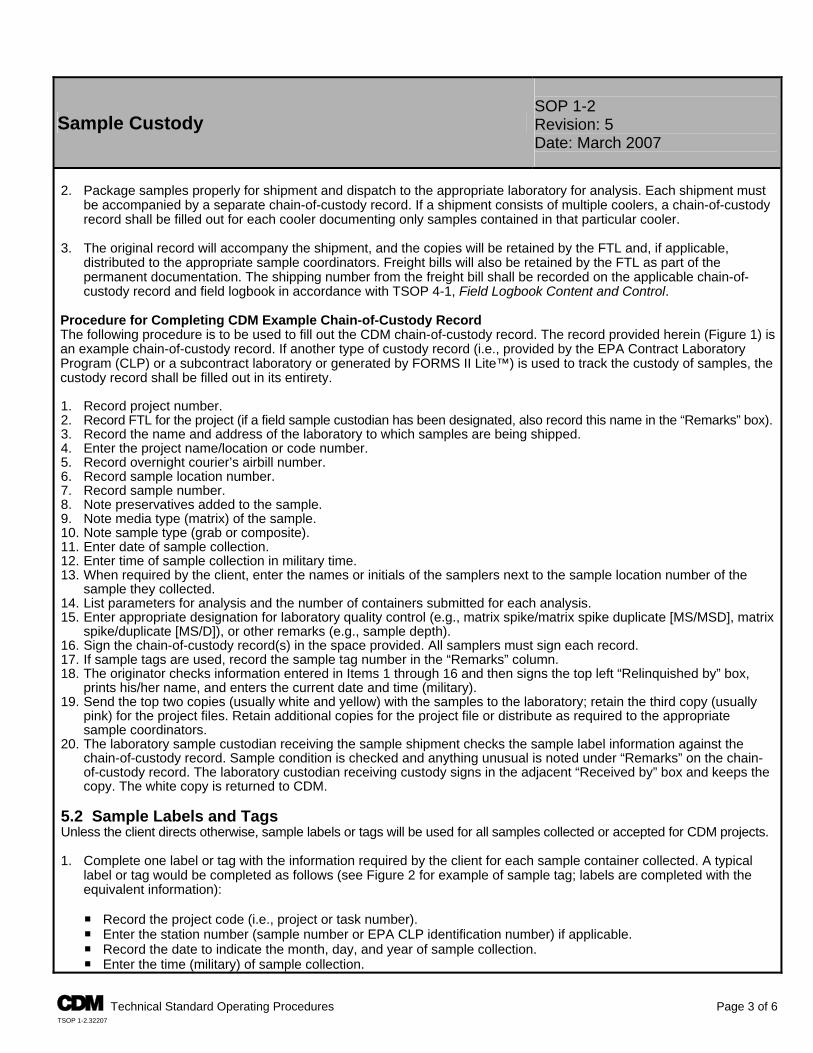
All monitoring wells will be sampled using low-flow sampling techniques consistent with Puls and Barcelona (1996). Specific procedures to be followed for each sampling round are included in Appendix A, SOP 1-12. Whenever possible, samples will be shipped to off-Site laboratories the day they are collected. Sample requirements including containers, preservation, and holding time are provided in Table 3-3. Chain of custody forms shall be used for all samples shipped to off-Site laboratories. In addition groundwater elevations will be measured at each of the monitoring wells.
It is important to note that data collected during the course of the pilot study might suggest a change in the monitoring strategy. Examples might include changing the monitoring frequency, adding or removing specific analytes, or changing the overall duration of the pilot test. Any changes to pilot test operations should be made in the context of the decision questions identified in Section 3.2. If it becomes clear that a change is needed to answer one of those questions, or that no further data of a certain type are necessary to answer a question, then a change is appropriate.
Section 3 • Activated Persulfate Pilot Test
3-6
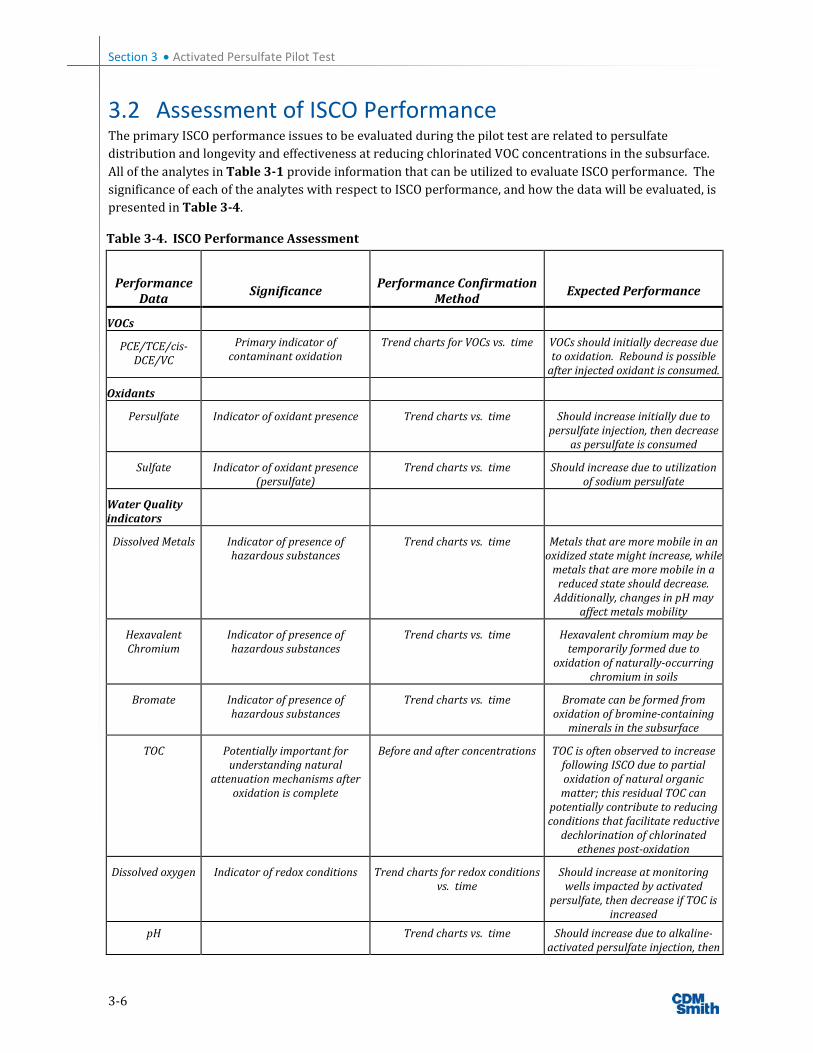
3.2 Assessment of ISCO Performance The primary ISCO performance issues to be evaluated during the pilot test are related to persulfate distribution and longevity and effectiveness at reducing chlorinated VOC concentrations in the subsurface. All of the analytes in Table 3-1 provide information that can be utilized to evaluate ISCO performance. The significance of each of the analytes with respect to ISCO performance, and how the data will be evaluated, is presented in Table 3-4.
Table 3-4. ISCO Performance Assessment
Performance Data
Significance Performance Confirmation
Method Expected Performance
VOCs
PCE/TCE/cis-DCE/VC
Primary indicator of contaminant oxidation
Trend charts for VOCs vs. time VOCs should initially decrease due to oxidation. Rebound is possible
after injected oxidant is consumed.
Oxidants
Persulfate Indicator of oxidant presence Trend charts vs. time Should increase initially due to persulfate injection, then decrease
as persulfate is consumed
Sulfate Indicator of oxidant presence (persulfate)
Trend charts vs. time Should increase due to utilization of sodium persulfate
Water Quality indicators
Dissolved Metals Indicator of presence of hazardous substances
Trend charts vs. time Metals that are more mobile in an oxidized state might increase, while
metals that are more mobile in a reduced state should decrease.
Additionally, changes in pH may affect metals mobility
Hexavalent Chromium
Indicator of presence of hazardous substances
Trend charts vs. time Hexavalent chromium may be temporarily formed due to
oxidation of naturally-occurring chromium in soils
Bromate Indicator of presence of hazardous substances
Trend charts vs. time Bromate can be formed from oxidation of bromine-containing
minerals in the subsurface
TOC Potentially important for understanding natural
attenuation mechanisms after oxidation is complete
Before and after concentrations TOC is often observed to increase following ISCO due to partial oxidation of natural organic matter; this residual TOC can
potentially contribute to reducing conditions that facilitate reductive
dechlorination of chlorinated ethenes post-oxidation
Dissolved oxygen Indicator of redox conditions Trend charts for redox conditions vs. time
Should increase at monitoring wells impacted by activated
persulfate, then decrease if TOC is increased
pH Trend charts vs. time Should increase due to alkaline-activated persulfate injection, then
Activated Persulfate Pilot Test • Section 3
3-7
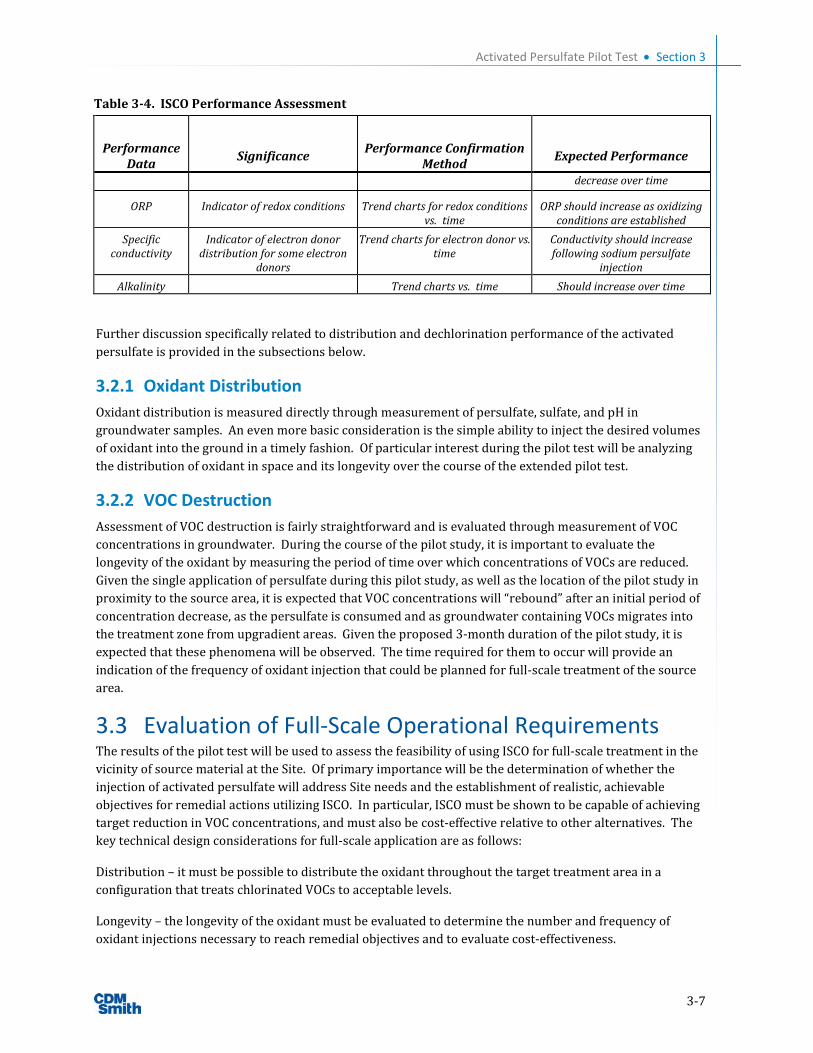
Table 3-4. ISCO Performance Assessment
Performance Data
Significance Performance Confirmation
Method Expected Performance
decrease over time
ORP Indicator of redox conditions Trend charts for redox conditions vs. time
ORP should increase as oxidizing conditions are established
Specific conductivity
Indicator of electron donor distribution for some electron
donors
Trend charts for electron donor vs. time
Conductivity should increase following sodium persulfate
injection
Alkalinity Trend charts vs. time Should increase over time
Further discussion specifically related to distribution and dechlorination performance of the activated persulfate is provided in the subsections below.
3.2.1 Oxidant Distribution Oxidant distribution is measured directly through measurement of persulfate, sulfate, and pH in groundwater samples. An even more basic consideration is the simple ability to inject the desired volumes of oxidant into the ground in a timely fashion. Of particular interest during the pilot test will be analyzing the distribution of oxidant in space and its longevity over the course of the extended pilot test.
3.2.2 VOC Destruction Assessment of VOC destruction is fairly straightforward and is evaluated through measurement of VOC concentrations in groundwater. During the course of the pilot study, it is important to evaluate the longevity of the oxidant by measuring the period of time over which concentrations of VOCs are reduced. Given the single application of persulfate during this pilot study, as well as the location of the pilot study in proximity to the source area, it is expected that VOC concentrations will “rebound” after an initial period of concentration decrease, as the persulfate is consumed and as groundwater containing VOCs migrates into the treatment zone from upgradient areas. Given the proposed 3-month duration of the pilot study, it is expected that these phenomena will be observed. The time required for them to occur will provide an indication of the frequency of oxidant injection that could be planned for full-scale treatment of the source area.
3.3 Evaluation of Full-Scale Operational Requirements The results of the pilot test will be used to assess the feasibility of using ISCO for full-scale treatment in the vicinity of source material at the Site. Of primary importance will be the determination of whether the injection of activated persulfate will address Site needs and the establishment of realistic, achievable objectives for remedial actions utilizing ISCO. In particular, ISCO must be shown to be capable of achieving target reduction in VOC concentrations, and must also be cost-effective relative to other alternatives. The key technical design considerations for full-scale application are as follows:
Distribution – it must be possible to distribute the oxidant throughout the target treatment area in a configuration that treats chlorinated VOCs to acceptable levels.
Longevity – the longevity of the oxidant must be evaluated to determine the number and frequency of oxidant injections necessary to reach remedial objectives and to evaluate cost-effectiveness.

Section 3 • Activated Persulfate Pilot Test
3-8
VOC destruction – the oxidant must be capable of reducing VOC concentrations in source material to achieve remedial action objectives.
No adverse impacts – the injection strategy must be designed to avoid adverse impacts to the municipal supply well and the river during full-scale operation.
Once the achievable distribution, longevity, and VOC destruction rates for the selected oxidant are known, a conceptual full-scale design can be developed based on the determined remedial action objectives. The full-scale design will also incorporate measures to address any limitations identified during the pilot test. ISCO would not be considered further if any such limitations could not be addressed. The full-scale design will facilitate development of a cost estimate for comparison to other alternatives.
4-1
Section 4 Investigation Derived Waste
As discussed in the Pilot and Bench Study Remedial Action Plan (CDM Smith 2011), groundwater IDW generated during this investigation will be managed based upon the hazardous characteristics as defined in 40 CFR Subpart C. IDW will be generated during the drilling and development of the injection and performance monitoring wells, and during the groundwater sampling rounds. Analytical results specifically from waste characterization sampling as well as analytical results obtained for the investigations will be provided to the IDW disposal subcontractor for waste designation purposes. Samples will be analyzed for VOCs at a minimum.
Solid waste IDW will be containerized in 55-gallon drums and stored at the Alcas property pending waste characterization, and offsite transportation and disposal by the IDW disposal subcontractor. Well development and groundwater sampling purge water will be placed in 55-gallon drums and temporarily stored at the Alcas property. IDW water samples will be collected one sample per 275 gallons, and soil samples one sample per drum. Upon receipt of the results, the waste materials will be shipped off-site for proper disposal, as either a characteristic hazardous waste or as non-hazardous waste material.

Section 4 • Investigation Derived Waste
4-2
THIS PAGE INTENTIONALLY LEFT BLANK

5-1
Section 5 Pilot Test Report A pilot test report will be submitted at the conclusion of the testing. Interim data evaluation will be performed, and results of the data evaluation will be communicated during conference calls and in electronic format. The pilot study report shall include an overview of the pilot study design, objectives, materials, and methods used during the study and detailed results, conclusions and recommendations. In particular, the report will detail recommendations for future consideration of ISCO and important parameters to use in the full-scale design.

Section 5 • Pilot Test Report
5-2
THIS PAGE INTENTIONALLY LEFT BLANK
6-1
Section 6 References
CDM Smith Inc. (CDM Smith). 2011. Pilot and Bench Study Remedial Action Plan, Alcas Cutlery Corporation Facility, Olean, New York. September.
CDM Smith Inc. (CDM Smith). 2012. Draft Bench-Scale Test Summary Report, Alcas Cutlery Corporation Facility, Olean, New York. January.
Environeering, Inc. 2008. Updated Site Evaluation and Conceptual Model Report, Alcas Cutlery Corporation Property, Olean Well Field Superfund Site, Olean, New York.
Environeering, Inc. 2011. Part II Phase 2 Data Collection Work Plan for the Focused Feasibility Study (“FFS”) Alcas Cutlery Corporation Facility Site, Olean, New York.
Huling, S. G., and Pivetz, B. Z, 2006. In-Situ Chemical Oxidation. United States Environmental Protection Agency (EPA). Engineering Issue. EPA 600-R-06-072, 2006.
Interstate Technology & Regulatory Council. 2005. Technical and Regulatory Guidance for In Situ Chemical Oxidation of Contaminated Soil and Groundwater. Second Edition. January 2005
Puls, R.W. and M.J. Barcelona. 1996. Low-Flow (Minimal Drawdown) Ground-Water Sampling Procedures. Office of Research and Development and Office of Solid Waste and Emergency Response, U.S. Environmental Protection Agency, Washington, D.C., EPA/540/S-95/504.
U.S. Environmental Protection Agency. 1998. Technical Protocol for Evaluating Natural Attenuation of Chlorinated Solvents in Ground Water. Report EPA/600/R-98/128.

Section 6 • References
6-2
THIS PAGE INTENTIONALLY LEFT BLANK


ID Task Name Duration Start Finish
1 Pilot Work Plan 25 days Mon 2/27/12 Fri 3/30/12
2 Draft Preparation 10 days Mon 2/27/12 Fri 3/9/12
3 EPA Review 5 days Mon 3/12/12 Fri 3/16/12
4 Revisions / Final Submittal 10 days Mon 3/19/12 Fri 3/30/12
5 Pilot Persulfate Implementation 81 days Mon 3/26/12 Mon 7/16/12
6 Subcontracting/Planning/Permitting 10 days Mon 3/26/12 Fri 4/6/12
7 Monitoring and Injection Well Installation 3 days Mon 4/9/12 Wed 4/11/12
8 Baseline Monitoring 4 days Mon 4/9/12 Thu 4/12/12
9 Persulfate and Activator Injection 3 days Fri 4/13/12 Tue 4/17/12
10 Monitoring Event #1 2 days Mon 4/30/12 Tue 5/1/12
11 Monitoring Event #2 2 days Wed 5/30/12 Thu 5/31/12
12 Monitoring Event #3 2 days Fri 7/13/12 Mon 7/16/12
13 Reporting 71 days Wed 5/2/12 Wed 8/8/12
17 Interim Data Evaluation to Support FFS 1 day Tue 6/5/12 Tue 6/5/12
15 Pilot Test Report 70 days Wed 5/2/12 Tue 8/7/12
16 Submit Final Pilot Test Report 1 day Wed 8/8/12 Wed 8/8/12
3/30
8/8
2728293031323334353637383940414243444546474849505152 1 2 3 4 5 6 7 8 9 10111213141516171819202122232425262728293031323334July August Septembe October November December January February March April May June July August
2012
Task
Split
Progress
Milestone
Summary
Project Summary
External Tasks
External Milestone
Deadline
Figure 7-1 Page 1 In-Situ Chemical Oxidation Pilot Study Work PlanAlcas Cuterly Corporation Facility
Olean, New York
Project: Figure 3-2. Olean Persulfate PDate: Thu 3/22/12

Appendix A

Sample Custody SOP 1-2 Revision: 5 Date: March 2007
Prepared: David O. Johnson Technical Review: S. Budney
QA Review: Jo Nell Mullins Approved:
E-Signed by Michael C. MalloyVERIFY authenticity with ApproveIt
Issued:
E-Signed by P. Michael SchwanVERIFY authenticity with ApproveIt
Signature/Date
Signature/Date 1.0 Objective Because of the evidentiary nature of samples collected during environmental investigations, possession must be traceable from the time the samples are collected until their derived data are introduced as evidence in legal proceedings. To maintain and document sample possession, sample custody procedures are followed. All paperwork associated with the sample custody procedures will be retained in CDM Federal Programs Corporation (CDM) files unless the client requests that it be transferred to them for use in legal proceedings or at the completion of the contract. Note: Sample custody documentation requirements vary with the specific EPA region or client. This SOP is intended to present basic sample custody requirements, along with common options. Specific sample custody requirements shall be presented in the project-specific quality assurance (QA) project plan or project-specific modification or clarification form (see Section U-1). 2.0 Background 2.1 Definitions Sample - A sample is material to be analyzed that is contained in single or multiple containers representing a unique sample identification number. Sample Custody - A sample is under custody if: 1. It is in your possession 2. It is in your view, after being in your possession 3. It was in your possession and you locked it up 4. It is in a designated secure area Chain-of-Custody Record - A chain-of-custody record is a form used to document the transfer of custody of samples from one individual to another. Custody Seal - A custody seal is a tape-like seal that is part of the chain-of-custody process and is used to detect tampering with samples after they have been packed for shipping. Sample Label - A sample label is an adhesive label placed on sample containers to designate a sample identification number and other sampling information. Sample Tag - A sample tag is attached with string to a sample container to designate a sample identification number and other sampling information. Tags may be used when it is difficult to physically place adhesive labels on the container (e.g., in the case of small air sampling tubes). 3.0 General Responsibilities Sampler - The sampler is personally responsible for the care and custody of the samples collected until they are properly transferred or dispatched. Field Team Leader - The field team leader (FTL) is responsible for ensuring that strict chain-of-custody procedures are maintained during all sampling events. The FTL is also responsible for coordinating with the subcontractor laboratory to
A Technical Standard Operating Procedures Page 1 of 6 TSOP 1-2.32207

SOP 1-2 Sample Custody Revision: 5
Date: March 2007
ensure that adequate information is recorded on custody records. The FTL determines whether proper custody procedures were followed during the fieldwork. Field Sample Custodian - The field sample custodian, when designated by the FTL, is responsible for accepting custody of samples from the sampler(s) and properly packing and shipping the samples to the laboratory assigned to do the analyses. A field sample custodian is typically designated only for large and complex field efforts. Note: Responsibilities may vary from site to site. Therefore, all field team member responsibilities shall be defined in the field plan or site/quality assurance project plan (QAPP). 4.0 Required Supplies P Chain-of-custody records (applicable client or CDM forms) P Custody seals P Sample labels and/or tags P Clear tape P EPA Field Operations Records Management System II Lite™
(FORMS II Lite™) software (if required) P Computer P Printer
P Printer paper 5.0 Procedures 5.1 Chain-of-Custody Record This procedure establishes a method for maintaining custody of samples through use of a chain-of-custody record. This procedure will be followed for all samples collected or split samples accepted. Field Custody 1. Collect only the number of samples needed to represent the media being sampled. To the extent possible, determine
the quantity and types of samples and sample locations before the actual fieldwork. As few people as possible shall handle samples.
2. Complete sample labels or tags for each sample using waterproof ink. 3. Maintain personal custody of the samples (in your possession) at all times until custody is transferred for sample
shipment or directly to the analytical laboratory. Transfer of Custody and Shipment 1. Complete a chain-of-custody record for all samples (see Figure 1 for an example of a chain-of-custody record. Similar
forms may be used when requested by the client). When transferring the possession of samples, the individuals relinquishing and receiving will sign, date, and note the time on the record. This record documents sample custody transfer from the sampler, often through another person, to the sample custodian in the appropriate laboratory.
P The date/time will be the same for both signatures when custody is transferred directly to another person. When
samples are shipped via common carrier (e.g., Federal Express), the date/time will not be the same for both signatures. Common carriers are not required to sign the chain-of-custody record.
P In all cases, it must be readily apparent that the person who received custody is the same person who
relinquished custody to the next custodian. P If samples are left unattended or a person refuses to sign, this must be documented and explained on the chain-
of-custody record. Note: If a field sample custodian has been designated, he/she may initiate the chain-of-custody record, sign, and date as the relinquisher. The individual sampler(s) must sign in the appropriate block, but does (do) not need to sign and date as a relinquisher (refer to Figure 1).
A Technical Standard Operating Procedures Page 2 of 6 TSOP 1-2.32207
SOP 1-2 Sample Custody Revision: 5
Date: March 2007
2. Package samples properly for shipment and dispatch to the appropriate laboratory for analysis. Each shipment must
be accompanied by a separate chain-of-custody record. If a shipment consists of multiple coolers, a chain-of-custody record shall be filled out for each cooler documenting only samples contained in that particular cooler.
3. The original record will accompany the shipment, and the copies will be retained by the FTL and, if applicable,
distributed to the appropriate sample coordinators. Freight bills will also be retained by the FTL as part of the permanent documentation. The shipping number from the freight bill shall be recorded on the applicable chain-of-custody record and field logbook in accordance with TSOP 4-1, Field Logbook Content and Control.
Procedure for Completing CDM Example Chain-of-Custody Record The following procedure is to be used to fill out the CDM chain-of-custody record. The record provided herein (Figure 1) is an example chain-of-custody record. If another type of custody record (i.e., provided by the EPA Contract Laboratory Program (CLP) or a subcontract laboratory or generated by FORMS II Lite™) is used to track the custody of samples, the custody record shall be filled out in its entirety. 1. Record project number. 2. Record FTL for the project (if a field sample custodian has been designated, also record this name in the “Remarks” box). 3. Record the name and address of the laboratory to which samples are being shipped. 4. Enter the project name/location or code number. 5. Record overnight courier’s airbill number. 6. Record sample location number. 7. Record sample number. 8. Note preservatives added to the sample. 9. Note media type (matrix) of the sample. 10. Note sample type (grab or composite). 11. Enter date of sample collection. 12. Enter time of sample collection in military time. 13. When required by the client, enter the names or initials of the samplers next to the sample location number of the
sample they collected. 14. List parameters for analysis and the number of containers submitted for each analysis. 15. Enter appropriate designation for laboratory quality control (e.g., matrix spike/matrix spike duplicate [MS/MSD], matrix
spike/duplicate [MS/D]), or other remarks (e.g., sample depth). 16. Sign the chain-of-custody record(s) in the space provided. All samplers must sign each record. 17. If sample tags are used, record the sample tag number in the “Remarks” column. 18. The originator checks information entered in Items 1 through 16 and then signs the top left “Relinquished by” box,
prints his/her name, and enters the current date and time (military). 19. Send the top two copies (usually white and yellow) with the samples to the laboratory; retain the third copy (usually
pink) for the project files. Retain additional copies for the project file or distribute as required to the appropriate sample coordinators.
20. The laboratory sample custodian receiving the sample shipment checks the sample label information against the chain-of-custody record. Sample condition is checked and anything unusual is noted under “Remarks” on the chain-of-custody record. The laboratory custodian receiving custody signs in the adjacent “Received by” box and keeps the copy. The white copy is returned to CDM.
5.2 Sample Labels and Tags Unless the client directs otherwise, sample labels or tags will be used for all samples collected or accepted for CDM projects. 1. Complete one label or tag with the information required by the client for each sample container collected. A typical
label or tag would be completed as follows (see Figure 2 for example of sample tag; labels are completed with the equivalent information):
P Record the project code (i.e., project or task number). P Enter the station number (sample number or EPA CLP identification number) if applicable. P Record the date to indicate the month, day, and year of sample collection. P Enter the time (military) of sample collection.
A Technical Standard Operating Procedures Page 3 of 6 TSOP 1-2.32207

SOP 1-2 Sample Custody Revision: 5
Date: March 2007
P Place a check to indicate composite or grab sample. P Record the station (sample) location. P Sign in the space provided. P Place a check next to “yes” or “no” to indicate if a preservative was added. P Place a check under “Analyses” next to the parameters for which the sample is to be analyzed. If the desired
analysis is not listed, write it in the empty slot. Note: Do not write in the box for “laboratory sample number.” P Place or write additional relevant information under “Remarks.”
2. Place adhesive labels directly on the sample containers. Place clear tape over the label to protect from moisture. 3. Securely attach sample tags to the sample bottle. On 2.27 liter (80 oz.) amber bottles, the tag string may be looped
through the ring-style handle and tied. On all other containers, it is recommended that the string be looped around the neck of the bottle, then twisted, and relooped around the neck until the slack in the string is removed.
4. Double-check that the information recorded on the sample tag is consistent with the information recorded on the
chain-of-custody record. 5.3 Custody Seals Two custody seals must be placed on opposite corners of all shipping containers (e.g., cooler) before shipment. The seals shall be signed and dated by the shipper. Custody seals may also be required to be placed on individual sample bottles. Check with the client or refer to EPA regional guidelines for direction. 5.4 Sample Shipping CDM Federal SOP 2-1, Packaging and Shipping Environmental Samples defines the requirements for packaging and shipping environmental samples. 6.0 Restrictions/Limitations Check with the EPA region or client for specific guidelines. If no specific guidelines are identified, this procedure shall be followed. For EPA CLP sampling events, combined chain-of-custody/traffic report forms generated with EPA FORMS II Lite™ or other EPA-specific records may be used. Refer to regional guidelines for completing these forms. The EPA FORMS II Lite™ software may be used to customize sample labels and custody records when directed by the client or the CDM project manager. 7.0 References U. S. Army Corps of Engineers. 2001. Requirements for the Preparation of Sampling and Analysis Plan, EM 200-1-3. Appendix F. February. U. S. Environmental Protection Agency. Revised March 1992. National Enforcement Investigations Center, Multi-Media Investigation Manual, EPA-330/9-89-003-R. p.85. __________. Region IV. 1996. Environmental Investigations Standard Operating Procedures and Quality Assurance Manual. Section 3.3. May. __________. 2002. FORMS II Lite™ User’s Guide, Version 5.1. __________. 2002. EPA Guidance for Quality Assurance Project Plans, EPA QA/G-5, EPA/240/R-02/009. Section 2.2.3. December. __________. 2004. Contract Laboratory Program (CLP), Guidance for Field Samplers, EPA-540-R-00-003. Final. Section 3.2. August.
A Technical Standard Operating Procedures Page 4 of 6 TSOP 1-2.32207

SOP 1-2 Sample Custody Revision: 5
Date: March 2007
Figure 1 Example CDM Chain-of-Custody Record
Note: If requested by the client, different chain-of-custody records may be used. Copies of the template for this record may
be obtained from the Chantilly Graphics Department.
A Technical Standard Operating Procedures Page 5 of 6 TSOP 1-2.32207

SOP 1-2 Sample Custody Revision: 5
Date: March 2007
Figure 2 Example Sample Tag
Note: Equivalent sample labels or tags may be used.
A Technical Standard Operating Procedures Page 6 of 6 TSOP 1-2.32207

Water Level Measurement SOP 1-6 Revision: 6 Date: March 2007
Prepared: Del Baird Technical Review: Peggy Bloisa
QA Review: Jo Nell Mullins Approved:
E-Signed by Michael C. MalloyVERIFY authenticity with ApproveIt
Issued:
E-Signed by P. Michael SchwanVERIFY authenticity with ApproveIt
Signature/Date
Signature/Date 1.0 Objective Water level measurements are fundamental to groundwater and solute transport studies and are conducted during groundwater sampling events to calculate the amount of groundwater to be purged from the well. This standard operating procedure (SOP) defines the techniques and requirements for obtaining groundwater level measurements. 2.0 Background 2.1 Definitions Water Level Indicator - A portable device for measuring the depth from a fixed point (which could be below, at, or above the ground surface) to the groundwater inside a well, borehole, or other underground opening. Measurement Point - An easily located and clearly defined mark at the top of a well from which all water level measurements from that particular well are made. The measurement point shall be as permanent as possible to provide consistency in measurements. Electrical Tape - A graduated plastic tape onto which a water-sensitive electrode is connected that will electronically signal the presence of water (as a result of circuit closure). Immiscible Fluids - Two or more fluid substances that will not mix and, therefore, will exist together in a layered form. The fluid with the highest density will exist as the bottom layer, the fluid with the lowest density will exist as the top layer, and any other fluid layers will be distributed relative to their respective densities. Discharge - The removal/release of water from the zone of saturation. Recharge - The addition of water to the zone of saturation. Static Water Level - The level of water in a well, borehole, or other underground opening that is not influenced by discharge or recharge. Well Riser - A steel, stainless steel, or polyvinyl chloride pipe that extends into a borehole and is connected to the well screen or sealed at the bedrock surface in open-hole wells. The upper portion (approximately 3 to 5 feet) of the well riser is normally enclosed by an outer steel protective casing. Protective Casing - A steel cylinder or square protective sleeve extending approximately 3 to 5 feet into the ground, surrounding the well riser. In flush-mounted wells, the protective casing will extend only high enough so that the well and protective casing can be enclosed by a Christy box or equivalent vault. In above-grade wells, the protective casing will extend above the ground surface approximately 2 to 3 feet. The protective casing protects the well riser. 2.2 Associated Procedures P CDM Federal (CDM) SOP 4-1, Field Logbook Content and Control P CDM SOP 4-5, Field Equipment Decontamination at Nonradioactive Sites
A Technical Standard Operating Procedures Page 1 of 5 TSOP 1-6.31507

SOP 1-6 Water Level Measurement Revision: 6
Date: March 2007
2.3 Discussion The most common uses of static water level data are to determine the elevation of groundwater, the direction of groundwater flow, to identify areas of recharge and discharge, to evaluate the effects of manmade and natural stresses on the groundwater system, to define the hydraulic characteristics of aquifers, and to evaluate stream-aquifer relationships. Specific uses for water level data may include: P Determine the change in water level due to distribution or rate of regional groundwater withdrawal P Show the relationship of groundwater to surface water P Estimate the amount, source, and area of recharge and discharge P Determine rate and direction of groundwater movement Static water level measurements shall be obtained from each well before purging, sampling, or other disturbance of the water table. 3.0 General Responsibilities Project Manager - The project manager is responsible for ensuring that measurements are conducted in accordance with this procedure and any other SOP pertaining to site activities related to obtaining groundwater level measurements. Field Team Leader - The field team leader is responsible for ensuring that field personnel obtain water level measurements in accordance with this and other relevant procedures. Note: Responsibilities may vary from site to site. Therefore, all field team member responsibilities shall be defined in the field plan or site/quality assurance project plan (QAPP). 4.0 Required Equipment 4.1 General
P Site-specific plans P Field logbook
P Decontamination equipment and supplies, including rinse bottles and deionized water
P Indelible black ink pens P Tap water and large beaker or bucket P Permanent felt-tip marker (e.g., Sharpie) P Water level meter P Personal protective equipment
4.2 Measuring Devices The equipment required to obtain water level measurements is dependent on the type of procedure chosen. Measurements may be made with a number of different devices and procedures. Measurements are taken relevant to a permanent measurement point on the well riser. Electrical tapes are preferred over other devices such as steel tape because of the electrical tape's simplicity and ability to make measurements in a short period of time. Many types of electrical instruments have been devised for measuring water levels; most operate on the principle that a circuit is completed when two electrodes are immersed in water. Examples of electrical tapes that are frequently used include the Slope Indicator Co.® and Solinst® electronic water level indicators. These instruments are powered by batteries that shall be checked before mobilization to the field. Electrical tapes are coiled on a hand-cranked reel unit that contains the batteries and a signaling device that indicates when the circuit is closed (i.e., when the probe reaches the water). Electrodes are generally contained in a weighted probe that keeps the tape taut in addition to providing some shielding of the electrodes against false indications as the probe is being lowered into the hole. The electrical tapes are marked with 0.01-foot increments. Caution shall be exercised when using electrical tapes when the water contains elevated amounts of dissolved solids. Under these conditions, the signaling device will remain activated after the probe is removed from the water. When the water being measured contains very low amounts of dissolved solids, it is possible for the probe to extend several inches below the water level before activating the signaling device. Both of these conditions are related to the conductivity of the water and in some cases may be compensated for by the sensitivity control, if the device has this option. In groundwater with high conductivity the sensitivity control may need to be turned down, and in groundwater with low conductivity the sensitivity control may need to be turned up to get a proper depth to groundwater measurement.
A Technical Standard Operating Procedures Page 2 of 5 TSOP 1-6.31507

SOP 1-6 Water Level Measurement Revision: 6
Date: March 2007
5.0 Procedures 5.1 Preparation The following steps must be taken when preparing to obtain a water level measurement: P Assign a designated field logbook to record all field events and measurements according to CDM SOP 4-1. Document
any and all deviations from SOPs and site-specific plans in the logbook and include rationale for the changes. P Always exercise caution to prevent inappropriate or contaminated materials from entering an environmental well. P Standing upwind from the well, open the groundwater well. Monitor the well with a photoionization detector, flame
ionization detector, or equivalent vapor analyzer as soon as the cap is opened, as dictated by the site-specific health and safety plan.
For comparability, water level measurements shall always be referenced to the same vertical (elevation) datum marker, such as a U. S. Geological Survey (USGS) vertical and horizontal control point monument. The elevations calculated from the measurement of static water levels shall be referenced to mean sea level unless otherwise specified in the site-specific plans. The measurement point must be as permanent as possible, clearly defined, marked, and easily located. Frequently, the top of the PVC riser is designated as the measurement point. However, since the top of the riser is seldom smooth and horizontal, one particular point on the riser pipe shall be designated and clearly marked. This can be accomplished by marking a point on the top of the riser pipe with a permanent marker. To avoid spilling liquids into the well, paints or other liquid marking materials shall not be used. 5.2 Water Level Measurement Using Electrical Water Level Indicators The following steps must be followed when taking water level measurements using electrical tapes: P Before lowering the probe into the well, the circuitry shall be checked by dipping the probe in tap water and checking
to ensure that the signaling device responds to probe submergence. The probe shall then be lowered slowly into the well until contact with the water surface is indicated. The electrical tape reading is made at the measuring point. Take a second and third check reading to verify the measurement before completely withdrawing the tape from the well.
P Independent electrical tape measurements of static water levels using the tape shall agree within 0.01 foot for depths of
less than about 200 feet. At greater depths, independent measurements may not be this close. For a depth of about 500 feet, the maximum difference of independent measurement using the same tape shall be within 0.1 foot.
P Decontaminate the electrical tape according to CDM SOP 4-5 before proceeding to the next well to minimize cross
contamination. It may be necessary to check the electrical tape length with a graduated steel tape after the line has been used for a long period of time (at least annually) or after it has been pulled hard in attempting to free the line. Some electrical tapes, especially the single line wire, are subject to becoming permanently stretched. 5.3 Other Water Level Measurement Methods Although the method cited above (electrical water level indicator) for measuring water levels predominates in the environmental sector, there are a number of other methods available that may be well suited for a particular purpose. 5.3.1 Ultrasonic Method The ultrasonic method electronically measures the amount of time it takes a sound wave to reach and reflect off the water surface and return to the ground surface. These instruments contain electronic microprocessors, capable of performing this measurement many times each second. The actual depth to water, as calculated by the microprocessor, is an average of many individual readings.
A Technical Standard Operating Procedures Page 3 of 5 TSOP 1-6.31507

SOP 1-6 Water Level Measurement Revision: 6
Date: March 2007
5.3.2 Pressure Gauge Method This method, also called the air-line submergence method, uses a pressure gauge and is the preferred method for obtaining water level measurements in pumping wells. An air line constructed of semi-rigid tubing is inserted into the well below the water table. The tube end at the surface is connected to an air tank or compressor and pressure gauge. Filtered air is then forced through the tube and the resultant pressure is read in pounds per square inch (psi). This reading is converted to feet of water in the column and subtracted from the total tube length to give depth to water. Readings are then converted to groundwater elevation. Results are plotted on a field logging form. Calibration records and the exact procedures used must be maintained. 5.3.3 Acoustic Probe Method The acoustic probe is an electronic device containing two electrodes and a battery-powered transducer. The probe is attached to a tape. The probe is lowered into the well until a sound is detected, indicating the electrodes in the probe have contacted the water surface. This method is similar to the electrical probe method discussed in Section 5.2. 5.3.4 Continuous Recording Method The measurement of groundwater elevations within pumping or monitoring wells can be accomplished by the use of a mechanical or digital analog computerized continuous recording system and shall be performed according to specifications given by the manufacturer of each unit. In general, when using the mechanical or digital system, the pressure or electrical transducer is lowered into the well until it intersects the water surface. The actual depth to water is then measured by one of the methods described above and used to calibrate the continuous recorder. The necessary adjustments and preparations are then completed according to the specifications given for each type of continuous recorder. Proper maintenance of continuous recording devices during water level monitoring shall be performed such that continuous, permanent records are developed for the specified period of time. Records shall be stored on mechanical graph paper or on a microprocessor. Frequent calibrations of equipment shall also be made during monitoring periods of long duration in accordance with the manufacturers’ specifications. 6.0 Restrictions/Limitations 6.1 Groundwater and Miscible Fluids Where water is rapidly dripping or flowing into a well, either from the top of the well or from fractures, obtaining an accurate reading may not be possible. The effect of the water flowing into the well may interfere with an electronic water level measuring device, resulting in a false water level measurement. If water levels must be recorded in wells completed in aquifers that are recharging or discharging, the electronic water level indicator is the preferred measuring device, but shall be used with the awareness of possible false measurements. To minimize the effects of “splashing,” a 1-inch pipe (decontaminated for environmental wells) may be lowered into the pumping well into which the water level indicator would be inserted. This will minimize the effect of “splashing” until the probe contacts the groundwater and protect the probe from becoming tangled in pump wiring or well spacers associated with downhole equipment such as submersible pumps. 6.2 Immiscible Fluids For wells containing immiscible contaminants, the field personnel will need to use special procedures for the measurement of fluid levels. The procedure to follow will depend on whether layers are light immiscibles that form lenses floating on the top of the water table, or dense immiscibles that sink through the aquifer and form lenses over less permeable layers. In the case of light immiscibles, measurements of immiscible fluid and water levels cannot be accomplished by using normal techniques. A conventional electrical tape often will not respond to nonconducting immiscible fluids. Techniques have been specially developed to measure fluid levels in wells containing immiscible fluids, particularly petroleum products. A special paste or gel applied to the end of the steel tape and submerged in the well will show the top of the oil as a wet line and the top of the water as a distinct color change, or an interface probe can be used that will detect
A Technical Standard Operating Procedures Page 4 of 5 TSOP 1-6.31507

SOP 1-6 Water Level Measurement Revision: 6
Date: March 2007
the presence of conducting and nonconducting fluids. Thus, if a well is contaminated with low density, nonconducting immiscible fluids such as gasoline, the probe will first detect the surface of the gasoline, but it will not register electrical conduction. However, when the probe is lowered deeper to contact water, it will detect electrical conduction. Normally, a variation in an audible signal indicates the difference between phases. Both of these methods have disadvantages. These methods are less effective with heavier and less refined petroleum pro-ducts because the product tends to stick to the tape or probe, giving a greater product thickness measurement than it shall. Paste or gel cannot be used when sampling groundwater for the same constituents present in the paste or gel product. Note that water levels obtained in this situation are not suitable for determining hydraulic gradients without further interpretation. To use such data for determining hydraulic gradients, the difference in density between the light immiscible phase and water has to be considered. Measuring fluid levels in wells screened in lenses of dense immiscible fluids resting on a low permeability formation is somewhat easier, provided the immiscible fluid is nonconducting. The top of the dense layer can be identified by simply using an electrical sounder. As an electrical sounder passes from groundwater into the immiscible phase, the detection unit will deactivate because the fluid will no longer conduct electricity. A better method would be to use an interface probe as described above. The variation in the audible signal associated with the detection of differing phase liquids will also allow the user to obtain a groundwater depth and dense immiscible thickness measurement. 7.0 References Camp Dresser & McKee Inc., et al. 1991. Sampling and Analysis Procedures, Geophysical Survey Procedures. May. U. S. Environmental Protection Agency. 1987. A Compendium of Superfund Field Operations Methods. EPA/540/P-87/001. December. Weight, Willis D. and Sonderegger, John L., 2001. Manual of Applied Hydrogeology. Lewis Publishing Company. 187-190. Westinghouse Savannah River Company. 1997. Standard Operating Procedures Manual, 3Q5, Chapter 13, Revision 2,
ydrogeologic Data Collection Procedures and Specifications. October. H
A Technical Standard Operating Procedures Page 5 of 5 TSOP 1-6.31507


A Technical Standard Operating Procedures Page 2 of 6 TSOP 1-12_Low-Stress (Low-Flow) GW Sampling_7 2 09.docx
Low- Stress (Low-Flow) Groundwater Sampling SOP 1-12 Revision: 0 Date: June 2009
site-specific considerations and data quality objectives on a case-by-case basis. Water quality indicator parameters should be continuously monitored during low-flow purging using a flow-through cell, or in-line parameter monitoring techniques. Continuous indicator parameter monitoring is a critical component to low-flow groundwater sampling. Water quality indicator parameters include temperature, pH, oxidation-reduction potential (ORP), specific conductivity, dissolved oxygen (DO), and turbidity. The flow-through cell enables continuous collection of real-time parameters during low-flow purging. Stabilization is achieved after all parameters fall within established limits for three successive readings as discussed in Section 5. Stabilization of low-flow parameters is further discussed in Section 5.0 (Procedure) of this SOP. Advantages of low-flow groundwater sampling are: P Improved sample quality P Potentially reduced purging and sampling times P Reduced purge water volume 2.1 Associated Procedures P CDM Federal SOP 1-6, Water Level Measurement P CDM Federal SOP 4-5, Field Equipment Decontamination at Nonradioactive Sites P CDM Federal SOP 2-2, Guide to Handing of Investigation Derived Waste
3.0 General Responsibilities Site Manager - The site manager is responsible for ensuring that field personnel are trained in the use of this procedure and for verifying that well development and purging are carried out in accordance with this procedure. Field Team Leader - The field team leader is responsible for complying with this procedure. Note: Responsibilities may vary from site to site. Therefore, all field team member responsibilities shall be defined in the field plan or site-/project-specific quality assurance plan. 4.0 Required Equipment P Pump (including peristaltic pumps, bladder pumps, electrical submersible pumps, and gas-driven pumps as discussed
in Section 2.0 of this SOP) P Appropriate controller for selected pump type P For bladder pumps: Compressor and controller for the system(compressed non-reactive gas may also be used in lieu
of a compressor) P Power source (e.g., battery or generator), as required P Pump tubing (typically polyethylene with Teflon® lining).Note that portable bladder pumps require combination tubing
(for air and water); therefore the correct tubing sizes for the portable bladder pump should be verified. Additionally, peristaltic pumps require flexible tubing (silicone or Tygon) tubing for the pump head.
P Electronic water level meter or oil-water interface probe (according to CDM Federal SOP 1-6) P Water quality meter(e.g., YSI 600 Series) with a closed flow-through cell for continuous in-line measurement of
temperature, pH, conductivity, ORP, and DO prior to sample collection P Turbidity meter (Reporting in nephelometric turbidity units [NTUs]) P Standards for calibration and field check, as needed, of water quality and turbidity meters (as determined by
anticipated field conditions) P Volume measuring device to determine flow (e.g., graduated cylinder) P Stop watch P Tape measure P Personal protective equipment as specified in the site-specific health and safety plan P Polyethylene sheeting P Sample containers, including packaging supplies and all associated paperwork (e.g., chain of custody forms) as

A Technical Standard Operating Procedures Page 3 of 6 TSOP 1-12_Low-Stress (Low-Flow) GW Sampling_7 2 09.docx
Low- Stress (Low-Flow) Groundwater Sampling SOP 1-12 Revision: 0 Date: June 2009
required in the sampling plan and/pr CDM Federal SOP 2-1, Packaging and Shipping Environmental Samples. P Decontamination supplies, as required, according to CDM Federal SOP 4-5 P Disposal drums (e.g., 55-gallon Department of Transportation-approved) or other purge water storage container, if
required by the site-specific sampling plan P Photoionization detector (PID)/organic vapor monitor (OVM) or equivalent as specified in site-specific health and
safety plan Note that all sampling devices (bladders, pumps, and tubing) should be constructed of stainless steel, polyethylene, Teflon®, glass, or similar non-reactive materials. 5.0 Procedure The following steps must be followed for low-flow groundwater sampling activities: 1. Review site-specific health and safety plan, and site-specific project and sampling plans before initiating sampling
activities. 2. Review available existing data for site to evaluate approach to sampling site wells: prepare to sample site wells in the
order of least contaminated to most contaminated. Additionally, existing site data should be reviewed to determine anticipated hydrogeologic conditions and well completion details.
3. Prior to sampling, all sampling devices and monitoring equipment shall be calibrated according to manufacturer’s
recommendations and the site-specific sampling plan. Calibration of pH should be performed with at least two buffers which bracket the expected pH range. DO calibrations should be corrected for local barometric pressure readings and altitude.
4. Put on personal protective clothing and equipment as specified in the site-specific health and safety plan. 5. Open the well cover and check condition of the wellhead, including the condition of the surveyed reference mark, if any.
If no reference mark exists, create a reference mark on the north side of the well riser using a permanent marker or equivalent. Record the location of the reference mark in the field notes.
6. Monitor the air space at the wellhead for VOCs using a PID/OVM or equivalent immediately upon removal of the well
plug and as according to health and safety requirements. 7. Determine the depth to static water level in accordance with CDM Federal SOP 1-6, taking precautions to minimize
disturbance of the stagnant water column above the screened interval during water level measurement. Well depth should be obtained from review of the well completion logs or from previous work. Insertion of a water level measuring device to the bottom of the well casing will result in resuspension of settled solids from the formation surrounding the screened interval, thus requiring longer purging times for turbidity and other field parameter equilibration.
8. Dedicated sampling devices (those permanently installed in the well) capable of pumping and sampling are preferred
over any other type of device. Any portable sampling device should be slowly and carefully lowered to the middle of the screened interval or slightly above the middle to minimize excessive mixing of the stagnant water in the casing above the screen with the screened interval zone water, and to minimize resuspension of solids collected at the bottom of the well or in the surrounding formation within the screened interval.
9. New polyethylene tubing shall be used for each sample when using non-dedicated sampling equipment. Prepare the
pump and tubing for insertion into the well. Lower the pump intake down into the well casing. Connect the flow-though cell in-line with the pump effluent tubing.
10. Generally, the pump intake should be placed in the mid-point of the screened interval. However, if the geology of the
screened interval consists of heterogeneous materials with layers of contrasting hydraulic conductivity, the pump intake should be positioned adjacent to the zone of highest hydraulic conductivity (as determined via review of the existing site hydrogeologic conditions/well completion logs).)

A Technical Standard Operating Procedures Page 4 of 6 TSOP 1-12_Low-Stress (Low-Flow) GW Sampling_7 2 09.docx
Low- Stress (Low-Flow) Groundwater Sampling SOP 1-12 Revision: 0 Date: June 2009
11. To achieve low-flow purging conditions, the purge rate should generally not exceed 0.5 L/min. Adjust the pump control to stabilize the flow rate, and therefore minimize drawdown (less than 0.3 foot during purging activities). The water level in the well should be measured throughout the purging process to monitor drawdown. Flow rate can be measured from the discharge tube using a volumetric measuring device (e.g., a graduated cylinder) and a stop watch (Note: determine flow rate by measuring volume in 0.5-minute or 1-minute increments.)
12. Record water level measurements, and field parameters including pH, temperature, specific conductivity, oxidation
reduction potential (ORP), DO, turbidity, and flow rate every three to five minutes during the purging process. Record all measurements and observations in the log book or on a Groundwater Purging and Sampling Form. Purging shall continue until the field parameters have stabilized. Parameters are considered stable when three consecutive readings are within the limits of the criteria defined in Table 5.1 and/or in accordance with the site-specific sampling plan. Turbidity ideally should stabilize below 10 NTU prior to sample collection, particularly if groundwater samples are to be collected for metals or PCB analyses.
TABLE 5.1 Stabilization of Water Quality Indicator Parameters
Parameter Units Stabilization Criteria Water Level Feet/meters < 0.3 foot (< 0.1 meter) Temperature °F/°C ± 3 percent, or ±1.8 degrees Fahrenheit (°F) /±1 degree
Celsius (°C) pH (n/a) ± 10 percent, or ±0.1 standards units (SU)
Specific Conductivity μm/cm ±3 percent (microsiemens per centimeter, or μm/cm) ORP mV ±10 millivolts (mV)
Dissolved Oxygen mg/L ±10 percent, or 0.2 milligram per liter (mg/L) - whichever is greater
Turbidity NTU ± 1 Nephelometric Turbidity Unit (NTU) (±10 percent for turbidity if greater than 10 NTU)
Flow Rate L/min 0.1 to 0.5 Liters per minute (L/min) (< 1 L/min), Specific flow rates and sampling rates to be identified in the
sampling plan if project/contract required. 13. In low recharge aquifers, the following steps shall be followed: (1) If the initial water level is less than 10 feet above the top of the well screen, then purge the well until dry and allow
sufficient recharge to collect samples. (2) If the initial water level in the well is greater than 10 feet above the top of the screen, then care shall be taken to
prevent the dewatering of the screened interval during purging of the well. (2a) Continue purging until the water level is between 1 foot (0.3 meter) and 5 feet (1.5 meters) above the top of the screened interval. (2b) Allow the well to recharge, then continue purging until at least one full initial well volume has been purged. (3) Record all data, measurements, and observations in the log book.
14. After field parameters have stabilized, disconnect the flow through cell, and collect groundwater samples directly from
the discharge tubing into an appropriate sample container. If using a peristaltic pump to collect VOC samples, refer to item 16 of this SOP for the correct procedure for sampling VOCs with a peristaltic pump. If an in-line, flow-through cell is used to continuously monitor indicator parameters, it should be disconnected or bypassed during sample collection. During sample collection, maintain the pump rate at the same rate used during purging (unless specified in the sampling plan). The pump rate used during sample collection may need to be lowered to minimize aeration, bubble formation, or turbulent flow of water into sample bottles, or to prevent sample preservatives from being washed out of the sample container.
15. Groundwater sampling (including the collection of all required quality assurance/quality control samples specified in
the sampling plan) shall be performed immediately upon completion of purging (unless time for recharge is required for low-recharge wells) using the same equipment used for purging. Sampling should occur in a progression from the least to the most contaminated well, if this is known. Generally, volatile (e.g., solvents and fuel constituents) and gas sensitive (e.g., Fe2+, CH4, H2S/HS-, and alkalinity) analytes should be sampled first. The sequence in which samples

A Technical Standard Operating Procedures Page 5 of 6 TSOP 1-12_Low-Stress (Low-Flow) GW Sampling_7 2 09.docx
Low- Stress (Low-Flow) Groundwater Sampling SOP 1-12 Revision: 0 Date: June 2009
for most inorganic parameters are collected is immaterial unless filtered (dissolved) samples are required. Filtered samples should be collected last and in-line filters should be used. After all unfiltered samples have been collected, a 0.45 micron (µm) in-line filter shall be inserted in the discharge line for collection of filtered samples, as required.
16. VOC samples should not be collected directly from the discharge end of a peristaltic pump. After field parameters
have stabilized, and all other samples have been collected as required, stop the pump and simultaneously pinch the discharge end of the tubing shut. Disconnect the flow-through cell. Remove the tubing from the well and fill the VOC sample containers from the influent end of the sample tubing, (the end of the tubing that was located down-well during purging activities). The flow rate when filling sample vials may be controlled by setting the peristaltic pump in reverse.
17. Place all samples in a cooler with ice or ice packs to comply with project, laboratory, and/or regulatory requirements. 18. After sampling activities have been completed, remove the portable pump assembly from the well, if used, and
decontaminate all non-disposable components. Replace the well plug. Secure the well plug and well cover. Clean up the work area: containerize and/or dispose of purge water as required by the site-specific sampling plan, and dispose of tubing and all other disposable sampling equipment as investigation derived waste (DW) after each use as described in the site-specific sampling plan.
6.0 Restrictions/Limitations Only grounded electrical devices should be used for low-flow sampling activities. If a gasoline-powered electrical source is used, place portable power sources (e.g., generators) 50 feet (15 meters) or farther from the wellhead to prevent potential contamination of samples . Additionally, it should be clearly noted in the field notes or on the Groundwater Sampling Log (Attachment 1) if a well has been pumped dry and allowed to recharge prior to sample collection, as low-flow sampling data is no longer applicable. 7.0 References American Society for Testing and Materials (ASTM). January 2002. Standard Practice for Low Flow Purging and Sampling for Wells and Devices Used for Ground Water Quality Investigations, ASTM D-6771-02. Puls, R.W. and M.J. Barcelona. April 1996. Low-Flow (Minimal Drawdown) Ground Water Sampling Procedures. U.S. EPA, Ground Water Issue, Publication Number EPA/540/S-95/504. U. S. Environmental Protection Agency. May 2002. Groundwater Sampling Guidelines for Superfund and RCRA Project Managers. Ground Water Forum Issue Paper, EPA 542-S-02-001, OSWER, Technology Innovative Office, Washington, D.C.
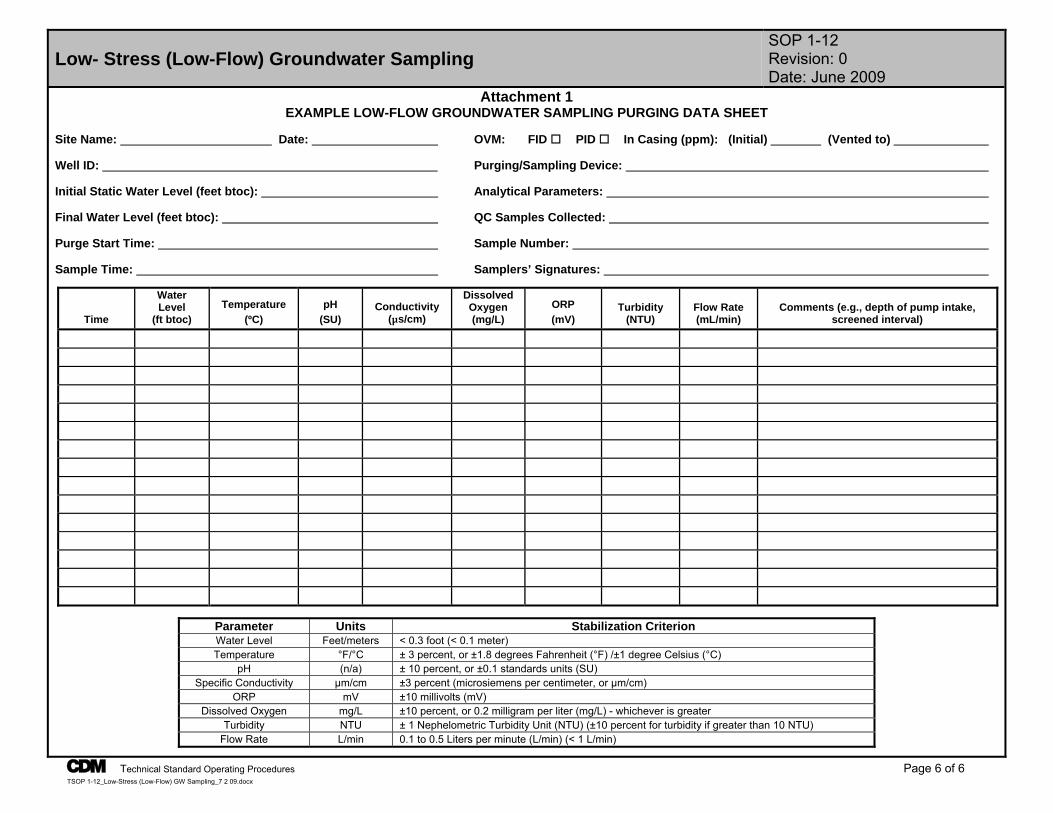
A Technical Standard Operating Procedures Page 6 of 6 TSOP 1-12_Low-Stress (Low-Flow) GW Sampling_7 2 09.docx
Low- Stress (Low-Flow) Groundwater Sampling SOP 1-12 Revision: 0 Date: June 2009
Attachment 1 EXAMPLE LOW-FLOW GROUNDWATER SAMPLING PURGING DATA SHEET
Site Name: Date: OVM: FID PID In Casing (ppm): (Initial) (Vented to) Well ID: Purging/Sampling Device: Initial Static Water Level (feet btoc): Analytical Parameters: Final Water Level (feet btoc): QC Samples Collected: Purge Start Time: Sample Number: Sample Time: Samplers’ Signatures:
Time
Water Level
(ft btoc) Temperature
(ºC) pH
(SU) Conductivity
(μs/cm)
Dissolved Oxygen (mg/L)
ORP (mV)
Turbidity (NTU)
Flow Rate (mL/min)
Comments (e.g., depth of pump intake, screened interval)
Parameter Units Stabilization CriterionWater Level Feet/meters < 0.3 foot (< 0.1 meter) Temperature °F/°C ± 3 percent, or ±1.8 degrees Fahrenheit (°F) /±1 degree Celsius (°C)
pH (n/a) ± 10 percent, or ±0.1 standards units (SU) Specific Conductivity μm/cm ±3 percent (microsiemens per centimeter, or μm/cm)
ORP mV ±10 millivolts (mV) Dissolved Oxygen mg/L ±10 percent, or 0.2 milligram per liter (mg/L) - whichever is greater
Turbidity NTU ± 1 Nephelometric Turbidity Unit (NTU) (±10 percent for turbidity if greater than 10 NTU) Flow Rate L/min 0.1 to 0.5 Liters per minute (L/min) (< 1 L/min)

Well Development and Purging SOP 4-3 Revision: 5 Date: March 2007
Prepared: Del R. Baird Technical Review: John Hofer
QA Review: Jo Nell Mullins Approved:
E-Signed by Michael C. MalloyVERIFY authenticity with ApproveIt
Issued:
E-Signed by P. Michael SchwanVERIFY authenticity with ApproveIt
Signature/Date
Signature/Date 1.0 Objective The purpose of this standard operating procedure (SOP) is to define the procedural requirements for well development and purging. 2.0 Background Monitoring wells are developed to repair damage to the formation caused by drilling activities and to settle and remove fines from the filter pack. Wells shall not be developed for at least 24 to 48 hours after completion when a cement bentonite grout is used to seal the annular space; however, wells may be developed before grouting if conditions warrant. Wells are purged immediately before groundwater sampling to remove stagnant water and to sample representative groundwater conditions. Wells shall be sampled within 3 hours of purging (optimum) to 24 hours after purging (maximum, for low recharge conditions). 2.1 Associated Procedures P CDM Federal SOP 1-6, Water Level Measurement P CDM Federal SOP 4-5, Field Equipment Decontamination at Nonradioactive Sites 3.0 General Responsibilities Site Manager - The site manager is responsible for ensuring that field personnel are trained in the use of this procedure and for verifying that development and purging are carried out in accordance with this procedure. Field Team Leader - The field team leader is responsible for complying with this procedure. Note: Responsibilities may vary from site to site. Therefore, all field team member responsibilities shall be defined in the field plan or site-/project-specific quality assurance plan. 4.0 Required Equipment P Pump, pump tubing, or bailer and rope or wire line P Power source (e.g., generator), if required P Electronic water-level meter P Temperature, conductivity, pH, and turbidity meters P Personal protective equipment as specified in the site-specific health and safety plan P Decontamination supplies, as required, according to CDM Federal SOP 4-5, Field Equipment Decontamination at
Nonradioactive Sites P Disposal drums, if required P Photoionization detector (PID) or equivalent as specified in site-specific health and safety plan
A Technical Standard Operating Procedures Page 1 of 4 TSOP 4-3.31907

SOP 4-3 Well Development and Purging Revision: 5
Date: March 2007
[ ]
5.0 Procedures 5.1 Well Development The following steps must be followed when developing wells: 1. Review site-specific health and safety plan and project plans before initiating sampling activity. 2. Don personal protective clothing and equipment as specified in the site-specific health and safety plan. 3. Open the well cover and check condition of the wellhead, including the condition of the surveyed reference mark, if any. 4. Monitor the air space at the wellhead, using a PID or equivalent, as soon as well cover is removed according to health
and safety requirements. 5. Determine the depth to static water level and depth to bottom of the well. 6. Prepare the necessary equipment for developing the well. There are a number of techniques that can be used to
develop a well. Some of the more common methods are bailing, overpumping, backwashing, mechanical surging, surge and pump, wire brush, swabbing, and high-velocity jetting. All of these procedures are acceptable; however, final approval of the development method rests with the appropriateness of a specific method to the site and the client.
7. For screened intervals longer than 10 feet (3 meters [m]), develop the well in 2- or 3-foot (0.75- or 1-m) intervals from
bottom to top. This will ensure proper packing of the filter pack. 8. Continue well development until produced water is clear and free of suspended solids, as determined by a turbidity
meter or when pH, conductivity, and temperature have stabilized. Record pertinent data in the field logbook and on appropriate well development forms. Remove the pump assembly or bailers from the well, decontaminate (if required), and clean up the area. Lock the well cover before leaving. Containerize and/or dispose of development water as required by the site-specific plans.
5.2 Volumetric Method of Well Purging The following steps shall be followed when purging a well by the volumetric method: 1. Review site-specific health and safety plan and project plans before initiating sampling activity. 2. Don personal protective clothing and equipment as specified in the site-specific health and safety plan. 3. Open the well cover and check condition of the wellhead, including the condition of the surveyed reference mark, if any. 4. Monitor the air space at the wellhead, using a PID or equivalent, as soon as well cover is removed according to health
and safety requirements. 5. Determine the depth to static water level and depth to bottom of well casing according to CDM Federal SOP 1-6, Water
Level Measurement. Calculate the volume of water within the well bore using the following formula (or equivalent): D²π 7.4805 (4) dH = volume (in gallons)
where D = casing diameter in feet. (Note: This equation is used for grouted wells with short screens. For wells with long
screens and/or ungrouted wells, the D = borehole diameter in feet). dH = the distance from well bottom to static water level in feet. π = 3.1416.
Note: Record all data and calculations in the field logbook.
A Technical Standard Operating Procedures Page 2 of 4 TSOP 4-3.31907

SOP 4-3 Well Development and Purging Revision: 5
Date: March 2007
6. Prepare the pump and tubing, or bailer, and lower it into the casing. 7. Remove the number of well volumes specified in the site-specific plans. Generally, three to five well volumes will be
required. Conductivity, pH, temperature, and turbidity shall be measured and recorded. Purging shall continue until the field parameters have stabilized. Groundwater quality parameters are considered stable when three consecutive readings are within ± 0.1 for pH, ±3 percent for conductivity, ±10 mv for redox potential (ORP), and ±10 percent for turbidity if greater than 10 NTU, in accordance with site-specific plans. Efforts shall be made to get turbidity below 10 NTU, especially if groundwater samples are to be collected for metals or PCB analyses.
8. In low recharge aquifers, the following steps shall be followed: (1) If the initial water level is less then 10 feet above
the top of the screen, then purge to dryness and allow sufficient recharge to collect samples. (2) If initial water level in the well is more than 10 feet above the top of the screen, then care shall be taken to prevent the dewatering of the screened interval. (3) Continue purging until the water level is between 1 and 5 feet above the top of the screen. (4) Allow well to recharge then continue purging until at least 1 full initial well volume has been purged. (5) Record pertinent data in the field logbook.
9. Groundwater sampling shall be performed immediately upon completion of purging (unless time for recharge is
required for low-recharge wells) using the same equipment that was used for purging. Unfiltered samples shall be collected first, beginning with volatiles organic compounds (VOCs). After all unfiltered samples have been collected, a 0.45 micron in-line filter shall be installed in the discharge line for collection of filtered samples, if required.
10. After sampling activities have been completed, remove the pump assembly or bailer from the well, decontaminate it
(if required), and clean up the site. Lock the well cover before leaving. Containerize and/or dispose of development water as required by the site-specific plan.
5.3 Indicator Parameter Method of Well Purging 1. Review site-specific health and safety plan and project plans before initiating sampling activity. 2. Don personal protective clothing and equipment as specified in the site-specific health and safety plan. 3. Open the well cover and check the condition of the wellhead, including the condition of the surveyed reference mark,
if any. 4. Monitor the air space at the wellhead, using a PID or equivalent, as soon as well cover is removed according to
health and safety requirements. 5. Determine the depth to static water level and depth to bottom. Set up surface probe(s), (e.g., pH, conductivity) at the
discharge orifice or dedicated probe port of the pump assembly or within the flow-through chamber. Allow probe(s) to equilibrate according to manufacturer’s specifications. Record the equilibrated readings in the field logbook.
6. Assemble the pump and tubing, or bailer, and lower into the casing. 7. Begin pumping or bailing the well. Record indicator parameter readings for every 5 minutes or purge volume,
whichever is quicker. Maintain a record of the approximate volumes of water produced. Care shall be taken to minimize drawdown (0 to 0.2 feet).
8. Continue pumping or bailing until indicator parameter readings remain stable within ± 0.1 for pH, ±3 percent for
conductivity, ±10 mv for redox potential (ORP), and ±10 percent for turbidity if greater than 10 NTU for three consecutive recording intervals and a minimum of 1 well volume is removed, or in accordance with site-specific plans. Purging shall continue until the discharge stream is clear or turbidity becomes asymptotic-low or meets project requirements.
A Technical Standard Operating Procedures Page 3 of 4 TSOP 4-3.31907
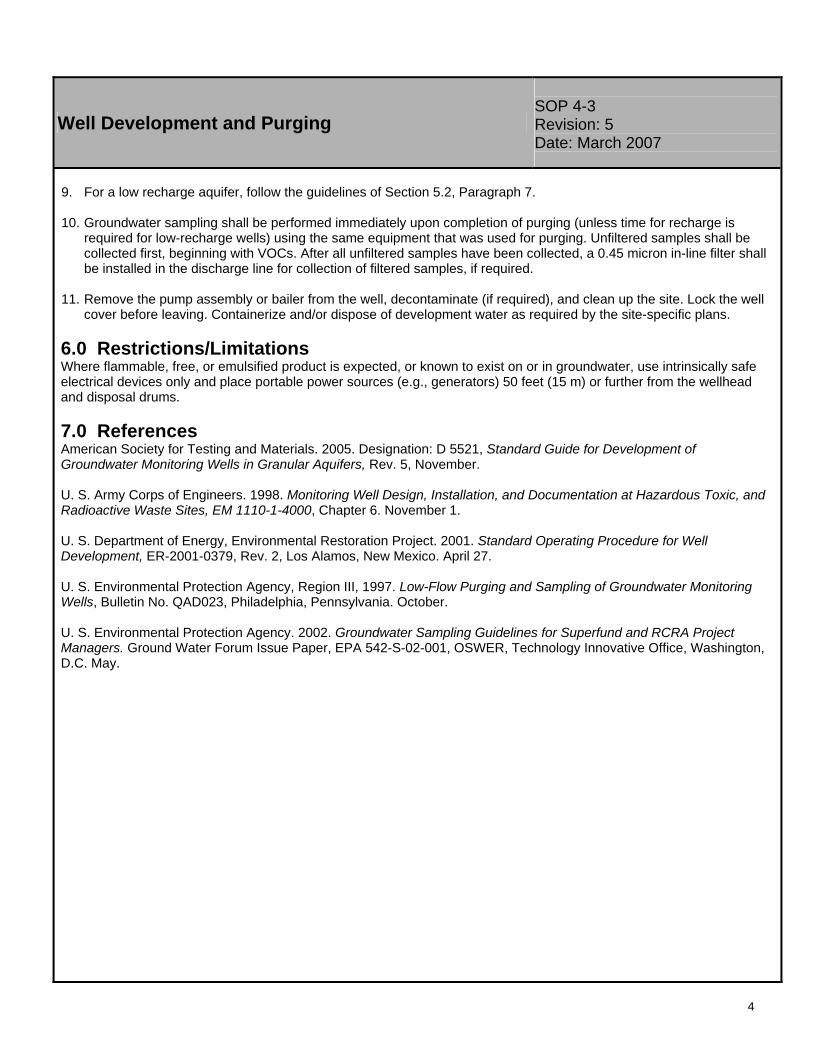
SOP 4-3 Well Development and Purging Revision: 5
Date: March 2007
9. For a low recharge aquifer, follow the guidelines of Section 5.2, Paragraph 7. 10. Groundwater sampling shall be performed immediately upon completion of purging (unless time for recharge is
required for low-recharge wells) using the same equipment that was used for purging. Unfiltered samples shall be collected first, beginning with VOCs. After all unfiltered samples have been collected, a 0.45 micron in-line filter shall be installed in the discharge line for collection of filtered samples, if required.
11. Remove the pump assembly or bailer from the well, decontaminate (if required), and clean up the site. Lock the well
cover before leaving. Containerize and/or dispose of development water as required by the site-specific plans. 6.0 Restrictions/Limitations Where flammable, free, or emulsified product is expected, or known to exist on or in groundwater, use intrinsically safe electrical devices only and place portable power sources (e.g., generators) 50 feet (15 m) or further from the wellhead and disposal drums. 7.0 References American Society for Testing and Materials. 2005. Designation: D 5521, Standard Guide for Development of Groundwater Monitoring Wells in Granular Aquifers, Rev. 5, November. U. S. Army Corps of Engineers. 1998. Monitoring Well Design, Installation, and Documentation at Hazardous Toxic, and Radioactive Waste Sites, EM 1110-1-4000, Chapter 6. November 1. U. S. Department of Energy, Environmental Restoration Project. 2001. Standard Operating Procedure for Well Development, ER-2001-0379, Rev. 2, Los Alamos, New Mexico. April 27. U. S. Environmental Protection Agency, Region III, 1997. Low-Flow Purging and Sampling of Groundwater Monitoring Wells, Bulletin No. QAD023, Philadelphia, Pennsylvania. October. U. S. Environmental Protection Agency. 2002. Groundwater Sampling Guidelines for Superfund and RCRA Project Managers. Ground Water Forum Issue Paper, EPA 542-S-02-001, OSWER, Technology Innovative Office, Washington, D.C. May.
A Technical Standard Operating Procedures Page 4 of 4 TSOP 4-3.31907

Appendix B


Appendix C

Well ID Date PCE TCE cis-DCE trans-DCE VC pH Temp oC SC (uS)Redox (mv)
Turbidity (NTU)
DO (ppm)
Ferr
ous
Iron
Nitrate Ethane Ethene Methane Chloride Sulfate Nitrate as N COD Alkalinity Sulfide TOC
mg/L mg/L mg/L mg/L mg/L mg/L mg/L mg/L mg/L mg/L mg/L mg/L mg/L mg/L mg/L mg/L mg/L mg/L
RW-1 Oct-99 ND 39 3.7 ND 1.4VERMW1 Oct-99 ND ND ND ND ND
RU-4 Oct-00 ND 130 4.6 0.11 1.1 9.39 19 1244RU-4 Sep-01 ND 310 9.7 ND NDRU-4 Sep-07 ND 120 6.1 ND 2.2 7.24 24.5 1169.0 115 56.3 5.37RU-4 Nov-11 0.140 E 150 16 0.2 2.7 6.39 14.49444 2116 154.2 17.1 3.47 0.06 0 0.2 0.27 J 0.9 566 56.6 0.025 J 41.8 342 ND 5.8
RU-5 Oct-00 0.019 54 0.17 0.05 0.033RU-5 Sep-01 ND 24 0.15 ND NDRU-5 Sep-07 ND 5.5 0.22 0 0.045 7.07 21.0 1371.0 150 ERROR 5.57RU-5 Dec-11 0.100 E 80 0.27 0.011 0.013 6.49 16.62 618 -131.5 31.3 3.07 0 0
UC4 Dec-04 ND 0.010 ND ND NDUC-4 Sep-07 ND 0.01900 0.00084 ND ND 7.49 20.3 841.2 139 10.7 3.71UC-4 Nov-11 ND 0.055 0.0018 ND ND 8.53 14.43 870 161.5 60.1 0.8 0.01 0 ND ND 0.00023 J 165 38.9 1.4 ND 221 ND 0.47 J
UC-5 Dec-04 ND 0.064 ND ND NDUC-5 Sep-07 ND ND 0.0044 ND ND 7.13 12.8 660.0 174 19.7 2.67UC-5 Nov-11 ND 0.095 0.00093 J ND ND 7.28 9 375 196.5 56.7 2.5 0.07 0 ND ND 0.00023 J 109 39.9 0.056 J ND 205 ND 0.56 J
Chlorinated Compounds Field Pameters Natural Attenuation Parameters
0
50
100
150
200
250
300
350
Oct
-00
May
-01
Dec
-01
Jul-0
2
Feb-
03
Sep-
03
Apr
-04
Nov
-04
Jun-
05
Jan-
06
Aug
-06
Mar
-07
Oct
-07
May
-08
Dec
-08
Jul-0
9
Feb-
10
Sep-
10
Apr
-11
Nov
-11
mg/
L
RU-4
TCE
cis-DCE
VC
0
10
20
30
40
50
60
70
80
90
Oct
-00
May
-01
Dec
-01
Jul-0
2
Feb-
03
Sep-
03
Apr
-04
Nov
-04
Jun-
05
Jan-
06
Aug
-06
Mar
-07
Oct
-07
May
-08
Dec
-08
Jul-0
9
Feb-
10
Sep-
10
Apr
-11
Nov
-11
mg/
L
RU-5
TCE
cis-DCE
VC
0.000
0.010
0.020
0.030
0.040
0.050
0.060
Jan-04 Jan-05 Jan-06 Jan-07 Jan-08 Jan-09 Jan-10 Jan-11
mg/
L
UC-4
TCE
cis-DCE
VC
0
0.01
0.02
0.03
0.04
0.05
0.06
0.07
0.08
0.09
0.1
Jan-04 Jan-05 Jan-06 Jan-07 Jan-08 Jan-09 Jan-10 Jan-11
mg/
L
UC-5
TCE
cis-DCE
VC