Embed Size (px)
Citation preview

PAPERS
In Search of a Perceptual Metric for Timbre:Dissimilarity Judgments among Synthetic Sounds
with MFCC-Derived Spectral Envelopes
HIROKO TERASAWA,1,2 AES Member([email protected])
, JONATHAN BERGER3
([email protected]), AND SHOJI MAKINO1
1Life Science Center of TARA, University of Tsukuba 1-1-1 Tennodai, Tsukuba, Ibaraki 305-8577, Japan2JST, PRESTO (Information Science and Humans) 7 Gobancho, Chiyoda-ku, Tokyo 102-0076, Japan
3CCRMA, Department of Music, Stanford University 660 Lomita Drive, Stanford, CA 94305, USA
This paper presents a quantitative metric to describe the multidimensionality of spectralenvelope perception, that is, the perception specifically related to the spectral element of tim-bre. Mel-cepstrum (Mel-frequency cepstral coefficients or MFCCs) is chosen as a hypotheticalmetric for spectral envelope perception due to its desirable properties of linearity, orthogonality,and multidimensionality. The experimental results confirmed the relevance of Mel-cepstrumto the perceived timbre dissimilarity when the spectral envelopes of complex-tone syntheticsounds were systematically controlled. The first experiment measured the perceived dissim-ilarity when the stimuli were synthesized by varying only a single coefficient from MFCC.Linear regression analysis proved that each of the 12 MFCCs has a linear correlation withspectral envelope perception. The second experiment measured the perceived dissimilaritywhen the stimuli were synthesized by varying two of the MFCCs. Multiple regression analysisshowed that the perceived dissimilarity can be explained in terms of the Euclidean distance ofthe MFCC values of the synthetic sounds. The quantitative and perceptual relevance betweenthe MFCCs and spectral centroids is also discussed. These results suggest that MFCCs canbe a metric representation of spectral envelope perception, where each of its orthogonal basisfunctions provides a linear match with human perception.
0 INTRODUCTION
The spectral envelope of a sound is a crucial aspect oftimbre perception. In this study, we propose a quantitativemodel of spectral envelope perception, that is, the spectralelement in the timbre perception, with a set of orthogo-nal basis functions. The goal of this work is to developa quantitative mapping between a physical description ofthe spectral envelope and its perception, with the purposeof controlling timbre in sonification in a meaningful andreliable way. The model suggests a systematic descriptionof spectral envelope perception whose simplicity may beseen as analogous to the three primary colors in the visualsystem.
In the earliest studies of timbre perception, Helmholtzspeculated that the spectral envelope is the source of thetimbre variations [1]. For speech sounds, the formant struc-ture of the overtone series was determined to be the key fac-tor in differentiating vowels [2], [3]. For Western musical-instrument sounds, timbre perception has often been de-scribed in terms of the spectral centroid, spectral flux, and
attack time [4]–[7]. In addition to these factors, other factorssuch as amplitude and frequency micromodulations and in-harmonicity are also taken into account [8]. Although thesedescriptive studies can address the relationship betweenthe physical aspects of sound and the perception, more in-formation on the precise shape of the spectral envelope isoften needed to synthesize sounds in a controlled way. Inother words, although there are multiple layers (i.e., per-ceptual, cognitive, physical, and social perspectives) in ad-dressing sound quality [9], understanding at one layer doesnot necessarily lead to the improvement at another layer.Recent studies on morphed instrumental sounds employedthe time-varying multiband approach to evaluate the per-ception of the synthesized timbre, connecting these multiplelayers [10]–[12].
A robust quantitative model for timbre perception hasbeen long desired for the control of timbre in sound syn-thesis, especially in relation to the use of sound in audi-tory displays of information. To take full advantage of themultidimensionality of timbre in sonification, we need aquantitative, multidimensional description for spectral
674 J. Audio Eng. Soc., Vol. 60, No. 9, 2012 September

PAPERS IN SEARCH OF A PERCEPTUAL METRIC FOR TIMBRE
envelope perception. Such a model allows reliable map-pings of data to perceptual space, which is critical for ef-fective sonification [13]. Many researchers have concep-tualized spectral envelope perception by analogy with thevisual color system, by finding an orthogonal basis in thespectral shapes of instrumental sounds [14], by propos-ing the concept of sound color [15], and by visualizingorgan sounds as an energy-balance transition across threefrequency regions [16].
In this work, we aim for a simple, quantitative, and mul-tidimensional model that can be extended to synthesizeperceptually meaningful variations of spectral envelopes.Ideally, such a model will predict the spectral envelopeperception in a linear and orthogonal manner; each orthog-onal basis should have a quantitative label that can linearlyrepresent the perceived difference, and the perception of acomplex spectral envelope could be explained in terms ofthe superposition of these basis functions.
Seeking such a model for spectral envelope perception,we chose the Mel-cepstrum (also known as Mel-frequencycepstrum coefficients or MFCCs) for the following rea-sons: (1) MFCCs are constructed by a set of orthogonalbasis functions, therefore satisfying the need for an orthog-onal model; (2) MFCCs are based on perceptually relevantscalings, which can provide a linear mapping between thenumeric description and the perception; and (3) MFCCshave been a powerful front-end tool for many engineeringapplications, and clarifying the perceptual characteristicsof MFCCs by performing psychoacoustic experiments isvaluable.
The Mel-cepstrum was originally proposed as “the de-scription of short-term spectra ... in terms of the contributionto the spectrum of each of an orthogonal set of spectrum-shape functions” [17]. The Mel-cepstrum is computed byapplying a discrete cosine transform (DCT) to the outputof a simple auditory filterbank that roughly resembles crit-ical bands. Unlike other representations of spectral enve-lope, such as the 1/3-octave-band models or specific loud-ness, the basis functions of a Mel-cepstrum are mathemat-ically orthogonal. Mermelstein noted that a Mel-cepstrumcan constitute a distance metric that reflects the percep-tual space of phonemes [18] and examined its efficiencyas a front end for automatic speech recognition [19]. Nowit is considered to be the classic front-end algorithm forautomatic speech recognition [20]. Its application has beenextended to timbre-related music information retrieval [21],[22], sound database indexing based on timbre characteris-tics [23], [24], timbre control for sonification [25], percep-tual description of instrumental sound morphing [26], anda proposal that timbre perception be represented in termsof sound color and sound density [27].
Despite such numerous applications, the authors’ earlierworks were the first to examine the Mel-cepstrum’s percep-tual characteristics with psychoacoustic experiment proce-dures [28]–[30], and, before that, the perceptual relevanceof MFCCs was demonstrated only by applications. There-fore, it is worthwhile to examining the perceptual charac-teristics of MFCCs in detail using psychoacoustic experi-ments. Still, Mel-cepstrum is not the most precise auditory
model. Other perceptual models, such as specific loudness[31], the spatiotemporal receptive-field model [32], andthe Mellin transform [33] may seem to be better options.However, these models do not consist of orthogonal basisfunctions, and they are not necessarily a compact algorithmthat enables efficient analysis and synthesis of timbre. Forthese reasons, MFCCs were considered the most suitablefor a spectral envelope perception model.
We employed the following framework to test this model.We first synthesized a stimulus set with gradually changingspectral envelopes by varying the Mel-cepstrum values in astepwise order, while keeping the temporal characteristicsconstant across the stimuli. The participants listened to thestimuli in pairs and provided dissimilarity ratings. Finally,the relationship between the dissimilarity ratings and theEuclidean distance of the MFCC values was analyzed witha linear regression.
To measure spectral envelope perception, the temporalcharacteristics of the stimuli must be strongly controlledbecause the temporal structure has a strong effect on timbreperception. To control this effect, we decided to use thesame temporal structure for all of the stimuli. Although itmight seem more interesting to employ various kinds oftemporal structures in a single experiment, it would notallow us to observe the multidimensionality of spectral en-velope perception accurately. In musical instrument timbrestudies, Plomp detected three dimensions for spectral en-velope perception when he minimized the variation in thetemporal structure [14], whereas other researchers detectedonly a single dimension (spectral centroid) dedicated solelyto the spectral envelope, in addition to another spectro-temporal dimension (spectral flux) when they introducedvarious temporal structures [4]–[7]. Therefore, we decidedto maintain a single kind of temporal structure for the entirestimuli set.
In designing the temporal structure of the stimuli, wewanted to create tones with a distinct quality that helpedthe participants make reliable judgments. For this purpose,the stimuli are desirably sustained and have the fewest ran-dom factors. The simplest design that satisfies this crite-rion is obviously the addition of sinusoids in a harmonicseries. But this design has an unwanted effect: when thespectral envelope is manipulated, the amplified partialsare perceived as obtrusive and separated from the otherpartials.
To avoid this perceptual segregation, we added a vibrato-like frequency modulation to all the harmonics, so that allof the partials contribute to a unified tone thanks to the“common fate” effect [34]. With this vibrato, the synthe-sized sounds exhibited a voice-like quality that is morenatural than sinusoid beeps. Because parameter-mappingsonification can sound unpleasant [35], such naturalnessis valuable. As already shown in voice-based sonificationprojects, voice-like qualities often facilitate the compre-hension of data [36], [37]. However, stimuli with vibratomay be unacceptable for the experiment because vibratomight influence spectral envelope perception due to its dra-matic musical effect, which is particular to Western operaticsinging. But, in fact, adding vibrato to a voice does not
J. Audio Eng. Soc., Vol. 60, No. 9, 2012 September 675

TERASAWA ET AL. PAPERS
change the perceived vowel [38], and people can distin-guish subtle changes in the spectral envelope of the toneswith vibrato [39]. This means that adding vibrato does notinterfere with the perception of the spectral envelope andthat, therefore, the use of vibrato for the experiment stim-uli is acceptable. Furthermore, we expect that the inclusionof vibrato implies a musical setting and encourages theparticipants to engage in “musical listening” with greaterattention to timbre.
Using these stimuli, we conducted two experiments inthe experimental framework described above: the first wasdesigned to test the perceptual effect when modifying asingle dimension from MFCC, and the second to test theorthogonality of the timbre space using two dimensionsfrom MFCC. We used linear regression to analyze our databecause we were explicitly investigating the relationshipbetween MFCC and subjective ratings, rather than explor-ing unknown dimensions that could be discovered with themultidimensional scaling (MDS) method.
This paper aims to show (1) that there is a linear re-lationship between each of the Mel-cepstrum orthogonalfunctions and the perceived timbre dissimilarity, (2) that themultidimensionality of complex spectral envelope percep-tion can be explained in terms of the Euclidean distance ofthe orthogonal function coefficients, and (3) that the widelyused Mel-cepstrum can form a valid representation of spec-tral envelope perception. However, the multidimensionalityof spectral envelope perception beyond two dimensions andthe temporal aspect of timbre perception remain outside thescope of this study.
In the following sections, we describe the method weused to synthesize the stimuli while varying the MFCCvalues in a controlled way. We describe our two experimentson spectral envelope perception and their result followed bya discussion and our conclusion.
1 MFCC-BASED SOUND SYNTHESIS
1.1 Mel-CepstrumThe MFCC is the DCT of a modified spectrum, in which
its frequency and amplitude are scaled logarithmically. Ofthe various implementations that exist, the Mel-cepstrumalgorithm from Auditory Toolbox [40] was employed. Thespectrum is first processed with a filterbank of 32 chan-nels, which roughly approximate the spacing and band-width of the auditory system’s critical bands. The frequencyresponse of the filterbank Hi(f) is shown in Fig. 1, and thepassband of each triangular window Hi(f) is shown in Eq.(1). The amplitude of each filter is normalized so that eachchannel has unit power gain.
Bandwidth (Hi ) =⎧⎨⎩
200.0 (i = 1)133.3 (1 < i ≤ 13).1000 · 1.072i−13 (i > 13)
(1)
The filterbank, whose triangular frequency response isshown in Fig. 1, is applied to the sound in the frequency
0.2 0.5 1 20
0.005
0.01
0.015
frequency (kHz)
ampl
itude
Fig. 1. Frequency response of the filterbank used for the MFCC.The sound spectrum is first processed with this filterbank, whichroughly approximates the characteristics of auditory criticalbands. Taking the lower coefficients from the DCT of this fil-terbank output yields MFCC.
domain, and provides the filterbank output, Fi:
Fi =∫ fi ·high
f = fi ·low
Hi ( f ) · S( f ) df, (2)
where i is the channel number in the filterbank, f is thefrequency, Hi(f) is the filter response of the ith channel, andS(f) is the absolute value of the discrete Fourier transformof a signal. fi·low and fi·high denote the lowest and highest fre-quency bins, respectively, of the passband of the ith channelfilter.
The MFCCs, Ci, are computed by taking the DCT of thelog-scaled filterbank output:
Li = log10(Fi ), (3)
Cn = wn
I∑i=1
Li · cosπ(2i − 1) · (n − 1)
2I, (4)
where w0 = 1/√
I , wn = √2/I for 1 ≤ n ≤ N − 1. I and N
represent the total number of filters and the total number ofMel-cepstrum coefficients, respectively. Taking 13 lowercoefficients from Cn, the set of coefficients from C0 toC12 is called the MFCC which summarizes the spectralenvelope.
1.2 Sound SynthesisThe sound synthesis for the stimuli has two stages: (1)
the spectral envelope is created by the pseudo-inverse trans-form of the Mel-cepstrum, and (2) an additive synthesis ofsinusoids is performed using the spectral envelope gener-ated earlier.
1.2.1 Pseudo-Inversion of MFCCAs described above, the MFCC takes only the 13 lower
coefficients, and therefore it is a lossy transform from aspectrum. The inversion of the MFCC is not possible ina strict sense. This section describes the pseudo-inversion
676 J. Audio Eng. Soc., Vol. 60, No. 9, 2012 September

PAPERS IN SEARCH OF A PERCEPTUAL METRIC FOR TIMBRE
of the MFCC, which generates a smooth spectral envelopefrom a given Mel-cepstrum.
The generation of the spectral envelope starts with agiven array of Mel-cepstrum coefficients Cn, which is anarray of 13 coefficients. The reconstruction of the spectralshape from the MFCC starts with the inverse discrete cosinetransform (IDCT) and amplitude scaling:
L i =N∑
n=1
wn · Cn · cosπ(2i − 1) · (n − 1)
2I, (5)
Fi = 10L i . (6)
In this pseudo-inversion, the reconstructed filterbank out-put Fi is considered to represent the value of the recon-structed spectral envelope S( f ) at the center frequency ofeach channel from the filter bank,
S( fi ) = Fi , (7)
where fi is the center frequency of the ith auditory filter.Therefore, to obtain a reconstruction of the entire spec-trum, S( f ), a linear interpolation was applied to the valuesbetween the center frequencies S( fi ).
1.2.2 Additive SynthesisThe voice-like stimuli used in this study are synthesized
using additive sinusoidal synthesis. The reconstructed spec-tral envelope S( f ) determines the amplitude of each sinu-soid. A slight amount of vibrato is added to give somecoherence and life to the resulting sound.
In the synthesis, a harmonic series is prepared, and thelevel of each harmonic is weighted based on the desiredsmooth spectral shape. The pitch, or fundamental frequencyf0, is set at 200 Hz, with the frequency of the vibrato v0 setat 4 Hz and the sampling rate at 8 kHz.
Using the reconstructed spectral shape S( f ), the additivesynthesis of the sound is accomplished as follows:
s(t) =Q∑
q=1
S( finst(q, t)) · sin(2πq f0t + 1 − q cos 2πv0t),
(8)
where q specifies the qth harmonic of the harmonic se-ries. The total number of harmonics Q is 19, and all theharmonics stay under the Nyquist frequency of 4 kHz. Theamplitude of each harmonic is determined by using a lookuptable of S( f ) and the instantaneous frequency finst, whichis defined as follows:
finst(q, t) = q f0 + qv0 · sin 2πv0t. (9)
The fundamental frequency f0 = 200 (Hz) is determinedfrom the range of 180–230 Hz (the fundamental frequencyof the female voice), so that the MFCC of the resultingsound maintains the intended stepwise or grid structure thebest.
The duration of the resulting sound s is 0.75 s. For the first30 ms of the sound, its amplitude is linearly fading in, andfor the last 30 ms, its amplitude is linearly fading out. Allthe stimuli are scaled with an identical scaling coefficient.
The specific loudness [31] of all the stimuli showed a verysmall variance, and their loudness was considered to befairly similar within the stimuli set. For all of the 144 stimulisynthesized for this study, 123 stimuli scored under 3%, 10stimuli scored 3–6%, and 7 stimuli scored 6–8% loudnessdeviations when compared with the mean loudness of allthe stimuli.
2 EXPERIMENT 1: SPECTRAL ENVELOPEPERCEPTION OF SINGLE-DIMENSIONAL MFCCFUNCTION
2.1 ScopeThis experiment considers the linear relationship be-
tween spectral envelope perception and each coefficientfrom the Mel-cepstrum, namely, a single function from theorthogonal set of spectral envelope functions. Following thesound-synthesis method described in the previous section,when a coefficient from Mel-cepstrum changes graduallyin a linear manner while the other coefficients are kept con-stant, the spectral envelope of the resulting sound holds asimilar overall shape, but the humps of the envelope changetheir amplitudes exponentially. In the experiment, it was ex-amined whether the Mel-cepstrum can linearly represent thespectral envelope perception, and all 12 coefficients fromMel-cepstrum were tested based on this framework. Theexperiment was granted the approval for human-subjectresearch by the Stanford University Institutional ReviewBoard.
2.2 Method2.2.1 Participants
Twenty-five participants (graduate students and staffmembers from the Center for Computer Research in Mu-sic and Acoustics at Stanford University) volunteered forthe experiment. The participants were aged 20–35 yearsold, and had a musical background (majoring or minoringin music in college and graduate school), and/or an audioengineering background (enrolled in a music technologydegree program). They all described themselves as havingnormal hearing. We conducted a pilot study with Japaneseengineering students, and confirmed that the experimen-tal results did not depend significantly on the participantgroup.
2.2.2 StimuliTwelve sets of synthesized sounds were prepared. The set
n is associated with the MFCC coefficient Cn, the stimuli set1 consists of the stimuli with C1 varied, and the stimuli set 2consists of the stimuli with C2 varied, and so on. AlthoughCn is increased from zero to one with five levels, namely,Cn = 0, 0.25, 0.5, 0.75, 1.0, to form a stepwise structure,the other coefficients are kept constant, that is, C0 = 1 andall the other coefficients are set at zero.
J. Audio Eng. Soc., Vol. 60, No. 9, 2012 September 677

TERASAWA ET AL. PAPERS
0 2 40
1
2A
mpl
itude
0 2 40
1
2
0 2 40
1
2
0 2 40
1
2
0 2 40
1
2
0 2 40
1
2
Am
plitu
de
0 2 40
1
2
0 2 40
1
2
0 2 40
1
2
0 2 40
1
2
0 2 40
1
2
Am
plitu
de
0 2 40
1
2
0 2 40
1
2
0 2 40
1
2
0 2 40
1
2
0 2 40
1
2
Am
plitu
de
kHz0 2 4
0
1
2
kHz0 2 4
0
1
2
kHz0 2 4
0
1
2
kHz0 2 4
0
1
2
kHz
Fig. 2. Spectral envelopes generated by varying a single Mel-cepstrum coefficient. The first row shows the spectral envelopeswhen C1 from MFCC was varied from 0 to 1 with five steps(0, 0.25, 0.5, 0.75, and 1.0). The second, third, and fourth rowscorrespond, respectively, to cases where C2, C3, and C6 fromMFCC were varied in the same manner.
For example, stimuli set 4 consists of five stimuli basedon the following parameter arrangement:
C = [1, 0, 0, 0, C4, 0, ..., 0], (10)
where C4 is varied with five levels:
C4 = [0, 0.25, 0.5, 0.75, 1.0]. (11)
Fig. 2 illustrates the idea of varying a single coefficientof MFCC, and the resulting set of the spectral envelopesfor the cases of varying C1,C2, C3, and C6.
2.2.3 ProcedureThe experiment had 12 sections, one for each of the 12
sets of stimuli. Each section consisted of a practice phaseand an experimental phase.
The task of the participants was to listen to a pair of stim-uli that were played in sequence with a short interveningsilence, and to rate the perceived timbre dissimilarity of thepresented pair. They rated the perceived dissimilarity on ascale of 0 to 10, with 0 indicating that the presented pair ofsounds were identical, and 10 indicating that they were themost different within the section.
The participants pressed the “Play” button of the exper-iment GUI to play a sound, and reported the dissimilarityrating using a slider on the GUI. To facilitate the judgment,the pair with the largest spectral envelope difference in thesection (i.e., the pair of stimuli with the lowest and highest,Cn = 0 and Cn = 1, is assumed to have a perceived dissim-ilarity of 10) was presented as a reference pair throughoutthe practice and experimental phases. Participants were al-lowed to listen to the test pair and the reference pair asmany times as they wanted, but were advised not to repeat
C1 C2 C3 C4 C5 C6 C7 C8 C9 C10 C11 C12 All0.7
0.75
0.8
0.85
0.9
0.95
1
R−
squa
red
Fig. 3. Coefficients of determination (R2) from the linear regres-sion analysis of Experiment 1 with 95 % confidence intervals foreach of the 12 Mel-cepstrum coefficients, Cn, and for the averageof all the coefficients.
this too many times before making their final decision onscaling and proceeding to the next pair.
In the practice phase, five sample pairs were presentedfor rating. In the experimental phase, 25 pairs per section(all the possible pairs from five stimuli) were presented ina random order. The order of presenting the sections wasalso randomized. The participants were allowed to take abreak as they wished.
2.3 Linear Regression AnalysisThe dissimilarity judgments were analyzed using sim-
ple linear regression [41], with absolute Cn differences asthe independent variable, and their reported perceived dis-similarities as the dependent variable. The coefficient ofdetermination R2 represents the goodness of fit in the lin-ear regression analysis. The linear regression analysis wasindividually applied for each section and each participant,because it is anticipated that every listener could responddifferently to the stimuli sets, which would result in thedeviation of the regression coefficients. With a quantile–quantile plot, the R2 values formed a straight line exceptfor a very few outliers with low R2 values, showing that thedistribution of the R2 values is close to normal.
After the linear regression, the R2 values for one sectionfrom all the participants were averaged to find the meandegree of fit (mean R2) of each section. The mean R2 amongthe participants was used to judge the linear relationshipbetween the Cn distance and the perceived dissimilarity.
The mean R2 and the corresponding confidence intervalare plotted in Fig. 3. The mean R2 for all the responses was85%, with the confidence intervals for all the sections over-lapped. This means that all of the coefficients, from C1 toC12, have a linear correlation with the perception of soundcolor with a statistically equivalent degree of fit, when anexperiment is performed on an individual coefficient inde-pendent of other coefficients.
678 J. Audio Eng. Soc., Vol. 60, No. 9, 2012 September

PAPERS IN SEARCH OF A PERCEPTUAL METRIC FOR TIMBRE
3 EXPERIMENT 2: SPECTRAL ENVELOPEPERCEPTION OF TWO-DIMENSIONAL MFCCSUBSPACE
3.1 ScopeThis experiment tested the spectral envelope perception
of the two-dimensional MFCC subspace. The stimuli setwas synthesized by varying two coefficients from the Mel-cepstrum, say Cn and Cm, to form a two-dimensional sub-space. The subjective response to the stimuli set was testedbased on the Euclidean space hypothesis, namely, that eachcoefficient functions as an orthogonal basis when estimat-ing the spectral envelope perception. As it is not realis-tic to test all of the 144 two-dimensional subspaces, fivetwo-dimensional subspaces were chosen for testing. Theexperiment was approved for human subject research bythe Stanford University Institutional Review Board.
3.2 Method3.2.1 Participants
Nineteen participants, who were audio engineers, ad-ministrative staff members, visiting composers, and artistsfrom the Banff Centre, Alberta, Canada, volunteered forthis experiment. The participants were aged 25–40 yearsold, and they had a strong interest in music, with many ofthem having received professional training in music and/oraudio engineering. All of them described themselves asnormal-hearing.
3.2.2 StimuliFive sets of synthesized sounds were prepared that were
associated with the five different kinds of two-dimensionalsubspaces. The five subspaces were made by varying [C1,C3], [C3, C4], [C3, C6], [C3, C12], and [C11, C12], respec-tively. For each set, the coefficients in question were inde-pendently varied over four levels (Cn = 0, 0.25, 0.5, 0.75,and Cm = 0, 0.25, 0.5, 0.75) to form a grid-like structure;the other coefficients were kept constant, that is, C0 = 1and all other coefficients were set at zero. By varying twocoefficients independently, over four levels, each set had 16synthesized sounds.
For example, the first set made of the subspace [C1, C3]consists of the 16 sounds based on the following parameterarrangement:
C = [1, C1, 0, C3, 0, ..., 0], (12)
where C1 and C3 were varied over four levels, creating agrid with two variables.
The subspaces were chosen with the intention of testingthe spaces made of: nonadjacent low to middle coefficients([C1, C3] and [C3, C6]); two adjacent low coefficients ([C3,C4]); low and high coefficients ([C3, C12]); and two adjacenthigh coefficients ([C11, C12]).
Fig. 4 shows an example of the generated spectralenvelopes for this experiment.
0 2 40
1
2
Am
plitu
de
0 2 40
1
2
0 2 40
1
2
0 2 40
1
2
0 2 40
1
2
Am
plitu
de
0 2 40
1
2
0 2 40
1
2
0 2 40
1
2
0 2 40
1
2
Am
plitu
de
0 2 40
1
2
0 2 40
1
2
0 2 40
1
2
0 2 40
1
2
Am
plitu
de
kHz0 2 4
0
1
2
kHz0 2 4
0
1
2
kHz0 2 4
0
1
2
kHz
Fig. 4. Spectral envelopes generated by varying two Mel-cepstrumcoefficients. The horizontal direction (left to right) corresponds toincrementing C6 from 0 to 0.75 in four steps (0, 0.25, 0.5, and0.75), and the vertical direction (top to bottom) corresponds toincrementing C3 from 0 to 0.75 in four steps. For example, thetop-left subplot shows the spectral envelope when C6 = C3 = 0,and the bottom-right subplot is when C6 = C3 = 0.75.
3.2.3 ProcedureThere are 16 stimuli sounds per one subspace, making
256 possible stimulus pairs. Because testing all the pairswould take too much time and exhaust the participants, itwas necessary to reduce the number of the stimulus pairsin the experiment. The strategies for reducing the test pairswere (1) test either AB or BA ordering when measuring theperceived difference of stimuli A and B, instead of mea-suring the perception for both AB and BA; and (2) testonly some interesting pairs instead of testing all the pos-sible combinations of stimulus pairs. We adopted the firststrategy, and the actual order for a stimulus pair in the ex-periment was randomly selected from AB and BA ordering.However, the selection of ordering for each stimulus pairwas not varied across the participants.
To employ the first strategy, it was necessary to evaluatewhether the ordering of the stimuli had a significant effecton the perceived dissimilarity of the spectral envelope. Tocompare the AB responses and BA responses, equivalencetesting was conducted based on confidence intervals [42].First, regression analyses with AB order and BA order wereseparately conducted for each section and each participant.Then the difference between the R2 values of AB and BAorder regressions for each section was calculated. After that,for each section, the mean and the confidence intervals forthe R2 differences were calculated across participants. Theconfidence intervals of the differences for each section were2–3.5%, falling into the predefined 5% minimum differencerange. This reveals that the regression analyses based on ABresponses and BA responses were statistically equivalent.Because of this equivalency, it was decided that presentingonly one of two possible directions of a stimulus pair wassufficient.
J. Audio Eng. Soc., Vol. 60, No. 9, 2012 September 679

TERASAWA ET AL. PAPERS
Fig. 5. Selection of the test pairs for the two-dimensional MFCCsubspace experiment. Left: 16 pairs to examine distances from theorigin. Middle: 5 pairs to examine large distances. Right: 13 pairsto examine some shorter parallel and symmetric distances.
Even after halving the number of stimulus pairs, therewere still too many and further reduction was needed.Therefore, some pairs were chosen to represent large andsmall distances with some geometric order in the parametersubspace. Within each subspace, the test pairs were selectedwith the following interests, resulting in the total of 34 testpairs per section:
• From the zero of the space Cn = Cm = 0 to all thenodal points of the grid on the parameter subspace(16 pairs);
• Other large distances (5 pairs);• Some shorter parallel and symmetric distances to
test if they have similar perceived dissimilarities (13pairs).
The final configuration of the test pairs is presented inFig. 5 .
The participants’ task was to listen to the paired stimuli,which were played in sequence with a short interveningsilence, and to rate the perceived timbre dissimilarity of thepresented pair using a 0 to 10 scale. Here 0 indicates thatthe paired stimuli were identical, and 10 indicates that theperceived dissimilarity between the paired stimuli was thelargest in the section.
The participants reported the dissimilarity rating using aslider on the experiment’s GUI. To facilitate the judgment,the pair with the greatest spectral envelope difference inthe section is presented as a reference pair throughout thepractice and experimental phases, assuming that the pair ofstimuli with the lowest and highest, Cn = Cm = 0 and Cn =Cm = 0.75, would have a perceived dissimilarity of 10within the stimuli set. Participants were allowed to listento the test pair and the reference pair as many times asthey wanted, but they were advised not to repeat this toomany times before making their final decision on scalingand proceeding to the next pair.
In the practice phase, five sample pairs were presentedfor rating. In the experimental phase, 34 pairs per sectionwere presented in a random order. The order of presentingthe sections was also randomized. The participants wereallowed to take breaks as they wished.
Sec 1 Sec 2 Sec 3 Sec 4 Sec 50.5
0.6
0.7
0.8
0.9
1
R−
squa
red
Fig. 6. Coefficient of determination (R2) from the regression anal-ysis of the two-dimensional sound color experiment with 95%confidence interval. Sections 1–5 represent the tests on subspaces[C1, C3], [C3, C4], [C3, C6], [C3, C12], and [C11, C12], respectively.
3.3 Linear Regression AnalysisThe dissimilarity judgments were analyzed using linear
regression. The orthogonality of the two-dimensional sub-spaces was tested with a Euclidean distance-based model:the independent variable is the Euclidean distance of theMFCC between the paired stimuli, and the dependent vari-able is the subjective dissimilarity rating:
d2 = ax2 + by2, (13)
where d is the perceptual distance that subjects reported inthe experiment, x and y are the respective differences be-tween the Cn and Cm values of the paired stimuli. This modelreflects the idea that the perceptual distance should be de-scribed in terms of the Euclidean distance of the spectral-envelope description vectors. The standard least-squaresestimation is used with the linear regression analysis. Thecoefficient of determination, R2, represents the goodness offit in the linear regression analysis.
Individual linear regression for each section and eachparticipant was applied first, and the R2 values of one sec-tion from all the participants were then averaged to find themean degree of fit (mean R2) of each section. The meanR2 among the participants is used to determine whether theperceived dissimilarity reflects the Euclidean space model.
The mean R2 and the corresponding 95% confidenceinterval are plotted in Fig. 6. The mean R2 of all the re-sponses was 74% with the confidence intervals for all thesections overlapping. This means that all of the five sub-spaces demonstrate a similar degree of fit to a Euclideanmodel of two-dimensional sound color perception regard-less of the various choices of coordinates from the MFCCspace.
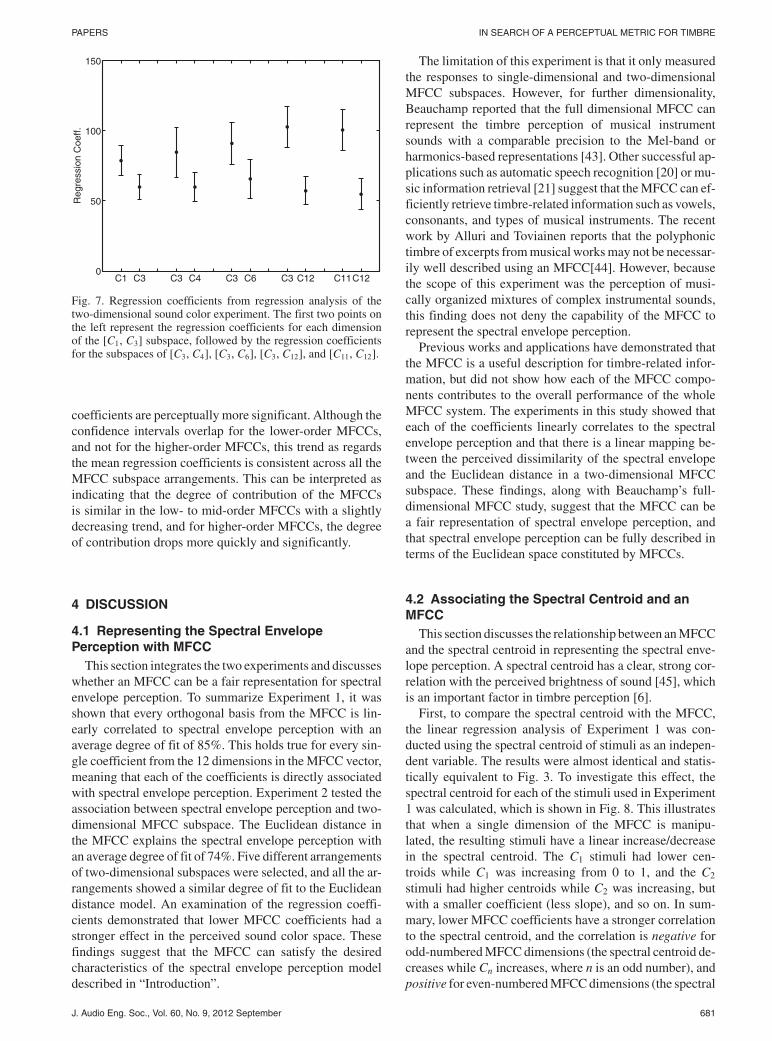
Fig. 7 shows the regression coefficients [i.e., a and b fromEq. (13)] for each of the two variables from the regressionanalysis for all five sections. The mean regression coeffi-cients were consistently higher for the lower one of the twoMFCC variables, which means that lower Mel-cepstrum
680 J. Audio Eng. Soc., Vol. 60, No. 9, 2012 September
PAPERS IN SEARCH OF A PERCEPTUAL METRIC FOR TIMBRE
C1 C3 C3 C4 C3 C6 C3 C12 C11C120
50
100
150
Reg
ress
ion
Coe
ff.
Fig. 7. Regression coefficients from regression analysis of thetwo-dimensional sound color experiment. The first two points onthe left represent the regression coefficients for each dimensionof the [C1, C3] subspace, followed by the regression coefficientsfor the subspaces of [C3, C4], [C3, C6], [C3, C12], and [C11, C12].
coefficients are perceptually more significant. Although theconfidence intervals overlap for the lower-order MFCCs,and not for the higher-order MFCCs, this trend as regardsthe mean regression coefficients is consistent across all theMFCC subspace arrangements. This can be interpreted asindicating that the degree of contribution of the MFCCsis similar in the low- to mid-order MFCCs with a slightlydecreasing trend, and for higher-order MFCCs, the degreeof contribution drops more quickly and significantly.
4 DISCUSSION
4.1 Representing the Spectral EnvelopePerception with MFCC
This section integrates the two experiments and discusseswhether an MFCC can be a fair representation for spectralenvelope perception. To summarize Experiment 1, it wasshown that every orthogonal basis from the MFCC is lin-early correlated to spectral envelope perception with anaverage degree of fit of 85%. This holds true for every sin-gle coefficient from the 12 dimensions in the MFCC vector,meaning that each of the coefficients is directly associatedwith spectral envelope perception. Experiment 2 tested theassociation between spectral envelope perception and two-dimensional MFCC subspace. The Euclidean distance inthe MFCC explains the spectral envelope perception withan average degree of fit of 74%. Five different arrangementsof two-dimensional subspaces were selected, and all the ar-rangements showed a similar degree of fit to the Euclideandistance model. An examination of the regression coeffi-cients demonstrated that lower MFCC coefficients had astronger effect in the perceived sound color space. Thesefindings suggest that the MFCC can satisfy the desiredcharacteristics of the spectral envelope perception modeldescribed in “Introduction”.
The limitation of this experiment is that it only measuredthe responses to single-dimensional and two-dimensionalMFCC subspaces. However, for further dimensionality,Beauchamp reported that the full dimensional MFCC canrepresent the timbre perception of musical instrumentsounds with a comparable precision to the Mel-band orharmonics-based representations [43]. Other successful ap-plications such as automatic speech recognition [20] or mu-sic information retrieval [21] suggest that the MFCC can ef-ficiently retrieve timbre-related information such as vowels,consonants, and types of musical instruments. The recentwork by Alluri and Toviainen reports that the polyphonictimbre of excerpts from musical works may not be necessar-ily well described using an MFCC[44]. However, becausethe scope of this experiment was the perception of musi-cally organized mixtures of complex instrumental sounds,this finding does not deny the capability of the MFCC torepresent the spectral envelope perception.
Previous works and applications have demonstrated thatthe MFCC is a useful description for timbre-related infor-mation, but did not show how each of the MFCC compo-nents contributes to the overall performance of the wholeMFCC system. The experiments in this study showed thateach of the coefficients linearly correlates to the spectralenvelope perception and that there is a linear mapping be-tween the perceived dissimilarity of the spectral envelopeand the Euclidean distance in a two-dimensional MFCCsubspace. These findings, along with Beauchamp’s full-dimensional MFCC study, suggest that the MFCC can bea fair representation of spectral envelope perception, andthat spectral envelope perception can be fully described interms of the Euclidean space constituted by MFCCs.
4.2 Associating the Spectral Centroid and anMFCC
This section discusses the relationship between an MFCCand the spectral centroid in representing the spectral enve-lope perception. A spectral centroid has a clear, strong cor-relation with the perceived brightness of sound [45], whichis an important factor in timbre perception [6].
First, to compare the spectral centroid with the MFCC,the linear regression analysis of Experiment 1 was con-ducted using the spectral centroid of stimuli as an indepen-dent variable. The results were almost identical and statis-tically equivalent to Fig. 3. To investigate this effect, thespectral centroid for each of the stimuli used in Experiment1 was calculated, which is shown in Fig. 8. This illustratesthat when a single dimension of the MFCC is manipu-lated, the resulting stimuli have a linear increase/decreasein the spectral centroid. The C1 stimuli had lower cen-troids while C1 was increasing from 0 to 1, and the C2
stimuli had higher centroids while C2 was increasing, butwith a smaller coefficient (less slope), and so on. In sum-mary, lower MFCC coefficients have a stronger correlationto the spectral centroid, and the correlation is negative forodd-numbered MFCC dimensions (the spectral centroid de-creases while Cn increases, where n is an odd number), andpositive for even-numbered MFCC dimensions (the spectral
J. Audio Eng. Soc., Vol. 60, No. 9, 2012 September 681

TERASAWA ET AL. PAPERS
0 0.2 0.4 0.6 0.8 11800
1900
2000
2100
2200
2300
2400
2500
2600
MFCC value
spec
tral
cen
troi
d (H
z)
C1
C3
C5
C11
C12
C4
C6
C2
C8C10
C9C7
Fig. 8. Spectral centroid of the stimuli used for Experiment 1,when a single coefficient from the Mel-cepstrum was varied from0 to 1 in five steps.
centroid increases while Cn increases, where n is an evennumber).
This is not a coincidence based on the trend in spectralenvelopes generated for this experiment as shown in Fig. 2.The spectral envelopes generated by varying C1 have ahump around the low-frequency range, which correspondsto the cosine wave at ω = 0, and a dip around the Nyquistfrequency, which corresponds to ω = π/2. As C1 increases,the magnitude of the hump becomes higher.
The concentrated energy around the low-frequency re-gion corresponds to the fact that the spectral centroids arelower while the value of C1 increases. Now, if the spectralenvelopes are generated by varying C2, there are two humpsat the lowest frequency and the Nyquist frequency that cor-respond to ω = 0 and ω = π. Another hump at the Nyquistfrequency makes the spectral centroid higher, whereas in-creasing the value of C2 increases the spectral centroid.The same trends are conserved for odd- and even-numberedMFCC coefficients. With higher orders of MFCC, the basisfunction has its humps more sparsely distributed over thespectrum, which results in a weaker correlation betweenthe MFCC and the spectral centroid (i.e., the slope of theline in Fig. 8 becomes more shallow as n increases).
Furthermore, the results from Experiment 2 show thatthe lower-order Mel-cepstrum coefficient is perceptuallymore important. As shown in Fig. 9, the linear relation-ship between the MFCC and spectral centroid is consistentin the stimuli set for Experiment 2. The low coefficient’sstrong association with the spectral centroid can explainthis effect. Because of the correlation between the spectralcentroid and MFCC in the stimuli for Experiment 2, theresult of the regression analysis based on the spectral cen-troid was very similar to Fig. 6, except for Section 1. ForSection 1, the R2 of the spectral-centroid-based regressionwas 84%, scoring it 13% above the R2 of the MFCC-basedregression, without overlapping confidence intervals. This
0 0.25 0.5 0.752100
2150
2200
2250
2300
2350
2400
C3 value
spec
tral
cen
troi
d (H
z)
C4 = 0C4 = 0.25C4 = 0.5C4 = 0.75
Fig. 9. Spectral centroid of the stimuli used for Experiment 2,Section 2, when two coefficients from the Mel-cepstrum, C3 andC4, were varied from 0 to 0.75 in four steps.
could be explained in terms of the coefficient choice ofC1 and C3, which have a strong correlation with the spec-tral centroid in the same direction, and therefore are easilyconfused. For Sections 2–5, the R2 of the MFCC-based re-gression was consistently higher by 2–5% than the R2 ofspectral-centroid-based regression, with overlapping confi-dence intervals.
The above-mentioned characteristics can be dependenton the specific MFCC implementation, and the pseudo-inversion of the MFCC used in this experiment. Dependingon how the MFCC and its inversion are implemented, itcould have different kinds of relationships to the spectralcentroid. The relevance between the MFCC and spectralcentroid present in this experiment may be generalizedwith further mathematical rationalization. If it is mathe-matically promised that higher Mel-cepstrum coefficientshave a weaker correlation with the spectral centroid result-ing in the reduced perceptual significance, it may explainthe efficiency of the common practice, which uses only12 or 13 lower coefficients from the MFCC for automaticspeech recognition or music information retrieval.
However, there was a trend in the spectral centroids inthe MFCC-based stimuli set for both experiments, and ourresults do not conflict with the previously reported char-acteristics of the spectral centroid in relation to the tim-bre perception. Both Experiments 1 and 2 suggest that anMFCC-based description holds a similar degree of linearityin predicting spectral envelope perception to a spectral-centroid-based description. Yet the spectral centroid isessentially a single-dimensional descriptor and does notdescribe the complex shapes of the spectral envelope it-self. Two sounds with different spectral envelopes couldhave the same spectral-centroid value, but be representedwith different Mel-cepstrum values. The multidimensional
682 J. Audio Eng. Soc., Vol. 60, No. 9, 2012 September

PAPERS IN SEARCH OF A PERCEPTUAL METRIC FOR TIMBRE
Mel-cepstrum delivers more information about the spectralenvelope than the spectral centroid.
5 CONCLUSION
On the basis of desirable properties for modelingspectral envelope perception (linearity, orthogonality, andmultidimensionality), Mel-frequency cepstral coefficients(MFCCs) were chosen as a hypothetical metric for mod-eling spectral envelope perception. Quantitative data fromtwo experiments illustrate the linear relationship betweenthe subjective perception of vowel-like synthetic soundsand the MFCC.
The first experiment tested the linear mapping betweenspectral envelope perception and all 12 Mel-cepstrum coef-ficients. Each Mel-cepstrum coefficient showed a linearrelationship to the subjective judgment at a statisticallyequivalent level to any other coefficient. On average, theMFCC explains 85% of spectral envelope perception whena single coefficient from the MFCC is varied in an isolatedmanner from all the other coefficients.
In the second experiment, two Mel-cepstrum coefficientswere simultaneously varied to form a stimulus set in a two-dimensional MFCC subspace, and the relevant spectral en-velope perception was tested. A total of five subspaces weretested, and all five exhibited a linear relationship betweenthe perceived dissimilarity and the Euclidean distance ofthe MFCC at a statistically equivalent level. A subjectivedissimilarity rating showed an average correlation of 74%with the Euclidean distance between the Mel-cepstrumcoefficients of the tested stimulus pair. In addition, theobservation of regression coefficients demonstrated thatlower-order Mel-cepstrum coefficients influence spectralenvelope perception more strongly.
The use of MFCCs to describe spectral envelope per-ception was further discussed. Such a representation canbe useful not only in analyzing audio signals, but also incontrolling the timbre in synthesized sounds. The corre-lation between the MFCC and the spectral centroid wasalso discussed, although such a correlation can be specificto our experimental conditions, and further mathematicalinvestigation is needed.
These experiments examined the MFCC model at lowdimensionality. Much work remains to be done in under-standing how MFCC variation across the entire 12 dimen-sions might relate to human sound perception. An interest-ing approach is currently being employed by Horner andcoworkers, who are taking their previous experimental dataon timbre morphing of instrumental sounds [10, 11] and re-analyzing it using MFCC [26], [43]. Their approach usinginstrumental sounds will provide a good complement to theapproach taken here.
6 ACKNOWLEDGMENT
We thank Malcolm Slaney for his contributions in estab-lishing this research, and for his generous support in the
preparation of this article. We also thank Jim Beauchamp,Andrew Horner, Michael Hall, and Tony Stockman for theirhelpful comments. This work was supported by France–Stanford Center for Interdisciplinary Studies, The BanffCentre, AES Educational Foundation, and JST-PRESTO.
7 REFERENCES[1] H. Helmholtz, On the Sensation of Tone (translation
by Alexander John Ellis), pp. 64–65 (Dover Publications,Mineola, NY, Original German Edition in 1863, Englishtranslation in 1954).
[2] J. B. Allen, “How do humans process and recog-nize speech?,” IEEE Trans. Speech Audio Process., vol. 2,pp. 567–577 (1994 Oct.).
[3] G. E. Peterson and H. L. Barney, “Control methodsused in a study of the vowels,” J Acoust Soc Am., vol. 24,no. 2, pp. 175–184 (1952).
[4] J. Grey, “Multidimensional perceptual scaling of mu-sical timbres,” J. Acoust. Soc. Am., vol. 61, no. 5, pp. 1270–1277 (1977).
[5] D. L. Wessel, “Timbre space as a musical controlstructure,” Comput. Music J., vol. 3, no. 2, pp. 45–52 (1979).
[6] S. McAdams, W. Winsberg, S. Donnadieu, G. DeSoete, and J. Krimphoff, “Perceptual scaling of synthesizedmusical timbres: Common dimensions, specificities, andlatent subject classes,” Psychol. Res., vol. 58, pp. 177–192(1995).
[7] S. Lakatos, “A common perceptual space for har-monic and percussive timbres,” Percept. Psychophys.,vol. 62, no. 7, pp. 1426–1439 (2000).
[8] J. W. Beauchamp, “Perceptually correlated parame-ters of musical instrument tones,” Arch.Acoust., vol. 36, no.2, pp. 225–238 (2012).
[9] J. Blauert and U. Jekosch, “A layer model of soundquality,” J. Audio Eng. Soc., vol. 60, no. 1/2, pp. 4–12(2012).
[10] A. B. Horner, J. W. Beauchamp, and R. H. Y. So,“A search for best error metrics to predict discrimina-tion of original and spectrally altered musical instrumentsounds,” J. Audio Eng. Soc., vol. 54, pp. 140–156 (2006Mar.).
[11] A. B. Horner, J. W. Beauchamp, and R. H. Y. So,“Detection of time-varying harmonic amplitude alterationsdue to spectral interpolations between musical instrumenttones,” J. Acoust. Soc. Am., vol. 125, no. 1, pp. 492–502(2009).
[12] M. Hall and J. Beauchamp, “Clarifying spectraland temporal dimensions of musical instrument timbre,”Acoust. Can. J. Can. Acoust. Assoc., vol. 37, no. 1,pp. 3–22 (2009).
[13] S. Barrass, “A perceptual framework for the audi-tory display of scientific data,” ACM Trans. Appl. Percept.,vol. 2, no. 4, pp. 389–402 (2005).
[14] R. Plomp, Aspects of Tone Sensation: A Psy-chophysical Study, ch. 6 (Timbre of Complex Tones),pp. 85–110 (Academic Press, New York, 1976).
[15] W. Slawson, Sound Color, pp. 3–21 (University ofCalifornia Press, Berkeley, CA, 1985).
J. Audio Eng. Soc., Vol. 60, No. 9, 2012 September 683

TERASAWA ET AL. PAPERS
[16] H. F. Pollard and E. V. Jansson, “A tristimulusmethod for the specification of musical timbre,” Acustica,vol. 51, pp. 162–171 (1982).
[17] J. S. Bridle and M. D. Brown, “An experimentalautomatic word-recognition system: Interim report,” JSRUReport 1003, Joint Speech Research Unit, 1974.
[18] P. Mermelstein, “Distance measures for speechrecognition, psychological and instrumental,” in PatternRecognition and Artificial Intelligence (C. H. Chen, ed.),pp. 374–388 (Academic Press, New York, 1976).
[19] S. B. Davis and P. Mermelstein, “Comparison ofparametric representations for monosyllabic word recogni-tion in continuously spoken sentences,” IEEE Trans. SpeechAudio Process., vol. ASSP-28, pp. 357–366 (1980 Aug.).
[20] L. Rabiner and B.-H. Juang, Fundamentals ofSpeech Recognition, pp. 183–190 (Prentice Hall, UpperSaddle River, NJ, 1993).
[21] G. D. Poli and P. Prandoni, “Sonological modelsfor timbre characterization.,” J. New Music Res., vol. 26,pp. 170–197 (1997).
[22] J.-J. Aucouturier, Ten Experiments on the Modellingof Polyphonic Timbre. Ph.D. thesis (University of Paris 6,Paris, France, 2006).
[23] S. Heise, M. Hlatky, and J. Loviscach, “Aurally andvisually enhanced audio search with soundtorch,” in ACMCHI 2009 Extended Abstracts, pp. 3241–3246 (2009 Apr.).
[24] N. Osaka, Y. Saito, S. Ishitsuka, and Y. Yoshioka,“An electronic timbre dictionary and 3d timbre display,”in Proc. 2009 Int. Computer Music Conference, pp. 9–12(2009).
[25] M. Hoffman and P. R. Cook, “Feature-based synthe-sis for sonification and psychoacoustic research,” in Proc.12th Int. Conf. Auditory Display, London, UK., pp. 254–257(2006).
[26] A. B. Horner, J. W. Beauchamp, and R. H. Y. So,“Evaluation of mel-band and mfcc-based error metrics forcorrespondence to discrimination of spectrally altered mu-sical instrument sounds,” J. Audio Eng. Soc., vol. 59, no. 5,pp. 290–303 (2011).
[27] H. Terasawa, A Hybrid Model for Timbre Percep-tion: Quantitative Representations of Sound Color andDensity. Ph.D. thesis (Stanford University, Stanford, CA,Stanford, CA, 2009).
[28] H. Terasawa, M. Slaney, and J. Berger, “Perceptualdistance in timbre space,” in Proc. ICAD 05 - EleventhMeeting of the International Conference on AuditoryDisplay, pp. 61–68 (2005).
[29] H. Terasawa, M. Slaney, and J. Berger, “A timbrespace for speech,” in Proc. Interspeech 2005–Eurospeech,pp. 1729–1732, 2005.
[30] H. Terasawa, M. Slaney, and J. Berger, “The thir-teen colors of timbre,” in Proc. IEEE Workshop on Ap-
plications of Signal Processing to Audio and Acoustics,pp. 323–326 (2005).
[31] E. Zwicker and H. Fastl, Psychoacoustics – Factsand Models, pp. 223–226 (Springer, Berlin, 1999).
[32] S. Shamma, “Speech processing in the auditory sys-tem,” J. Acoust. Soc. Am., vol. 78, no. 5, pp. 1612–1632,1985.
[33] T. Irino and R. D. Patterson, “Segregating infor-mation about the size and shape of the vocal tract usinga time-domain auditory model: The Stabilised Wavelet-Mellin Transform,” Speech Commun., vol. 36, pp. 181–203,2002.
[34] A. Bregman, Auditory Scene Analysis, 2nd ed (MITPress, Cambridge, MA, 2001).
[35] S. Barrass and G. Walker, “Using sonification,”Multimedia Syst., vol. 7, pp. 23–31 (1999).
[36] T. Hermann, G. Baier, U. Stephani, andH. Ritter, “Vocal sonification of pathologic EEG features,”in Proc. Int. Conf. Auditory Display (ICAD 2006), pp. 158–163 (2006).
[37] R. Cassidy, J. Berger, K. Lee, M. Maggioni, andR. R. Coifman, “Auditory display of hyperspectral colontissue images using vocal synthesis models,” in Proc. Int.Conf. Auditory Display (ICAD 2004), pp. 1–8 (2004).
[38] J. Sundberg, “Vibrato and vowel identification,”Arch. Acoust., vol. 2, pp. 257–266 (1977).
[39] S. McAdams and X. Rodet, “The role of FM-induced AM in dynamic spectral profile analysis,” in BasicIssues in Hearing (H. Duifhuis, J. Horst, and H. Wit, eds.),pp. 359–369 (Academic Press, London; San Diego, CA,1988).
[40] M. Slaney, “Auditory toolbox version 2,” Tech. Rep.1998-010, Interval Research, 1998.
[41] W. Mendenhall and T. Sincich, Statistics for En-gineering and the Sciences, pp. 531–698 (Prentice Hall,Upper Saddle River, NJ, 1995).
[42] J. Rogers, K. Howard, and J. Vessey, “Using sig-nificance tests to evaluate equivalence between two exper-imental groups,” Psychological Bulletin, vol. 113, no. 3,pp. 553–565 (1993).
[43] J. W. Beauchamp, H. Terasawa, and A. B. Horner,“Predicting perceptual differences between musical sounds:A comparison of Mel-band and MFCC based metric resultsto previous harmonic-based results,” in Proc. Soc. MusicPerception and Cognition 2009 Biennial Conference, p. 82(2009).
[44] V. Alluri and P. Toiviainen, “Exploring perceptualand acoustical correlates of polyphonic timbre,” MusicPercept., vol. 27, no. 3, pp. 223–241 (2009).
[45] E. Schubert and J. Wolfe, “Does timbral brightnessscale with frequency and spectral centroid?,” Acta Acust.United Acust., vol. 92, pp. 820–825 (2006).
684 J. Audio Eng. Soc., Vol. 60, No. 9, 2012 September
PAPERS IN SEARCH OF A PERCEPTUAL METRIC FOR TIMBRE
THE AUTHORS
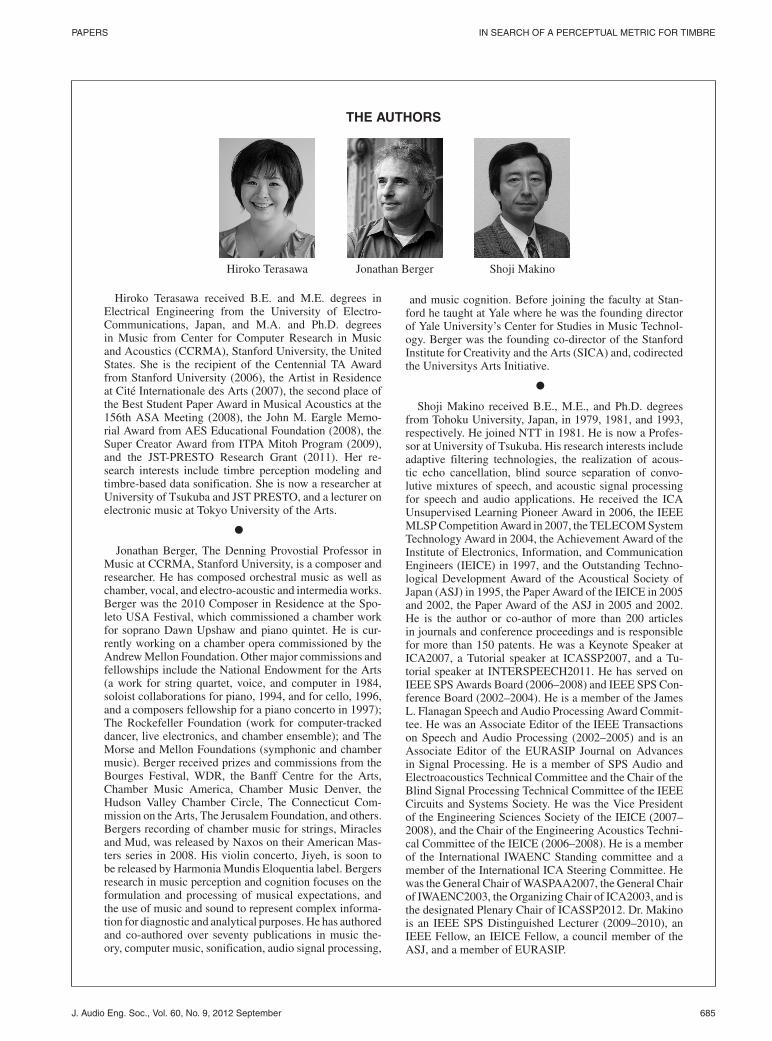
Hiroko Terasawa Jonathan Berger Shoji Makino
Hiroko Terasawa received B.E. and M.E. degrees inElectrical Engineering from the University of Electro-Communications, Japan, and M.A. and Ph.D. degreesin Music from Center for Computer Research in Musicand Acoustics (CCRMA), Stanford University, the UnitedStates. She is the recipient of the Centennial TA Awardfrom Stanford University (2006), the Artist in Residenceat Cite Internationale des Arts (2007), the second place ofthe Best Student Paper Award in Musical Acoustics at the156th ASA Meeting (2008), the John M. Eargle Memo-rial Award from AES Educational Foundation (2008), theSuper Creator Award from ITPA Mitoh Program (2009),and the JST-PRESTO Research Grant (2011). Her re-search interests include timbre perception modeling andtimbre-based data sonification. She is now a researcher atUniversity of Tsukuba and JST PRESTO, and a lecturer onelectronic music at Tokyo University of the Arts.
�
Jonathan Berger, The Denning Provostial Professor inMusic at CCRMA, Stanford University, is a composer andresearcher. He has composed orchestral music as well aschamber, vocal, and electro-acoustic and intermedia works.Berger was the 2010 Composer in Residence at the Spo-leto USA Festival, which commissioned a chamber workfor soprano Dawn Upshaw and piano quintet. He is cur-rently working on a chamber opera commissioned by theAndrew Mellon Foundation. Other major commissions andfellowships include the National Endowment for the Arts(a work for string quartet, voice, and computer in 1984,soloist collaborations for piano, 1994, and for cello, 1996,and a composers fellowship for a piano concerto in 1997);The Rockefeller Foundation (work for computer-trackeddancer, live electronics, and chamber ensemble); and TheMorse and Mellon Foundations (symphonic and chambermusic). Berger received prizes and commissions from theBourges Festival, WDR, the Banff Centre for the Arts,Chamber Music America, Chamber Music Denver, theHudson Valley Chamber Circle, The Connecticut Com-mission on the Arts, The Jerusalem Foundation, and others.Bergers recording of chamber music for strings, Miraclesand Mud, was released by Naxos on their American Mas-ters series in 2008. His violin concerto, Jiyeh, is soon tobe released by Harmonia Mundis Eloquentia label. Bergersresearch in music perception and cognition focuses on theformulation and processing of musical expectations, andthe use of music and sound to represent complex informa-tion for diagnostic and analytical purposes. He has authoredand co-authored over seventy publications in music the-ory, computer music, sonification, audio signal processing,
and music cognition. Before joining the faculty at Stan-ford he taught at Yale where he was the founding directorof Yale University’s Center for Studies in Music Technol-ogy. Berger was the founding co-director of the StanfordInstitute for Creativity and the Arts (SICA) and, codirectedthe Universitys Arts Initiative.
�
Shoji Makino received B.E., M.E., and Ph.D. degreesfrom Tohoku University, Japan, in 1979, 1981, and 1993,respectively. He joined NTT in 1981. He is now a Profes-sor at University of Tsukuba. His research interests includeadaptive filtering technologies, the realization of acous-tic echo cancellation, blind source separation of convo-lutive mixtures of speech, and acoustic signal processingfor speech and audio applications. He received the ICAUnsupervised Learning Pioneer Award in 2006, the IEEEMLSP Competition Award in 2007, the TELECOM SystemTechnology Award in 2004, the Achievement Award of theInstitute of Electronics, Information, and CommunicationEngineers (IEICE) in 1997, and the Outstanding Techno-logical Development Award of the Acoustical Society ofJapan (ASJ) in 1995, the Paper Award of the IEICE in 2005and 2002, the Paper Award of the ASJ in 2005 and 2002.He is the author or co-author of more than 200 articlesin journals and conference proceedings and is responsiblefor more than 150 patents. He was a Keynote Speaker atICA2007, a Tutorial speaker at ICASSP2007, and a Tu-torial speaker at INTERSPEECH2011. He has served onIEEE SPS Awards Board (2006–2008) and IEEE SPS Con-ference Board (2002–2004). He is a member of the JamesL. Flanagan Speech and Audio Processing Award Commit-tee. He was an Associate Editor of the IEEE Transactionson Speech and Audio Processing (2002–2005) and is anAssociate Editor of the EURASIP Journal on Advancesin Signal Processing. He is a member of SPS Audio andElectroacoustics Technical Committee and the Chair of theBlind Signal Processing Technical Committee of the IEEECircuits and Systems Society. He was the Vice Presidentof the Engineering Sciences Society of the IEICE (2007–2008), and the Chair of the Engineering Acoustics Techni-cal Committee of the IEICE (2006–2008). He is a memberof the International IWAENC Standing committee and amember of the International ICA Steering Committee. Hewas the General Chair of WASPAA2007, the General Chairof IWAENC2003, the Organizing Chair of ICA2003, and isthe designated Plenary Chair of ICASSP2012. Dr. Makinois an IEEE SPS Distinguished Lecturer (2009–2010), anIEEE Fellow, an IEICE Fellow, a council member of theASJ, and a member of EURASIP.
J. Audio Eng. Soc., Vol. 60, No. 9, 2012 September 685