Embed Size (px)
Citation preview

Accepted Manuscript
Title: In Search for Sustainable Globally Cost-EffectiveEnergy Efficient Building Solar System–Heat RecoveryAssisted Building Integrated PV Powered Heat Pump forAir-Conditioning, Water Heating And Water Saving
Author: Marija S. Todorovic Jeong Tai Kim
PII: S0378-7788(14)00689-6DOI: http://dx.doi.org/doi:10.1016/j.enbuild.2014.08.046Reference: ENB 5292
To appear in: ENB
Received date: 26-8-2014Accepted date: 27-8-2014
Please cite this article as: M.S. Todorovic, J.T. Kim, In Search for SustainableGlobally Cost-Effective Energy Efficient Building Solar SystemndashHeatRecovery Assisted Building Integrated PV Powered Heat Pump for Air-Conditioning, Water Heating And Water Saving, Energy and Buildings (2014),http://dx.doi.org/10.1016/j.enbuild.2014.08.046
This is a PDF file of an unedited manuscript that has been accepted for publication.As a service to our customers we are providing this early version of the manuscript.The manuscript will undergo copyediting, typesetting, and review of the resulting proofbefore it is published in its final form. Please note that during the production processerrors may be discovered which could affect the content, and all legal disclaimers thatapply to the journal pertain.

Page 1 of 25
Accep
ted
Man
uscr
ipt
1
In Search for Sustainable Globally Cost-Effective Energy Efficient Building Solar
System – Heat Recovery Assisted Building Integrated PV Powered Heat Pump for Air-
Conditioning, Water Heating And Water Saving
Marija S. Todorovic1 and Jeong Tai Kim2,*
1University of Belgrade, 2Department of Architectural Engineering, Kyung Hee University, Yongin
446-701, Korea, *Corresponding Author: J. T. Kim ([email protected])
Abstract
Obtained as a research result of conducted project, this paper presents an innovative, energy efficient
multipurpose system for a sustainable globally cost-effective building’s solar energy use and
developed methodology for its dynamic analysis and optimization. The initial research and
development goal was to create a cost-effective technical solution for replacing fossil fuel and
electricity with solar energy for water heating for different purposes (for pools, sanitary water,
washing) in one SPA. After successful realization of the initial goal, the study was proceeded and as
a result, the created advanced system has been enriched with AC performance. The study success
was based on understanding and combined measurements and by BPS made predictions of AC loads
and solar radiation dynamics as well as on the determination of the synergetic relations between all
relevant quantities. Further, by the performed BPS dynamic simulations for geographically spread
buildings locations, it has been shown that the final result of the conducted scientific engineering
R&D work has been the created system of confirmed prestigious to the sustainability relevant
performance –globally cost-effective building integrated photovoltaic powered heat pump (HP),
assisted by waste water heat recovery, for solar AC, water heating and saving.
Keywords: energy efficiency, geographic cost-effectiveness analysis, multipurpose BIPV system,
BPS, solar air-conditioning, complex system dynamics, heat pump and waste water heat recovery
1. Introduction

Page 2 of 25
Accep
ted
Man
uscr
ipt
2
Industrialization associated with increasing consumption of resources, spurred on by the demands for
higher living standards from an exponentially growing population, are polluting the Earth ground, its
oceans and other surface waters, as well as its atmosphere denuding forests, depleting the ozone
layer of the stratosphere and creating more and more evident weather extremes and raising global
warming. Natural resources of energy and matter constitute the Earth's natural capital - essential for
human civilization and are classified mainly as: solar capital (99% of the energy used on the Earth)
and Earth capital (life support resources and processes including human). It is well known that
consuming natural resources of energy and raw materials and producing wastes is the way the industrial,
but also natural systems operate.
As the size of industrial systems increases, resources and sites availability for wastes disposal
become limited. The extracted materials in extreme cases amount even more than 10 tons per person
annually, in the most developed countries and approximately 94 percent of the extracted material is
converted to waste, with the rest of only 6 percent finalized into durable products ([1] - [3]). There
are too many examples, around the world, of dissipative uses of resources, products degraded,
dispersed to the environment, and lost from the standpoint of any kind of reuse or recyclability - food,
fuel, fertilizers, etc.
In addition, life support resources of oxygen and water (freshwater in the world's lakes and rivers
makes up a tiny fraction about 1 part in 10,000 of all the water on the Earth) a vulnerable global
heritage on the Earth in the past, today became under siege and progressive degradation. Serious
water shortage predicted 15 years ago ([1], [3]) was underestimated. The UN has identified more
than 70 trouble spots linked with water, from the Middle East to the Sahel, from the arid zones of
Latin America to the Indian subcontinent. River basins straddle national borders in 300 places around
the world. Some "water conflicts" are active and latent for decades, hundreds and thousands of years.
Water is at the heart of Arab-Israeli conflict - 2/3 of Israel's water comes from beyond the country's
1967 borders. Libya is pumping from non-renewable underground water supplies in the Sahara,
causing concerns in Egypt, Chad, Niger and Sudan [2].
There is deep synergy of the exponentially growing Earth population, energy resources increasing
demand and exhaustion as well as more and more often occurring weather extremes and related
catastrophic events. Consequently, on the global scale there are also exponentially growing needs for
more harmonious and sustainable social and economical development. To sustain weather extremes
and catastrophic events, people need better constructed, more resilient and healthy houses, better air-
conditioned with reliable controlled indoor environment quality.

Page 3 of 25
Accep
ted
Man
uscr
ipt
3
Hence, there is a great need in the whole world for sustainable buildings with energy efficiently
integrated and cost-effectively use of solar energy - the most uniformly distributed renewable energy
source around the world. Trying to contribute for answering to such need, this paper is devoted to
search for globally cost-effective energy efficient building integrated solar - waste water heat
recovery assisted building integrated PV powered heat pump for air-conditioning, water heating and
water saving.
2. Relevant System Model Background and Methodology
Utilization of energy sources, such as the sun, geothermal, water and wind, reduces reliance on
vanishing form of energy sources. Renewable energy technologies can contribute to the development
of sustainable buildings construction improving living, health and education conditions, especially in
remote countrysides.
The initial specific objective in the study ([5], [10]) was to find a technical solution for replacing
fossil fuel and electricity with solar energy for the heating of water for different purposes (for pools,
sanitary water, washing), and in addition to explore possibilities to improve indoor comfort by
introducing air-conditioning. Crucial aspects for the success of the study [5] was the understanding of
solar water heating system and air-conditioning dynamic behavior dependent on the TMY - Typical
Meteorological Year’s data [8], and synergetic relations between energy efficiency, solar radiation
availability and intensity, as well as sanitary water and air-conditioning demand dynamics
determined for a specific model Case Study. As a model Case study, SPA Rusanda in Serbia has been
selected. For its accommodation capacity of 400 patients, the consumption of sanitary hot water is
about 70 000 liters per day.
Water and water heating energy demand. Different water heating systems were studied by the
dynamic simulations applying TRNSYS program [7] as well as the own originally developed
software. Performance of the economic analysis has been determined implementing domestic and
European procedures as well as the powerful BLCC software [6]. For the Spa Rusanda, Site Location
Data are Latitude {45.85 0 N+ S-}, Longitude {20.80 0 W- E+}, Time Zone Relative to GMT 1.00
{GMT+/-}, Elevation 132m. For the SPA Rusanda climatic zone the thermo-technical systems -
HVAC systems relevant outdoor design conditions are:
For heating and HVAC system operation mode in winter:
Design air dry bulb temperature tsp = - 18C;
For cooling and HVAC system operation mode in summer:
Design air dry bulb temperature tsp = 33C, and relative Humidity = 33%.

Page 4 of 25
Accep
ted
Man
uscr
ipt
4
Thermal energy daily necessary for sanitary water heating is determined for the two ”nominal” water
consumption values: for 70 m3 daily from 14°C to 40°C eq. (1), and for 80 m3 daily from 14 °C to
40°C eq. (2).
Qtv V c Ttv Thv m c Ttv Thv 70000 4.186 4014 7618520kJ (1)
Qtv V c Ttv Thv m c Ttv Thv 80000 4.186 4014 8790600kJ (2)
The ”nominal” water consumption values have been determined using consumption data history and
measurements (presented on graphs in Figures 2. and 3.).
LTP - Long Term Performance Prediction of the solar water heating systems – SWHS, or more
generally of the solar energy utilization systems is of crucial importance for investors and that is the
most important and delicate task within the frame of designing an installation for active solar energy
utilization [4].
Figure 1. Mean daily profile (left) and daily profile with minimum daily consumption (right)
For the qualitative and quantitative analysis of the systems, particularly its cost-effectiveness, it is of crucial
importance to determine loads (sanitary water and air-conditioning demand and daily dynamics), as well as
systems energy efficiency related to both the fluid flow and heat flow/transfer in all system components and
parts. Leakages both of heat and water are to be identified and eliminated (see Fig. 2).
Figure 2. Conduit pipes detailed ultrasound flow-rate measurement (left) data (right) at different sections
The diameters of pipe lines are to be sized in the manner in which the reference to the corresponding heat
transfer fluid flow rates, pressure drops, the pump power and the electricity consumption will be kept at the
lowest possible level. When appropriate piping diameters are defined the electricity consumption of solar
water heating plants, including the energy demand of measuring and control instruments, is minimal, and
varies between 2.0 and 3.5 % of the total power input.
3. Wastewater Heat Recovery Assisted Heat Pump
The new original concept of solar energy utilization for water heating is here defined which is based
on the introduction of a very effective measure to increase energy efficiency, exactly nearly
maximum possible increase of energy efficiency of the final energy utilization by implementation of

Page 5 of 25
Accep
ted
Man
uscr
ipt
5
the waste water heat recovery system which can recover 80–90% of waste heat. After recovering
waste heat, the solar PV powered heat pump’s compression work through the release of condensation
heat in the heat pump condenser, heats earlier preheated fresh water in the heat recovery unit. Thus,
wastewater heat recovery is very effective means to reduce thermal energy consumption and increase
energy efficiency of sanitary water heating installation.
On the market, there are wastewater heat recovery systems in reliable and efficient operation. Based
on our previous experience for the wastewater heat recovery, for the case study as appropriate model,
the unit Menerga AquaCond wastewater heat recovery system [15] was selected. It incorporates
patented automatic heat exchanger cleaning in order to ensure continuity of operation and low
maintenance costs. Wide series of material specifications are foreseen to prevent different forms of
acid and alkali attack. Its scheme is given on Figure 3.
Figure 3. Wastewater heat recovery unit scheme: operation (left) and heat exchanger cleaning regime (right)
Its functioning description [15] is as follows: inside the unit, wastewater passes through the inner
tubes of the heat recovery unit and into the heat pump evaporator, while the same volume of fresh
water flows through the outer pipe of the heat recovery unit and enters into the heat pump condenser.
Within the heat recovery unit, a large proportion (80-90 %) of the heat held in the wastewater is
transferred directly to the fresh water. Inside the evaporator, further heat is recovered from the
wastewater, cooling it down to approx. 8 OC, which is below the temperature of the incoming fresh
water, and is an excellent inlet temperature for Air-Conditioning, the HVAC unit chiller.
After recovering waste heat, the solar PV powered heat pump’s compression work through the
release of condensation heat in heat pump condenser, heats earlier preheated fresh water in the heat
recovery unit. Thus, wastewater heat recovery is very effective means to reduce thermal energy
consumption and increase energy efficiency of sanitary water heating installation.
Automatic flow regulation provides a constant flow rate of wastewater even under varying external
conditions e.g. reducing heat of water in wastewater tank. The wastewater heat recovery unit can also
be supplied with automatic heat exchanger cleaning (e.g. for shower water recovery Fig. 3 - right). In
order to prevent a build-up of bacteria growth and pollution by fats and soap, porous pellets are
forced through the wastewater pipework at regular intervals. The cleaning pellets detach sediment
and material building up on the heat exchanger walls. The cleaning pellets last for a long time and
can be easily replaced.
Page 6 of 25
Accep
ted
Man
uscr
ipt
6
4. PV Powered Heat Recovery Assisted Heat Pump (PV/HR&HP) System
Photovoltaic system. There are a plenty of different types of PV modules and the module type
selection depends on a number of factors, including: price from suppliers, product availability,
warranties, efficiencies, etc. The module efficiency depends primarily on the type of the cell used
(mono-Si, poly-Si, a-Si, CdTe, CIS). However, within each of these categories there are wide
variations in the module efficiency from manufacturer to manufacturer, depending on the
manufacturing processes used. PV modules performance data are to be determined by the dynamic
simulations and have to be used in sizing PV modules area.
Table 1. Photovoltaic module characteristics
For the selected PV modules characteristics (Table 1.), dynamic simulations of the solar PV system
operation have been performed and the monthly and annual sums of received and converted solar
radiation to electrical energy have been determined (see Fig. 4).
Figure 4. Monthly sums of PV produced electricity (kWh)
PV powered heat recovery assisted heat pump performance. Based on the simulations and
performance prediction results, the preliminary design has been made for the PV powered heat
recovery assisted heat pump system. Its Model encompasses PV (200 m2) and Heat Recovery
assisted Heat Pump - MPV200/HR&HP. With the reference to all calculations and determined daily
quantity of sanitary water used and waste water released, the Menerga unit 44 36.2 has been selected
with the following characteristics: water flow rate 3,6 m3/h (72 m3/h in 20 hours), compressor power
2x3,4 kW, operating power 8,96 kW, and maximum power of 20 kW. The price of the unit with the
automatic cleaner is 64.344 EUR. For the PV cost-effectiveness analysis relevant data are as follows:
PV module price 4.5 EUR/W (for power per module 110 W), and with inverter, cable etc., the
complete PV system investment is increased by 20 %). All costs values in the economic analysis
were in /10/ obtained using the final energy - grid electricity energy price - 0,057 EUR/kWh;
thermal energy –natural gas 0,03954 EUR/kWh. Determined value of the Simple Pay Back Period
(SPBP) of system has been 8.7 (relevant data are given in the Table 2).
Page 7 of 25
Accep
ted
Man
uscr
ipt
7
Table 2. SPBP calculation data
Air-conditioning with the MPV200/HR&HP cold wastewater. Table 3. presents maximum
and minimum sums of the SPA Rusanda Model’s cooling energy demand in kWh/m2in kW/m2 for
air-conditioning of indoor environment for the cooling season from June to September.
If the whole quantity (72.000 l) of cold waste water (8º C) after the heat rejection in the heat pump’s
evaporator, would be used as the ”chiller” outlet cold water, the cooling capacity of 33,5kW in 10
hours could be operational with a daily cooling effect of 335 kWh. Dividing 335 kWh and 0,61
(0.3412 to 0.8855) kWh/m2 (daily specific cooling demand estimated is the useful indoor area of 550
to 950 m2 , which could be air-conditioned with the cold wastewater. Further, calculations, according
to /10/ show that the corresponding electricity demand for air conditioning is 160 kWh daily, and
from June to September approx. 19,500 kWh (thus the amount of grid electricity substitution
utilizing the MPV200/HR&HP cold wastewater for AC would be increased by 58.5%, and its SPBP
value would be 5.4).
Table 3. Daily sums of cooling energy demand for HVAC/m2
In the preceded analysis, the used data on energy prices were given for the year 2010 (grid
electricity energy price - 0,057EUR/kWh/10/. For the current electricity price in Serbia of 0.096
EUR/kWh, SPBP would be 5.17 without AC and 3.21 with AC. When the BLCC economic
analysis is made taking into account all relevant economic parameters, the same system has the
lowest lifecycle costs, and its Payback Period is also the best - PP is 1, which means that the
investments return already in one year.
5. Global Dependence of the PV/HR&HP-AC System Cost-effectiveness
The next step in this investigation was to explore the dependence of the cost-effectiveness of the
PV/HR&HP-AC system geographically. With that aim, the Model case study building SPA Rusanda
has been virtually moved to several locations in the world (Belgrade, Moscow, Manama, Singapore
and Chicago), and detailed building’s and PV/HR&HP-AC’s system dynamic simulations have been
conducted. Obtained simulations results and calculated relevant quantities have been have been
compared. The comparison results are presented in the Table 4. It is clearly visible that the cost-

Page 8 of 25
Accep
ted
Man
uscr
ipt
8
effectiveness of the PV/HR&HP-AC’s system is remarkable high all around the world. Although
geographical conditions and solar radiation intensity and availability and related, AC loads and
electricity prices are very different, and SPBP in all locations is far better that in many other systems
and projects.
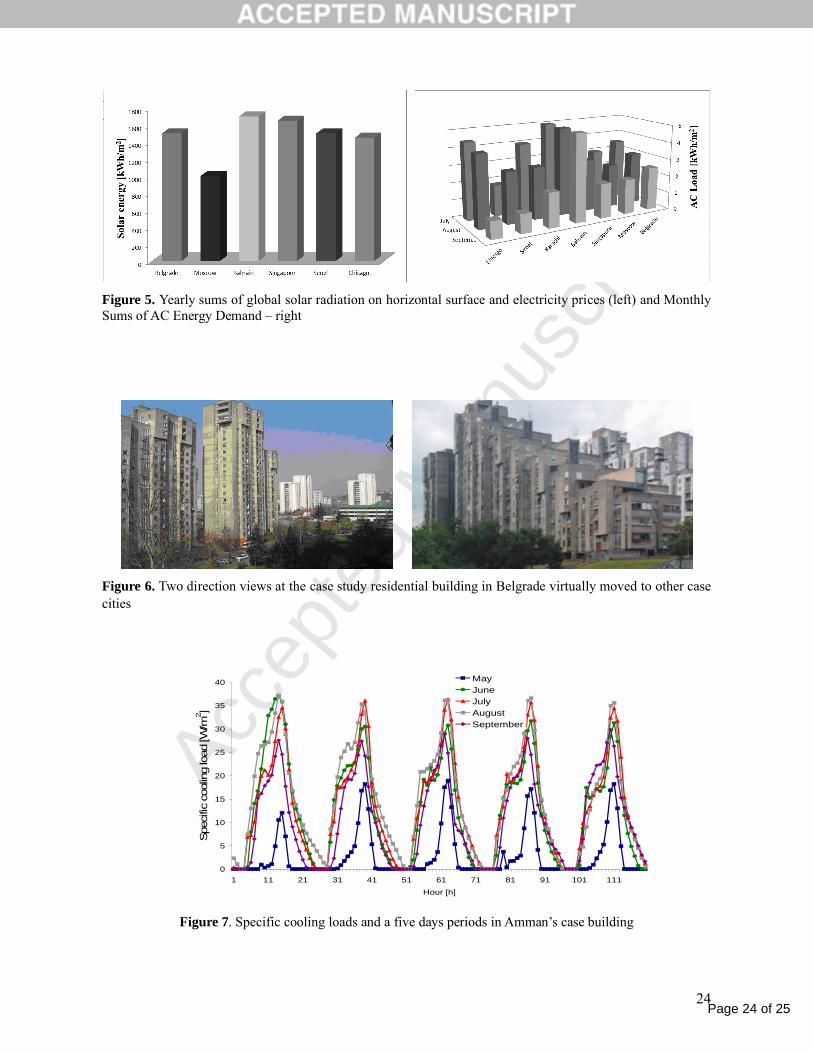
Figure 5. Yearly sums of global solar radiation on the horizontal surface and electricity prices (left) and
Monthly Sums of AC Energy Demand – right
Table 4. Global dependence of the PV/HR&HP-AC system performance data
6. Cost-effectiveness and Water Saving Importance of PV/HR&HP-AC System
To elucidate further advanced innovative PV/HR&HP-AC system’s characteristic performance in
different geographical conditions, the case study of a residential building in Belgrade has been
selected (Fig. 6) and it has been virtually moved to Amman in Jordan. It is occupied by 80 families
with the average number of three persons per family. The building’s useful or floor area is 3276 and
the total area is 3756 sq. meters. The building’s energy efficiency has been analyzed with an aim to
be “deeply” energy refurbished (which means RES integrated refurbished). Crucial for the
refurbishment project success is the understanding of solar water heating systems and AC dynamic
behavior dependence on the TMY - Typical Meteorological Year’s data, and synergetic relations
between energy efficiency, solar radiation intensity and sanitary water consumption dynamics. The
averaged, monitored summer consumption of sanitary hot water in the building is 37968 liters per
day.
Main characteristics of Jordanian environment related to the fresh water supply are: very limited
natural fresh water resources, deforestation, soil erosion and desertification. Consequently, the
gravest environmental challenge that Jordan is facing is the scarcity of water. The deficit is covered
by the unsustainable practice of overdrawing highland aquifers, resulting in lowered water tables and
declining water quality.
Figure 6. Two direction views at the case study building in Belgrade virtually moved to Amman

Page 9 of 25
Accep
ted
Man
uscr
ipt
9
Jordan is a developing non-oil producing country, where its energy requirements are obtained by
importing oil from neighboring countries ([1] - [14]) creating a financial burden on the national
economy. Jordan imports oil for all of its needs and therefore it has been vulnerable to energy supply
fluctuations. Concerning the fact that electricity demand in buildings, including households is in
intensive growth particularly in developing economies, conversion of solar energy to electrical
energy is of extremely high interest. For buildings integration, especially existing buildings (solar
integrated refurbishment), PV technologies are considered a reliable alternative to fossil fuels, as
they can be implemented in a wide range of settings.
The solar energy potential in Jordan is characterized by the average daily solar irradiation of about
5.5 kWh/m2, while the sun shines approximately 2900 hours per annum. Despite this, apart from for
heating water for some households, solar energy is scarcely being used ([1] - [14]). The South of
Jordan receives a substantial amount of annual solar radiation per unit area, with an average annual
total radiation exceeding 2,5 MWh per year per square meter, which is much more than the average
annual radiation of about 1,4 MWh/m2 on horizontal surfaces in Serbia. Building Virtual Site
Amman Airport Location Data are
Latitude: {31.59 0 N}
Longitude {35.59 0 E}
Time Zone Relative to GMT 2.00 {JRD}
Elevation 766 m
For the Amman climatic zone thermo-technical systems - HVAC systems relevant outdoor design
conditions are: for heating and HVAC system operation mode in winter:
Design air dry bulb temperature is tdb = 1C, and for cooling and HVAC system operation
mode in summer relevant data are: design air dry bulb temperature is tdb = 35.3C, and
humidity ratio is HR= 16.3 g of moisture/kg of dry air.
Water Heating Load and Waste Water Heat Recovery in Amman. Assuming that the fresh water
temperature is 14 °C, and that the design sanitary warm water temperature is to be 40°C, the
necessary heat for heating 37,968 m3 daily from 14 °C. to 40 °C is as follows [16]:
kW861147kJ41322851440186437968TTcmTTcVQ cwhwpcwhwphw .. (3)
With the reference to conducted calculations and determined daily quantity of sanitary water used
and waste water released, and available capacities of the heat recovery assisted heat pump units –
commercially available, the Unit 4436.2 has been selected with the following characteristics: water

Page 10 of 25
Accep
ted
Man
uscr
ipt
10
flow rate 3.6 m3/h (for � 38 m3/h in 10.56 hours), compressor power 2x3,4 kW, operating power 8,96
kW, and maximal power of 20 kW. The price of unit with the automatic cleaner is 64.344 EUR. For
daily 10.56 hours operation of the heat pump 94.62 kWh (the result of 8.96x10.56) is necessary,
and annually 365 times more, which amounts 34535.42 kWh [16].
Air-Conditioning Loads and PV Performance in Amman TMY. By the dynamic building
performance simulations (BPS), for virtual residential building in Amman Typical Meteorological
Year (TMY) all year round hourly values and annual dynamics of the building’s air-conditioning
loads have been predicted [16]. The five days sample is shown in Fig. 7 and in the Table 1 are given
daily maximum values of cooling loads read from the diagram given in Fig. 7. Similar dynamics and
analysis have been conducted for global solar radiation, and determined are the values of
instantaneous incident solar radiation and related portions converted to electricity (all year round -
for 8760 hours), and relevant average values have been further determined, as well as daily, monthly
and annual sums per sq. meter and for total installed PV areas.
Figure 7. Specific cooling loads in five day periods in Amman’s case building
Matching Air-conditioning and water heating loads and energy demand with PV electricity.
Dynamics of variations of incident global solar radiation and of the selected PV’s produced
electricity, in Amman’s TMY, is predicted also by the dynamic simulations. In the Table 5 are
presented relevant PV features of selected modules necessary to predict PV arrays operation and
produced electricity. For grid connecting, PV system operational and cost-effectiveness optimization
criteria are different. As in Jordan they use the feed-in tariff system for PV electricity production,
there is clear interest to analyze PV panel-arrays integration at, the as more as possible bigger area of
the available building facades appropriately oriented towards the sun.
Table 5. Selected PV modules characteristics
When the PV array is mounted on a wall, the required area should not exceed the surface available
on the wall. For building facade’s integration – building integrated PV (BIPV) arrays inclination
angle will be the same as the certain building wall inclination angle is. This seldom corresponds to

Page 11 of 25
Accep
ted
Man
uscr
ipt
11
an optimum in terms of energy production, but can reduce significantly installation costs by
eliminating the need for costly cladding and a support structure, or may be more desirable from an
aesthetics standpoint. For virtual building located in Amman have been assumed and analyzed two
characteristic sizing cases of PV arrays integration [16]:
a) Application of PV panels on the horizontal roof surface inclined by 32 degree North
b) latitude (an optimal angle for Amman’s geographic location), and sized to provide enough
power and PV electricity to run heat pump all year round.
Operational power of the selected heat recovery assisted heat pump is 8.96 kW, and for its
daily 10.56 hours operation 94.62 kWh is necessary (result of 8,96x10,56), and annually 365 times
more is necessary, which is 34535,42 kWh.
c) Specified maximum power of heat pump is 20 kW, and if autonomous regime of system is to
be foreseen, then PV arrays area is to provide the 20 kW power, when necessary.
d) Implementation of PV panels on all available surfaces, with an aim to estimate technical
potential of distributed PV electricity generation, substituting as more as possible fossil fuelled
produced grid electricity, and in addition supplying the grid with own surplus electricity: application
of PV panels on the horizontal roof, as in the case a) but using the whole available surface, and
integration in vertical façades East and West oriented, also using whole available surface areas.
Using maximally available buildings surface areas for PV installation, PV modules performance data
(Table 4) and locally relevant solar radiation data (Amman’s TMY), obtained are the values of
maximally possible installed PV power (Table 5).
Based on complete air-conditioning loads and energy demand, as well as on solar radiation and PV
electricity production data presented, defined are three Amman Case Study Models A, B, and C, and
cost-effectiveness has been analyzed for these three models - of the “PV powered solar air-
conditioning, water heating and water saving via heat recovery assisted heat pump system in
Jordan”. Dynamic simulations, for 8760 hours of Amman’s Typical Meteorological Year (TMY)
determined the values of instantaneous incident solar radiation and related portions converted to
electricity and further have been determined relevant average values, as well as daily, monthly and
annual sums of relevant quantities per sq. meter and for total installed PV areas.
In Table 5. are presented values of available areas for PV integration on differently oriented building
facades surfaces, corresponding areas of maximally possible installed PV arrays, and related installed
powers. Total installed PV arrays area is 2929,38 sq. meters, and total installed PV power amounts to

Page 12 of 25
Accep
ted
Man
uscr
ipt
12
432 kW, which corresponds to an average efficiency of 14.7%. The series of results of virtual
Amman buildings dynamic simulations are presented in Tables 5, and 6.
Table 6. Available areas, max-installed PV areas and PV power
Table 7. Monthly and daily mean AC energy demand [MWh/month] and [MWh/day]
Calculations, using maximally available buildings surface areas for PV installation, PV modules
performance data (Table 4) and locally relevant solar radiation data (Amman’s TMY), gave the
values of maximally possible installed PV power (Table 5). Based on complete air-conditioning loads
and energy demand, as well as on solar radiation and PV electricity production data (Table 7), cost-
effectiveness have been defined and analyzed for three models of the “PV powered solar air-
conditioning, water heating and water saving via heat recovery assisted heat pump system in
Jordan” for three cases - A, B and C.
Case - A. For the defined sizing case a) to operate heat pump system, daily energy demand is
94.62 kWh, monthly (case 30 days - 2838,6 kWh, and 31 days - 2933,2 kWh). Depending on the
monthly available PV electricity two extreme monthly values will determine necessary PV arrays –
December (Monthly minimal sum), and August (Monthly maximal sum). Hence necessary PV
arrays area for August is 98.6 and for December 185.9 sq. meters.
Approving acceptance of larger area will ensure PV solar sanitary water heating even in December
and air –conditioning using cold wastewater. In addition will be available certain surplus electricity
for more grid electricity substitution in households (for lighting and some of appliances, or
eventually partial space heating in less cold periods than December) or surplus can be sent to the grid.
Case – B. Use of maximally possible roof area of 308,3 sq. meters to install PV arrays, optimally
inclined, will result in installed power of 45,6 kW, and potential PV surplus for sending to the grid in
certain periods will increase.
Case – C. In this case, implementation of maximum possible PV arrays areas is on the roof surface,
and East and West oriented facades. Multiplying resulting values of produced PV electricity
(kWh/m2) with the related surface areas (m2), and summing is predicted potential annual PV
produced electrical energy amount of 535139,802 kWh in Amman’s TMY. It is the final sum of three
bolded values in Table 5 multiplied with related areas, as follows:
(294.433x308,3+106.286x1310,54+232.785x1310,54).

Page 13 of 25
Accep
ted
Man
uscr
ipt
13
Cold waste water use as the chiller water for air-conditioning. In all three cases, there is, at the
outlet of heat pump evaporator, the daily quantity of 37968 dm3 water at 8 oC. If the whole quantity
(37968 dm3) of cold waste water (8 oC) is used as ”chiller” outlet cold water, following cooling
capacities could be operational, depending on the cold waste water temperature increase (T) during
the process of heat rejection of AC air (AC air cooling) in the corresponding heat exchanger, as
follows: T=13-8=5 oC (daily cooling capacity Qdc=190 kWh; T=14-8=6 oC (daily cooling capacity
Qdc=228 kWh); T=15-8=7oC (daily cooling capacity Qdc=319 kWh); T=16-8=8 oC (daily cooling
capacity Qdc=365 kWh; T=18-8=10 oC (daily cooling capacity Qdc=456 kWh); andT=20-8=12oC
(daily cooling capacity Qdc=547 kWh).
Comparison of these results with the data given in Table 6. (monthly and daily mean AC energy
demand [MWh/month] and [MWh/day] for different indoor air temperatures – 26 oC, 28 oC and 30oC, shows that cold waste water temperature and waste water daily quantity by different temperature
increase T, enables building air-conditioning by controlling its temperature and cooling indoor
space to the significant degree.
Taking into account daily dynamics of AC loads (clearly visible in Fig. 6), implementing cold
wastewater storage (Cold Thermal Energy Storage - CTES) further optimization of indoor spaces
temperature control is possible.
Table 8. Monthly sums of incident solar radiation on PV arrays and produced electricity (kWh/m2)
Dynamic simulations results presented in Table 7. show potential renewable PV electricity
production by the same building if all available areas for PV integration would be used. In the future,
a detailed analysis is to be done of all building loads, aimed to determine which amount of the
available electricity will be a pure surplus.
7. System Investment And Operation Costs
The investment and operation cost analysis is conducted with the reference to described
simulations/calculations and determined daily quantity of sanitary water used and cold waste water
released in virtual Amman case building (capacity of the heat recovery assisted heat pump unit Type
44 36.2 [13], with relevant characteristics and price); with 0.8 EUR/installed PV Watt and grid
electricity price of 0.08 EUR /kWh, as well as Feed-in tariff electricity price in Jordan of 0,11
EUR/kWh. The results are presented in Table 8.

Page 14 of 25
Accep
ted
Man
uscr
ipt
14
Table 9. Investment and operational costs data
8. Conclusions
1. Based on the obtained results of the conducted research project in Serbia, aimed to find an
optimal way to replace imported gas with solar energy for sanitary and pool water heating, a
study has been conducted with the specific objective to determine sustainable, energy
efficient and cost-effective solution for replacing fossil fuel and electricity for water heating
and air-conditioning, particularly in the cooling regime. The study success was based on
understanding and combined measurements and by BPS made predictions of AC loads and
solar radiation dynamics as well as on determination of the synergetic relations between all
relevant quantities. Further, by the performed BPS dynamic simulations for geographically
spread buildings locations, it has been shown that the final result of the conducted scientific
engineering R&D work has been the created system of confirmed prestigious features
relevant to the sustainability – globally cost effective building integrated photovoltaic
powered heat pump (HP), assisted by waste water heat recovery, for solar AC, water heating
and saving.
Finally, a description is given for the investigation approach and results of performed dynamic
simulations of the virtual case building’s air-conditioning loads, related energy demand, available
solar global radiation and potential PV electricity production for the hydro-meteorologically relevant
TMY for Amman in Jordan. Cost-effectiveness has been defined and analyzed for three models of
the “PV powered solar air-conditioning, water heating and water saving via heat recovery assisted
heat pump system in Jordan” for three cases A, B and C.
Simple Pay Back Period SPBP of the increased investment analysis confirmed extremely high cost-
effectiveness of this inventive system. Relevant SPBP values for the three best models with the
reference to the referential case are as follows A – 0.92 less than one year B – 2.41 years and C –
5.93 years. Case A is focusing on the original - inventive system, however systems B and C also
deserve attention, as these system show how, by spread investment in distributed BIPV energy
generation, very significant, large-scale PV electricity production within urban areas can be reached,
and at the same time, deficient water sources may be saved.
REFERENCES
Page 15 of 25
Accep
ted
Man
uscr
ipt
15
[1] M. Todorovic (1988). Long Term Performances (LTP) of solar water heating systems, CNRE SWHS Workshop, published in Proceedings, Naxos, Greece, 84-96.
[2] Technology for a Sustainable Future - A Framework for Action, U.S. Environmental Technology Strategy Staff, Los Alamos National Laboratory, New Mexico, 1995.
[3] Cook P. J., D. Sheath, World Mineral Resources and some Global Environmental Issues, Nature Resources, UNESCO, pp. 26-33, 1997.
[4] M. Todorovic, Sustainability research and education via interdisciplinariness and harmony, in: International Conference on Advances in Infrastructure for Electronic Business, Science, and Education, Proceedings, No. 161, Scuola Superiore G. Reiss Romoli, 2000.
[5] VEA-INVI. Ltd, Feasibility Study With Preliminary Design For Solar Energy Utilization For Heating In Special Hospital Of The Spa Rusanda, SEEA - EAR, Belgrade, 2006.
[6] BLCC - Building Life Cycle Cost Program, National Institute of Standards and Technology (NIST).
[7] TRNSYS - TRaNsient SYstems Simulation Program, University Wisconsin.
[8] International Weather for Energy Calculations, IWEC – ASHRAE Weather files, Version 2.0.
[9] KMA – Korean Meteorological Administration, http://web.kma.go.kr/eng/index.jsp.
[10] M.Todorovic, O.Ecim and I.Zlatanovic, Building Integrated PV Air-conditioning and Water Heating in Special Hospital of the SPA Rusanda, Passive and Low Energy Cooling Conference, Creta, 2007.
[11] Building a Jordanian-Israeli Virtual Library for Renewable Energy Renewable Energy in Jordan South Jordan as a Case Study, iGREENs, 2011.
[12] Ali Sawarieh, Geothermal Water in Jordan, Workshop for Decision Makers on Direct Heating Use of Geothermal Resources in Asia, UNU-GTP, TBLRREM and TBGMED, Tianjin, China, May, 2008.
[13] Jordan Energy Situation, https://energypedia.info/index.php/Jordan_Energy_Situation, 2011.
[14] Mohammed S. Al-Soud, Eyad S. Hrayshat, A 50 MW Concentrating Solar Power Plant for Jordan, Journal of Cleaner Production, www.elsevie r. com/locate/jclepro, 2008.
[15] Heat Recovery Assisted Heat Pump Performance Data, AquaCond Waste water heat recovery unit with recuperator and heat pump, Menerga air–conditioning technology, 2012.
[16] M. Todorovic and O.Ecim Djuric, Innovative Pv Powered Solar Air - Conditioning, Water Heating And Water Saving Via Heat Recovery Assisted Heat Pump For Jordan, Jordan 4th Jordanian IIR International Conference on Refrigeration and Air Conditioning, Amman, August, 2012.
NOMENCLATURE
Q daily heat for water heating (kJ/day)
V daily water consumption (l/day)
T temperature (oC)
c specific heat(kJ/kg oC)
ρ specific density (kg/dm3)
Subscripts
hw hot water
p pressure

Page 16 of 25
Accep
ted
Man
uscr
ipt
16
cw cold water

Page 17 of 25
Accep
ted
Man
uscr
ipt
17
Table 1. Photovoltaic module characteristics
MSW 110 Modul Parameters
Power (± 5%) [W] 110 ± 5.5
Output current [A] 6.47
Output voltage [V] 17
Nominal voltage [V] 12
Short circuit current [A] 7,46
Open circuit voltage [V] 21,6
Length [mm] 1.321
Width [mm] 676
Height [mm] 38
Type of cells (p/s - pseudo square) p/s 103.5 mm cell
Configuration 72 (6x12)
Mass [kg] 10.7
Table 2. SPBP calculation data
Investment costs: 531.844 EURInvestment increase: 231.844 EURAnnual consumption of thermal energy: 389 – 718.361= 3.781.028 kWhAnnual saving of thermal energy use: 718.361 kWhValue of thermal energy saving: 28.404 EURAnnual consumption of electrical energy: 720.072 – 33.316 = 686.756 kWhPV produced electrical energy: 33.316 kWh Total annual energy costs: 201.007 EURTotal annual costs of thermal energy: 149.502 EURTotal annual costs of electrical energy: 39.145 EURAnnual maintenance costs: 270 EURAnnual value of saving energy: 215.222 – 188.646= 26.576 EURSPBP – Simple Pay Back Period of increased InvestmentSPBP = 231.844/26.576 = 8,7 year

Page 18 of 25
Accep
ted
Man
uscr
ipt
18
Table 3. Daily sums of cooling energy demand for HVAC/m2
Min Max Ave.Month
[kWh/m2]
June 0.3050 0.9761 0.6406
July 0.3548 0.9859 0.6704
August 0.3412 0.8855 0.6134
September 0.1706 0.7552 0.4629
Table 4. Global dependence of the PV/HR&HP-AC system performance data
Relevant quantity Belgrade Manama Moscow Singapore Seoul Chicago
WMO Station 132720 411500 276120 486980 471120 725340
Latitude N 44° 49‘ N 26° 16 N 55° 45‘ N 1° 22 N 37° 34' N 41° 46'
Longitude E 20° 16 E 50° 39 E 37° 37‘ E 103° 58‘ E 127° 00' W 87° 45'
GMT +1.0 Hours +3.0 Hours +3.0 Hours +8 Hours+9.0
Hours -6.0 Hours
Elevation m 99 2 156 16 86 187
Standard Pressure at Elevation Pa
100141 101301 99465 101133 100487 99099
MDB Temperature °C34.0 °C
on Jun 15
41.9 °C
on Jul 21
30.6 °C
on July 13
33.8 °C
on Apr 23
32.7°
on Jul 23
37.2
on Jul 1
MDB Temperature °C-19.0 °C on
Dec 24-10.2 °Con Jan 12
-25.2 °Con Feb 15
21.0 °Con Sep 8
-11.8 °Con Dec 16
-23.3°Jan 27
Solar energy incident in horizontal plane
annually (kWh/m2)1347,3 972,8 1705,8 1819,3 1540 1500
PV Power (W/m2) 166,58 138,1 204,1 208,1 205.3 204,6
Produced PV electricity (kWh/yr )
33316 24054 42118 41145 41060 40920
Grid elctricity price EUR/kWh
0,096 0,162 0,042 0,4762 0,498 0,0945

Page 19 of 25
Accep
ted
Man
uscr
ipt
19
Grid electricity substituted
by PV/HR&HP-AC (kWh)
52816 35364 100828 102180 64875 61380
SPBP 8,7 7,64 12,42 4,59 4,85 8,9
Table 5. Selected PV modules characteristics
Conergy PowerPlus 240P
Power (± 5%) [W] 240 ± 5.5Output current [A] 8.15Output voltage [V] 29.7
Nominal voltage [V] 26.98
Short circuit current [A] 8.62Open circuit voltage [V] 36.48Length [mm] 1651Width [mm] 986Height [mm] 46Type of cells (p/s -pseudo square) p/s 103.5mm cellConfiguration 72 (6x12)Mass [kg] 19.6
Table 6. Available areas, max-installed PV areas and PV power
Surface orientation Surface area PV modules PV area Installed power[m2] number [m2] [kW]
South 311 190 308.3 45.6East 1313.8 805 1310.54 193.2West 1313.8 805 1310.54 193.2
Table 7. Monthly and daily mean AC energy demand [MWh/month] and [MWh/day]
Indoor air26oC
Indoor air 28oC in shaded cells
Indoor air 30oC in shaded cells
MonthMonthly Daily
meanMonthly Daily
meanMonthly Daily mean
IV 4.895 0,163 4.895 0,163 4.895 0,163
V 9.702 0,312 9.702 0,312 9.702 0,312

Page 20 of 25
Accep
ted
Man
uscr
ipt
20
VI 27.150 0,905 17.770 0,592 9.786 0,326
VII 33.840 1,092 23.380 0,754 14.140 0,456
VIII 36.780 1,186 26.010 0,839 16.350 0,527
IX 26.670 0,889 17.320 0,577 9.284 0,309
X 11.960 0,359 11.960 0,359 11.960 0,359
Annual 150.997 111.037 76.117
Table 8. Monthly sums of incident solar radiation on PV arrays and produced electricity (kWh/m2)
South oriented inclined (32o) on horizontal roof surface
Positioned at vertical (90o) façade wall oriented West
Positioned at vertical (90o) façade wall oriented East
MonthSolar radiation
Produced electricity
Solar radiation
Produced electricity
Solar radiation
Produced electricity
January 126.75 18.193 37.25 5.248 85.53 12.154February 144.84 20.842 48.95 6.912 112.79 16.092March 159.3 23.026 63.68 9.052 110.14 15.753April 181.53 26.415 76.4 10.925 139.69 20.143May 188.7 27.556 81.06 11.647 145.27 21.132June 201.72 29.661 92.03 13.326 171.22 25.032July 195.71 28.893 87.87 12.782 147.15 21.642August 201.02 29.74 81.34 11.843 164.3 24.026September 190.33 28.119 63.64 9.232 161.37 23.334October 163.52 23.996 44.15 6.353 152.4 21.249November 153.05 22.211 33.79 4.794 160.28 20.734December 109.91 15.78 29.59 4.172 80.38 11.496�um 2016.38 294.433 739.75 106.286 1630.5 232.785
Table 9. Investment and operational costs data
Investment costs A B C
IC1 Heat recovery assisted heat pump (HRHP) EUR 63344 63344 63344
Installed PV watts W 20000 45600 432000
IC2 PV arrays cost for PV price 0,8 EUR/W EUR 16000 36480 345600
IC1 + IC2 79344 99824 408944
Operational annual costs A B C
HRHP system annual electricity demand kWh 34535,42 34535,42 34535,42
OC1 HRHP grid electricity use at the 0,08EUR/kWh EUR 2762,83 2762,83 2762,83
PV produced electricity
PV inst. A&B (roof 185,9&308,3), C max. avail. kWh 54735,09 90773,69 535139,8
PV produced electricity sent to grid value EUR 6020.86 9985.11 58865,38

Page 21 of 25
Accep
ted
Man
uscr
ipt
21
Feed-in profit (FIP) 3258,03 9722,28 56102,55
Referential case investment costs
IC1 Heat recovery assisted heat pump (HRHP) EUR 63344
IC2 Air cooled AC unit, cooling capacity 130kW EUR 13000
IC1 + IC2 EUR 76344
Referential case annual operational costs
OC1 HRHP grid electricity use at the 0,08EUR/kWh EUR 2762,83
Mean Air-Conditioning cooling demand kWh 111037
Air cooled AC electricity demand (COP=3,09) kWh 35934,31
OC2 Air cooled AC operation using grid electricity EUR 2874,74
OC1 + OC2 EUR 5637,57
HRHP + PV Increased investment costs (HRHP+PV) EUR 3000 23480 332600
Simple Pay Back Period HRHP+PV/FIP Year 0,92 2,41 5,93

Page 22 of 25
Accep
ted
Man
uscr
ipt
22
0
2
4
6
8
10
12
14
16
18
1 3 5 7 9 11 13 15 17 19 21 23
m3
0
1
2
3
4
5
6
7
8
9
10
1 3 5 7 9 11 13 15 17 19 21 23
m3
Figure 1. Mean daily profile (left) and daily profile with minimal daily consumption (right)
Figure 2. Conduit pipes detailed ultrasound flowrate measurement (left) data (right) at different sections
0.00
1.00
2.00
3.00
4.00
5.00
6.00
7.00
8.00
0 1000 2000 3000 4000 5000 6000 7000
m3
Paviljon 9,7,2
Paviljon 9,7,2-2
Paviljon 8
Paviljon 8 -2
Paviljon 1
Bl. terapija
Bl. terapija-2

Page 23 of 25
Accep
ted
Man
uscr
ipt
23
M
heat
reco
very
hot water 18°C
compressor
fresh water 10°C
condenser
evaporator
waste water 31°C
cleaning elements
flowrate control
waste water 18°C
M
flowratecontrol
heat
reco
very
condenser
evaporator
Figure 3. Wastewater heat recovery unit scheme: operation (left) and heat exchanger cleaning regime (right)
0.0
2000.0
4000.0
6000.0
8000.0
10000.0
12000.0
14000.0
16000.0
18000.0
20000.0
Ele
ctric
al e
nerg
y [k
Wh
]
1 2 3 4 5 6 7 8 9 10 11 12
Month
Figure 4. Monthly sums of PV produced electricity (kWh)
Page 24 of 25
Accep
ted
Man
uscr
ipt
24
Figure 5. Yearly sums of global solar radiation on horizontal surface and electricity prices (left) and Monthly Sums of AC Energy Demand – right
Figure 6. Two direction views at the case study residential building in Belgrade virtually moved to other case cities
0
5
10
15
20
25
30
35
40
1 11 21 31 41 51 61 71 81 91 101 111
Hour [h]
Spec
ific
cool
ing lo
ad
[W/m
2]
MayJuneJulyAugustSeptember
Figure 7. Specific cooling loads and a five days periods in Amman’s case building

Page 25 of 25
Accep
ted
Man
uscr
ipt
25
Highlights
Innovative multipurpose system.
With the reference to the global energy and water resources sustainability concerns created is prestigious – globally cost effective building integrated photovoltaic powered heat pump assisted by waste water heat recovery, for solar AC, water heating and saving.
Relevant dynamic analysis and optimization methodology presented.